Introduction
Histological classification and staging are crucial
for treatment selection in non-small-cell lung cancer (NSCLC).
Squamous cell carcinoma (SCC) and adenocarcinoma (AC) are the two
most common types of NSCLC. Due to their dependence on
tumor-associated structural changes, conventional imaging
modalities are inaccurate in the assessment of lymph node
metastases (1) and tumor size when
combined with obstructive pneumonia and atelectasis in NSCLC. One
of these modalities, contrast-enhanced computed tomography (CT),
has been widely used for preoperative evaluation. However,
18F-fluorodeoxyglucose positron emission tomography
(18F-FDG PET) may be more sensitive compared to CT, as
the alterations in tissue metabolism measured by PET generally
precede anatomical changes. Coregistration of PET and CT by using a
combined PET-CT system was found to be of additional value for
image interpretation. The purpose of the present study was to
investigate the predictive value of 18F-FDG PET-CT for
patients with NSCLC, compared to that of postoperative pathological
findings, for T and N staging and the associations of primary tumor
metabolic parameters with histological type and
differentiation.
Patients and methods
Patients
We retrospectively reviewed all patients with a
confirmed diagnosis of NSCLC by postoperative pathological findings
in Shandong Cancer Hospital between May, 2003 and November, 2011.
The patients were treated with lobectomy or pneumonectomy combined
with systematic mediastinal lymphadenectomy and complete data on
preoperative contrast-enhanced CT of the chest, 18F-FDG
PET-CT and postoperative pathological findings were available.
Following the standard preoperative staging procedures, including
physical examination, laboratory tests, ultrasound of the neck and
abdomen and recommendation for FDG PET-CT staging, all the patients
were found to be without distant metastasis and suitable for
operative treatment. Patients who had received prior anticancer
treatment were excluded, as were patients with diabetes mellitus
and coexistent malignant conditions. Surgical specimens that were
intact and histologically confirmed as AC or SCC were further
examined. Due to their lower incidence, other histological
subtypes, such as large-cell carcinoma, were eliminated to
homogenize the study.
The study protocol was approved by the Institutional
Review Board of Shandong Cancer Hospital. Informed consent was
waived due to the retrospective design of the study. In this
retrospective study, data from 112 patients meeting the eligibility
criteria were evaluated. The characteristics of the patients are
summarized in Table I.
 | Table IPatient characteristics. |
Table I
Patient characteristics.
| Characteristics | Cases, no. (%)
(n=112) |
|---|
| Age (years) | |
|
<60 | 96 (85.7) |
| ≥60 | 16 (14.3) |
| Gender | |
| Male | 78 (69.6) |
|
Female | 34 (30.4) |
| Tumor side | |
|
Right | 68 (60.7) |
| Left | 44 (39.3) |
| Primary tumor
location | |
| Upper
lobea | 72 (64.3) |
| Lower
lobe | 40 (35.7) |
| Surgical
procedure | |
|
Lobectomy | 92 (82.1) |
|
Bilobectomy | 14 (12.5) |
|
Pneumonectomy | 6 (5.4) |
| Histological
type | |
| Squamous
cell carcinoma | 59 (52.7) |
|
Adenocarcinoma | 53 (47.3) |
| Tumor
differentiation | |
| High | 43 (38.4) |
|
Moderate | 38 (33.9) |
| Poor | 31 (27.7) |
CT technique
All the patients included in this study underwent
preoperative multidetector CT with a 16-detector row CT scanner
(Sensation 16; Siemens, Erlangen, Germany) according to an
established protocol. Each patient was fasted for 6 h prior to
undergoing contrast-enhanced CT in the supine position with the
arms crossed overhead. Intravenous administration of 70 ml of the
iodinated contrast material iopromide (Ultravist; Bayer Schering
Pharma, Berlin, Germany), containing 300 mg iodine/ml, via power
injection at a rate of 2.5 ml/sec, was performed. The scan was
initiated at 25–30 sec after injection, at 140 kV and 230 mA with
0.75–7.0 mm section collimation, a pitch of 1.0–1.5 and 3.0 mm of
reconstruction thickness.
18F-FDG PET-CT
18F-FDG PET-CT scans were obtained with
an integrated PET-CT system (Discovery LS; GE Healthcare,
Piscataway, NJ, USA). All the patients were fasted for at least 6 h
and rested for 15 min, then injested 500 ml of water prior to the
injection of 400 MBq of the radioactive tracer
(18F-FDG). The serum glucose levels were measured to
ensure that they were <6.6 mmol/l. The patients received no
urinary bladder catheterization, no oral muscle relaxants and no CT
contrast agents. For ~60 min (range, 50–65 min) following
18F-FDG injection, the patients were reclined in a quiet
room with minimal muscular activity. The patients were then
immobilized using a custom immobilization cradle in the supine
position with the arms placed on the sides. The PET-CT system was
used for 4-slice helical CT acquisition, followed by a full-ring
dedicated PET scan of the same axial range. The CT component was
operated with an X-ray tube voltage peak of 120 kV, 90 mA, a 6:1
pitch, a slice thickness of 5 mm and a rotational speed of 0.8
sec/rotation. PET scans were obtained from the level of the middle
skull to that of the proximal thigh for 4 min/field of view, each
covering 14.5 cm, at an axial sampling thickness of 4.25 mm/slice.
Both PET and CT scans were obtained during normal tidal breathing.
The PET images were reconstructed with CT-derived attenuation
correction using ordered-subset expectation maximization software.
The attenuation-corrected PET images, CT images and fused PET-CT
images were available for review in the axial, coronal and sagittal
planes and a cine display of maximum intensity projections of the
PET data, using the manufacturer's review station (Xeleris; GE
Healthcare). The local delayed scanning was performed at ~120 min
(range, 110–140 min) following the 18F-FDG injection
when it was difficult to make a differential diagnosis between
benign and malignant lesions (dual-time-point imaging). The
acquisition parameters for the dual-time-point scan were
identical.
Analysis on imaging
Contrast-enhanced CT and PET-CT images were assessed
by two reader teams that consisted of different physicians. Each of
the evaluating teams had the same information on the patient's
clinical history. The two evaluating physician teams were blinded
to the results of the other imaging examinations and the
postoperative pathological findings.
The contrast-enhanced CT findings of each patient
were reviewed by 3 experienced radiologists. The CT images were
viewed in coronal, axial and sagittal sections, applying an
appropriate window width and window level. Lymph nodes (LNs) with a
short-axis diameter >1 cm were defined as malignant.
Furthermore, the presence of a central unenhancing area suggesting
central necrosis was considered a sign of malignancy, regardless of
the nodal size (1).
On the Xeleris station, CT, PET and fused PET-CT
images were simultaneously opened and reviewed by 3 experienced
nuclear medicine physicians and radiologists. The PET-CT images
were reviewed and interpreted by consensus, comparing and analyzing
the PET and CT images side by side, using visual observation and
semi-quantitative analysis. For visual interpretation, the findings
were considered to be positive for lesions with asymmetrically
increased FDG accumulation; they were also considered positive when
the maximum standard uptake value (SUVmax) of the region of
interest (ROI) exceeded 2.5. For dual-time-point imaging, the
SUVmax of the initial scan was SUVmaxinitial and the
SUVmax of the delayed scan was SUVmaxdelayed. The
retention index (RI) represented the percent change of
18F-FDG uptake and was calculated as follows: RI =
ΔSUVmax/SUVmaxinitial x100%, ΔSUVmax =
SUVmaxdelayed-SUVmaxinitial and RI >10%
was considered as a criterion for the diagnosis of malignancy, a
threshold that has been widely used in previous studies (2–5). In
this study, we limited metabolic tumor volume (MTV) by a fixed SUV
of 2.5, a threshold that has been widely used for diagnosis in
previous studies (6–8). All the measurements were performed on
the combined PET-CT images. The MTV was delineated on the PET
images in transaction slice by slice automatically with the SUV 2.5
isocontour. The tumor volume was then automatically calculated with
the fusion software by adding up the transverse delineations slice
by slice to a total volume. Of note, the cavity or non-avid area in
tumors, when present, was excluded as part of the MTV. Furthermore,
the SUVmax within the MTV was also automatically calculated.
Surgical procedures
Lobectomy or pneumonectomy combined with systematic
mediastinal lymphadenectomy was successfully performed by
experienced thoracic surgeons within 1 week after contrast-enhanced
CT and PET-CT imaging, including 92 cases of lobectomy and 14 cases
of bilobular lobectomy, as well as 6 cases of pneumonectomy.
According to descriptions by Naruke et al (9), Martini and Flehinger (10) and Izbicki et al (11), systematic mediastinal
lymphadenectomy was defined as removal of levels 2–4, 7–9 and 10–12
during a right thoracotomy and levels 2–9 and 10–12 during a left
thoracotomy.
T and N staging and standard of
reference
According to the newly revised American Joint
Comittee on Cancer TNM system for the classification of lung cancer
(12,13), T and N staging was performed by a
tumor board consisting of 3 radiation oncologists, who were not
involved in imaging evaluation in this study. T and N staging by
the tumor board was based on contrast-enhanced CT (CT staging),
PET-CT (PET-CT staging) and postoperative pathological findings
(standard of reference). Patients in whom the T and N stages were
overestimated were characterized as overstaged, whereas those with
underestimated T and N stages were characterized as
understaged.
Statistical analysis
The results of the imaging modalities were compared
with a reference standard provided by pathological examination of
each nodal group. PET-CT positive results were defined as true
positive (TP) when confirmed by histopathological examination as
lymph node metastases and as false positive (FP) when the
histopathological examination of the resected nodal group revealed
no evidence of metastasis. A site characterized as a negative area
was defined as true negative (TN) when the histopathological
examination of the resected nodal group revealed no metastatic
disease and as false negative (FN) when there was subsequent
histopathological proof of lymph node metastasis. The formulae for
calculating the diagnostic efficacy of contrast-enhanced CT and
PET-CT were as follows: sensitivity = TP/(TP+FN), specificity =
TN/(TN+FP), positive predictive value = TP/(TP+FP), negative
predictive value = TN/(TN+FN) and accuracy = (TP+TN)/(TP+FP+TN+FN).
Differences between the two imaging modalities were assessed using
the McNemar test with Bonferroni adjustment. Comparisons of
different continuous parameters (SUVmax and MTV) between different
groups were performed with the independent samples t-test or ANOVA.
Pearson's correlation was used to estimate the association between
MTV and SUVmax. P<0.05 was considered to indicate a
statistically significant difference. The SPSS statistical
software, version 17.0 (SPSS, Inc., Chicago,. IL, USA) was used for
the analysis.
Results
Overall staging
Among the 112 patients, PET-CT staging was
consistent with pathological staging in 102 cases. The accuracy of
overall staging was 91.1%, while that of contrast-enhanced CT
staging was 69.6%. The difference in the accuracy of overall
staging between contrast-enhanced CT and PET-CT was statistically
significant (P=0.000).
T staging
T staging was accurately determined in 104 of the
112 patients (92.9%) with PET-CT (overstaging in 6 and understaging
in 2 cases). CT correctly assessed 86 cases (76.8%) (overstaging in
18 and understaging in 5 cases). The difference in the accuracy of
T staging between contrast-enhanced CT and PET-CT was statistically
significant (P=0.001).
The overall staging and T staging by
contrast-enhanced CT, FDG PET-CT and postoperative pathological
findings are shown in Table
II.
| Table IIComparison of staging results by
different imaging modalities and postoperative pathological
findings. |
Table II
Comparison of staging results by
different imaging modalities and postoperative pathological
findings.
| A, Overall staging by
contrast-enhanced CT, FDG PET-CT and postoperative pathological
findings |
|
| Results, no. of cases
(n=112) |
|
|
| Stages | Contrast-enhanced
CT | FDG PET-CT | Postoperative
pathological findings |
|
| Ia | 15 | 12 | 12 |
| Ib | 16 | 15 | 13 |
| IIA | 28 | 25 | 22 |
| IIB | 33 | 26 | 28 |
| IIIA | 20 | 34 | 37 |
|
| B, True positive and
false negative results in overall staging by contrast-enhanced CT
and FDG PET-CT |
|
| FDG PET-CT | |
|
| |
| Contrast-enhanced
CT | True (+) | False (-) | Total |
|
| True (+) | 75 | 3 | 78 |
| False (-) | 27 | 7 | 34 |
| Total | 102 | 10 | 112 |
|
| C, True positive and
false negative results in T staging by contrast-enhanced CT and FDG
PET-CT |
|
| FDG PET-CT | |
|
| |
| Contrast-enhanced
CT | True (+) | False (-) | Total |
|
| True (+) | 86 | 3 | 89 |
| False (-) | 18 | 5 | 23 |
| Total | 104 | 8 | 112 |
N staging
A total of 812 regional LNs were resected from all
the patients and 266 were confirmed to be metastatic by
postoperative pathological examination. A total of 282 regional LNs
were identified as metastatic by PET-CT, including 244 TP and 38
FP. The sensitivity, specificity, positive predictive value,
negative predictive value and accuracy of regional lymph node
metastasis detection were 91.7, 93.0, 86.5, 95.8 and 92.6%,
respectively, with PET-CT; and 71.3, 77.2, 60.6, 84.5 and 75.2%,
respectively, with contrast-enhanced CT (Table III). The difference in the
accuracy of N staging between contrast-enhanced CT and PET-CT was
statistically significant (P=0.000).
| Table IIIResults of lymph node metastasis
detection with different imaging modalities. |
Table III
Results of lymph node metastasis
detection with different imaging modalities.
| No. of lymph nodes
(n=812) | Value (%) |
|---|
|
|
|
|---|
| Imaging
modality | TP | FP | TN | FN | Sen | Spe | PPV | NPV | Acc |
|---|
| Contrast-enhanced
CT | 189 | 124 | 422 | 77 | 71.3 | 77.2 | 60.6 | 84.5 | 75.2 |
| FDG PET-CT | 244 | 38 | 508 | 22 | 91.7 | 93.0 | 86.5 | 95.8 | 92.6 |
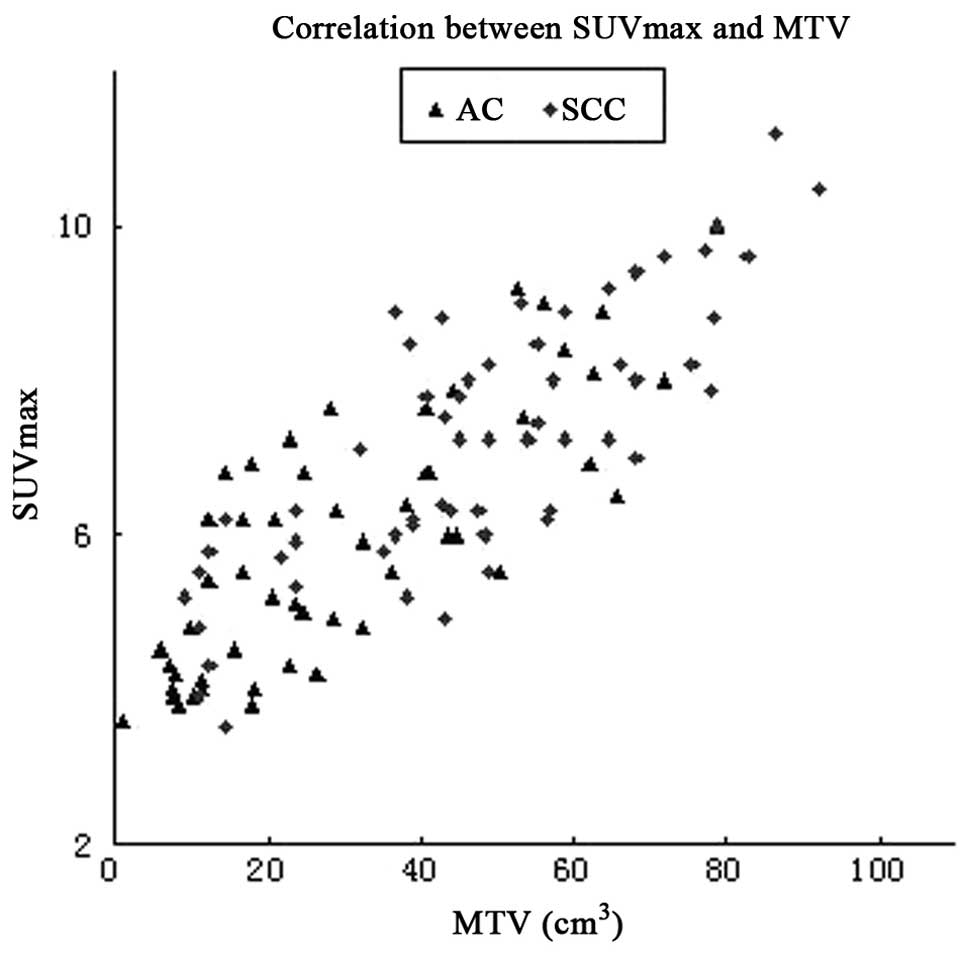
Metabolic parameters
The present study demonstrated the average values
for SUVmax (7.28±1.84 vs. 5.91±1.65, t=4.13, P=0.000) and MTV
(48.20±22.47 cm3 vs. 30.21±19.72 cm3, t=4.48,
P=0.000) were significantly higher for SCC compared to AC. There
was a positive correlation between the MTV and SUVmax of the
primary tumor (Pearson's r=0.838, P=0.000) (Fig. 1). Significant differences were
observed among different differentiation subgroups in the SUVmax
and MTV of the primary tumor for both SCC and AC (Table IV).
| Table IVMTV and SUVmax by differentiation and
histological subgroup (mean ± SD). |
Table IV
MTV and SUVmax by differentiation and
histological subgroup (mean ± SD).
| SUVmax | MTV
(cm3) |
|---|
|
|
|
|---|
| Group | All | SCC | AC | All | SCC | AC |
|---|
| 1a | 5.29±1.10 | 5.75±1.06 | 4.80±1.00 | 23.57±15.97 | 31.45±17.17 | 14.52±7.83 |
| 2b | 6.56±1.37 | 7.27±1.00 | 5.81±1.19 | 39.36±16.51 | 49.04±14.01 | 30.64±13.65 |
| 3c | 8.59±1.56 | 9.27±1.29 | 7.79±1.42 | 62.43±18.72 | 68.74±17.81 | 53.69±16.86 |
| P-value | <0.05 | <0.05 | <0.05 | <0.05 | <0.05 | <0.05 |
Discussion
Our results demonstrated that 18F-FDG
PET-CT was superior to contrast-enhanced CT, which has been widely
used for clinical staging, for T and N staging in NSCLC
patients.
As regards T staging, the difference in the accuracy
of T staging between contrast-enhanced CT and PET-CT was found to
be statistically significant (P=0.000). In a number of NSCLC cases,
lesions were identified on CT, including tumor, obstructive
pneumonia and atelectasis. However, due to limitations inherent to
morphological imaging, CT is frequently compromised by its
inability to differentiate viable tumor from adjacent structures,
e.g., obstructive pneumonia, atelectasis, chest wall (including
superior sulcus tumors), diaphragm, mediastinal pleura and parietal
pericardium. FDG PET may be successfully used to identify the
metabolic characteristics of the lesions, which are equivocal or
even not identified by CT in the majority of the cases.
As regards N staging, FDG PET-CT was also found to
be superior to contrast-enhanced CT in the detection and
characterization of mediastinal and hilar lymph node metastases. In
the present study, the sensitivity, specificity, positive
predictive value, negative predictive value and accuracy of
regional lymph node metastasis detection were 91.7, 93.0, 86.5,
95.8 and 92.6%, respectively, with PET-CT; and 71.3, 77.2, 60.6,
84.5 and 75.2%, respectively, with contrast-enhanced CT. For PET-CT
imaging, FN interpretations of 22 mediastinal and hilar lymph node
metastases were primarily attributable to intense tracer
accumulation by the primary tumor, limited resolution and
ill-defined anatomic boundaries due to respiratory movement or
limited microscopic invasion of the LNs; the FP results of 38
regional lymph node metastases were due to reactive lymphadenitis,
particularly in patients with obstructive pneumonia, atelectasis
and chronic pulmonary disease. The performance of CT in this
application was limited, primarily by size criteria: nodes >10
mm in the smallest diameter are suspected of involvement by NSCLC.
The limitations of this size-based nodal characterization are well
documented, as up to 21% of nodes <10 mm are malignant, whereas
40% of nodes >10 mm are benign (14,15).
In the present study, PET-CT was characterized by a 95.8% negative
predictive value in the detection of regional LNs. These data
conformed with the results of previous studies, which demonstrated
negative predictive values of up to 94–96% (14,15).
As was demonstrated by Antoch et al (14), a diagnosis of N0 disease with
PET-CT does not require additional verification with mediastinal
lymph node mapping. Although the positive predictive value of
PET-CT (86.5%) was higher compared to that of contrast-enhanced CT
(60.6%), the differentiation between malignancy and increased
glucose metabolism caused by an inflammatory lymph node reaction
remains challenging. In certain cases, benign conditions, such as
inflammatory lesions, may also display a higher radioactivity
uptake and the value of SUVmax may exceed 2.5; however, the
combination of CT findings, e.g., morphological characteristics,
density, distribution with delayed-phase PET findings, e.g.,
changes in the degree of radioactive uptake, may be helpful in
differentiating between malignant and benign lesions, as was
reported by our center (16).
In the present study, comparisons were conducted
between different histological subtypes for MTV and SUVmax. The
results revealed an association between metabolic parameters and
the histopathology of the primary tumor, as the SUVmax and MTV were
significantly higher in SCC compared to those in AC. This
observation is in line with the results of previous studies
(17,18). It was previously reported that a
higher FDG uptake correlates with more rapid lung cancer cell
proliferation and a reduced tumor doubling time (19). Furthermore, the tumor volume is
also an important factor contributing to FDG uptake. The present
study also demonstrated a correlation between the MTV of the
primary tumor and the degree of FDG accumulation (SUVmax) in both
AC and SCC. These findings may partly explain the higher SUVmax in
SCC compared to AC patients in our study.
In addition, the uptake of FDG in the primary tumor
reflects some biological information, including proliferative
activity (20), tumor doubling
time (21), microvessel density
(22), histological subtype
(17,18) and tumor grading (17). In the present study, the FDG uptake
and MTV of the primary tumor were significantly different among
subgroups by differentiation in both AC and SCC. This finding is
consistent with the hypothesis that the glucose metabolism measured
by FDG-PET may vary proportionately with the proliferative activity
of the tumor cells, which, in turn, is known to correlate with
tumor aggressiveness. All these findings may contribute to the
association between FDG uptake, biological aggressiveness and
prognosis in NSCLC cases.
There were several limitations to the present study,
including the retrospective nature of the study design, the
relatively low number of patients in our cohort and the
heterogeneity of the patients and treatments. In particular, SUV
2.5 was used to define the contouring margins around the target
lesions as a fixed threshold. Nonetheless, SUV may be affected by
several factors (23,24) and we acknowledge that the optimal
threshold may vary depending on the PET center and tumor
characteristics. Therefore, we aim to continue our study to enroll
more patients, as confirmation as well as for future subgroup
analysis.
In conclusion, the effect of PET-CT on clinical
staging of NSCLC was significant. Whole-body 18F-FDG
PET-CT appears to be a precise, highly efficient and non-invasive
method for T and N staging in patients with NSCLC, due to its
higher sensitivity, specificity and accuracy compared to
contrast-enhanced CT, the most widely used method for staging
evaluation. Therefore, 18F-FDG PET-CT is an important
compensatory staging measure. The FDG uptake of the primary tumor
was associated with histological type and differentiation and the
differences were statistically significant. Therefore, the SUVmax
and MTV of the primary tumor may be valuable indices to partly
predict the histological type and the grade of differentiation of
NSCLC.
References
|
1
|
Antoch G, Saoudi N, Kuehl H, et al:
Accuracy of whole-body dual-modality
fluorine-18-2-fluoro-2-deoxy-D-glucose positron emission tomography
and computed tomography (FDG-PET/CT) for tumor staging in solid
tumors: comparison with CT and PET. J Clin Oncol. 22:4357–4368.
2004. View Article : Google Scholar
|
|
2
|
MacDonald K, Searle J and Lyburn I: The
role of dual time point FDG PET imaging in the evaluation of
solitary pulmonary nodules with an initial standard uptake value
less than 2.5. Clin Radiol. 66:244–250. 2011. View Article : Google Scholar : PubMed/NCBI
|
|
3
|
Shum WY, Hsieh TC, Yeh JJ, et al: Clinical
usefulness of dual-time FDG PET-CT in assessment of esophageal
squamous cell carcinoma. Eur J Radiol. 81:1024–1028. 2012.
View Article : Google Scholar : PubMed/NCBI
|
|
4
|
Xiu Y, Bhutani C, Dhurairaj T, et al:
Dual-time point FDG PET imaging in the evaluation of pulmonary
nodules with minimally increased metabolic activity. Clin Nucl Med.
32:101–105. 2007. View Article : Google Scholar : PubMed/NCBI
|
|
5
|
Hu Q, Wang W, Zhong X, et al:
Dual-time-point FDG PET for the evaluation of locoregional lymph
nodes in thoracic esophageal squamous cell cancer. Eur J Radiol.
70:320–324. 2009. View Article : Google Scholar : PubMed/NCBI
|
|
6
|
Hong R, Halama J, Bova D, Sethi A and
Emami B: Correlation of PET standard uptake value and CT
window-level thresholds for target delineation in CT-based
radiation treatment planning. Int J Radiat Oncol Biol Phys.
67:720–726. 2007. View Article : Google Scholar : PubMed/NCBI
|
|
7
|
Leong T, Everitt C, Yuen K, et al: A
prospective study to evaluate the impact of FDG-PET on CT-based
radiotherapy treatment planning for oesophageal cancer. Radiother
Oncol. 78:254–261. 2006. View Article : Google Scholar : PubMed/NCBI
|
|
8
|
Zhu D, Ma T, Niu Z, et al: Prognostic
significance of metabolic parameters measured by
18F-fluorodeoxyglucose positron emission tomography/computed
tomography in patients with small cell lung cancer. Lung Cancer.
73:332–337. 2011. View Article : Google Scholar
|
|
9
|
Naruke T, Suemasu K and Ishikawa S:
Surgical treatment for lung cancer with metastasis to mediastinal
lymph nodes. J Thorac Cardiovasc Surg. 71:279–285. 1976.PubMed/NCBI
|
|
10
|
Martini N and Flehinger BJ: The role of
surgery in N2 lung cancer. Surg Clin North Am. 67:1037–1049.
1987.PubMed/NCBI
|
|
11
|
Izbicki JR, Thetter O, Habekost M, et al:
Radical systematic mediastinal lymphadenectomy in non-small cell
lung cancer: a randomized controlled trial. Br J Surg. 81:229–235.
1994. View Article : Google Scholar : PubMed/NCBI
|
|
12
|
Tsim S, O'Dowd CA, Milroy R and Davidson
S: Staging of non-small cell lung cancer (NSCLC): a review. Respir
Med. 104:1767–1774. 2010. View Article : Google Scholar : PubMed/NCBI
|
|
13
|
Wrona A and Jassem J: The new TNM
classification in lung cancer. Pneumonol Alergol Pol. 78:407–417.
2010.(In Polish).
|
|
14
|
Antoch G, Stattaus J, Nemat AT, et al:
Non-small cell lung cancer: dual-modality PET/CT in preoperative
staging. Radiology. 229:526–533. 2003. View Article : Google Scholar : PubMed/NCBI
|
|
15
|
Dwamena BA, Sonnad SS, Angobaldo JO and
Wahl RL: Metastases from non-small cell lung cancer: mediastinal
staging in the 1990s-meta-analytic comparison of PET and CT.
Radiology. 213:530–536. 1999. View Article : Google Scholar : PubMed/NCBI
|
|
16
|
Hu M, Han A, Xing L, et al: Value of
dual-time-point FDG PET/CT for mediastinal nodal staging in
non-small-cell lung cancer patients with lung comorbidity. Clin
Nucl Med. 36:429–433. 2011. View Article : Google Scholar : PubMed/NCBI
|
|
17
|
de Geus-Oei LF, van Krieken JH, Aliredjo
RP, et al: Biological correlates of FDG uptake in non-small cell
lung cancer. Lung Cancer. 55:79–87. 2007.PubMed/NCBI
|
|
18
|
Li M, Liu N, Hu M, et al: Relationship
between primary tumor fluorodeoxyglucose uptake and nodal or
distant metastases at presentation in T1 stage non-small cell lung
cancer. Lung Cancer. 63:383–386. 2009. View Article : Google Scholar
|
|
19
|
Higashi K, Ueda Y, Yagishita M, et al: FDG
PET measurement of the proliferative potential of non-small cell
lung cancer. J Nucl Med. 41:85–92. 2000.PubMed/NCBI
|
|
20
|
Higashi K, Ueda Y, Ayabe K, et al: FDG PET
in the evaluation of the aggressiveness of pulmonary
adenocarcinoma: correlation with histopathological features. Nucl
Med Commun. 21:707–714. 2000. View Article : Google Scholar : PubMed/NCBI
|
|
21
|
Duhaylongsod FG, Lowe VJ, Jr Patz EF ,
Vaughn AL, Coleman RE and Wolfe WG: Lung tumor growth correlates
with glucose metabolism measured by fluoride-18 fluorodeoxyglucose
positron emission tomography. Ann Thorac Surg. 60:1348–1352. 1995.
View Article : Google Scholar
|
|
22
|
Guo J, Higashi K, Ueda Y, et al:
Microvessel density: correlation with 18F-FDG uptake and prognostic
impact in lung adenocarcinomas. J Nucl Med. 47:419–425.
2006.PubMed/NCBI
|
|
23
|
Boellaard R, Krak NC, Hoekstra OS and
Lammertsma AA: Effects of noise, image resolution, and ROI
definition on the accuracy of standard uptake values: a simulation
study. J Nucl Med. 45:1519–1527. 2004.PubMed/NCBI
|
|
24
|
Westerterp M, Pruim J, Oyen W, et al:
Quantification of FDG PET studies using standardised uptake values
in multi-centre trials: effects of image reconstruction, resolution
and ROI definition parameters. Eur J Nucl Med Mol Imaging.
34:392–404. 2007. View Article : Google Scholar
|