Introduction
Low muscle mass, also known as sarcopenia (1), is of interest and importance in
oncology due to its known association with prognosis and toxicities
in a variety of cancer types (2–5) and
cancer drugs (6–9). Sarcopenia forms an important component
in the definition of cancer cachexia (10).
The phosphoinositide 3-kinase (PI3K)/protein kinase
B (AKT)/mammalian target of rapamycin (mTOR) pathway has a key role
in activating skeletal muscle synthesis via various stimuli
(11,12). According to in vivo
experiments, upregulation of this pathway leads to muscle
hypertrophy, whereas the genetic blockade of this pathway blocks
hypertrophy (11,12). Therefore, inhibition of this pathway
might lead to loss of muscle mass in patients who receive an mTOR
inhibitor for cancer treatment. In fact, the finding of sarcopenia
has already been demonstrated with the use of the multi-kinase
inhibitor, sorafenib, presumably due to downstream suppression of
PI3K, AKT and mTOR (13).
Surprisingly, however, the muscle mass increased on treatment with
the mitogen-activated extracellular signal-related kinase kinase
inhibitor, selumetinib (14), and
the tyrosine kinase inhibitor, vandetanib (9). To the best of our knowledge, no reports
have been previously published on the significant changes in muscle
area with the long-term use of mTOR inhibitors, such as everolimus
and temsirolimus. As mTOR inhibitors are now being widely used for
a wide variety of conditions, including renal cell cancer, breast
cancer and pancreatic neuroendocrine tumors among others,
information on whether the use of mTOR inhibitors induces
sarcopenia is gaining importance. Hence, the aim of the present
study was to examine the effect of mTOR inhibitors on muscle
mass.
The primary objective of the present study was to
assess the change in muscle mass during the long-term (at least 6
months) use of mTOR inhibitors. The secondary objectives were to
assess the other parameters of body composition, as well as to
investigate whether the time to treatment failure (TTF) differed
between the sarcopenic and non-sarcopenic patients at the baseline.
Although it is now known that the assessment of body weight or the
body mass index (BMI) is not able to reliably predict the loss of
muscle mass, it has yet to be elucidated whether serum albumin and
serum C-reactive protein (CRP), markers of nutrition and
inflammation, are able to be used as predictors of the alteration
in muscle mass. Hence, the levels of serum albumin and CRP as
markers of cancer cachexia were also assessed in the present
study.
Materials and methods
Retrospective analysis
This is a retrospective study performed in two
institutions of Nagoya, Japan: The Nagoya University Hospital and
the Japanese Red Cross Nagoya Daiichi Hospital. The eligibility
criteria for inclusion in the present study were: Patients who had
taken everolimus or temsirolimus as a single drug therapy for at
least 6 months (dose-skipping due to side effects allowed) and who
had computerized tomography (CT) scans of the abdomen at the level
of the third lumbar vertebrae (L3) available at within ±1 month
from the date of starting the drug therapy, and within 1 month of
having received the drug for at least 6 months. Data from between
June 2010 and October 2015 were accessed. Approval was received
from the Institutional Review Board of the two hospitals prior to
performing the study.
Body composition measurement
Body weight and height were obtained from the
medical chart. BMI was measured using the formula: Weight in
kg/(height in m)2. CT scans of the abdomen at the
baseline and following at least 6 months of therapy were obtained
from the electronic database. The L3 level slice was identified,
body composition parameters were measured in two slices of the CT
scan starting from the L3 level downwards, and averages of the
values of the two were determined, as previously described
(13,15). Body composition was measured using
the software sliceOmatic version 5.0 (TomoVision, Inc., Magog, QC,
Canada). The L3 level was chosen as it is a validated marker for
body composition analysis, including skeletal muscle and adipose
tissue (16,17). Subcutaneous adipose tissue (SAT),
visceral adipose tissue (VAT) and skeletal muscle tissue (SMT) at
the L3 level were identified using the CT Hounsfield units of: −190
to −30 for SAT; −150 to −50 for VAT; and −29 to +150 for SMT, as
previously described (13). The
muscles identified in the L3 region were psoas, paraspinal muscles
(erector spinae, quadratus lumborum) and abdominal wall muscles
(transversus abdominis, external and internal obliques, rectus
abdominis). The areas (in cm2) of the SAT, VAT and SMT
were provided by the software. Total adipose tissue (TAT) was
calculated as SAT + VAT. The values of the areas obtained for SAT,
VAT, TAT and SMT were subsequently adjusted for body height by
dividing the area by the square of the body height
(cm2/m2). The SMT area thus adjusted for body
height is known as the L3 skeletal muscle index (SMI), and this is
a validated parameter for the assessment of sarcopenia (10,15).
Lean body mass (LBM) was also calculated using the formula: LBM
(kg) = 0.30 × (SMT area at L3 in CT in cm2) + 6.06
(16). Sarcopenia was defined as SMI
≤38.5 cm2/m2 for females and ≤52.4
cm2/m2 for males, using the definition of
Prado et al (15) to study
the incidence of sarcopenia in our population. Since this
definition has not been validated for the Japanese population, the
gender-specific median SMI of our study population was used instead
as the cut-off for sarcopenia.
Serum albumin and CRP values were also obtained at
dates corresponding to the CT scans to investigate their potential
role in predicting the loss of muscle mass.
Statistical analysis
The mean values for various parameters were
calculated at the baseline and following the use of the mTOR
inhibitor, and the differences were examined for statistical
significance using a paired t-test. Furthermore, to account
for the variation in the duration of scan intervals, as well as to
find the rate of the change in body composition parameters, the
differences in body parameters were converted in terms of 180 days
(6 months) by using the formula: (Change in parameter/no. of days
between scans) ×180; this difference was assessed for significance
using a one-sample t-test.
The association of each body parameter with a change
in L3 index was evaluated with bivariate analysis using Pearson's
correlation coefficient, and the significance was examined using a
two-tailed test. TTF was defined as the time from the start of
taking the mTOR inhibitor to the time of stoppage of drug use, due
to adverse events, disease progression or mortality, depending on
whichever occurred first. The TTF was calculated and compared
between sarcopenic and non-sarcopenic patients at the baseline
using the Kaplan-Meier method and the log-rank test. The
correlations between TTF and various parameters were examined using
univariable Cox regression analyses. All P-values were two-sided,
and P<0.05 was taken to indicate a statistically significant
value. All the statistical analyses were performed using SPSS
software, version 22.0 (IBM SPSS, Armonk, NY, USA).
Results
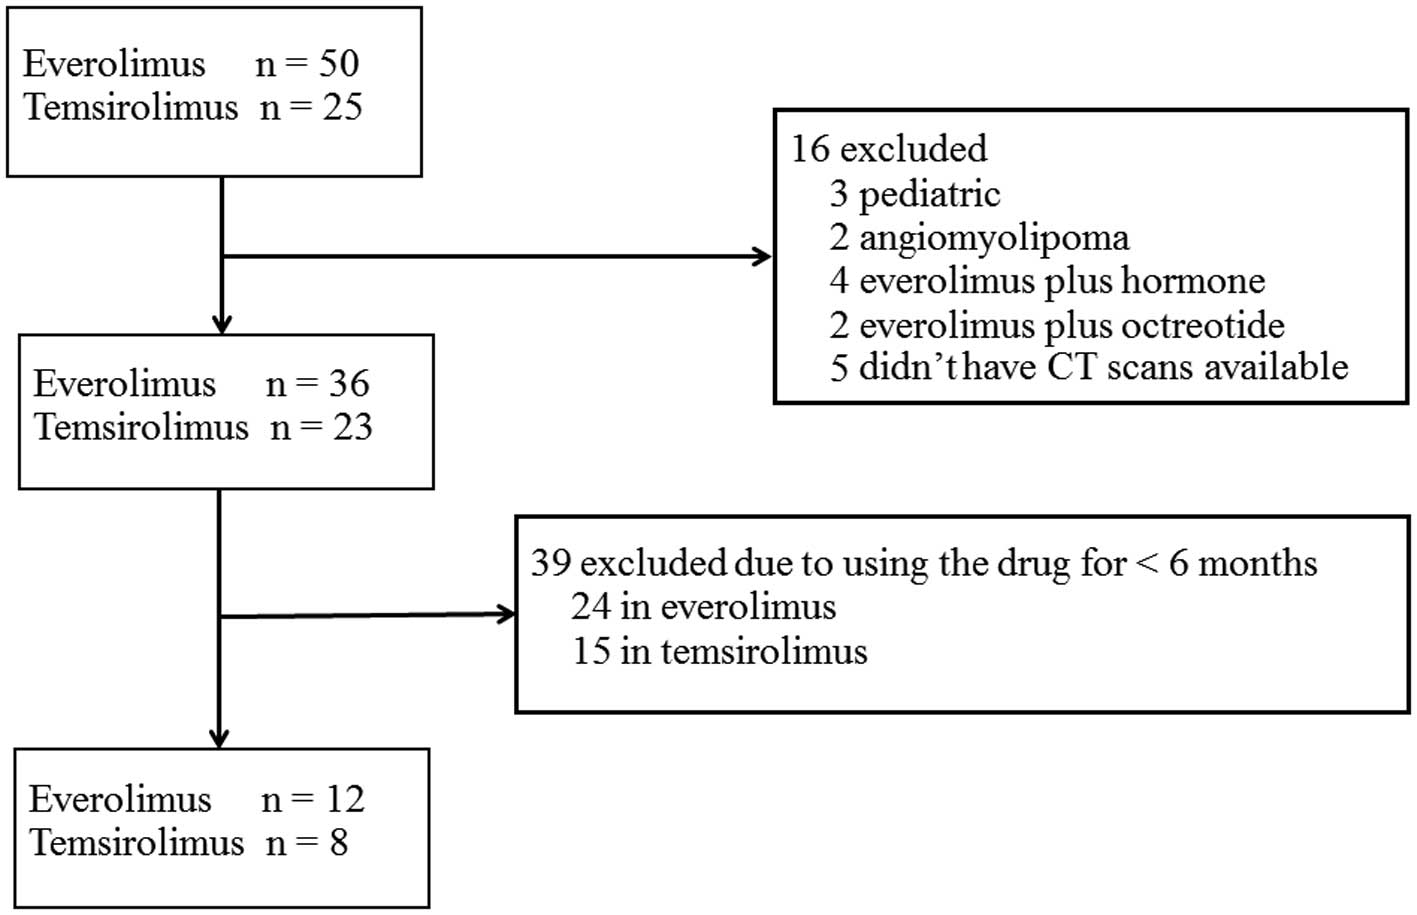
Among a total of 75 patients who had received mTOR
inhibitor therapy during the specified period, 20 met the inclusion
criteria and were included in the present study (Fig. 1). Pediatric patients were excluded,
since their skeletal muscle mass cannot be compared with that of
adults, whereas patients with angiomyolipoma were also excluded
since their skeletal muscles were entirely compressed by the
excessive volume of the tumor at the L3 level, which rendered any
muscle area assessment using CT scans obsolete. Patients with
breast cancer on everolimus + hormone therapy, and patients with
pancreatic neuroendocrine tumors on everolimus + octreotide, were
excluded as the influence of everolimus alone on body composition
could not be definitively ascertained.
The mean duration of mTOR inhibitor use was 14.1±2.1
months, and the mean duration between the first and final CT scans
was 14.4±2.0 months. All patients had metastatic renal cell
carcinoma, with the exception of two who had metastatic pancreatic
neuroendocrine tumors. None of the patients were obese; by
contrast, five of them (25%) were underweight (BMI <18.5
kg/m2; Table I).
 | Table I.Patient characteristics. |
Table I.
Patient characteristics.
| Parameter | Value | Percentage (%) |
|---|
| Total no. of
patients | 20 |
|
| Drug use |
|
|
|
Everolimus alone | 12 | 60 |
|
Temsirolimus alone | 8 | 40 |
| Disease |
|
|
| Renal
cell carcinoma | 18 | 90 |
|
Pancreatic neuroendocrine
tumor | 2 | 10 |
| Gender |
|
|
| Male | 16 | 80 |
|
Female | 4 | 20 |
| Age in years
(median) | 65.5 (45–83) |
|
| Duration of therapy
in months (mean) | 14.1±2.1 |
|
| CT interval in months
(mean) | 14.4±2.0 |
|
| Baseline BMI category
(kg/m2) |
|
|
| Normal
(18.5–24.9) | 13 | 65 |
|
Underweight (<18.5) | 5 | 25 |
|
Overweight (25.0–29.9) | 2 | 10 |
| Patients with
baseline sarcopeniaa | 12 (underweight = 4;
normal BMI = 8) | 60 |
| Patients with
sarcopenia post-treatmenta | 15 | 75 |
| Median baseline L3
index (in cm2/m2) | 50.5 for males |
|
|
| 30.5 for
females |
|
Effect of the long-term use of mTOR
inhibitors on body composition parameters and TTF
A total of 16 patients (80%) suffered a loss of the
SMT area, SMI and LBM following at least 6 months of drug use
compared with the baseline. A gain in body weight was observed in
nine patients, although seven of them suffered loss of muscle
despite gaining body weight. The number of sarcopenic patients
increased post-therapy (75%) compared with the baseline (60%;
Table I).
The decrease in body weight was marginal, and not
significant. The indices for SAT, VAT and TAT increased
post-treatment compared with the baseline, although this increment
was not statistically significant (Table II). The parameters SMT area, SMI and
LBM all decreased significantly following treatment: For the SMT
area, the mean decrease was 12.6 cm2 [P=0.011, 95%
confidence interval (CI) for decrease in mean area, 3.3 to 22.0],
for SMI, the mean decrease was 6.3 cm2/m2
(P=0.022; 95% CI for decrease in mean index, 1.0 to 11.7) and for
LBM, the mean decrease was 4.1 kg, (P=0.007, 95% CI for decrease in
mean mass, 1.3 to 6.9). The rate of decrease in SMI was 2.6
cm2/m2 (P=0.022) in 6 months (180 days). LBM
decreased by 2.3 kg (P=0.016) in 6 months. The level of serum
albumin decreased, and CRP increased, following the drug use
compared with the baseline, although the differences were not
significant.
| Table II.Effect of long-term mTOR inhibitors on
the mean body composition parameters. |
Table II.
Effect of long-term mTOR inhibitors on
the mean body composition parameters.
| Parameter | Prior to the start of
the treatment | Following at least 6
months of treatment | Difference | 95% confidence
interval | P-value |
|---|
| Body weight
(kg) |
55.5 |
54.4 | −1.0 | −2.9 to 0.8 | 0.262 |
| SAT index
(cm2/m2) |
35.1 |
36.4 |
1.3 | −6.3 to 8.8 | 0.722 |
| VAT index
(cm2/m2) |
31.5 |
43.8 | 12.3 | −0.2 to 24.7 | 0.053 |
| TAT index
(cm2/m2) |
66.6 |
80.2 | 13.6 | −6.0 to 33.1 | 0.163 |
| SMT area at
(cm2) | 137.3 | 124.6 | −12.6 | −22.0 to −3.3 | 0.011a |
| SMI
(cm2/m2) |
50.2 |
43.8 |
−6.3 | −11.7 to −1.0 | 0.022a |
| Lean body mass
(kg) |
47.2 |
43.1 |
−4.1 | −6.9 to −1.3 | 0.007a |
| Serum albumin
(g/dl) |
3.7 |
3.5 |
−0.3 | −0.6 to 0.0 | 0.091 |
| CRP (mg/dl) |
2.8 |
5.3 |
2.5 | −0.6 to 5.5 | 0.105 |
| Mean of rate of
change per 180 days |
|
| SMI
(cm2/m2) |
|
|
−2.6 | −4.9 to −0.4 | 0.022a |
| Lean
body mass (kg) |
|
|
−2.3 | −4.2 to −0.5 | 0.016a |
Association of muscle loss with
various parameters
The extent of the decrease in SMI was examined
quantitatively in terms of correlation with various parameters, as
shown in Table III. The only
significant association was with the baseline SMI; that is, the
lower the baseline SMI, the less the decrease in muscle mass.
However, the changes in L3 index did not correlate significantly
with the duration of drug use.
| Table III.Correlation of the changes in L3
index with various parameters. |
Table III.
Correlation of the changes in L3
index with various parameters.
|
| Pearson correlation
coefficient | P-value |
|---|
| Baseline BMI | −0.2 | 0.292 |
| Baseline SMI |
0.5 | 0.023 |
| Duration of
therapy |
−0.04 | 0.855 |
| Age |
0.15 | 0.539 |
| Gender |
0.260 | 0.268 |
| Change in: |
|
|
| BW |
0.1 | 0.721 |
| Serum
albumin | −0.1 | 0.674 |
|
CRP |
0.3 | 0.229 |
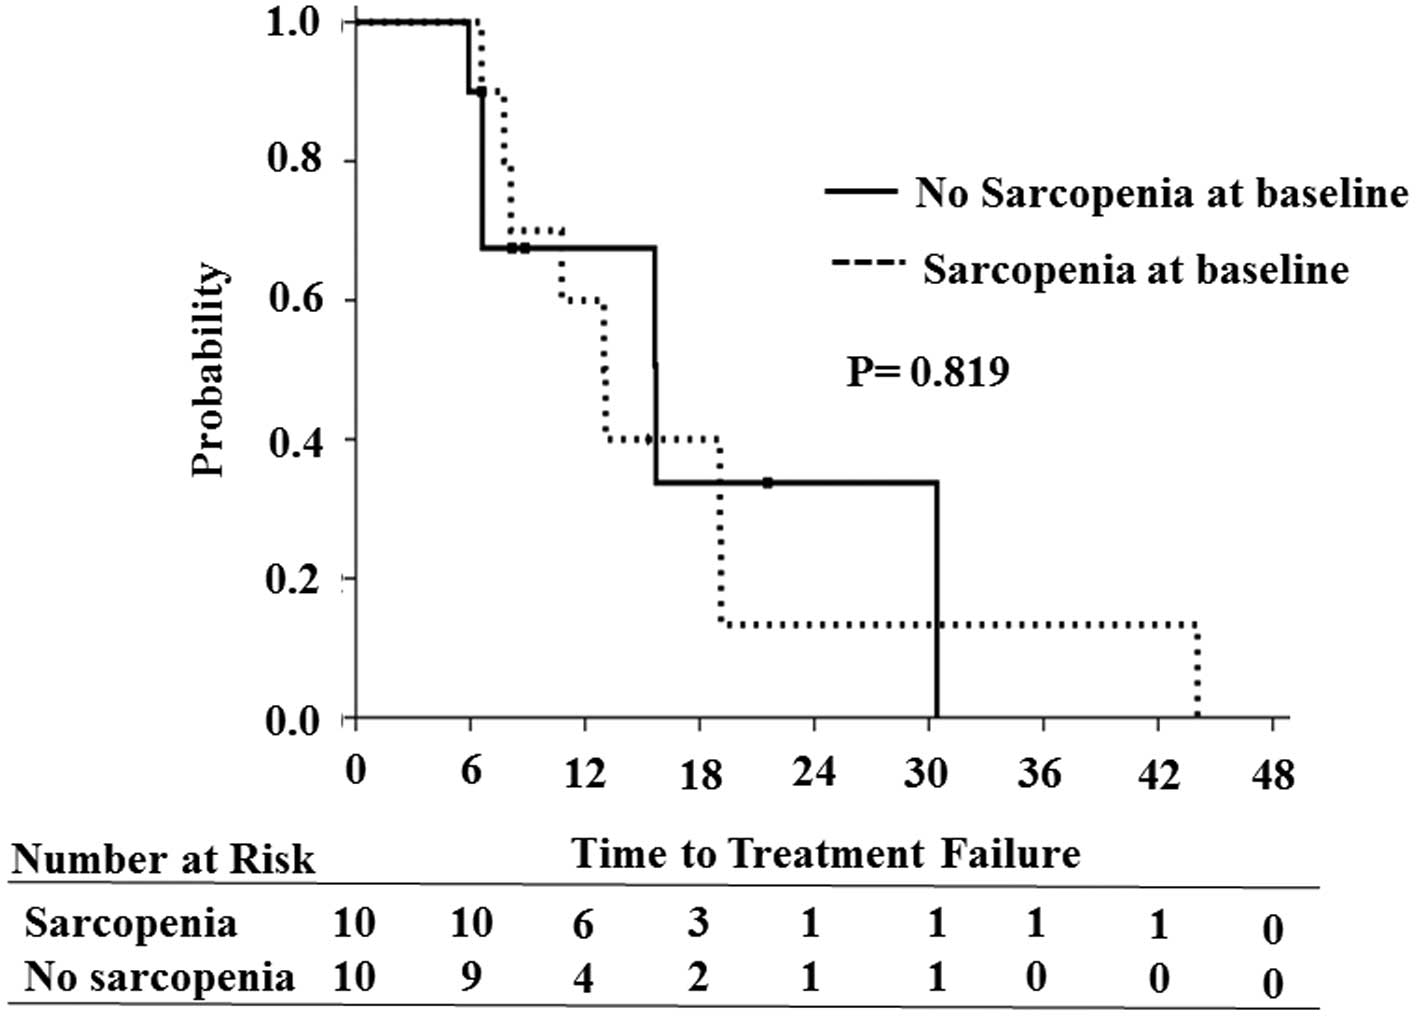
Association of TTF with SMI
Taking the median SMI as the cut-off value based on
gender, the median TTF was longer in the non-sarcopenic arm (15.7
months) compared with the sarcopenic arm (12.9 months), although
the difference was not significant (P=0.819; Fig. 2). Among the various parameters
studied, no significant correlation of any of them was observed
with TTF.
Discussion
To the best of our knowledge, this is the first
study to demonstrate that the long-term use of mTOR inhibitors
significantly decreases the muscle quantity, without affecting body
weight and adipose tissue. The present study has also shown that
the amount of the decrease in muscle mass was associated with the
baseline muscle mass. TTF was not associated with the sarcopenia
status of the patients.
The chronological assessment and interpretation of
alterations in muscle mass in cancer patients is problematical,
since loss of muscle mass is an important part of cancer cachexia
(10). Hence, it is difficult to
accurately determine whether the change in muscle mass observed is
due to cancer cachexia or due to the treatment being followed
(18). Therefore, the use of the
drug for at least 6 months was taken as an inclusion criterion so
that the observed alteration in muscle mass could be reliably
ascribed to the drug, and not simply be a component of cancer
cachexia. Since cancer cachexia rapidly progresses in patients
without treatment response, any muscle loss in those patients is
likely to be due to the disease, and not the drug. Furthermore,
drug-induced muscle loss at 6 months was previously confirmed in a
placebo-controlled trial of sorafenib (13).
Unlike other studies that have usually assessed body
composition change over 3 months (9,14), at
least 6 months of drug use was featured in the present study as an
inclusion criterion to increase the reliability that the observed
differences were due to the drug. One previous study evaluating the
effect of temsirolimus on body composition did not demonstrate a
statistically significant decrease in muscle area, unlike our study
(19). One plausible explanation to
account for this is that the mean time between the two evaluated CT
scans was only 9 weeks in that study, compared with 14 months in
the present study. To the best of our knowledge, this is the
longest mean duration between the CT scans for the evaluation of
body composition change with drug use. Loss of body weight is an
important component of cancer cachexia (10). Since there was no significant loss of
body weight, the loss of muscle mass observed in the present study
was most likely due to the drug, and not a part of cancer
cachexia.
Seven patients in the present study suffered a loss
of muscle area, despite gaining weight. Decreases in SMI were not
correlated with losses in body weight. A quarter (25%) of the
patients had a low BMI, whereas 60% of the patients were sarcopenic
at the baseline. Taken together, the present study confirms that
the assessment of sarcopenia cannot (and should not) be substituted
with body weight or BMI measurement alone. Sarcopenia, a predictor
of worse prognosis, may remain unnoticed, particularly in patients
with normal body weight or BMI. This is particularly important in
the Western world, where the percentage of obese patients is high.
Therefore, increases in body weight may not always be reassuring,
since numerous patients could continue to lose muscle mass in spite
of gaining body weight.
The exact mechanisms underpinning the loss of muscle
mass with the use of mTOR inhibitors warrant further investigation.
Activation of the PI3K-AKT-mTOR pathway is essential for muscle
protein synthesis. It has been reported that the activation of the
AKT/mTOR pathway and its downstream targets is essential for
regulating skeletal muscle fiber size, and that the activation of
the AKT/mTOR pathway may oppose the muscle atrophy that is induced
by disuse (11). Genetic activation
of the AKT/mTOR pathway was sufficient to cause hypertrophy and
prevent atrophy in vivo, whereas genetic blockade of this
pathway blocked hypertrophy in vivo (12). It has also been observed that the
increase in muscle mass in response to nutrition or exercise occurs
in parallel with the activation of mammalian target of rapamycin
complex 1 (mTORC1) (20). In the
present study, no significant association of skeletal muscle loss
with the gain or loss of adipose tissue was observed. This
substantiates the definition of cancer cachexia as muscle loss with
or without the loss of adipose tissue (10).
A majority of the sarcopenia studies in an
oncological setting have used Prado's cut-off (<38.5
cm2/m2 for females and <52.4
cm2/m2 for males) for segregating sarcopenic
from non-sarcopenic patients (15).
However, in the study of Prado et al (15), the cut-off value was based on the
Canadian population, and it may not be used for a Japanese
population such as the one featured in the present study, a fact
that has already been acknowledged by other members of the same
group that originally provided this cut-off (21). Thus, in the present study, the
gender-specific median SMI of our own population was used to
evaluate the TTF, as SMI cut-off data for Asian populations are not
available.
One interesting finding in the present study was the
significant correlation between the change in SMI and the baseline
SMI, namely, that patients who have a low muscle mass at the
baseline do not experience as much loss of muscle mass during
treatment as do patients who have greater muscle mass at the
baseline. Given the important role of the mTOR pathway in muscle
synthesis, patients who have low muscle mass at the baseline may
also have low levels of mTORC1 receptors at the baseline, compared
with patients with comparatively more muscle mass. Thus, the effect
of mTOR inhibition may not be as pronounced in patients with low
muscle mass at the baseline. However, this is only a hypothesis,
and further confirmatory studies are required. Although not
significantly so, the decrease in serum albumin and the increase in
the level of CRP observed in the present study were expected
findings, as serum albumin and CRP are markers of inflammation, and
sarcopenia is known to be influenced by inflammation.
Unlike other studies, the present study was not able
to demonstrate significantly shorter TTF of sarcopenic patients
compared with those without sarcopenia. This could be due to the
exclusion of patients with rapid disease progression in our study,
as only those patients with at least 6 months of continuous therapy
with mTOR inhibitors were included. Alternatively, for patients who
received mTOR inhibitor therapy for more than 6 months, sarcopenia
may not be a poor prognostic factor, unlike the situation with
other drugs. Neither was studying the effects of sarcopenic obesity
possible, as none of our patients were obese. The amount of, or the
change in, the VAT or TAT values had no impact on TTF. However, due
to the small sample size, conclusions regarding TTF or survival may
not be drawn from the present study.
The retrospective nature and lack of a control group
are the major limitations of the present study. The use of a
placebo control is impossible in a retrospective study, and it
would also be unethical, with the exception of clinical trials.
Non-responders (i.e. who took the drug for <6 months) could have
formed a possible control group, although as mentioned above,
muscle loss in this group would be more likely to be due to cancer
cachexia, and not the drug, thereby rendering comparisons obsolete.
The small sample size is another limitation of the present study.
However, a number of previous studies on sarcopenia in an
oncological setting have usually had a small sample size [e.g. 16
patients in the study of temsirolimus (19), and 40 in the study of sorafenib among
patients with hepatocellular carcinoma (7)].
In conclusion, the present study has revealed the
sarcopenic effect of long-term mTOR inhibitor use, and the
importance of making an assessment of muscle mass independently of
body weight or the measurement of BMI. Due to the predictive and
prognostic role of sarcopenia in cancer patients, this finding may
have important therapeutic implications. Indeed, a prospective
study to confirm these findings is already in place (UMIN
Registration no: UMIN000019477).
Acknowledgements
We would like to thank Mrs. Yuka Murasaki for
administrative support, and Dr Kenta Murotani, for assistance with
the statistical analysis. This work was partly supported by JSPS
KAKENHI Grant no. 2646026 to Dr. Ando, and research grants from the
Kobayashi International Scholarship Foundation to Dr. Gyawali and
Dr. Shimokata.
References
|
1
|
Baumgartner RN, Koehler KM, Gallagher D,
Romero L, Heymsfield SB, Ross RR, Garry PJ and Lindeman RD:
Epidemiology of sarcopenia among the elderly in New Mexico. Am J
Epidemiol. 147:755–763. 1998. View Article : Google Scholar : PubMed/NCBI
|
|
2
|
Prado CM, Baracos VE, McCargar LJ, Reiman
T, Mourtzakis M, Tonkin K, Mackey JR, Koski S, Pituskin E and
Sawyer MB: Sarcopenia as a determinant of chemotherapy toxicity and
time to tumor progression in metastatic breast cancer patients
receiving capecitabine treatment. Clin Cancer Res. 15:2920–2926.
2009. View Article : Google Scholar : PubMed/NCBI
|
|
3
|
van Vledder MG, Levolger S, Ayez N,
Verhoef C, Tran TC and Ijzermans JN: Body composition and outcome
in patients undergoing resection of colorectal liver metastases. Br
J Surg. 99:550–557. 2012. View
Article : Google Scholar : PubMed/NCBI
|
|
4
|
Tan BH, Birdsell LA, Martin L, Baracos VE
and Fearon KC: Sarcopenia in an overweight or obese patient is an
adverse prognostic factor in pancreatic cancer. Clin Cancer Res.
15:6973–6979. 2009. View Article : Google Scholar : PubMed/NCBI
|
|
5
|
Grossberg AJ, Chamchod S, Fuller CD,
Mohamed AS, Heukelom J, Eichelberger H, Kantor ME, Hutcheson KA,
Gunn GB, Garden AS, et al: Association of body composition with
survival and locoregional control of radiotherapy-treated head and
neck squamous cell carcinoma. JAMA Oncol. 2:782–789. 2016.
View Article : Google Scholar : PubMed/NCBI
|
|
6
|
Antoun S, Baracos VE, Birdsell L, Escudier
B and Sawyer MB: Low body mass index and sarcopenia associated with
dose-limiting toxicity of sorafenib in patients with renal cell
carcinoma. Ann Oncol. 21:1594–1598. 2010. View Article : Google Scholar : PubMed/NCBI
|
|
7
|
Mir O, Coriat R, Blanchet B, Durand JP,
Boudou-Rouquette P, Michels J, Ropert S, Vidal M, Pol S, Chaussade
S and Goldwasser F: Sarcopenia predicts early dose-limiting
toxicities and pharmacokinetics of sorafenib in patients with
hepatocellular carcinoma. PLoS One. 7:e375632012. View Article : Google Scholar : PubMed/NCBI
|
|
8
|
Huillard O, Mir O, Peyromaure M, Tlemsani
C, Giroux J, Boudou-Rouquette P, Ropert S, Delongchamps NB, Zerbib
M and Goldwasser F: Sarcopenia and body mass index predict
sunitinib-induced early dose-limiting toxicities in renal cancer
patients. Br J Cancer. 108:1034–1041. 2013. View Article : Google Scholar : PubMed/NCBI
|
|
9
|
Massicotte MH, Borget I, Broutin S,
Baracos VE, Leboulleux S, Baudin E, Paci A, Deroussent A,
Schlumberger M and Antoun S: Body composition variation and impact
of low skeletal muscle mass in patients with advanced medullary
thyroid carcinoma treated with vandetanib: results from a
placebo-controlled study. J Clin Endocrinol Metab. 98:2401–2408.
2013. View Article : Google Scholar : PubMed/NCBI
|
|
10
|
Fearon K, Strasser F, Anker SD, Bosaeus I,
Bruera E, Fainsinger RL, Jatoi A, Loprinzi C, MacDonald N,
Mantovani G, et al: Definition and classification of cancer
cachexia: An international consensus. Lancet Oncol. 12:489–495.
2011. View Article : Google Scholar : PubMed/NCBI
|
|
11
|
Bodine SC, Stitt TN, Gonzalez M, Kline WO,
Stover GL, Bauerlein R, Zlotchenko E, Scrimgeour A, Lawrence JC,
Glass DJ and Yancopoulos GD: Akt/mTOR pathway is a crucial
regulator of skeletal muscle hypertrophy and can prevent muscle
atrophy in vivo. Nat Cell Biol. 3:1014–1019. 2001. View Article : Google Scholar : PubMed/NCBI
|
|
12
|
Edinger AL and Thompson CB: Akt maintains
cell size and survival by increasing mTOR-dependent nutrient
uptake. Mol Biol Cell. 13:2276–2288. 2002. View Article : Google Scholar : PubMed/NCBI
|
|
13
|
Antoun S, Birdsell L, Sawyer MB, Venner P,
Escudier B and Baracos VE: Association of skeletal muscle wasting
with treatment with sorafenib in patients with advanced renal cell
carcinoma: Results from a placebo-controlled study. J Clin Oncol.
28:1054–1060. 2010. View Article : Google Scholar : PubMed/NCBI
|
|
14
|
Prado CM, Bekaii-Saab T, Doyle LA,
Shrestha S, Ghosh S, Baracos VE and Sawyer MB: Skeletal muscle
anabolism is a side effect of therapy with the MEK inhibitor:
Selumetinib in patients with cholangiocarcinoma. Br J Cancer.
106:1583–1586. 2012. View Article : Google Scholar : PubMed/NCBI
|
|
15
|
Prado CM, Lieffers JR, McCargar LJ, Reiman
T, Sawyer MB, Martin L and Baracos VE: Prevalence and clinical
implications of sarcopenic obesity in patients with solid tumours
of the respiratory and gastrointestinal tracts: A population-based
study. Lancet Oncol. 9:629–635. 2008. View Article : Google Scholar : PubMed/NCBI
|
|
16
|
Mourtzakis M, Prado CM, Lieffers JR,
Reiman T, McCargar LJ and Baracos VE: A practical and precise
approach to quantification of body composition in cancer patients
using computed tomography images acquired during routine care. Appl
Physiol Nutr Metab. 33:997–1006. 2008. View
Article : Google Scholar : PubMed/NCBI
|
|
17
|
Shen W, Punyanitya M, Wang Z, Gallagher D,
St-Onge MP, Albu J, Heymsfield SB and Heshka S: Total body skeletal
muscle and adipose tissue volumes: Estimation from a single
abdominal cross-sectional image. J Appl Physiol (1985).
97:2333–2338. 2004. View Article : Google Scholar : PubMed/NCBI
|
|
18
|
Fearon K, Arends J and Baracos V:
Understanding the mechanisms and treatment options in cancer
cachexia. Nat Rev Clin Oncol. 10:90–99. 2013. View Article : Google Scholar : PubMed/NCBI
|
|
19
|
Veasey-Rodrigues H, Parsons HA, Janku F,
Naing A, Wheler JJ, Tsimberidou AM and Kurzrock R: A pilot study of
temsirolimus and body composition. J Cachexia Sarcopenia Muscle.
4:259–265. 2013. View Article : Google Scholar : PubMed/NCBI
|
|
20
|
Adegoke OA, Abdullahi A and Tavajohi-Fini
P: mTORC1 and the regulation of skeletal muscle anabolism and mass.
Appl Physiol Nutr Metab. 37:395–406. 2012. View Article : Google Scholar : PubMed/NCBI
|
|
21
|
Martin L, Birdsell L, Macdonald N, Reiman
T, Clandinin MT, McCargar LJ, Murphy R, Ghosh S, Sawyer MB and
Baracos VE: Cancer cachexia in the age of obesity: Skeletal muscle
depletion is a powerful prognostic factor, independent of body mass
index. J Clin Oncol. 31:1539–1547. 2013. View Article : Google Scholar : PubMed/NCBI
|