Introduction
Rectal cancers affect the rectum, and are generally
adenocarcinomas (1). Nearly 70% of
patients are >65 years old, and rectal cancer occurs rarely in
patients who are under 40 years of age; in addition, men are
predominantly affected (2). Probable
risk factors include age, male gender, colon polyps, a history of
colorectal cancer, a history of inflammatory bowel disease,
hereditary syndromes, lifestyle factors (diet, alcohol, obesity,
sedentary lifestyle and smoking), and a history of diabetes
mellitus (1). Rectal cancer is
usually managed using a combination of surgery, chemotherapy,
targeted therapy and radiation therapy (3). The five-year survival rates following
surgical resection are 85–95% for stage I, 60–80% for stage II, and
30–60% for stage III cancer. With the aging of the Chinese society
and a Westernization of the diet, the incidence of rectal cancer in
China is increasing (4). Therefore,
finding novel means to efficiently detect and diagnose rectal
cancer are required.
Dynamic contrast-enhanced magnetic resonance imaging
(DCE-MRI) is a relatively novel imaging modality that demonstrates
the capillary blood flows (5,6). In DCE-MRI, the distribution of the
contrast agent is repeatedly evaluated, allowing the evaluation of
the tumor microcirculation in vivo and enabling the
malignancy or benignancy of the tumor to be quantitatively
distinguished (6,7). A number of previous studies have shown
the diagnostic value of DCE-MRI for prostate cancer (8–10), for the
evaluation of pancreatic cancer (11), and for evaluating the efficacy of
cancer drugs (12–14). Only one previous study has used
DCE-MRI to evaluate the tumor drug response in colorectal cancer
(15), and, at present, no published
studies have been concerned with the diagnostic value of DCE-MRI
for rectal cancer.
Therefore, the two-fold aim of the present study was
to use DCE-MRI to compare the tumor perfusion parameters with
postoperative pathology results in order to elucidate the
characteristics of the DCE-MRI parameters in rectal cancer, and to
explore the application of DCE-MRI in the preoperative diagnosis of
rectal cancer.
Materials and methods
Subjects
Patients with a suspected rectal lesion (blood in
stool, changes of bowel habits, and/or suspicious masses identified
by finger examination or colonoscopy) were recruited at the
Anorectal Surgery Department, Changhai Hospital Affiliated to the
Second Military Medical University (Shanghai, China), between
December 2013 and February 2015. All subjects underwent DCE-MRI and
postoperative pathology. Inclusion criteria were: i) a single
lesion on conventional imagery; and ii) no chemotherapy or
radiotherapy was administered prior to DCE-MRI. Patients were
excluded if: i) DCE-MRI images were of poor quality; ii) images did
not include the whole lesion; iii) artifacts affected measurements;
or iv) lesions were too small to be accurately measured.
Finally, 55 patients were included in the study, 40
of whom had been diagnosed with pathology-confirmed rectal cancer,
whereas the remaining 15 subjects were included as controls. These
15 controls included two cases of chronic inflammation, one case of
rectum hemorrhoids, one case of isolated hamartoma, six cases of
tubular adenoma, three cases of tubular villous adenoma and two
healthy controls.
The present study was approved by the Committee on
Ethics of Biomedical Research, Second Military Medical University
(Shanghai, China). All subjects signed a written informed
consent.
MRI scanning
MRI was performed using a Skyra 3.0 T MRI scanner
(Siemens AG, Erlangen, Germany) with a pelvic phased array coil.
All subjects had fasted for 4 h prior to scanning. Routine pelvic
MRI and DCE-MRI sequences were used for scanning. The routine
sequences included sagittal T2 weighted imaging (T2WI) with fat
suppression, axial T1WI, T2WI, diffusion (D)WI, and coronal T2WI.
DCE-MRI was used to scan the same axial layers as T2WI with the
following scanning parameters: Repetition time (TR) 3.33 msec, echo
time (TE) 1.23 msec, flip angle 9°, field of view (FOV) 36 cm,
matrix 125×192, layer thickness 3 mm and 30 layers; parallel
acquisition by CAIPIRINHA and acceleration factor R=2. Each scan
lasted for 5 sec, and 75 scans were performed with free
respiration. Following the initial scan, the contrast agent,
gadolinium-diethylenetriaminepentacetate (Beijing Hokuriku
Pharmaceutical Co., Ltd., China; volume of 15–20 ml, 0.2 mmol/kg)
was injected intravenously at 3 ml/sec using high-pressure
syringes. Subsequently, 20 ml saline solution of 0.90% (w/v) NaCl
was injected at the same rate.
Measurements and data analysis
All data obtained from the DCE sequences were sent
to the Tissue 4D post-processing workstation (Siemens AG) for
post-processing. Parameter calculations were performed using the
Tofts pharmacokinetic model (16,17). On
the DCE images, an area resembling a circle, including all rectal
and surrounding mesangial regions, was selected to generate DCE-MRI
pseudo-color images. The images were examined in a blind manner by
two radiologists specializing in MRI, with 5 years of experience.
By comparing with the T2WI images, the radiologists selected the
plane sections where the lesions were relatively large, based on
the morphology, sites, infiltration depth, enhancement patterns and
invasion into surrounding regions to manually place regions of
interest (ROI), with areas no less than 1 cm2. The
perfusion parameters (16,17) were measured from three plane sections,
and the average was used for analysis: i) volume transfer constant
from the plasma compartment to the extravascular extracellular
space (Ktrans); ii) rate constant for transfer between the
extravascular extracellular space and the blood compartment (Kep);
iii) volume of extravascular extracellular space per unit volume of
tissue (Ve); and iv) the initial area under the enhancement curve
(iAUC). Time-signal intensity curves were plotted.
Patients with rectal cancer were divided into three
groups, according to the tumor differentiation based on the
postoperative pathology reports evaluated in a blind manner by two
pathologists with 5 years of experience: i) highly differentiated;
ii) moderately differentiated; and iii) poorly differentiated
(18).
Statistical analysis
SPSS version 16.0 software (SPSS, Inc., Chicago, IL,
USA) was used for the statistical analysis. Data are expressed as
the means ± standard deviation. Due to the heterogeneity of
variance in the parameters between patients with rectal cancer and
controls, the Mann-Whitney U test was used to assess the
differences between the two groups. Intraclass correlation
coefficients (ICCs) were used to estimate the consistency of the
results from the two radiologists. To determine the diagnostic
power of Ktrans, Kep, Ve, and iAUC, the receiver operator
characteristics (ROC) curve method was used, and areas under the
curve AUCs were calculated. Optimal cut-off values were selected to
maximize specificity and sensitivity. The H test was used to
compare DCE-MRI parameters among different degrees of
differentiation. The correlations between parameters and
differentiation of rectal cancer were analyzed using the Spearman's
rank correlation test. P<0.05 was considered to indicate a
statistically significant difference.
Results
Characteristics of the patients
Among the 40 patients with rectal cancer, there were
20 males and 20 females, aged 57±9 (range 25–68) years. Among the
15 controls, there were eight males and seven females, aged 56±7
(range 44–70) years. No significant differences in gender or age
were identified between the two groups.
DCE-MRI manifestation of rectal
cancer
All 40 cases of rectal cancer had a single lesion,
of which 26 cases exhibited space-occupying masses, 10 revealing an
irregular thickening of the local intestinal wall, and four cases
showing abnormal local nodular signals. All lesions demonstrated
equal or lower T1WI signals, equal or higher T2WI signals, equal or
higher fat-suppression sequence signals, and high DWI signals.
Significantly enhanced lesions were capable of being viewed on
DCE-MRI. The Ktrans, Kep, Ve, and iAUC values in rectal cancer
lesions were all significantly higher compared with the controls
(all P<0.05) (Table I). The
pseudo-color images of each parameter are shown in Figs. 1 and 2.
The time-signal intensity curves showed an outflow pattern: The
signal peaked shortly following the injection of the contrast
agent, and subsequently quickly decayed by >10% compared with
the signal intensity in the mid- and late-stage of the enhancement
after the contrast agent was injected (Fig. 1G). On the other hand, in the controls,
the time-signal intensity curves revealed a comparatively smaller
elevation of signal intensity at the early stage, and a plateau at
the later stage (Fig. 2G).
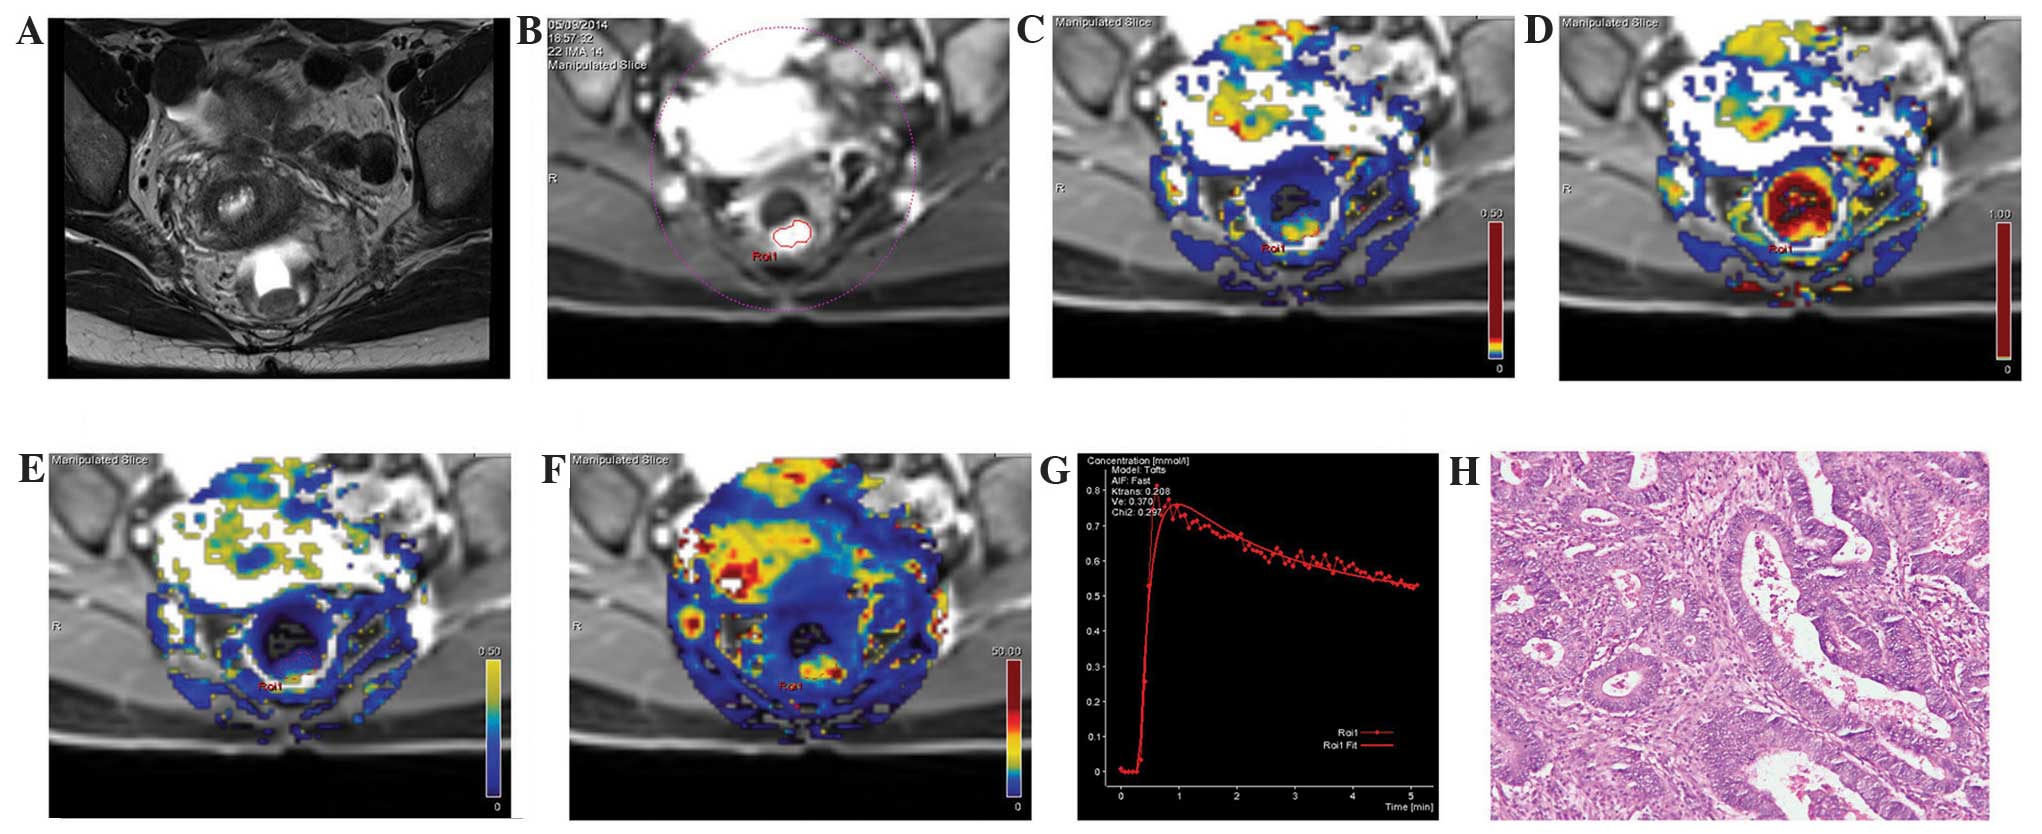 | Figure 1.MRI images from the same patient with
rectal cancer, a female aged 48 years with blood in the stool for 6
months. (A) A T2WI cross section, revealing the local occupation of
the rear intestinal wall. (B) DCE-MRI scanning image showing a
marked enhancement of the rear intestinal wall, which was slightly
higher than the surrounding regions. (C) DCE-MRI pseudo-color
images of Ktrans. The yellowish-green area indicates the local
occupation of the intestinal wall. Ktrans of the lesion area was
0.208, which was higher compared with the surrounding intestinal
wall tissue (blue). (D) DCE-MRI pseudo-color images of Kep. The red
and yellow areas indicate the lesion area, where Kep was 0.588. (E)
DCE-MRI pseudo-color images of Ve. The yellowish-green area
indicates the lesion area, where Ve was 0.370. (F) DCE-MRI
pseudo-color images of iAUC. The red and yellow areas indicate the
lesion area, where iAUC was 37.009, which was higher compared with
the surrounding intestinal wall tissue (blue). (G) The DCE-MRI
time-signal intensity curve of the patient, where the dashed line
indicates the connection between data points and the solid line
indicates the fitted curve, reveals an outflow pattern. (H) Results
of the postoperative pathology test (hematoxylin and eosin
staining, ×200). The tumor tissue showed a papillary and mesh-like
alignment. Tumor cells were cubic and of a column-like shape, with
big, atypical and deeply stained nuclei, which infiltrated into the
superficial muscle layer of the intestinal wall. The patient was
diagnosed with moderately differentiated rectal adenocarcinoma.
DCE-MRI, dynamic contrast-enhanced magnetic resonance imaging;
Ktrans, volume transfer constant from the plasma compartment to the
extravascular extracellular space; Kep, rate constant for transfer
between extravascular extracellular space and the blood
compartment; Ve, volume of extravascular extracellular space per
unit volume of tissue; iAUC, initial area under enhancement
curve. |
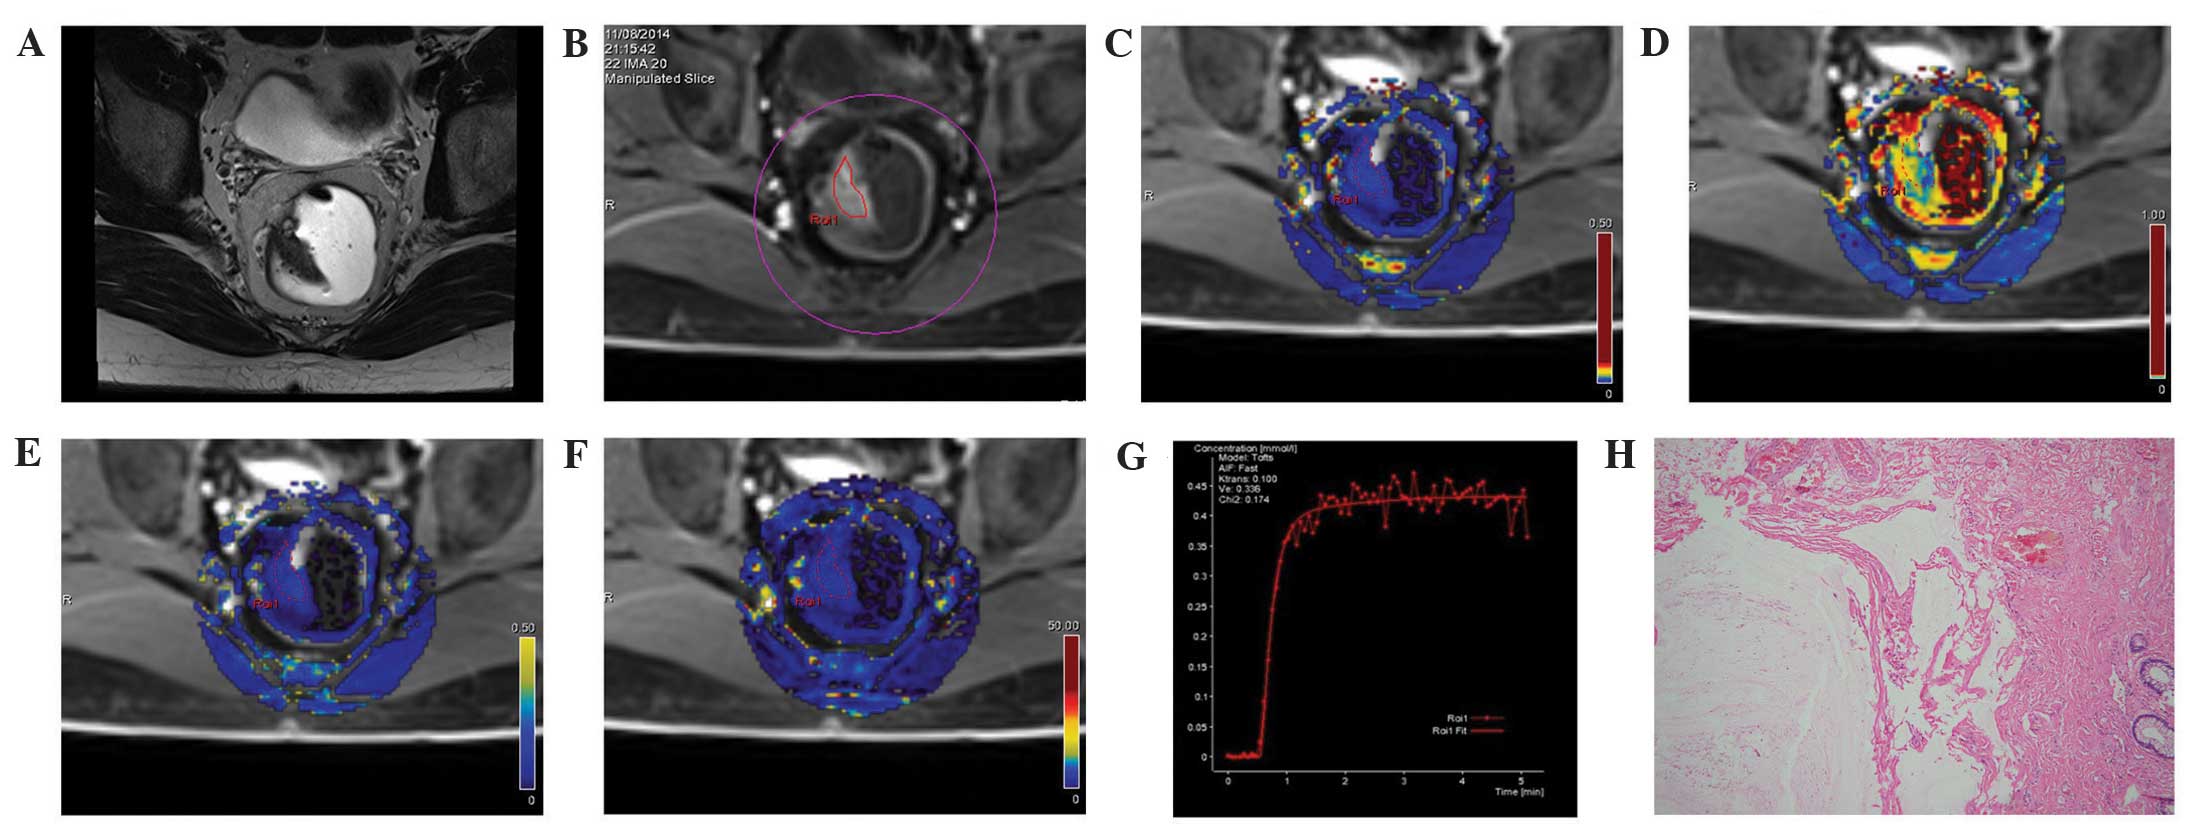 | Figure 2.MRI images from the same patient in
the control group: A male, aged 35 years, with a feeling of
incomplete defecation for one year, occasional anal pain, and
slight blood in the stool. Swollen masses were identified by finger
examination. (A) A T2WI cross-section showing abnormal occupation
signals on the right side of the intestinal wall. (B) DCE-MRI
scanning images showing similar enhancement of the space occupation
of the selected intestinal wall compared with the surrounding
regions. (C) DCE-MRI pseudo-color images of Ktrans. The blue color
was evenly distributed along the intestine, and the Ktrans of the
ROI was 0.100. (D) DCE-MRI pseudo-color images of Kep. The lesion
area was blue, where Kep was 0.428. (E) DCE-MRI pseudo-color images
of Ve. The lesion area was blue, where Ve was 0.336. (F) DCE-MRI
pseudo-color images of iAUC. The lesion area was blue, where iAUC
was 18.834, which was comparable with the surrounding intestinal
wall tissue. (G) The DCE-MRI time-signal intensity curve of the
control revealed a pattern of a rapid rise, followed by a plateau.
(H) Results of the postoperative pathology test (hematoxylin and
eosin staining, ×100). Cysts were formed in the intestinal
submucosa, filled with mucus. Mucus overflow formed a mucus paste
outside several of the cysts. No atypical gland structures or cells
were observed surrounding the cysts. Fibrosis, chronic inflammatory
cell infiltration, and vascular dilatation and congestion were seen
in the submucosa. The patient in the control group was diagnosed
with colitis cystica profunda. DCE-MRI, dynamic contrast-enhanced
magnetic resonance imaging; Ktrans, volume transfer constant from
the plasma compartment to the extravascular extracellular space;
Kep, rate constant for transfer between extravascular extracellular
space and the blood compartment; Ve, volume of extravascular
extracellular space per unit volume of tissue; iAUC, initial area
under enhancement curve. |
 | Table I.DCE-MRI parameters. |
Table I.
DCE-MRI parameters.
| Group | n | Radiologist | Ktrans
(min−1) | Kep
(min−1) | Ve (%) | iAUC |
|---|
| Rectal cancer | 40 | 1 | 0.267±0.071 | 0.615±0.212 | 0.489±0.101 | 37.177±8.845 |
|
|
| 2 | 0.257±0.070 | 0.605±0.202 | 0.474±0.081 | 35.800±8.093 |
| Controls | 15 | 1 | 0.118±0.032 | 0.427±0.163 | 0.361±0.166 | 16.052±5.828 |
|
|
| 2 | 0.121±0.027 | 0.411±0.160 | 0.367±0.148 | 17.328±4.428 |
| P-valuea |
| 1 | <0.001 | 0.005 | 0.003 | <0.001 |
|
|
| 2 | <0.001 | 0.002 | 0.008 | <0.001 |
The ICCs between the two independent measurements
were 0.991, 0.988, 0.928 and 0.984, for Ktrans, Kep, Ve and iAUC,
respectively (all P<0.001) (Table
II), which suggested a good consistency of the measurements,
and indicated the reliability and reproducibility of the DCE-MRI
method.
| Table II.Consistency of the results from the
two radiologists. |
Table II.
Consistency of the results from the
two radiologists.
| Variable | Ktrans | Kep | Ve | iAUC |
|---|
| ICCa |
0.991 |
0.988 |
0.928 |
0.984 |
| P-value | <0.001 | <0.001 | <0.001 | <0.001 |
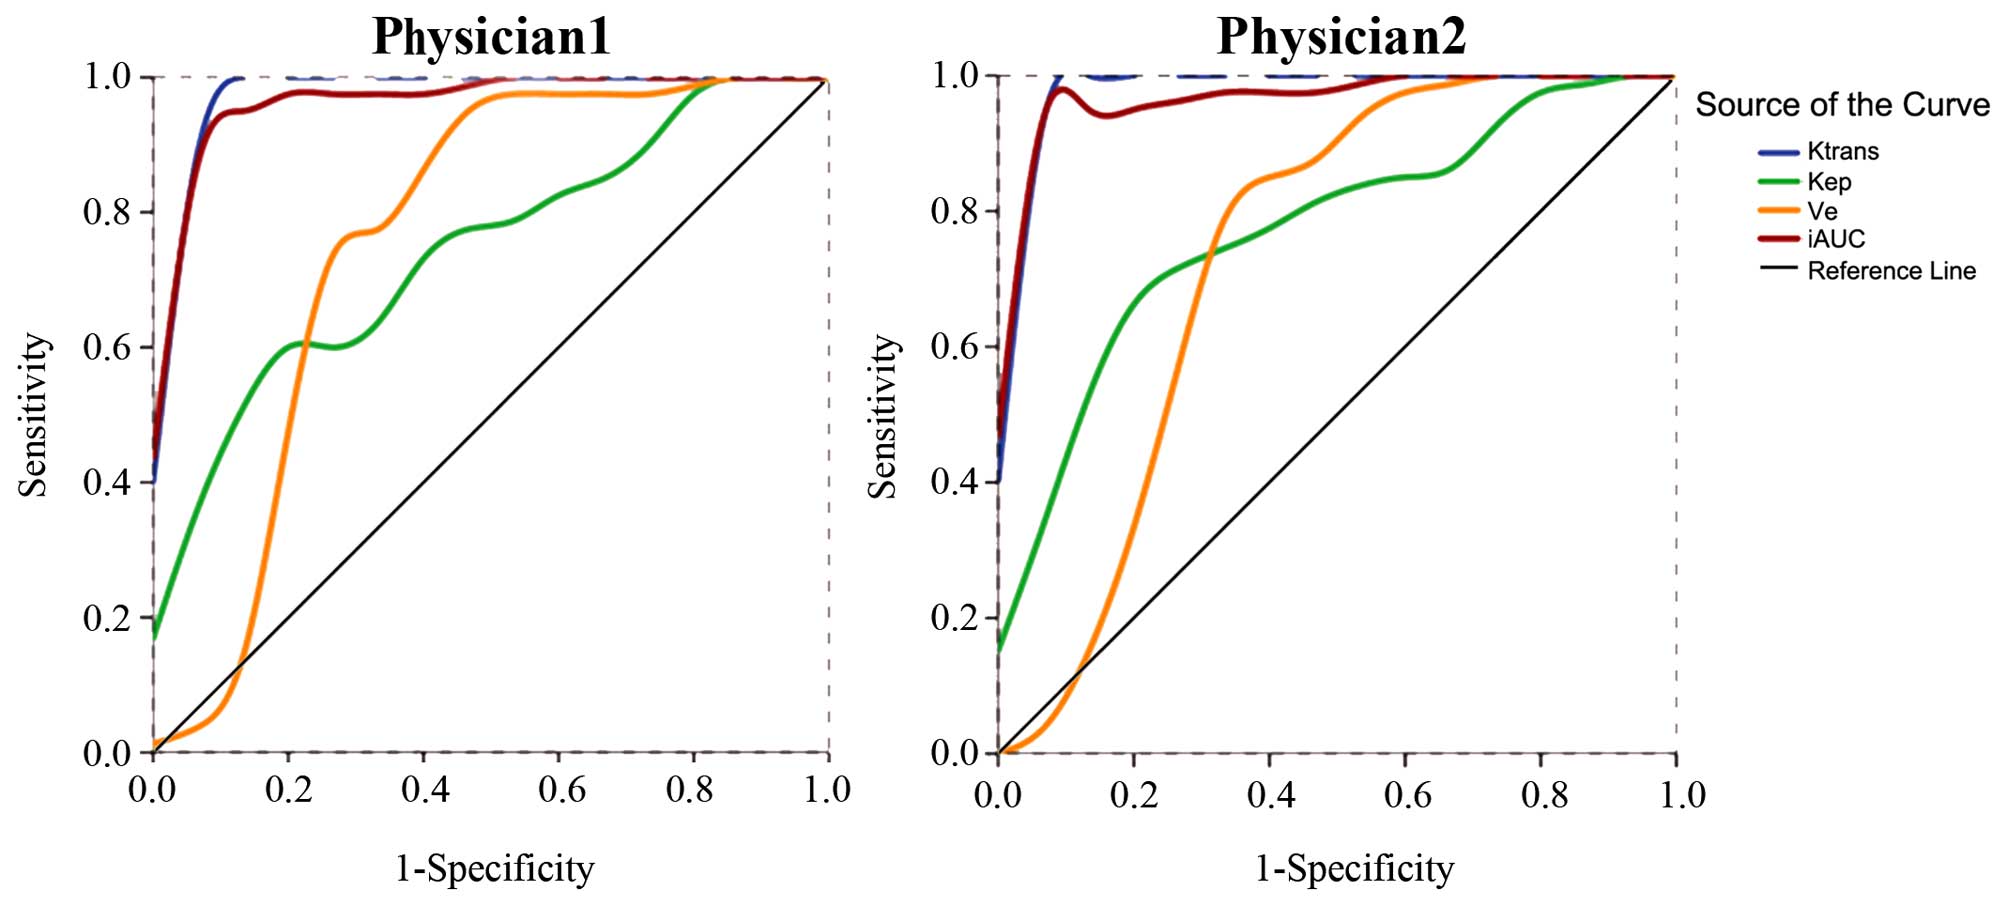
ROC curve analysis of DCE-MRI
parameters
ROC curve analysis was performed based on the
independent measurement of the DCE-MRI parameters (Ktrans, Kep, Ve
and iAUC) from the two radiologists. The areas under the ROC curves
were 0.987, 0.747, 0.758 and 0.975 from radiologist 1, and 0.990,
0.777, 0.735 and 0.978 from radiologist 2, with great consistency
in measurement (Fig. 3). Using a
0.156 min−1 cut-off value for Ktrans, the two
radiologists determined a sensitivity of 100.0% and a specificity
of 93.3%. Using a cut-off value of 24.183 or 23.410 for iAUC, the
sensitivity was 92.5% for both analyses, and the specificity was
93.3% or 100.0%, respectively. A detailed analysis of the results
are shown in Table III.
| Table III.Receiver-operator characteristic (ROC)
analysis for the prediction of rectal cancer using DCE-MRI. |
Table III.
Receiver-operator characteristic (ROC)
analysis for the prediction of rectal cancer using DCE-MRI.
|
| Radiologist 1 | Radiologist 2 |
|
|---|
|
|
|
|
|---|
| Variables | Ktrans
(min−1) | Kep
(min−1) | Ve (%) | iAUC | Ktrans
(min−1) | Kep
(min−1) | Ve (%) | iAUC |
|---|
| Cut-off | 0.156 | 0.549 | 0.354 | 24.183 | 0.156 | 0.52 | 0.372 | 23.41 |
| Sensitivity | 100.00% | 60.00% | 92.50% | 92.50% | 100.00% | 65.00% | 85.00% | 92.50% |
| Specificity | 93.30% | 86.70% | 60.00% | 93.30% | 93.30% | 86.70% | 66.70% | 100.00% |
| AUC | 0.987 | 0.747 | 0.758 | 0.975 | 0.99 | 0.777 | 0.735 | 0.978 |
| (95%
CI) | (0.959–1.014) | (0.611–0.882) | (0.579–0.938) | (0.940–1.010) | (0.968–1.012) | (0.645–0.908) | (0.552–0.918) | (0.946–1.011) |
Correlation between DCE-MRI parameters
and pathological differentiation
The pathology reports revealed that, out of the 40
cases of rectal cancer, there were 13 poorly differentiated cases
of cancer, 21 moderately differentiated cancers, and 6 well
differentiated cancers. According to radiologist 1, there were
significant differences in Ktrans (poorly: 0.284±0.068 and
moderately: 0.280±0.067 vs. well; 0.182±0.153 min−1,
P=0.004), Kep (poorly: 0.628±0.223 and moderately: 0.669±0.188 vs.
well; 0.397±0.147 min−1, P=0.022), and iAUC (poorly:
41.69±4.12 and moderately: 38.17±8.45 vs. well; 23.91±3.91,
P<0.001) among three groups, but not for Ve (P=0.373). Out of
the four parameters, Ktrans (r=0.393, P=0.012) and iAUC (r=0.594,
P<0.001) were correlated with differentiation, whereas Kep and
Ve were not significantly correlated with pathological
differentiation (Table IV). Similar
results were obtained by radiologist 2.
| Table IV.Comparison and correlation analysis
between pathological differentiation and DCE-MRI parameters. |
Table IV.
Comparison and correlation analysis
between pathological differentiation and DCE-MRI parameters.
|
| Radiologist 1 | Radiologist 2 |
|---|
|
|
|
|
|---|
|
Differentiation | n | Ktrans
(min−1) | Kep
(min−1) | Ve (%) | iAUC | n | Ktrans
(min−1) | Kep
(min−1) | Ve (%) | iAUC |
|---|
| Highly
differentiated | 6 | 0.182±0.153 | 0.397±0.147 | 0.418±0.133 | 23.908±3.914 | 6 | 0.175±0.015 | 0.393±0.143 | 0.422±0.077 | 23.059±3.700 |
| Moderately
differentiated | 21 | 0.280±0.067 | 0.669±0.188 | 0.505±0.104 | 38.173±8.453 | 21 | 0.265±0.063 | 0.655±0.174 | 0.483±0.090 | 36.269±6.924 |
| Poorly
differentiated | 13 | 0.284±0.068 | 0.628±0.223 | 0.496±0.067 | 41.691±4.115 | 13 | 0.283±0.072 | 0.622±0.215 | 0.482±0.061 | 40.922±4.155 |
|
P-valuea |
| 0.004 | 0.022 | 0.373 | <0.001 |
| 0.004 | 0.016 | 0.308 | <0.001 |
|
rs |
| 0.393 | 0.264 | 0.194 | 0.594 |
| 0.443 | 0.282 | 0.196 | 0.671 |
|
P-valueb |
| 0.012 | 0.099 | 0.231 | <0.001 |
| 0.004 | 0.078 | 0.227 | <0.001 |
Discussion
Currently, the diagnosis of rectal cancer relies on
traditional imaging. DCE-MRI is a relatively novel MRI technology
that combines morphology and changes in hemodynamics, and can
quantitatively evaluate tumor differentiation in a more accurate
way (19). Therefore, the aim of the
present study was to explore the clinical application of DCE-MRI in
the preoperative diagnosis of rectal cancer and its correlation
with tumor differentiation. The results showed that Ktrans, Kep, Ve
and iAUC were higher in cancer patients compared with controls. The
time-signal intensity curve of the rectal cancer lesion revealed an
outflow pattern. The areas under the ROC curves for Ktrans and iAUC
were both >0.9, resulting in a sensitivity and specificity of
100% and 93.3% for Ktrans, and of 92.5%, and 93.3% or 100%, for
iAUC, respectively. The ICCs of Ktrans, Kep, Ve, and iAUC measured
by the two independent radiologists were 0.991, 0.988, 0.972 and
0.984, respectively, indicating a good consistency. In the 40
rectal cancer cases, there was a moderate correlation between
Ktrans and iAUC and pathological differentiation.
Higher blood vessel density resulting from tumor
proliferation, and its synergistic effect with abnormal molecular
regulation within the tumor cells, lead to abnormal angiogenesis,
which is represented by leakage, twisted morphology, vascular wall
expansion and crosslinking (20).
This abnormal morphology results in a loose connection or loss of
pericytes that nourish the endothelial cells, and huge gaps between
the endothelium and basement membrane, and between the basement
membrane and pericytes, leading to enlargement of the gap between
vascular endothelial cells and attenuation of the maturity of blood
vessels, which consequently leads to high permeability and
vulnerability of newborn tumor blood vessels (21).
The most commonly used DCE-MRI parameter that
reflects vascular permeability is Ktrans (the volume transfer
constant) (16,22). Ktrans represents the rate at which the
contrast agent transfers from the blood to the interstitium, which
indicates the tumor microcirculation and the surface infiltration
area. In contrast, Kep, the reverse rate constant, reflects the
rate at which the contrast agent transfers from the extravascular
extracellular space back to the blood. Ve is the fractional
extravascular leakage volume, which predominantly reflects the
percentage of contrast agent in the extravascular extracellular
space (16). In addition, the
semi-quantitative parameter, iAUC, is associated with tumor blood
influx, perfusion and interstitium, and represents the general
tumor blood flow, overall perfusion and tumor interstitial space
index (16).
The present study revealed that Ktrans, Kep, Ve, and
iAUC were higher in patients with rectal cancer compared with
controls, indicating that massive angiogenesis and abnormal
vasculature enhanced the influx of contrast agent, whereas the
incomplete development of vascular endothelial cells and high
vascular permeability led to increased leakage of contrast agent.
However, the arteriovenous connection was observed to cause a
perfusion shortcut (22), which
supports the results of the present study.
Both ROC curves from the two radiologists
demonstrated a large AUC (>0.9) for Ktrans and iAUC, suggesting
that these two parameters had high sensitivity and specificity
compared with the other two parameters. In addition, the present
study also revealed that Ktrans and iAUC were correlated with the
pathological differentiation of rectal cancer
(0.3<r<0.8), which increased when the tumor was less
differentiated. This may be partially explained by the altered
vascular permeability by tumor angiogenesis, as well as the fact
that poorly-differentiated tumors had more cells at metaphase,
which required more nutritive elements and higher blood perfusion,
and therefore a higher Ktrans. Furthermore, poorly differentiated
tumors exhibited a greater heterogeneity of cell morphology and
histology, higher cell density and smaller interstitium.
Neither Kep nor Ve were significantly correlated
with tumor differentiation. It may be surmised that Kep and Ve were
associated with the composition of extravascular, extracellular
space and, despite the high local vascular permeability, the
composition of the extravascular, extracellular space did not
markedly differ among lesions with different differentiation
statuses. Further investigation is necessary to explore the
clinical relevance of these two parameters.
The results of the present study suggest that
DCE-MRI parameters can be used to distinguish malignant lesions
from benign ones. These results are in agreement with previous
studies performed with other types of solid tumors, including
orbital (23), breast (24,25), head
and neck (26) and pancreatic tumors
(11). A previous study in colorectal
cancer is consistent with the present study (27). Another previous study also
demonstrated that DCE-MRI parameters may be correlated with tumor
differentiation in rectal cancer (28).
The present study is not without limitations. First,
solid tumors are highly heterogeneous, and intestinal lesions often
have an irregular shape. Occasionally, they cannot be distinguished
from the surrounding adipose tissue due to inflammation and blood
vessel invasion. If the ROI is placed at the boundary of the tumor,
the results may vary, and multiple measurements are required to
obtain the average. Secondly, the patients were grouped according
to the state of differentiation, and the sample size was small for
the well-differentiated group. Finally, DEC-MRI is a relatively
novel imaging modality, and it is not yet standardized. Future
studies should include more patients in order to validate the
DCE-MRI measurements for rectal cancer diagnosis.
In conclusion, the present study has confirmed that
DCE-MRI parameters may reflect the difference in microcirculation
of rectal cancer, and Ktrans and iAUC were correlated with rectal
cancer differentiation, which may provide an effective preoperative
diagnosis modality for rectal cancer.
References
|
1
|
Cunningham D, Atkin W, Lenz HJ, Lynch HT,
Minsky B, Nordlinger B and Starling N: Colorectal cancer. Lancet.
375:1030–1047. 2010. View Article : Google Scholar : PubMed/NCBI
|
|
2
|
Labianca R, Nordlinger B, Beretta GD,
Mosconi S, Mandalà M, Cervantes A and Arnold D: ESMO Guidelines
Working Group: Early colon cancer: ESMO clinical practice
guidelines for diagnosis, treatment and follow-up. Ann Oncol.
24(Suppl 6): vi64–vi72. 2013. View Article : Google Scholar : PubMed/NCBI
|
|
3
|
Clinical practice guidelines in oncology
(NCCN Guidelines): Colon cancer. Version 3.2015. National
comprehensive cancer network (Fort Washington). 2015.
|
|
4
|
Chen WQ, Zeng HM, Zheng RS, Zhang SW and
He J: Cancer incidence and mortality in china, 2007. Chin J Cancer
Res. 24:1–8. 2012. View Article : Google Scholar : PubMed/NCBI
|
|
5
|
Hylton N: Dynamic contrast-enhanced
magnetic resonance imaging as an imaging biomarker. J Clin Oncol.
24:3293–3298. 2006. View Article : Google Scholar : PubMed/NCBI
|
|
6
|
Jackson A, O'Connor JP, Parker GJ and
Jayson GC: Imaging tumor vascular heterogeneity and angiogenesis
using dynamic contrast-enhanced magnetic resonance imaging. Clin
Cancer Res. 13:3449–3459. 2007. View Article : Google Scholar : PubMed/NCBI
|
|
7
|
Cha S: Perfusion MR imaging: Basic
principles and clinical applications. Magn Reson Imaging Clin N Am.
11:403–413. 2003. View Article : Google Scholar : PubMed/NCBI
|
|
8
|
Villers A, Puech P, Mouton D, Leroy X,
Ballereau C and Lemaitre L: Dynamic contrast enhanced, pelvic
phased array magnetic resonance imaging of localized prostate
cancer for predicting tumor volume: Correlation with radical
prostatectomy findings. J Urol. 176:2432–2437. 2006. View Article : Google Scholar : PubMed/NCBI
|
|
9
|
Haider MA, Chung P, Sweet J, Toi A,
Jhaveri K, Ménard C, Warde P, Trachtenberg J, Lockwood G and
Milosevic M: Dynamic contrast-enhanced magnetic resonance imaging
for localization of recurrent prostate cancer after external beam
radiotherapy. Int J Radiat Oncol Biol Phys. 70:425–430. 2008.
View Article : Google Scholar : PubMed/NCBI
|
|
10
|
Puech P, Potiron E, Lemaitre L, Leroy X,
Haber GP, Crouzet S, Kamoi K and Villers A: Dynamic
contrast-enhanced-magnetic resonance imaging evaluation of
intraprostatic prostate cancer: Correlation with radical
prostatectomy specimens. Urology. 74:1094–1099. 2009. View Article : Google Scholar : PubMed/NCBI
|
|
11
|
Liu K, Xie P, Peng W and Zhou Z: Dynamic
contrast-enhanced magnetic resonance imaging for pancreatic ductal
adenocarcinoma at 3.0-T magnetic resonance: Correlation with
histopathology. J Comput Assist Tomogr. 39:13–18. 2015. View Article : Google Scholar : PubMed/NCBI
|
|
12
|
Hahn OM, Yang C, Medved M, Karczmar G,
Kistner E, Karrison T, Manchen E, Mitchell M, Ratain MJ and Stadler
WM: Dynamic contrast-enhanced magnetic resonance imaging
pharmacodynamic biomarker study of sorafenib in metastatic renal
carcinoma. J Clin Oncol. 26:4572–4578. 2008. View Article : Google Scholar : PubMed/NCBI
|
|
13
|
Liu G, Rugo HS, Wilding G, McShane TM,
Evelhoch JL, Ng C, Jackson E, Kelcz F, Yeh BM, Lee FT Jr, et al:
Dynamic contrast-enhanced magnetic resonance imaging as a
pharmacodynamic measure of response after acute dosing of
AG-013736, an oral angiogenesis inhibitor, in patients with
advanced solid tumors: Results from a phase I study. J Clin Oncol.
23:5464–5473. 2005. View Article : Google Scholar : PubMed/NCBI
|
|
14
|
Barrett T, Davidson SR, Wilson BC,
Weersink RA, Trachtenberg J and Haider MA: Dynamic contrast
enhanced MRI as a predictor of vascular-targeted photodynamic focal
ablation therapy outcome in prostate cancer post-failed external
beam radiation therapy. Can Urol Assoc J. 8:E708–E714. 2014.
View Article : Google Scholar : PubMed/NCBI
|
|
15
|
Morgan B, Thomas AL, Drevs J, Hennig J,
Buchert M, Jivan A, Horsfield MA, Mross K, Ball HA, Lee L, et al:
Dynamic contrast-enhanced magnetic resonance imaging as a biomarker
for the pharmacological response of PTK787/ZK 222584, an inhibitor
of the vascular endothelial growth factor receptor tyrosine
kinases, in patients with advanced colorectal cancer and liver
metastases: Results from two phase I studies. J Clin Oncol.
21:3955–3964. 2003. View Article : Google Scholar : PubMed/NCBI
|
|
16
|
Tofts PS, Brix G, Buckley DL, Evelhoch JL,
Henderson E, Knopp MV, Larsson HB, Lee TY, Mayr NA, Parker GJ, et
al: Estimating kinetic parameters from dynamic contrast-enhanced
T(1)-weighted MRI of a diffusable tracer: Standardized quantities
and symbols. J Magn Reson Imaging. 10:223–232. 1999. View Article : Google Scholar : PubMed/NCBI
|
|
17
|
Franiel T, Hamm B and Hricak H: Dynamic
contrast-enhanced magnetic resonance imaging and pharmacokinetic
models in prostate cancer. Eur Radiol. 21:616–626. 2011. View Article : Google Scholar : PubMed/NCBI
|
|
18
|
Bosman FT: World Health Organization:
International agency for research on cancer. WHO classification of
tumours of the digestive system. International Agency for Research
on Cancer (Lyon). 2010.PubMed/NCBI
|
|
19
|
Vriens D, van Laarhoven HW, van Asten JJ,
Krabbe PF, Visser EP, Heerschap A, Punt CJ, de Geus-Oei LF and Oyen
WJ: Chemotherapy response monitoring of colorectal liver metastases
by dynamic Gd-DTPA-enhanced MRI perfusion parameters and 18F-FDG
PET metabolic rate. J Nucl Med. 50:1777–1784. 2009. View Article : Google Scholar : PubMed/NCBI
|
|
20
|
Furuya M and Yonemitsu Y: Cancer
neovascularization and proinflammatory microenvironments. Curr
Cancer Drug Targets. 8:253–265. 2008. View Article : Google Scholar : PubMed/NCBI
|
|
21
|
Jain RK: Normalization of tumor
vasculature: An emerging concept in antiangiogenic therapy.
Science. 307:58–62. 2005. View Article : Google Scholar : PubMed/NCBI
|
|
22
|
Teifke A, Behr O, Schmidt M, Victor A,
Vomweg TW, Thelen M and Lehr HA: Dynamic MR imaging of breast
lesions: Correlation with microvessel distribution pattern and
histologic characteristics of prognosis. Radiology. 239:351–360.
2006. View Article : Google Scholar : PubMed/NCBI
|
|
23
|
Yuan Y, Kuai XP, Chen XS and Tao XF:
Assessment of dynamic contrast-enhanced magnetic resonance imaging
in the differentiation of malignant from benign orbital masses. Eur
J Radiol. 82:1506–1511. 2013. View Article : Google Scholar : PubMed/NCBI
|
|
24
|
Nadrljanski M, Maksimović R,
Plešinac-Karapandžić V, Nikitović M, Marković-Vasiljković B and
Milošević Z: Positive enhancement integral values in dynamic
contrast enhanced magnetic resonance imaging of breast carcinoma:
Ductal carcinoma in situ vs. invasive ductal carcinoma. Eur
J Radiol. 83:1363–1367. 2014. View Article : Google Scholar : PubMed/NCBI
|
|
25
|
Wang S, Delproposto Z, Wang H, Ding X, Ji
C, Wang B and Xu M: Differentiation of breast cancer from
fibroadenoma with dual-echo dynamic contrast-enhanced MRI. PLoS
One. 8:e677312013. View Article : Google Scholar : PubMed/NCBI
|
|
26
|
Ishiyama M, Richards T, Parvathaneni U and
Anzai Y: Dynamic contrast-enhanced magnetic resonance imaging in
Head and Neck Cancer: Differentiation of new H&N cancer,
recurrent disease and benign post-treatment changes. Clin Imaging.
39:566–570. 2015. View Article : Google Scholar : PubMed/NCBI
|
|
27
|
Tuncbilek N, Karakas HM and Altaner S:
Dynamic MRI in indirect estimation of microvessel density,
histologic grade and prognosis in colorectal adenocarcinomas. Abdom
Imaging. 29:166–172. 2004. View Article : Google Scholar : PubMed/NCBI
|
|
28
|
Hong HS, Kim SH, Park HJ, Park MS, Kim KW,
Kim WH, Kim NK, Lee JM and Cho HJ: Correlations of dynamic
contrast-enhanced magnetic resonance imaging with morphologic,
angiogenic and molecular prognostic factors in rectal cancer.
Yonsei Med J. 54:123–130. 2013. View Article : Google Scholar : PubMed/NCBI
|