Introduction
Colorectal cancer (CRC) is the third most common
cancer and the second leading cause of cancer-related deaths in
both men and women globally (1).
Chemotherapy in combination with molecular targeted compounds is
the most widespread treatment for CRC, particularly metastatic CRC.
As the first-line treatment for metastatic CRC, modified
fluorouracil, leucovorin, and oxaliplatin (mFOLFOX6)-based
chemotherapy is one of the most common regimens used in Japan.
However, it was reported that the response rate to first-line
chemotherapy is approximately 50%. In addition, patients with
chemoresistant tumors experience adverse effects following
chemotherapy. There is a need for a minimally invasive biomarker
that can predict the therapeutic effect as early as possible.
Clinically, the therapeutic effects of chemotherapy can be
monitored using imaging modalities, such as CT, and tumor markers,
such as CEA and CA19-9. Because of the inherent radiation exposure,
CT examination cannot be performed frequently. Furthermore, CEA and
CA19-9 have unsatisfactory sensitivity as monitoring biomarkers.
Unfortunately, we have no strategy for predicting the response to
chemotherapy. Therefore, there is an urgent need to identify
effective biomarkers that can provide some indication of the likely
response or resistance to chemotherapy.
One candidate monitoring marker for chemotherapy is
microRNA (miRNA) (2–10). MiRNAs are short (20–24 nucleotides)
non-coding RNAs that are involved in the post-transcriptional
regulation of gene expression in multicellular organisms by
affecting both the stability and translation of mRNAs. MiRNAs
target protein-coding mRNAs at the post-transcriptional level via
direct cleavage of mRNAs or inhibition of protein synthesis
(11–13). Recent studies identified these miRNAs
in plasma and serum (plasma/serum), and their importance as
minimally invasive liquid biomarkers for patients with cancer has
been reported (2–10).
Several papers reported that circulating miRNA
levels could reflect the treatment response to chemotherapy in
patients with CRC (14–16). Furthermore, it is noteworthy that
these miRNAs have also been identified in plasma/serum exosomes in
a remarkably stable form that is protected against endogenous RNase
activity (17). Exosomes are
nano-sized vesicles (40–150 nm) derived from the luminal membranes
of multivesicular bodies that are released via fusion with the cell
membrane (18–20). Exosomes can contain tissue-specific
signature proteins and intact miRNAs and transfer these components
to other cells (18–20). Therefore, exosomal miRNAs (ex-miRNAs)
may include potential biomarkers (21–23).
In the present study, we aimed to clarify the
potential of plasma ex-miRNAs as minimally invasive liquid
biomarkers for the early detection of resistance to mFOLFOX6-based
chemotherapy in patients with advanced or recurrent
(advanced/recurrent) CRC.
Patients and methods
Study design
First, we selected the exosomal miRNAs associated
with resistance to mFOLFOX6 chemotherapy using a miRNA microarray.
In this microarray analysis, samples were collected from patients
with advanced CRC and stable disease (SD, n=3) or progressive
disease (PD, n=3), as well as healthy volunteers (n=3). Next, we
validated the usefulness of the selected miRNA (miR-125b) in an
additional 55 patients with advanced/recurrent CRC. These patients
were treated with mFOLFOX6-based chemotherapy in the first-line
setting. These patients were observed from August 2007 to October
2017 at Teikyo University Hospital. The median follow-up period for
first-line chemotherapy was 7 months (range, 2–30 months).
Peripheral blood samples for ex-miR-125b measurement were collected
from each patient before treatment and at various points during
first-line mFOLFOX6-based chemotherapy until treatment were halted.
In addition, 40 patients with stage I (10 cases), II (10 cases),
III (10 cases), and IV CRC (10 cases) underwent examination of the
correlation between plasma ex-miR-125b levels and miR-125b
expression in tumor tissues. Blood samples were collected before
treatment, and primary CRC tissues were collected during surgery.
Healthy controls (n=30) consisted of healthy Japanese subjects with
a similar average age (63 years) and gender ratio (male: Female
=5:4) as patients with CRC.
The protocol of our study conformed according to the
guidelines of the institutional ethics committee, and it was
approved by the review board of Teikyo University (09-081-3).
Written informed consent was obtained from all patients included in
the present study.
Follow-up of patients after
chemotherapy
Blood samples were collected every 2–3 weeks
according to the chemotherapy protocol. Response to chemotherapy
was evaluated according to Response Evaluation Criteria in Solid
Tumors (RECIST) every 3 months. The therapeutic response criteria
of the target lesion were classified into four groups: Complete
response (CR), partial response (PR), SD, and PD. CR was denoted by
the disappearance of the entire lesion. In this case, any
pathological lymph nodes (whether target or non-target) must have a
reduction in the short axis to <10 mm. PR was denoted by an at
least 30% decrease in the sum of the diameters of the target
lesions compared with the baseline sum diameters. PD was denoted by
an at least 20% increase in the sum of the diameters of the target
lesions compared with the smallest sum in the study (this includes
the baseline sum if it were the smallest in the study). In addition
to the relative increase of 20%, the sum must also display an
absolute increase of at least 5 mm. The appearance of one or more
new lesions was also considered progression. SD was indicated by
the presence of insufficient shrinkage to qualify as a PR or a
sufficient increase to qualify as PD compared with the smallest sum
diameters in the study. Patients with PR after chemotherapy at any
time point during first-line chemotherapy were included in the PR
group. Patients who did not exhibit a PR or PD during first-line
chemotherapy were classified into the SD group. Patients who did
not achieve a PR at any time point but exhibited PD during
first-line chemotherapy were classified into the PD group. The time
point when the classification of patients was performed was defined
as the ‘judgment point.’ The judgment point for patients in the PR
or PD group was the time when the PR or PD was first observed. The
judgment point for patients in the SD group was the time at which
the final evaluation of RECIST was performed during first-line
chemotherapy.
Purification of exosomes, electron
microscopic imaging, and flow cytometry analysis
Peripheral blood was separated via centrifugation at
1,200 × g for 10 min at 4°C to collect plasma. One milliliter of
plasma was used for microarray analysis and quantitative real-time
reverse transcription-PCR (qRT-PCR). The exosomes of plasma were
purified using a previously described ultracentrifugation method
(100,000 × g for 70 min at 4°C) and stored at −80°C (24). The morphology of the isolated
exosomes was confirmed via electron microscopy (HITACHI H-7600,
Japan) as described previously (24). As a marker of exosomes, CD9
expression was analyzed by flow cytometry analysis using an
Exo-FACS (Hansa Biomed Life-Sciences, Estonia) according to the
manufacturer's protocol. For flow cytometry, FACSCanto™ II and
FACSDiva™ software (v 8.0) (Becton, Dickinson and Company,
NewJersey, USA) were used. After the gating to not aggregated
fraction, fluorescence intensity of the exosome capture beads was
detected. As negative control, fluorescence labeled mouse IgG
isotype control was used.
Extraction of total RNAs from plasma
exosomes and tissues
The total RNAs of exosomes were extracted using a
miRNeasy serum/plasma kit (Qiagen, Hilden, Germany). Exosomes
purified from specific volumes of plasma were diluted with 1 ml of
Qiazol Lysis Reagent. After incubation for 5 min, 3.5 µl of a
spike-in control (cel-miR-39 mimic) were added to each sample.
Subsequent extraction and cartridge work were then performed
according to the manufacturer's protocol. The total RNAs of the
frozen tumor tissues and normal tissues were extracted using a
miRNeasy Mini Kit (Qiagen) according to the manufacturer's
protocol. RNA quality was assessed using an Agilent 2100
Bioanalyzer (Agilent Technologies, CA, USA).
MiRNA microarray analysis
The miRNA expression profiles of the exosomes were
examined using a 3D-Gene Human miRNA Oligo chip ver. 20 (TORAY Co.,
Ltd., Tokyo, Japan), according to the manufacturer's protocol. In
total, 2578 genes were mounted onto the chip. The raw data from
each spot were normalized by subtracting the background signal mean
intensity, which was determined using the 95% confidence intervals
of the signal intensities of all blank spots. Valid measurements
were considered those in which the signal intensity of both
duplicate spots was >2 standard deviations (SDs) of the
background signal intensity.
qRT-PCR for miRNAs of plasma exosomes
and tissues
MiRNA expression in the plasma exosomes and tissues
was measured via qRT-PCR. In the exosomes, cDNA was synthesized
from the total RNA using TaqMan MicroRNA primers specific for
miR-125b (Thermo Fisher Scientific Inc., Waltham, MA, USA) and a
TaqMan Micro-RNA Reverse Transcription Kit (Thermo Fisher
Scientific Inc.). MiR-16a was used as an internal control. In the
tissues, cDNA was synthesized from the total RNA using TaqMan
MicroRNA primers specific for miR-125b (ID 00049) and RNU6B (ID
001093; Thermo Fisher Scientific Inc.) and a TaqMan Micro-RNA
Reverse Transcription Kit. RNU6B was used as an internal control.
qRT-PCR was performed using a Lightcycler-480 (Roche Applied
Science, Basel, Switzerland) and TaqMan Universal PCR Master Mix
(Life Technologies) according to the manufacturers' protocols. PCR
reaction mixtures were incubated at 95°C for 10 min for
denaturation, followed by 45 amplification cycles of 95°C for 15
sec and 60°C 1 min, and 40°C for 30 sec for extension. Each sample
was analyzed in duplicate. The relative miRNA expression was
calculated using the 2−ΔΔCT method as described
previously (24,25).
Statistical analysis
The data were expressed as the mean ± SD. The
relationship between RECIST and patient characteristics were
analyzed using Student's t-test, the chi-squared test, and ANOVA.
The Tukey-Kramer method was used as the post hoc test following
ANOVA. Progression-free survival (PFS) curves were analyzed using
the Kaplan-Meier survival curve method, and the differences were
examined using log-rank tests. The cut-off value of relative
quantification for miR-125b was set as 0.42, which was the median.
Cox proportional-hazard regression analysis was used to estimate
the univariate and multivariate hazard ratios for PFS. Univariate
analysis was conducted for each factor, and multivariate analysis
was performed for factors displaying significance in univariate
analysis. All p-values were two-sided, and P<0.05 was considered
statistically significant. Statistical analyses were performed
using JMP 9.0 software (SAS Inst. Inc. NC, Japan).
Results
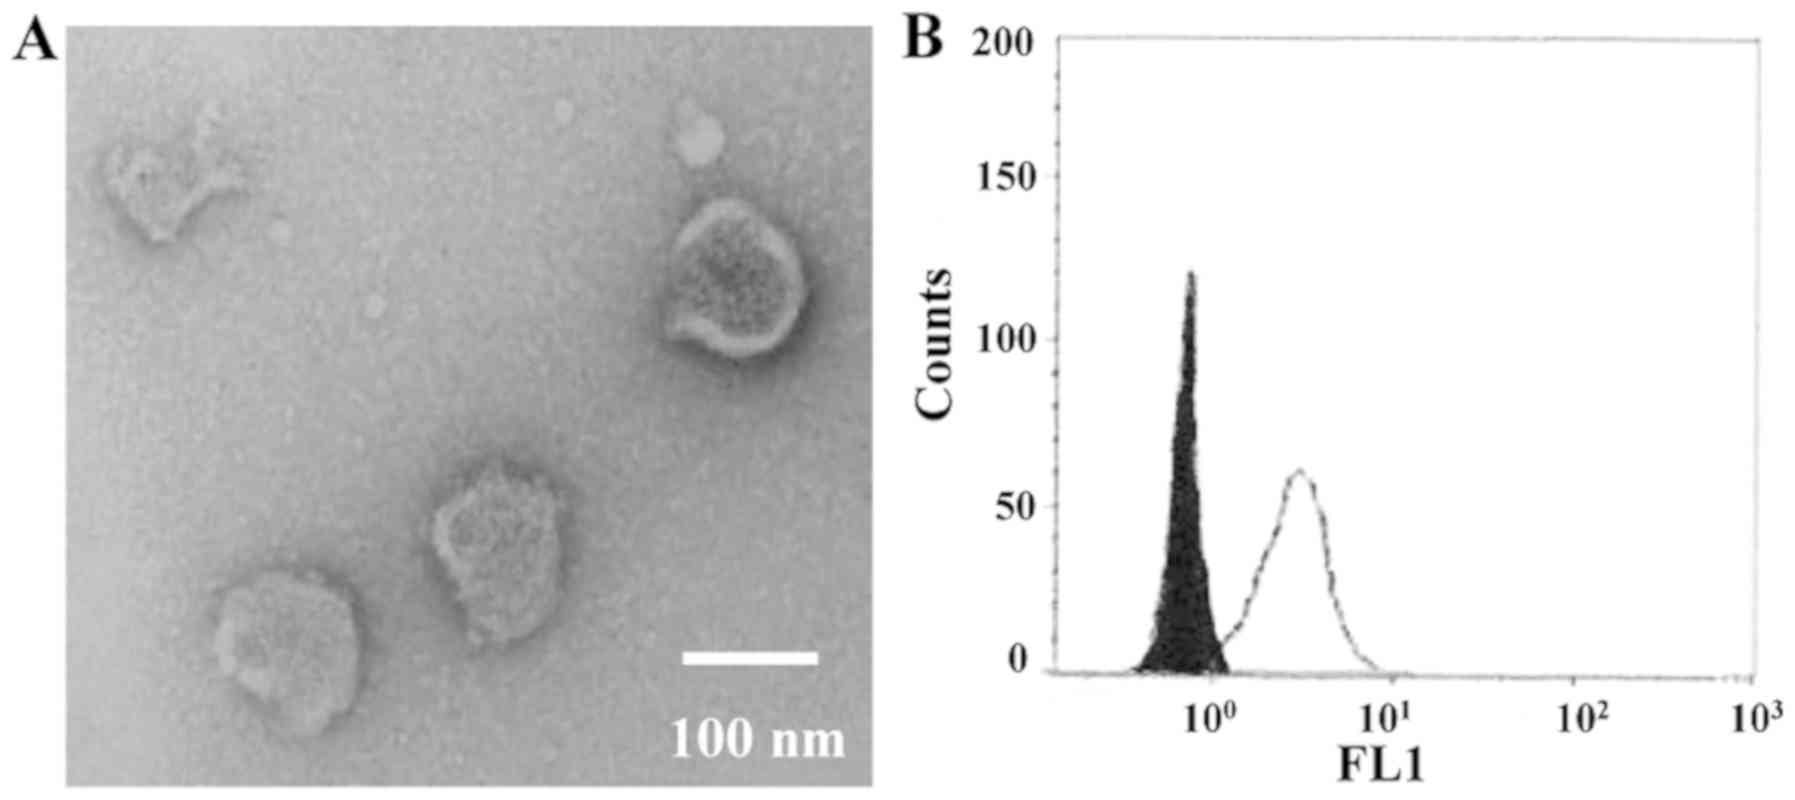
Identification of exosomes in
plasma
To verify the isolation of exosomes from the
ultracentrifuged samples of patients with CRC, morphological
identification using transmission electron microscopy and surface
marker analysis using FACS were performed (Fig. 1). Using electron microscopy, images
of the round microvesicles with diameters of approximately 50–100
nm were captured, as shown in Fig.
1A. In the FACS analysis, CD9-positive exosomes were confirmed
(Fig. 1B).
Exosomal miRNA profiling via miRNA
array analysis
To identify the ex-miRNA associated with resistance
to mFOLFOX6, we conducted miRNA array analysis of plasma exosome
samples collected from patients with SD or PD as well as healthy
controls (each n=3). The clinical data and background of the
patients with CRC and healthy volunteers are described in Table SI and SII. No significant difference in race,
sex, or average age was noted between patients with CRC and healthy
volunteers. Table I shows the five
most highly upregulated ex-miRNAs in patients with PD compared with
those in patients with SD and healthy controls. In these
comparisons, miR-125b (MIMAT0000423) displayed the highest fold
changes as in patients with PD compared with the findings in
patients with SD (3.56-fold) and healthy controls (4.41-fold).
Based on these results, we selected ex-miR-125b as a predictive
marker for resistance to mFOLFOX6-based chemotherapy in patients
with advanced/recurrent CRC.
 | Table I.Five most highly upregulated plasma
ex-miRNAs of patients with PD in comparison with those with SD and
healthy volunteers |
Table I.
Five most highly upregulated plasma
ex-miRNAs of patients with PD in comparison with those with SD and
healthy volunteers
|
|
|
| Fold changes |
|---|
|
|
|
|
|
|---|
| Ranks | miRNA | MirBase no. | PD patients vs.
healthy volunteersa | PD patients vs. SD
patientsb |
|---|
| 1 | miR-125b | MIMAT0000423 | 4.41 | 3.56 |
| 2 | miR-19a | MIMAT0000073 | 4.02 | 3.32 |
| 3 | miR-21 | MIMAT0000076 | 3.98 | 2.91 |
| 4 | miR-106a | MIMAT0000103 | 3.87 | 2.85 |
| 5 | miR-155 | MIMAT0000046 | 3.43 | 2.61 |
Patient characteristics and
RECIST
In our study, the patients were divided into two
groups, namely the PR or SD (PR/SD) (n=8) and PD groups (n=47).
Table II provides a comparison of
patient characteristics between these groups. There were no
significant differences in age, gender, tumor location, metastatic
site, KRAS mutation status, performance status, and serum CA19-9
and CEA levels before chemotherapy between the two groups.
| Table II.Comparison of patient characteristics
in the PR/SD and PD groups. |
Table II.
Comparison of patient characteristics
in the PR/SD and PD groups.
| Variables | PR/SD (n=8) number
(%) | PD (n=47) number
(%) | P-value |
|---|
| Age (year) | 64.5±4.8 | 62.4±11.3 | 0.60 |
| Sex |
|
|
|
|
Male | 5 (62.5) | 26 (55.3) | 0.71 |
|
Female | 3 (37.5) | 21 (44.7) |
|
| Location |
|
|
|
|
Colon | 3 (37.5) | 31 (66.0) | 0.13 |
|
Rectum | 5 (62.5) | 16 (34.0) |
|
| Metastatic
sites |
|
|
|
| 1 | 4 (50.0) | 17 (36.2) | 0.46 |
|
>1 | 4 (50.0) | 30 (63.8) |
|
| KRAS |
|
|
|
|
Mutation | 2 (25.0) | 26 (55.3) | 0.08 |
|
Wild-type | 6 (75.0) | 21 (46.7) |
|
| Performance status
(ECOG) |
|
|
|
| 0 | 1 (12.5) | 5 (10.6) | 0.10 |
| 1 | 5 (62.5) | 40 (85.1) |
|
| 2 | 2 (25.0) | 2 (4.3) |
|
| Serum
CA19-9a |
|
|
|
| ≤37.0
u/ml | 5 (62.5) | 21 (44.7) | 0.35 |
|
>37.0 u/ml | 3 (37.5) | 26 (55.3) |
|
| Serum
CEAa |
|
|
|
| ≤5.0
ng/ml | 4 (50.0) | 16 (34.0) | 0.39 |
| >5.0
ng/ml | 4 (50.0) | 31 (66.0) |
|
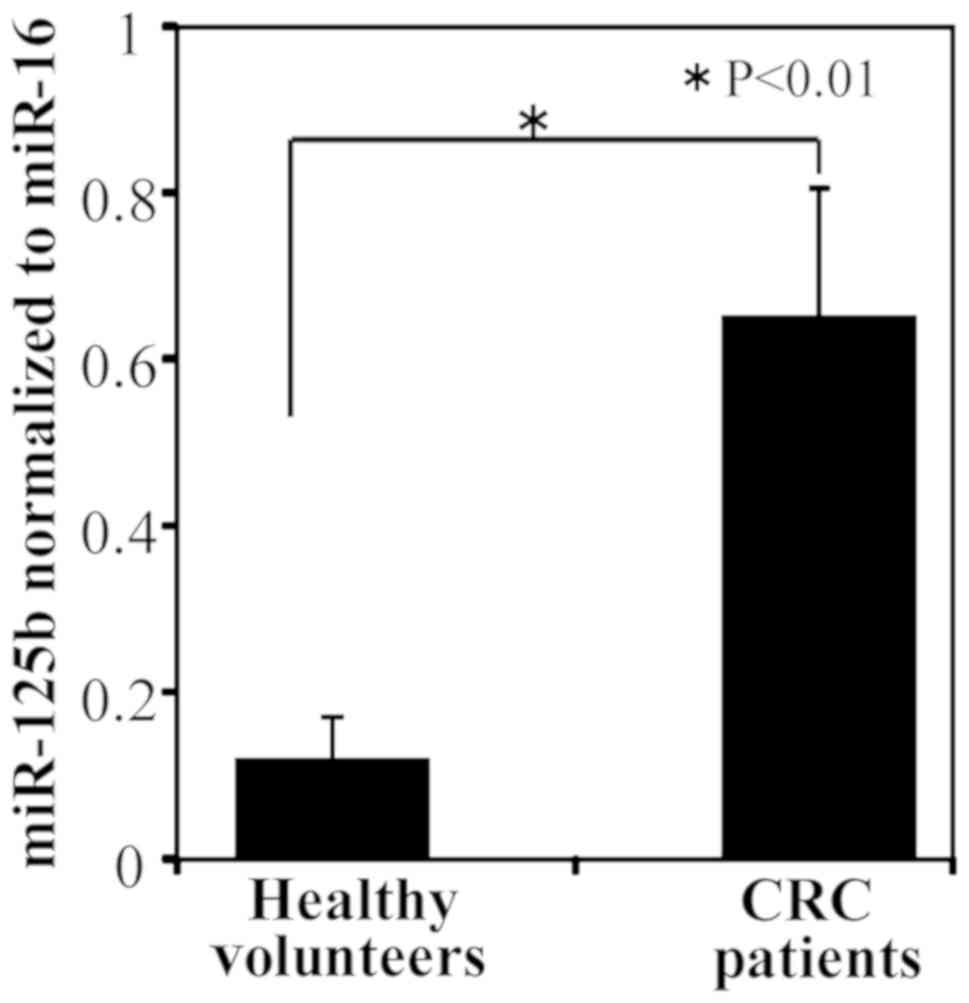
Comparison of ex-miR-125b levels
between patients with CRC and healthy controls
A comparison of ex-miR-125b levels between patients
with CRC and healthy controls is shown in Fig. 2. Patients with CRC had significantly
higher ex-miR-125b levels than healthy controls.
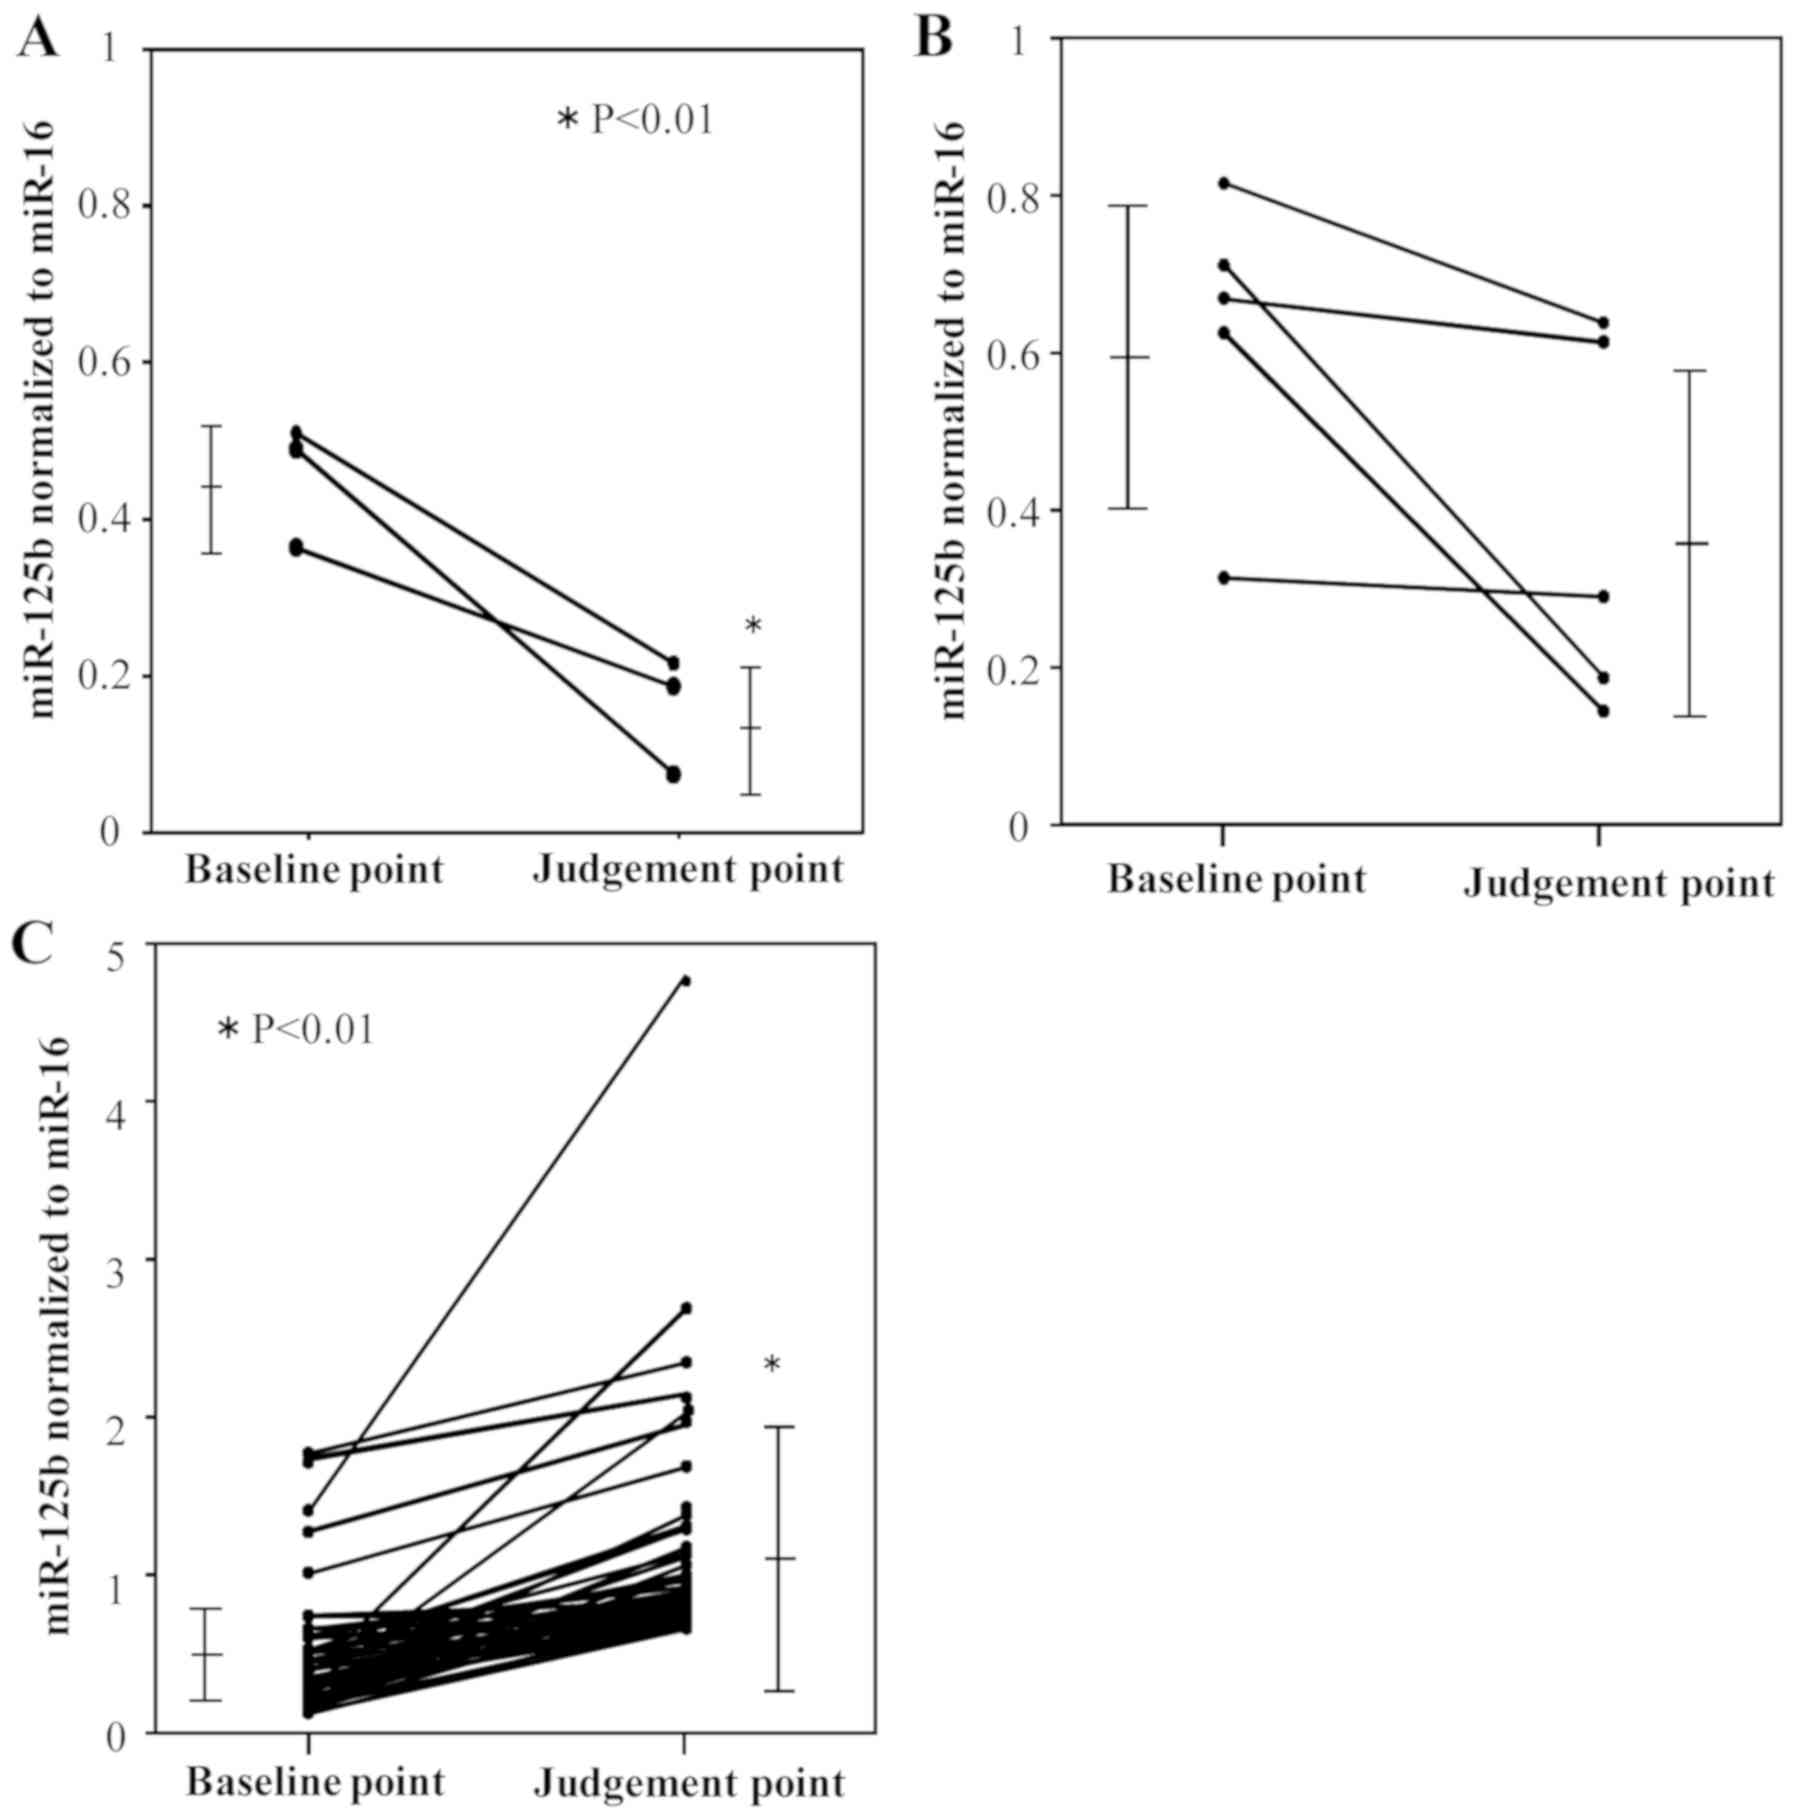
Ex-miR-125b levels and RECIST
First, plasma ex-miR-125b levels were compared at
each point during mFOLFOX6-based treatment (Fig. 3). In patients with PR, ex-miR-125b
levels after 1, 2, and 3 months of treatment were significantly
lower than those measured before treatment (Fig. 3A). In patients with SD, there were no
significant differences of ex-miR-125b levels between before and
during treatment (Fig. 3B). In
patients with PD, ex-miR-125b levels after 1, 2, 3, 6, 9, and 12
months of treatment were significantly higher than those measured
before treatment (Fig. 3C).
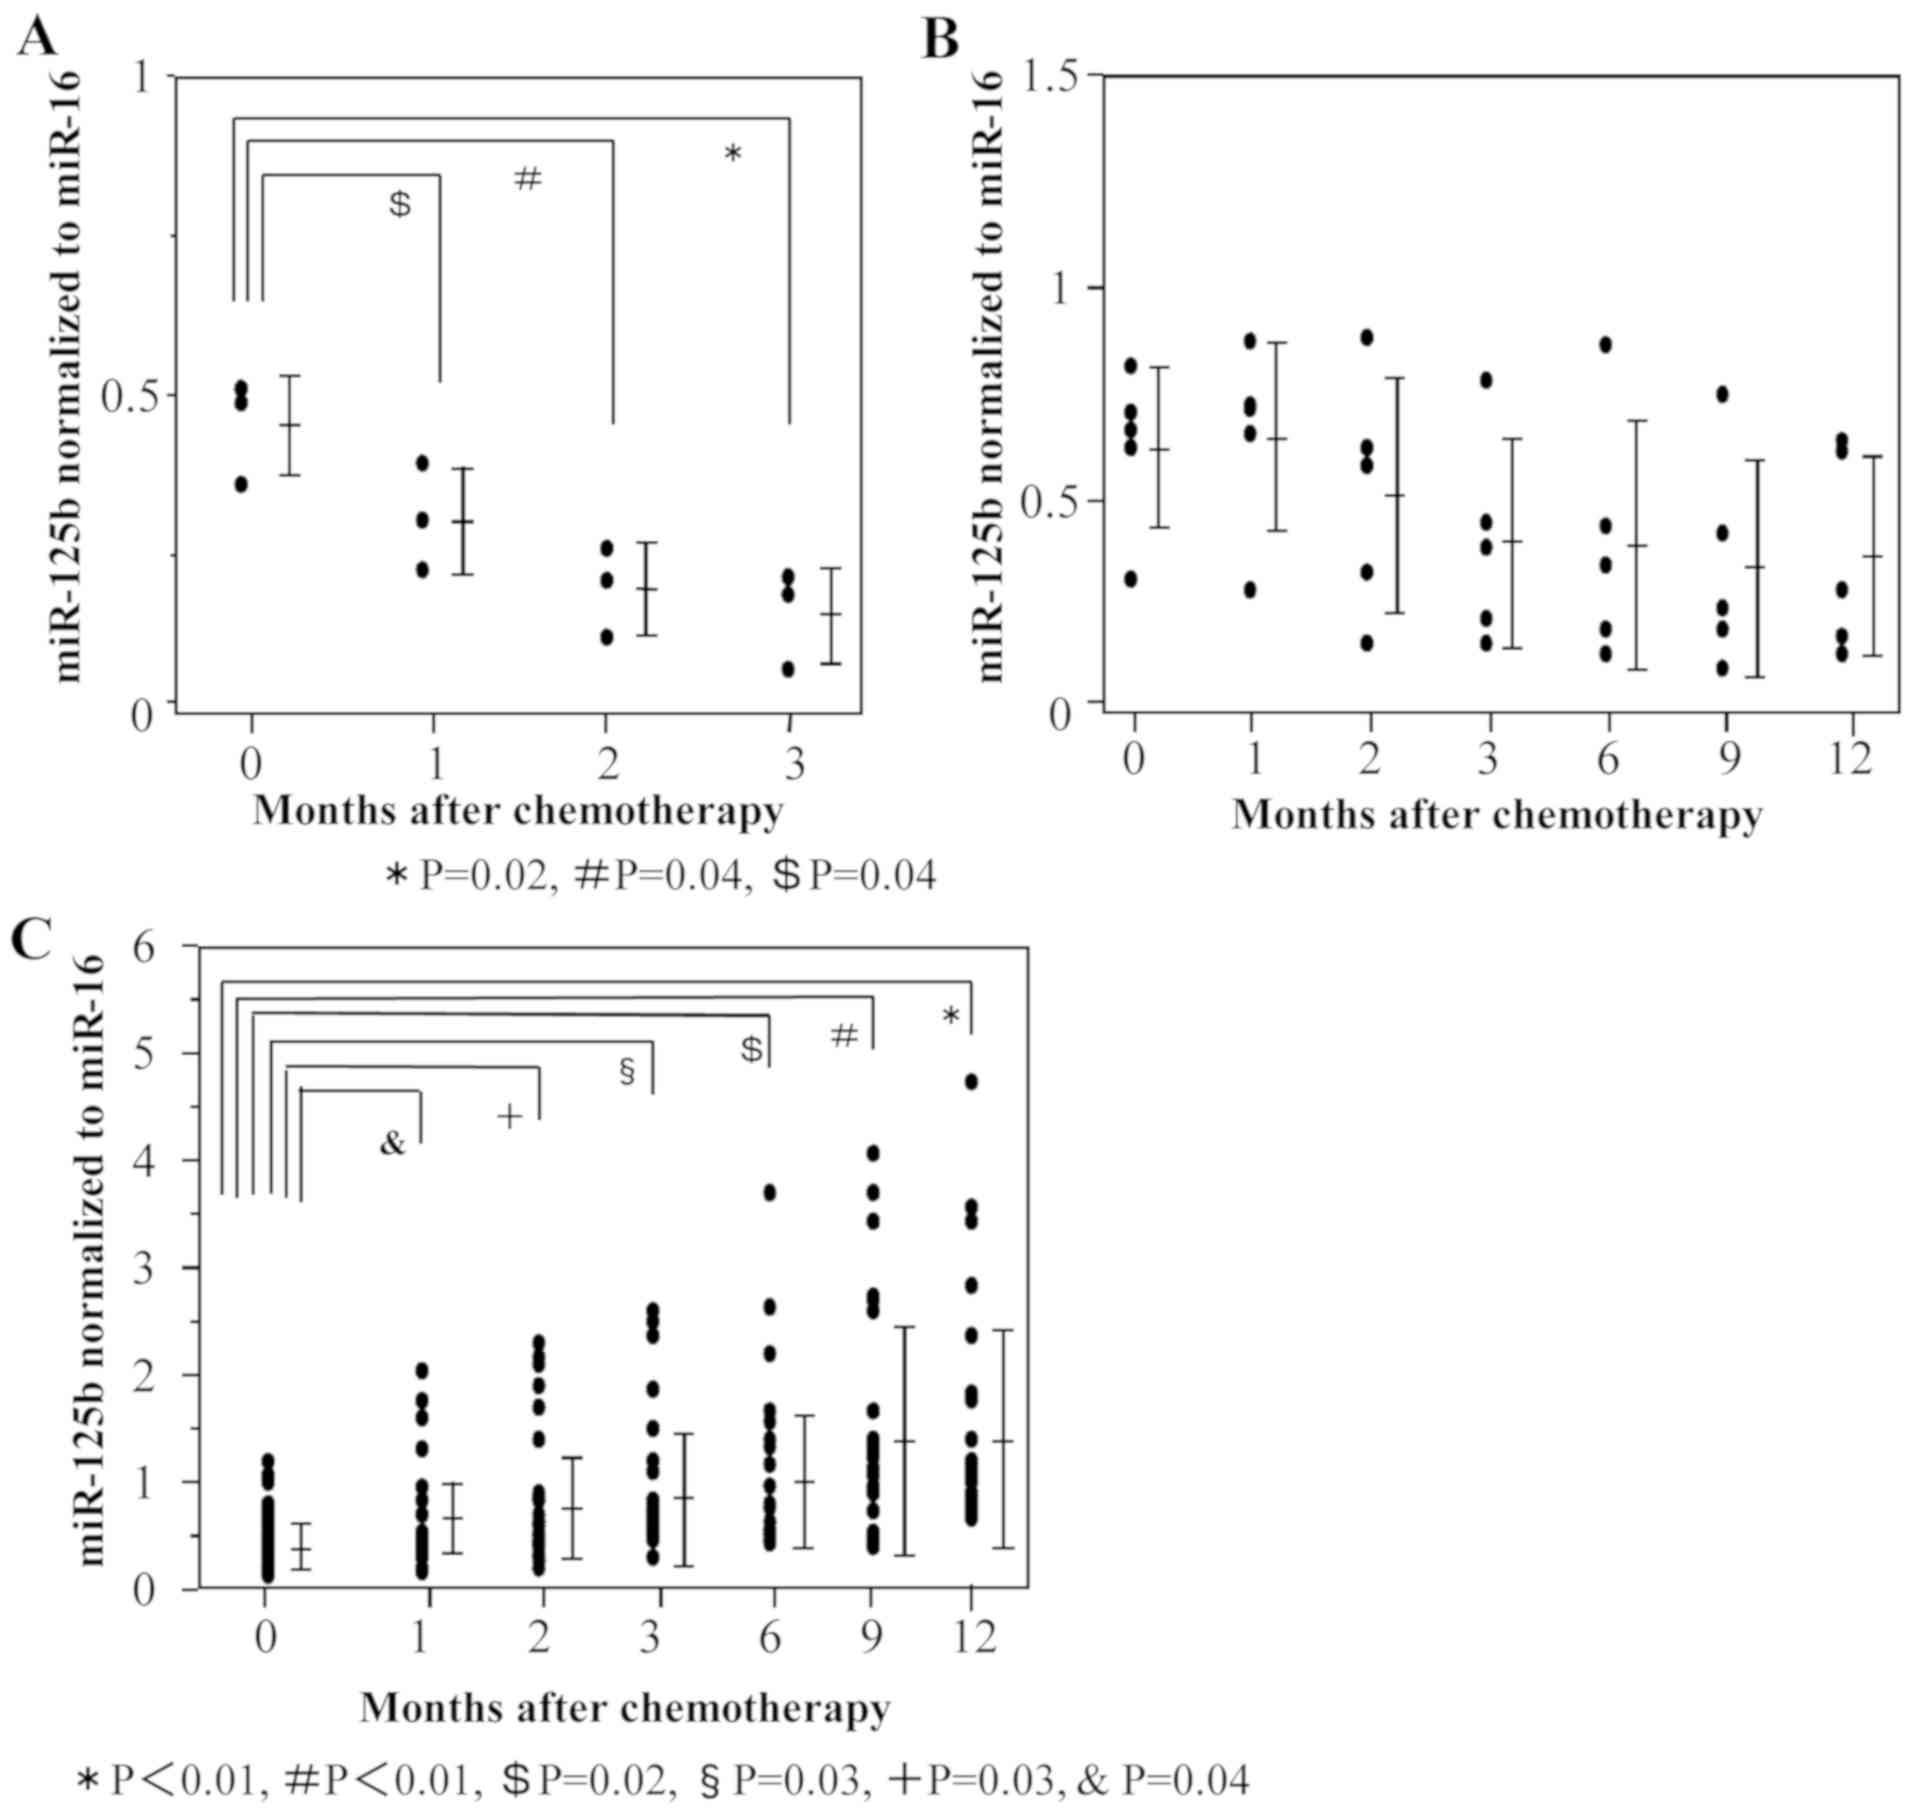 | Figure 3.Changes of ex-miR-125b levels in the
PR, SD and PD groups during treatment. Ex-miR-125b levels before
chemotherapy and after 1, 2, 3, 6, 9 and 12 months of
mFOLFOX6-based chemotherapy were compared among patients with (A)
PR, (B) SD and (C) PD. Ex-miR-125b, exosomal microRNA-125b; PR,
partial response; SD, stable disease; PD, progressive disease. |
Next, plasma ex-miR-125b levels were compared at two
time points, namely before treatment initiation (baseline point)
and the judgment point (Fig. 4). The
judgment point was 3 months after treatment initiation for patients
with PR (n=3). The judgment point was 6 (n=1), 9 (n=1), or 12
months (n=3) for patients with SD, whereas that for patients with
was 3 (n=7), 6 (n=13), 9 (n=8), or 12 months (n=19). Among patients
with PR, ex-miR-125b levels were significantly lower at the
judgment point than at the baseline point (Fig. 4A). Among patients with SD,
ex-miR-125b levels did not significantly differ between these two
points (Fig. 4B). Among patients
with PD, ex-miR-125b levels were significantly higher at the
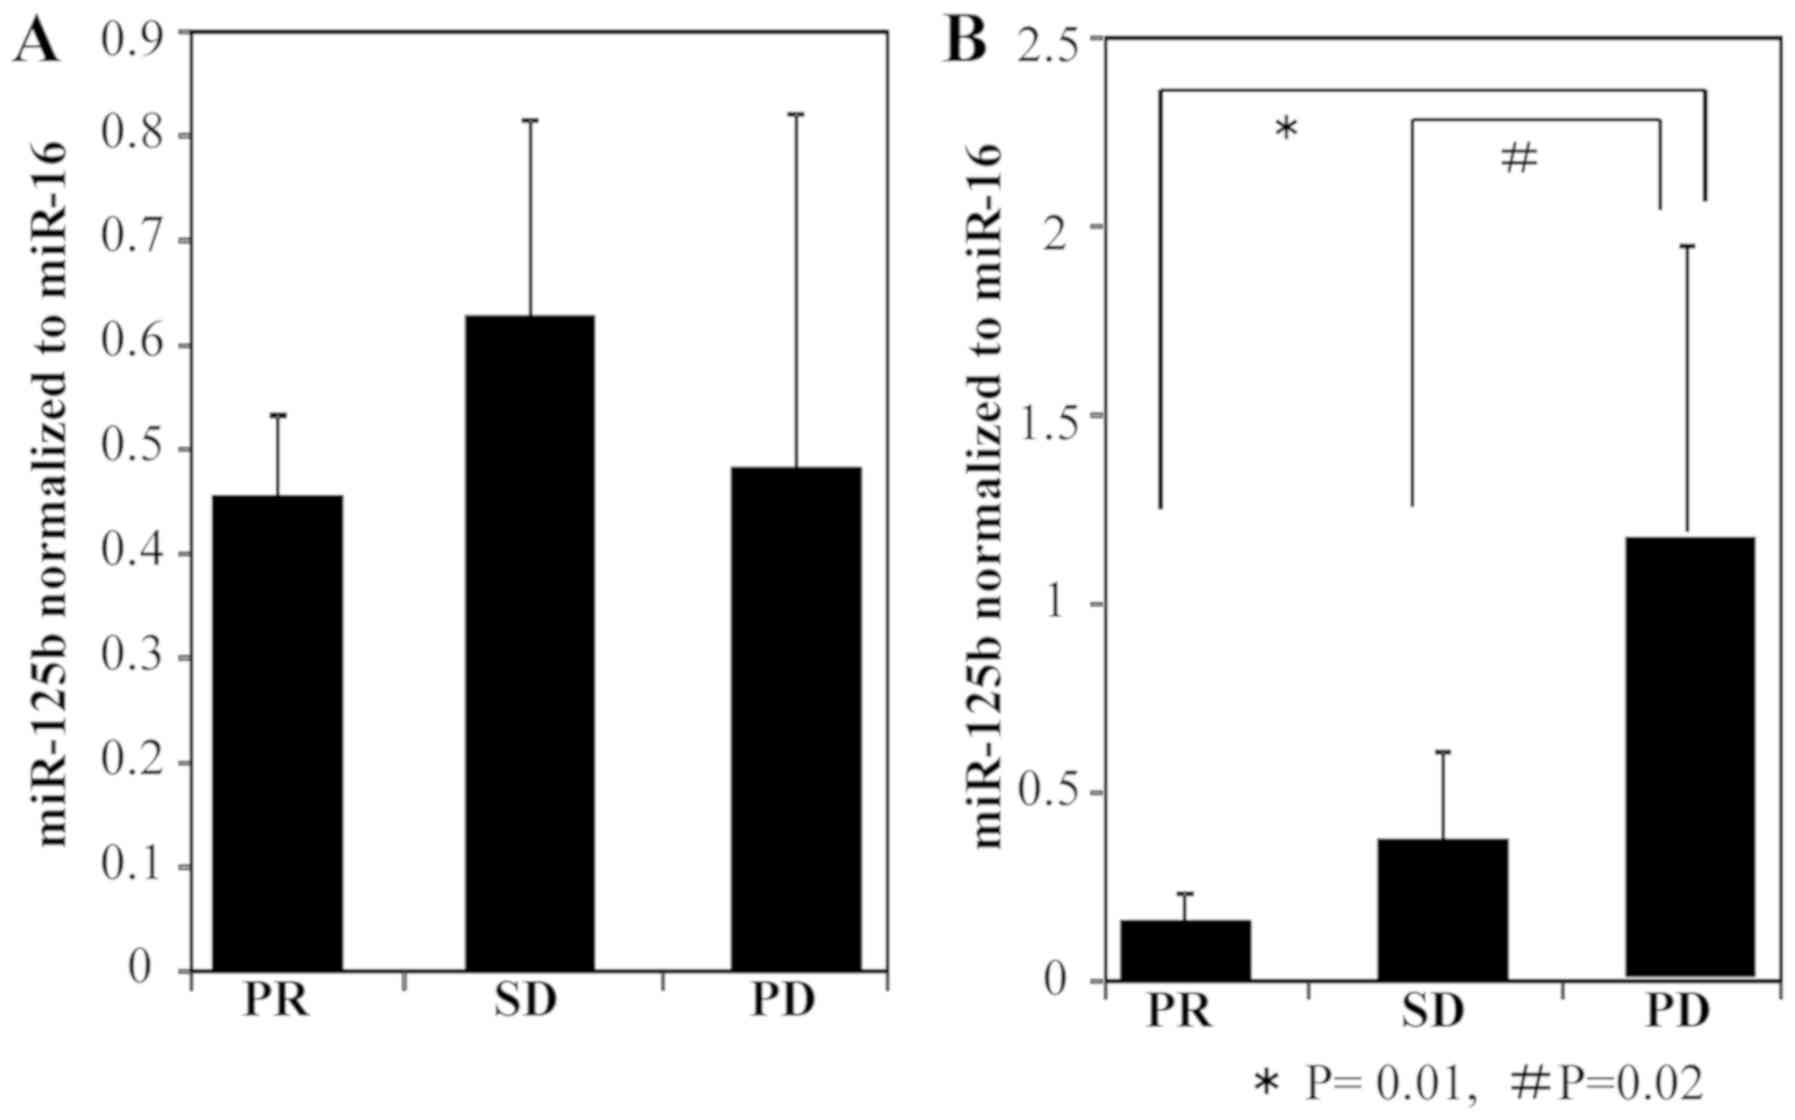
judgment point than at the baseline point (Fig. 4C). In addition, ex-miR-125b levels
were compared among the PR, SD, and PD groups at the baseline and
judgment points (Fig. 5). At the
baseline point, ex-miR-125b levels did not differ among the three
groups (Fig. 5A). At the judgment
point, ex-miR-125b levels were significantly higher in the PD group
than in the PR and SD groups (Fig.
5B).
These results support the potential of ex-miR-125b
as a biomarker for the early selection of resistance to
mFOLFOX6-based treatment.
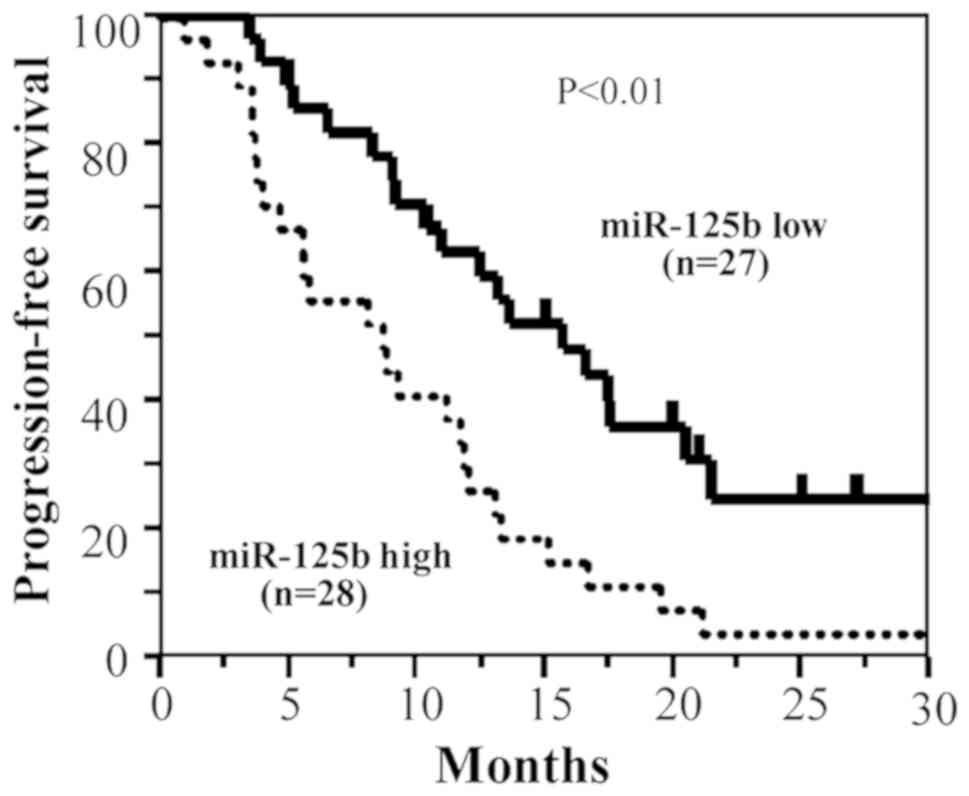
Kaplan-Meier PFS curves based on
ex-miR-125b levels
The Kaplan-Meier PFS curves of patients with
advanced/recurrent CRC (n=55) were compared according to the
presence of low or high ex-miR-125b levels. In this analysis,
patients with high ex-miR-125b levels exhibited significantly worse
PFS than those with low levels (Fig.
6).
Cox analysis of PFS based on
ex-miR-125b levels
The results of Cox univariate and multivariate
regression analyses for PFS are shown in Table III. As variables, gender, location,
metastatic site, KRAS mutation, performance status, serum CEA,
serum CA19-9 and ex-miR-125b were examined. In the univariate
analysis, KRAS mutation and ex-miR-125b were identified as
significant variables for PFS, and these variables remained
significance in multivariate analysis.
| Table III.Cox univariate and multivariate
analyses of prognostic factors for PFS in patients with colorectal
cancer. |
Table III.
Cox univariate and multivariate
analyses of prognostic factors for PFS in patients with colorectal
cancer.
|
| Univariate
analysis | Multivariate
analysis |
|---|
|
|
|
|
|---|
| Variables | Regression
coefficient | HR (95% CI) | P-value | Regression
coefficient | HR (95% CI) | P-value |
|---|
| Sex | 0.02 | 1.02
(0.56–1.83) | 0.937 |
|
|
|
| Location | −0.17 | 0.84
(0.44–1.54) | 0.577 |
|
|
|
| Metastatic
sites | 0.03 | 1.06
(0.51–2.19) | 0.867 |
|
|
|
| KRAS | 0.56 | 0.78
(0.46–0.89) | 0.041 | 0.79 | 0.85
(0.56–0.97) | 0.047 |
| Performance Status
(ECOG) | −0.45 | 0.41
(0.10–1.69) | 0.215 |
|
|
|
| Serum
CA19-9a | −0.01 | 0.99
(0.54–1.78) | 0.973 |
|
|
|
| Serum
CEAa | 0.02 | 1.02
(0.55–1.45) | 0.159 |
|
|
|
| miR-125b
baseline | −0.66 | 0.52
(0.27–0.95) | 0.035 | 1.04 | 0.71
(0.36–0.94) | 0.041 |
These results suggest that ex-miR-125b has
independent prognostic value for PFS in patients with
advanced/recurrent CRC.
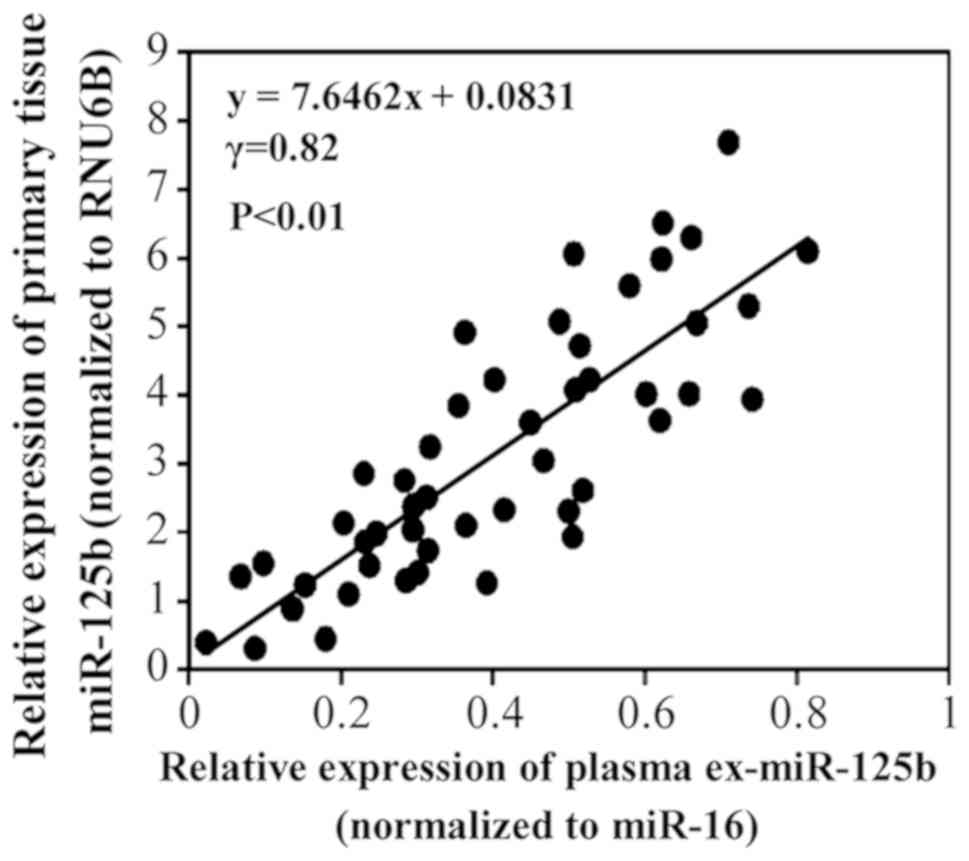
MiR-125b expression in plasma exosomes
and primary tumor tissues
Fig. 7 shows the
correlation of miR-125b levels between plasma exosomes and primary
tumor tissues in the same patients. A positive correlation was
observed between the levels.
Discussion
In the present study, we demonstrated the potential
of ex-miR-125b as a minimally invasive liquid biomarker for the
early selection of patients with CRC with resistance to
mFOLFOX6-based first-line chemotherapy. In addition, our data
demonstrated that ex-miR-125b is an independent predictive factor
for PFS.
Chemotherapy is the first-line treatment for
unresectable advanced/recurrent CRC, with mFOLFOX6-based
chemotherapy being the most common regimen. Despite an improvement
in the overall prognosis of patients with CRC, these
chemotherapeutics fail to work in the majority of patients because
of intrinsic or acquired drug resistance. Unfortunately, no
effective biomarkers that can monitor resistance to mFOLFOX6-based
chemotherapy are available, and thus, the identification of a new
biomarker is highly desired.
Recently, circulating plasma/serum miRNAs have
attracted interest as novel biomarkers for diagnosis and the
prediction of prognosis for various cancers including CRC.
Previously, we reported the usefulness of ex-miR-21 in the
prediction of recurrence and prognosis in patients with stage II,
III, or IV CRC (24). However, few
studies examined the potential of plasma ex-miRNA for the early
detection of resistance to chemotherapy in patients with CRC.
Initially, we searched for plasma ex-miRNAs predicting resistance
to mFOLFOX6-based treatment via a genome-wide miRNA profiling
approach using microarray analysis. Our research indicated that
ex-miR-125b was remarkably upregulated in patients with PD compared
with its levels in patients with SD and healthy controls. Based on
these results, we selected miR-125b as a biomarker for resistance
to mFOLFOX6-based chemotherapy in patients with advanced/recurrent
CRC.
Until now, studies of biomarkers using free
plasma/serum microRNAs not encapsulated in exosomes have also been
reported. In our preliminary experiments, we compared the levels of
plasma free miR-125b and ex-miR-125b. We found that the free
miR-125b levels were unstable compared to those of ex-miR-125b. In
particular, the free plasma miRNA levels markedly decreased in
samples that had been frozen for a long period (data not shown). To
obtain stable and reliable data, we measured ex-miR-125b, but not
free plasma miR-125b. Furthermore, we compared the usefulness of
free miR-16 and ex-miR-16 as internal standard, and found that
ex-miR-16 is stable and can use as an internal standard in CRC
patients (data not shown). Other studies have also used ex-miR-16
as an internal standard of CRC (26).
MiR-125b was one of the first miRNAs identified in
C. elegans (27). MiR-125b
belongs to the miR-125 family, consisting of miR-125a, miR-125b-1,
and miR-125b-2, which result in almost identical products of
distinct genes. Several tumors including breast, gastric and
pancreatic cancer lesions exhibit upregulated miR-125b expression
(27). In the present study, we
demonstrated that plasma ex-miR-125b levels were significantly
higher in patients with CRC than in healthy controls. Yamada et
al also recorded elevated serum miR-125b levels in patients
whose total CRC diameters were 5 mm or less (28). These results suggest that miR-125b
could discriminate between patients with early CRC and healthy
controls.
Next, we examined the relationship between
ex-miR-125b levels and resistance to mFOLFOX6-based first-line
chemotherapy in patients with advanced/recurrent CRC. In patients
with PR, miR-125b levels were significantly lower at the judgment
point than at the baseline point. Among patients with SD, no
significant differences in miR-125b levels were noted. Among
patients with PD, miR-125b levels were significantly higher at the
judgment point than at the baseline point. These results indicated
a significant association between ex-miR-125b levels and tumor
status. Furthermore, our results demonstrated that ex-miR-125b
levels significantly changed after 1 month of mFOLFOX6-based
first-line treatment in patients with PR and PD. These results
suggest that ex-miR-125b can facilitate the early selection of
patients exhibiting resistance to mFOLFOX6-based chemotherapy.
Prior studies revealed associations of elevated miR-125b expression
with chemoresistance and metastasis. Using biopsy samples, Svoboda
et al reported that high miR-125b and miR-137 levels are
associated with worse response to capecitabine chemoradiotherapy in
patients with rectal cancer (29).
D'Angelo et al reported that high miR-125b
expression in tissue and serum was associated with a poor treatment
response in locally advanced rectal cancer (30). Interestingly, Tanaka et al
identified miR-125b-1 expression in cancer tissues as a predictive
biomarker for the efficacy of peptide vaccine treatment against CRC
(31). However, our study is the
first to demonstrate the potential of plasma ex-miR-125b as a
biomarker for the early detection of resistance to mFOLFOX6-based
chemotherapy in advanced/recurrent CRC.
Furthermore, we demonstrated that PFS was
significantly worse in patients with high ex-miR-125b levels than
in those with low levels. Cox multivariate analysis identified
ex-miR-125b as an independent predictive biomarker for PFS.
Regarding plasma miRNAs and PFS, Hansen et al reported that
changes in circulating plasma miR-126 levels during treatment are
related to PFS in patients with metastatic CRC treated with
bevacizumab (32). However, no paper
has discussed the relationship between ex-miR-125b and PFS. To the
best of our knowledge, this is the first study to clarify the
predictive value of plasma ex-miR-125b levels for PFS in patients
with advanced/recurrent CRC treated with mFOLFOX6-based
chemotherapy.
Numerous studies demonstrated the roles of miR-125b
in cell proliferation, apoptosis, and differentiation, suggesting
its potentially important role during carcinogenesis. MiR-125b
expression has been detected in several tumor types. MiR-125b
appears to downregulate anti-apoptotic proteins, resulting in
reduced apoptosis and enhanced cellular proliferation, thereby
promoting tumor growth. Recent studies found that miR-125b directly
targets the tumor suppressor gene p53, which is essential for the
maintenance of genome stability and plays a central role in
regulating apoptosis. Using CRC cell lines, Lu et al
reported that miR-125b and miR-100 mediate cetuximab resistance via
negative regulation of Wnt/β-catenin (33).
However, we recognize some limitations of our study.
Because of the small number of patients with CR (n=0) and PR (n=3),
we compared the PR/SD (n=8) and PD (n=47) groups, but not the CR/PR
and SD/PD groups, before analyzing the clinical data. To clarify
the usefulness of ex-miR-125b as a monitoring biomarker for
mFOLFOX6-based chemotherapy, a larger prospective study comparing
the CR/PR and SD/PD groups is required.
In summary, we identified ex-miR-125b as a promising
minimally invasive biomarker for the early detection of resistance
to mFOLFOX6-based first-line chemotherapy in patients with CRC. The
early detection of poor response to mFOLFOX6-based chemotherapy
using ex-miR-125b may prevent unnecessary side effects and
facilitate more rigorous and safer individualized treatment.
Supplementary Material
Supporting Data
Acknowledgements
The authors would like to thank Miss J Tamura
(Department of Surgery, Teikyo University School of Medicine,
Tokyo, Japan) for her excellent technical assistance and all
members of the colorectal group (Department of Surgery, Teikyo
University School of Medicine, Tokyo, Japan) for their clinical
suggestions.
Funding
This study is partly supported by Grants-in-Aid for
Scientific Research from the Japanese Society for the Promotion of
Science (grant nos. 15K10150, 17K10655 and 18K08716).
Availability of data and materials
All data generated or analyzed during the present
study are included in this article.
Authors' contributions
HI conceived and designed the study. TY, HI and YH
wrote the manuscript. TY and HI performed the experiment. YH, TH,
KM, KN, MT, RS, TA, TT and TO collected the clinical data. HI and
YH reviewed and edited the manuscript. All authors read and
approved the manuscript.
Ethics approval and consent to
participate
The study protocol conformed to the guidelines of
the Teikyo University Ethics Committee, and it was approved by the
review board of Teikyo University (approval no. 09-081-3). Written
informed consent was obtained from all patients.
Patient consent for publication
Written informed consent was obtained from all
patients for the publication of their data.
Competing interests
The authors declare that they have no competing
interests.
Glossary
Abbreviations
Abbreviations:
|
RT-PCR
|
reverse transcription-polymerase chain
reaction
|
|
CRC
|
colorectal cancer
|
References
|
1
|
Global Burden of Disease Cancer
Collaboration, ; Fitzmaurice C, Akinyemiju TF, Al Lami FH, Alam T,
Alizadeh-Navaei R, Allen C, Alsharif U, Alvis-Guzman N, Amini E, et
al: Global, regional, and national cancer incidence, mortality,
years of life lost, years lived with disability, and
disability-adjusted life-years for 29 cancer groups, 1990 to 2016:
A systematic analysis for the Global Burden of Disease Study. JAMA
Oncol. 4:1553–1568. 2018. View Article : Google Scholar : PubMed/NCBI
|
|
2
|
Ng EK, Chong WW, Jin H, Lam EK, Shin VY,
Yu J, Poon TC, Ng SS and Sung JJ: Differential expression of
microRNAs in plasma of patients with colorectal cancer: A potential
marker for colorectal cancer screening. Gut. 58:1375–1381. 2009.
View Article : Google Scholar : PubMed/NCBI
|
|
3
|
Huang Z, Huang D, Ni S, Peng Z, Sheng W
and Du X: Plasma microRNAs are promising novel biomarkers for early
detection of colorectal cancer. Int J Cancer. 127:118–126. 2010.
View Article : Google Scholar : PubMed/NCBI
|
|
4
|
Wang Q, Huang Z, Ni S, Xiao X, Xu Q, Wang
L, Huang D, Tan C, Sheng W and Du X: Plasma miR-601 and miR-760 are
novel biomarkers for the early detection of colorectal cancer. PLoS
One. 7:e443982012. View Article : Google Scholar : PubMed/NCBI
|
|
5
|
Kanaan Z, Rai SN, Eichenberger MR, Roberts
H, Keskey B, Pan J and Galandiuk S: Plasma miR-21: A potential
diagnostic marker of colorectal cancer. Ann Surg. 256:544–551.
2012. View Article : Google Scholar : PubMed/NCBI
|
|
6
|
Giráldez MD, Lozano JJ, Ramírez G, Hijona
E, Bujanda L, Castells A and Gironella M: Circulating microRNAs as
biomarkers of colorectal cancer: Results from a genome-wide
profiling and validation study. Clin Gastroenterol Hepatol.
11:681–688.e3. 2013. View Article : Google Scholar : PubMed/NCBI
|
|
7
|
Hofsli E, Sjursen W, Prestvik WS, Johansen
J, Rye M, Tranø G, Wasmuth HH, Hatlevoll I and Thommesen L:
Identification of serum microRNA profiles in colon cancer. Br J
Cancer. 108:1712–1719. 2013. View Article : Google Scholar : PubMed/NCBI
|
|
8
|
Luo X, Stock C, Burwinkel B and Brenner H:
Identification and evaluation of plasma microRNAs for early
detection of colorectal cancer. PLoS One. 8:e628802013. View Article : Google Scholar : PubMed/NCBI
|
|
9
|
Toiyama Y, Takahashi M, Hur K, Nagasaka T,
Tanaka K, Inoue Y, Kusunoki M, Boland CR and Goel A: Serum miR-21
as a diagnostic and prognostic biomarker in colorectal cancer. J
Natl Cancer Inst. 105:849–859. 2013. View Article : Google Scholar : PubMed/NCBI
|
|
10
|
Wang S, Xiang J, Li Z, Lu S, Hu J, Gao X,
Yu L, Wang L, Wang J, Wu Y, et al: A plasma microRNA panel for
early detection of colorectal cancer. Int J Cancer. 136:152–161.
2015. View Article : Google Scholar : PubMed/NCBI
|
|
11
|
Aslam MI, Taylor K, Pringle JH and Jameson
JS: microRNAs are novel biomarkers of colorectal cancer. Br J Surg.
96:702–710. 2009. View
Article : Google Scholar : PubMed/NCBI
|
|
12
|
Chen CZ, Li L, Lodish HF and Bartel DP:
MicroRNAs modulate hematopoietic lineage differentiation. Science.
303:83–86. 2004. View Article : Google Scholar : PubMed/NCBI
|
|
13
|
Croce CM and Calin GA: miRNAs, cancer, and
stem cell ivision. Cell. 122:6–7. 2005. View Article : Google Scholar : PubMed/NCBI
|
|
14
|
Stiegelbauer V, Perakis S, Deutsch A, Ling
H, Gerger A and Pichler M: MicroRNAs as novel predictive biomarkers
and therapeutic targets in colorectal cancer. World J
Gastroenterol. 20:11727–11735. 2014. View Article : Google Scholar : PubMed/NCBI
|
|
15
|
Zhang J, Zhang K, Bi M, Jiao X, Zhang D
and Dong Q: Circulating microRNA expressions in colorectal cancer
as predictors of response to chemotherapy. Anticancer Drugs.
25:346–352. 2014. View Article : Google Scholar : PubMed/NCBI
|
|
16
|
Molina-Pinelo S, Carnero A, Rivera F,
Estevez-Garcia P, Bozada JM, Limon ML, Benavent M, Gomez J, Pastor
MD, Chaves M, et al: MiR-107 and miR-99a-3p predict chemotherapy
response in patients with advanced colorectal cancer. BMC Cancer
Sep. 14:6562014. View Article : Google Scholar
|
|
17
|
Ge Q, Zhou Y, Lu J, Bai Y, Xie X and Lu Z:
miRNA in plasma exosome is stable under different storage
conditions. Molecules. 19:1567–1575. 2014. View Article : Google Scholar
|
|
18
|
Valadi H, Ekström K, Bossios A, Sjöstrand
M, Lee JJ and Lötvall JO: Exosome-mediated transfer of mRNAs and
microRNAs is a novel mechanism of genetic exchange between cells.
Nat Cell Biol. 9:654–659. 2007. View
Article : Google Scholar : PubMed/NCBI
|
|
19
|
Simons M and Raposo G: Exosomes-vesicular
carriers for intercelluar communication. Curr Opin Cell Biol.
21:575–581. 2009. View Article : Google Scholar : PubMed/NCBI
|
|
20
|
Hannafon BN and Ding WQ: Intercelluar
communication by exosome-derived microRNAs in cancer. Int J Mol
Sci. 14:14240–14269. 2013. View Article : Google Scholar : PubMed/NCBI
|
|
21
|
Zhu M, Huang Z, Zhu D, Zhou X, Shan X, Qi
LW, Wu L, Cheng W, Zhu J, Zhang L, et al: A panel of microRNA
signature in serum for colorectal cancer diagnosis. Oncotarget.
8:17081–17091. 2017.PubMed/NCBI
|
|
22
|
Zhou X, Wen W, Shan X, Zhu W, Xu J, Guo
RH, Cheng WF, Wang F, Qi LW, Chen Y, et al: A six-microRNA panel in
plasma was identified as a potential biomarker for lung
adenocarcinoma diagnosis. Oncotarget. 8:6513–6525. 2017.PubMed/NCBI
|
|
23
|
Liu Q, Yu Z, Yuan S, Xie W, Li C, Hu Z,
Xiang Y, Wu N, Wu L, Bai L and Li Y: Circulating exosomal microRNAs
as prognostic biomarkers for non-small-cell lung cancer.
Oncotarget. 8:13048–13058. 2017.PubMed/NCBI
|
|
24
|
Tsukamoto M, Iinuma H, Yagi T, Matsuda K
and Hashiguchi Y: Circulating exosomal MicroRNA-21 as a biomarker
in each tumor stage of colorectal cancer. Oncology. 92:360–370.
2017. View Article : Google Scholar : PubMed/NCBI
|
|
25
|
Livak KJ and Schmittgen TD: Analysis of
relative gene expression data using real-time quantitative PCR and
the 2(-Delta Delta C(T)) method. Methods. 25:402–408. 2001.
View Article : Google Scholar : PubMed/NCBI
|
|
26
|
Takano Y, Masuda T, Iinuma H, Yamaguchi R,
Sato K, Tobo T, Hirata H, Kuroda Y, Nambara S, Hayashi N, et al:
Circulating exosomal microRNA-203 is associated with metastasis
possibly via inducing tumor-associated macrophages in colorectal
cancer. Oncotarget. 8:78598–78613. 2017. View Article : Google Scholar : PubMed/NCBI
|
|
27
|
Banzhaf-Strathmann J and Edbauer D: Good
guy or bad guy: The opposing roles of microRNA 125b in cancer. Cell
Commun Signal. 12:302014. View Article : Google Scholar : PubMed/NCBI
|
|
28
|
Yamada A, Horimatsu T, Okugawa Y, Nishida
N, Honjo H, Ida H, Kou T, Kusaka T, Sasaki Y, Yagi M, et al: Serum
miR-21, miR-29a, and miR-125b are promising biomarkers for the
early detection of colorectal neoplasia. Clin Cancer Res.
21:4234–4242. 2015. View Article : Google Scholar : PubMed/NCBI
|
|
29
|
Svoboda M, Izakovicova Holla L, Sefr R,
Vrtkova I, Kocakova I, Tichy B and Dvorak J: Micro-RNAs miR125b and
miR137 are frequently upregulated in response to capecitabine
chemoradiotherapy of rectal cancer. Int J Oncol. 33:541–547.
2008.PubMed/NCBI
|
|
30
|
D'Angelo E, Fassan M, Maretto I,
Pucciarelli S, Zanon C, Digito M, Rugge M, Nitti D and Agostini M:
Serum miR-125b is a non-invasive predictive biomarker of the
pre-operative chemoradiotherapy responsiveness in patients with
rectal adenocarcinoma. Oncotarget. 7:28647–28657. 2016.PubMed/NCBI
|
|
31
|
Tanaka H, Hazama S, Iida M, Tsunedomi R,
Takenouchi H, Nakajima M, Tokumitsu Y, Kanekiyo S, Shindo Y,
Tomochika S, et al: miR-125b-1 and miR-378a are predictive
biomarkers for the efficacy of vaccine treatment against colorectal
cancer. Cancer Sci. 108:2229–2238. 2017. View Article : Google Scholar : PubMed/NCBI
|
|
32
|
Hansen TF, Carlsen AL, Heegaard NH,
Sørensen FB and Jakobsen A: Changes in circulating microRNA-126
during treatment with chemotherapy and bevacizumab predicts
treatment response in patients with metastatic colorectal cancer.
Br J Cancer. 112:624–629. 2015. View Article : Google Scholar : PubMed/NCBI
|
|
33
|
Lu Y, Zhao X, Liu Q, Li C, Graves-Deal R,
Cao Z, Singh B, Franklin JL, Wang J, Hu H, et al: lncRNA
MIR100HG-derived miR-100 and miR-125b mediate cetuximab resistance
via Wnt/β-catenin signaling. Nat Med. 23:1331–1341. 2017.
View Article : Google Scholar : PubMed/NCBI
|