Introduction
Ovarian cancer (OC) is the second most common
gynecological malignancy in the United States, accounting for
approximately 21,500 new cases of cancer and 14,600 deaths in 2009
(1). In Japan, OC is the fourth most
common gynecological malignancy with an estimated incidence of
nearly 8,000 cases and more than 4,000 deaths every year (2). Poor prognostic factors for OC are
thought to include the existence of residual tumor tissue and
chemotherapy response (3,4). However, such parameters are
insufficient for predicting the prognosis of patients with OC.
Therefore, a new approach for pre-treatment assessment of OC is
pivotal in improving clinical outcomes for OC.
Low skeletal muscle mass (sarcopenia) is useful
because it reflects not only a state of degenerative body weight,
but also muscle mass wasting in cancer patients. Therefore,
sarcopenia is an important physiological change that occurs during
the development of cancer cachexia (5,6). Low
skeletal muscle mass can be easily investigated using abdominal
computed tomography (CT). Cross-sectional CT measurement of the
skeletal muscle area (SMA) and psoas area (PA) at the level of the
third lumbar vertebra (L3) has been demonstrated to give reliable
muscle mass indices for the whole body (7,8). Loss of
skeletal muscle mass, which is symptomatic of poor physical
condition, is a risk factor for the outcome of various cancer types
(9–13). Volumetric measurements on a
three-dimensional (3D) scale are more accurate compared with
conventional measurements on a one- or two-dimensional scale
(14,15). Multi-detector CT scanning is widely
undertaken in routine clinical practice, and 3D constructive CT
(3D-CT) can provide volumetric data. This is the first study to
investigate whether SMA and PA calculated by CT and psoas major
volume (PV) calculated by 3D-CT are associated with clinical
parameters and prognosis in patients with OC.
Patients and methods
Study population
A total of 92 patients with epithelial OC who
underwent preoperative assessment at the Department of Obstetrics
and Gynecology of Okayama University Hospital between January 2002
and December 2017 were enrolled in this study. The study protocol
was approved by the Institutional Review Board of Okayama
University Hospital (1704-012). Disease staging was performed
according to the International Federation of Gynecology and
Obstetrics (FIGO) criteria. All enrolled patients were examined by
CT or positron emission tomography-CT (PET-CT) to locate tumor
deposits before debulking surgery. Our standard surgical treatment
for OC of primary debulking surgery (PDS)/interval debulking
surgery (IDS) consists of laparotomy for total abdominal
hysterectomy, bilateral salpingo-oophorectomy, and infracolic or
total omentectomy to debulk peritoneal tumor masses with maximum
effects. All cases of primary debulking surgery (PDS) successfully
achieved no residual tumor (R0). Patients with more extensive
disease and those unable to undergo surgery started neoadjuvant
chemotherapy. Surgical resection was classified as curative (R0) or
non-curative (R1 or R2, microscopic or gross residual tumor) in the
IDS group. Patients who underwent PDS were treated with or without
three to eight cycles of standard chemotherapy. This included three
to six cycles of neo-adjuvant chemotherapy with IDS followed by two
to five cycles of adjuvant chemotherapy. For standard chemotherapy,
we used the TC regimen consisting of paclitaxel (175
mg/m2 infused over 3 h) and an area under the curve
value of 5 for carboplatin.
CT imaging analysis
For SMA or PA, a single axial image corresponding to
the L3 vertebral body was selected and measured for each CT scan.
Cross-sectional CT measurement of the SMA and PA within predefined
validated boundaries of −29 to +150 Hounsfield units were measured
by software (Synapse Vincent; Fujifilm Medical, Tokyo, Japan). SMA
consisting of the abdominal muscles, psoas muscles, and para spinal
muscles was demarcated. Selected PA only included the psoas muscle
area (right and left). All recipients also underwent 3D-CT. Psoas
major volume in the lesion by 3D-CT was measured using image
recognition software (Synapse Vincent; Fujifilm Medical, Tokyo,
Japan).
Laboratory data collection
All subjects had their serum albumin, C-reactive
protein (CRP) and CA125 levels measured within 1 week prior to
treatment. Levels of serum albumin and CRP were measured using
latex nephelometry (LT Auto Wako, Osaka, Japan). Serum CA125 levels
were measured by electrochemiluminescence immunoassay on the
Roche/Hitachi Modular Analysis E170 (Roche Diagnostics, Tokyo,
Japan). Briefly, the high Glasgow prognostic score (GPS) group
included patients with GPS 2: CRP levels >1.0 mg/dl and
hypoalbuminemia (<3.5 g/dl). The low GPS group included patients
with only one of these factors showing abnormal levels (GPS 1) or
none of these abnormalities (GPS 0).
Statistical analysis
Statistical analysis was performed using SPSS
version 20.0 (SPSS Inc., Chicago, IL, USA). Statistical analyses
were performed using the Kruskal-Wallis test for comparisons with
controls. Spearman correlation analysis was performed between PA
and SMA, PV and PA, PV and SMA metric values, which we used to
report the correlation and P-values. PFS and OS of the groups were
analyzed using the Kaplan-Meier method. Differences between the
recurrence and survival curves were examined using the log-rank
test. We performed univariate and multivariate analyses using Cox's
proportional hazards model to determine which factors predict PFS
and OS after adjusting for the effects of known prognostic factors.
P<0.05 was considered statistically significant.
Results
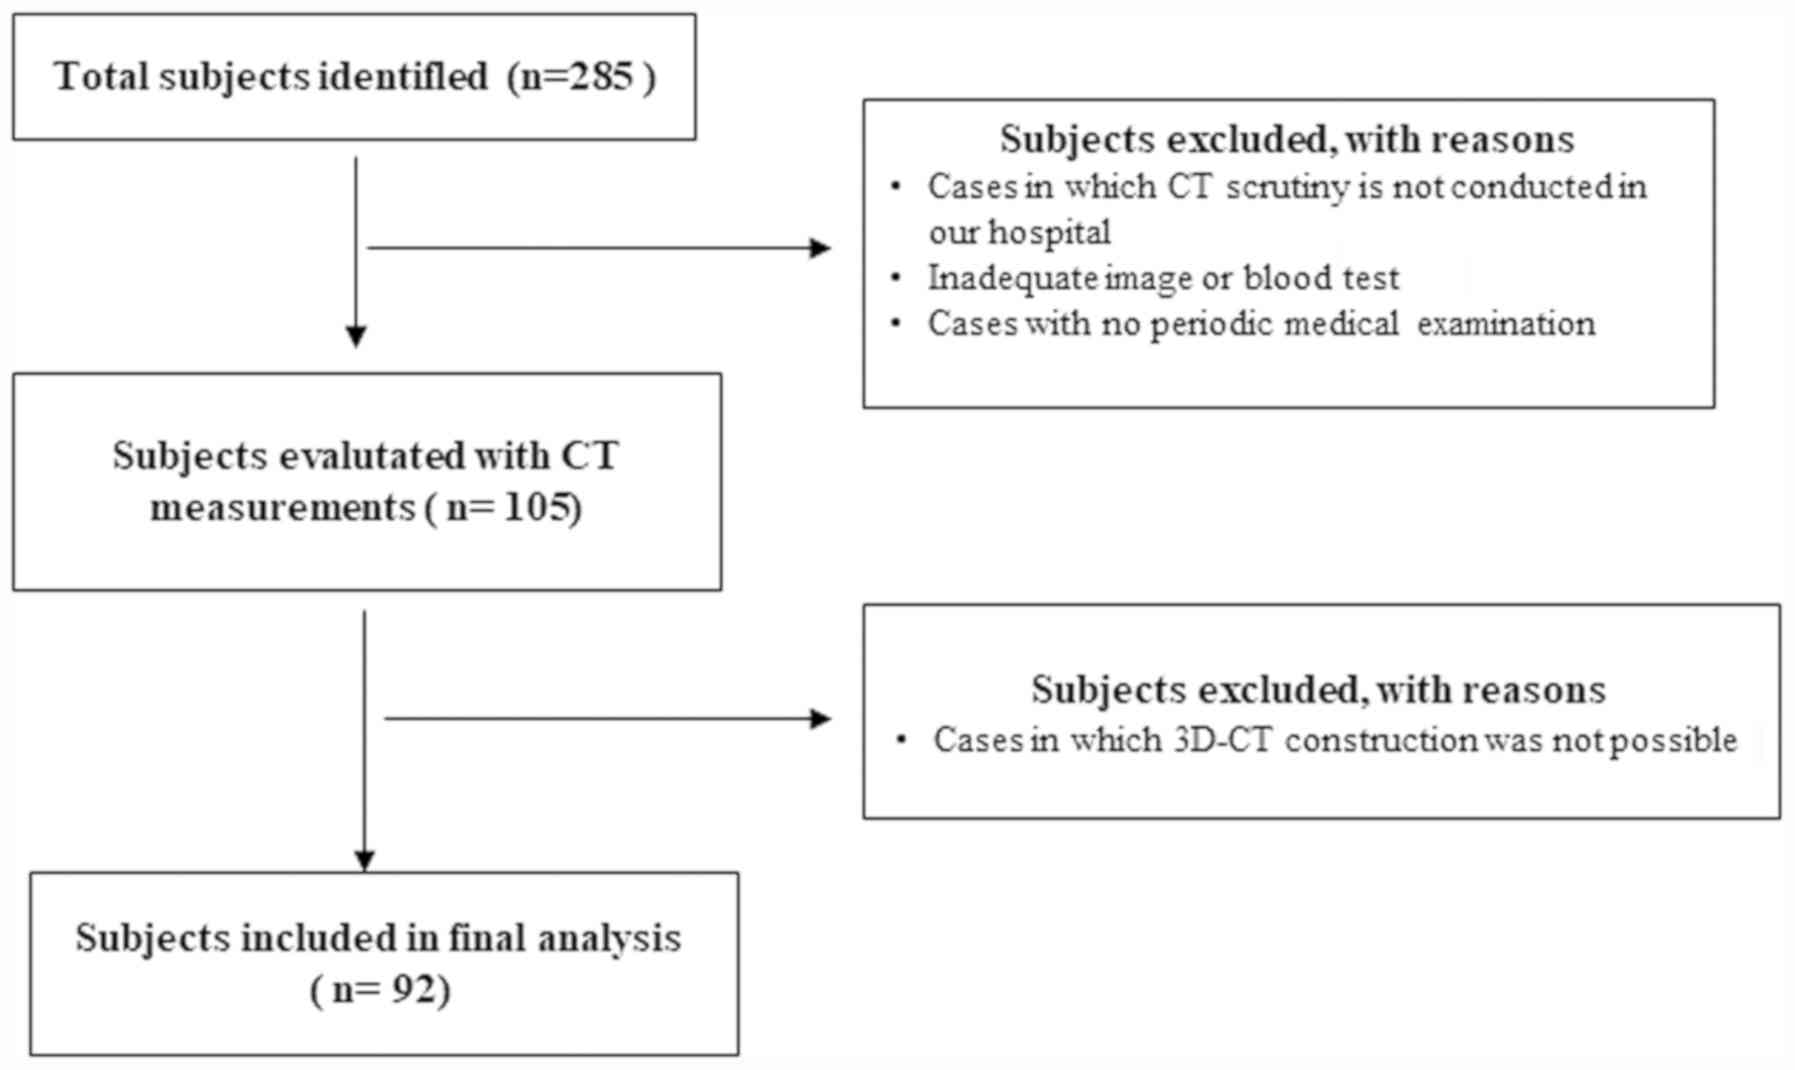
Of 285 patients who attended our institutions for
treatment of OC during the study period, 92 were found to be
eligible following exclusion of ineligible patients after
completion of the study measurements by CT and 3D-CT (Fig. 1). The patients were aged from 15 to
78 years (mean, 55.3 years). FIGO stage, histology, lymph node
metastasis, no residual tumor (R0), ascites, neo-adjuvant
chemotherapy, GPS, and CA125 are shown in Table I.
 | Table I.Patient and tumor characteristics |
Table I.
Patient and tumor characteristics
| Baseline
characteristics |
|---|
|
|---|
|
| Mean | Range |
|---|
|
|---|
| Age at diagnosis | 55.3 | 15–78 |
|---|
|
|---|
|
| Numbers | (%) |
|---|
| Stage |
|
|
| I | 32 | 34.8 |
| II | 6 | 6.5 |
| III | 34 | 37 |
| IV | 20 | 21.7 |
| Histology |
|
|
| Serous
carcinoma | 39 | 42.4 |
| Clear
cell carcinoma | 8 | 8.7 |
| Mucinous
carcinoma | 12 | 13 |
|
Endometrioid carcinoma | 11 | 12 |
| Other
carcinoma | 22 | 23.9 |
| Lymph node
metastasis |
|
|
|
Absent | 60 | 65.2 |
|
Present | 32 | 34.8 |
| Macroscopic tumor
free (R0) |
|
|
|
Absent | 7 | 7.6 |
|
Present | 85 | 92.4 |
| Ascites |
|
|
|
Absent | 76 | 82.6 |
|
Present | 16 | 17.4 |
| Neo-adjuvant
chemotherapy |
|
|
|
Absent | 61 | 66.3 |
|
Present | 31 | 33.7 |
| GPS |
|
|
| 0 | 38 | 41.3 |
| 1 | 30 | 32.6 |
| 2 | 24 | 26.1 |
| CA125 |
|
|
| <35.0
U/ml | 9 | 9.8 |
| ≥35.0
U/ml | 83 | 90.2 |
With respect to body composition, the median (range)
pre-treatment SMA, PA, and PV were 92.92 (range, 47.41–128.91)
cm2, 9.96 (range, 5.07–18.05) cm2, and 195.6
(range, 83.89–351.49) cm3, respectively.
Inter-measurement correlations of SMA, PA, and PV were analyzed
with data from CT scans. The correlations between SMA and PA, PV
and PA, and PV and SMA were 0.629, 0.616, and 0.614, respectively
(Fig. 2B).
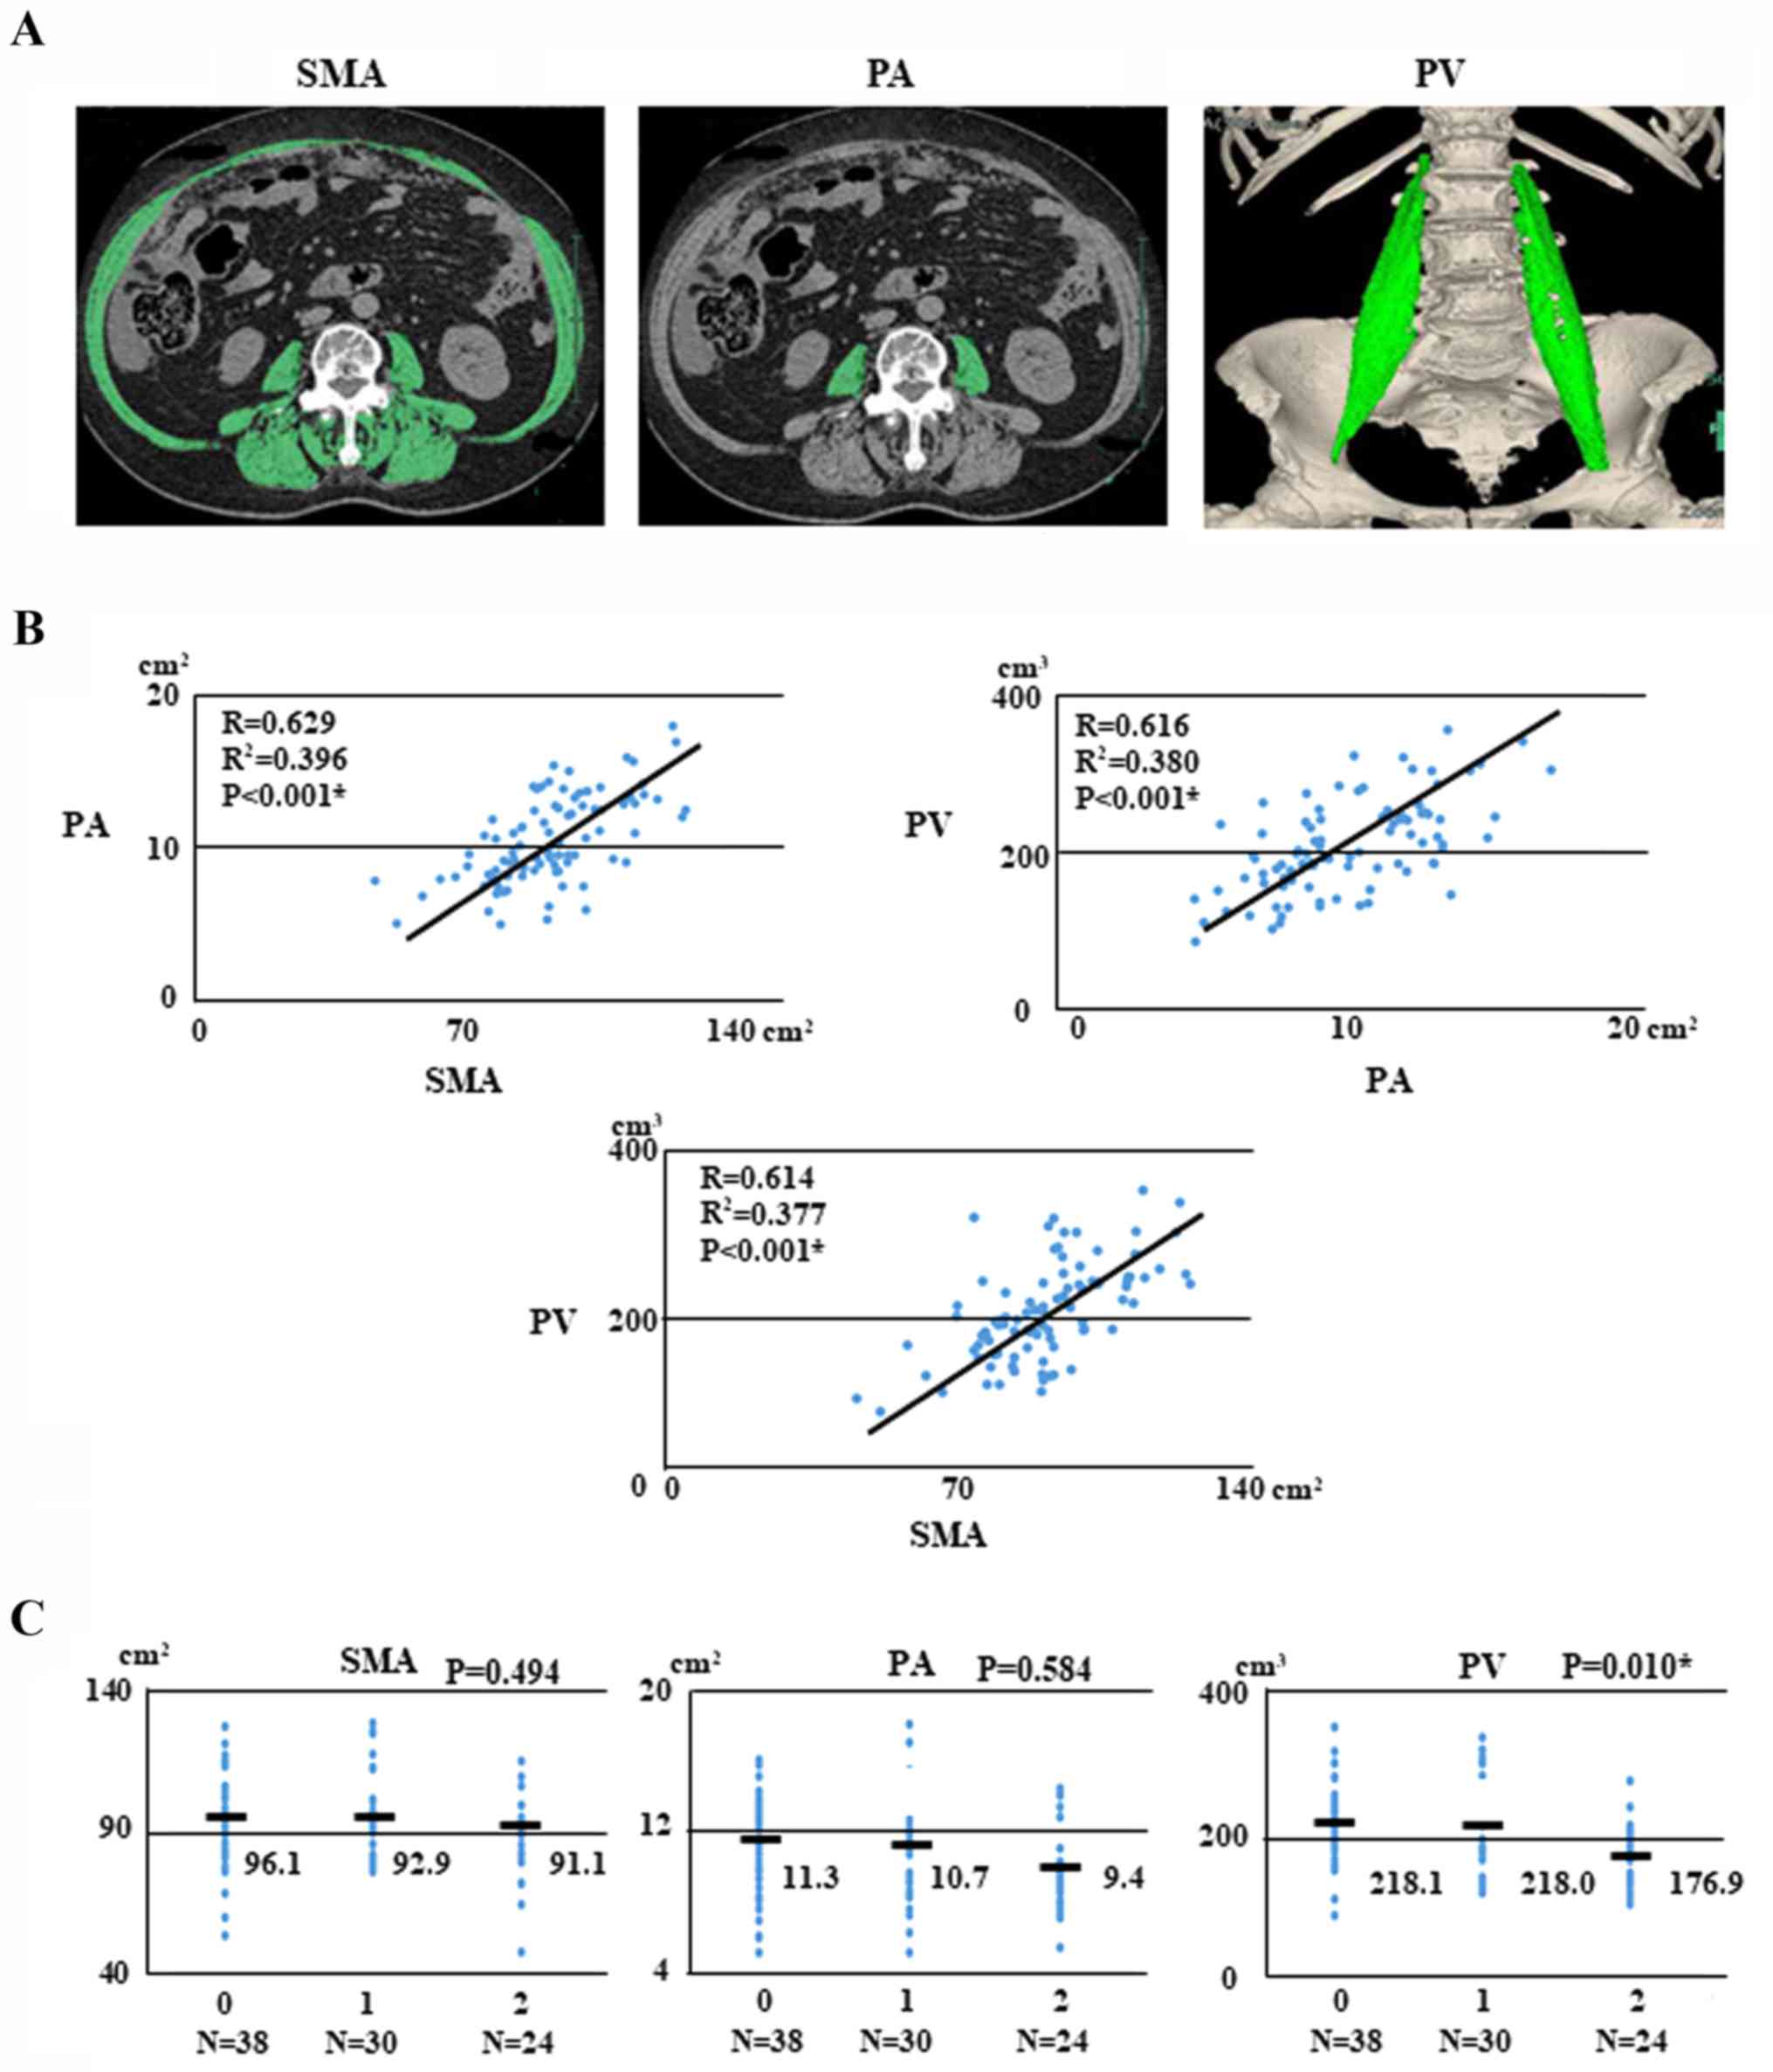 | Figure 2.Sarcopenia images, regression analysis
and associations with ovarian cancer. (A) Patient with sarcopenia.
Pre-treatment SMA (102.71 cm2), PA (10.73
cm2) and PV (191.0 cm3) measured according to
attenuation thresholds of −29 to +150 Hounsfield units. (B)
Regression analysis for PA and SMA, SMA and PV, and PV and PA for
92 patients with ovarian cancer. (C) Associations of GPS and SMA,
PA, and PV with ovarian cancer. SMA, skeletal muscle area; PA,
psoas area; PV, psoas major volume; GPS, Glasgow prognostic
score. |
We examined the correlations between pre-treatment
GPS and body composition such as SMA, PA, and PV with OC. The
pre-treatment GPSs were as follows: GPS 0, 38 patients (41.3%); GPS
1, 30 (32.6%); and GPS 2, 24 (26.1%). Interestingly, PV was
significantly associated with GPS (P=0.010, respectively; Fig. 2C).
We next investigated whether SMA, PA, and PV are
associated with clinical parameters in patients with OC. We found
that PA was significantly associated with stage (P<0.001),
histology (P=0.017), lymph node metastasis (P=0.01), ascites
(P=0.048), neo-adjuvant chemotherapy (P=0.007), and GPS (P=0.012).
Furthermore, PV was significantly associated with age (P=0.019),
stage (P<0.001), histology (P=0.001), lymph node metastasis
(P=0.005), ascites (P=0.024), neo-adjuvant chemotherapy
(P<0.001), and GPS (P=0.002; Table
II).
| Table II.Associations of SMA, PA, PV with
clinical factors on ovarian cancer. |
Table II.
Associations of SMA, PA, PV with
clinical factors on ovarian cancer.
|
| Numbers | SMA | P-value | PA | P-value | PV | P-value |
|---|
| Age |
|
| 0.31 |
| 0.06 |
| 0.019a |
| <70
years | 81 | 94.34±15.82 |
| 10.34±2.84 |
| 204.82±57.85 |
|
| ≥70
years | 11 | 89.19±14.90 |
| 8.61±2.76 |
| 161.77±38.14 |
|
| BMI |
|
| 0.497 |
| 0.182 |
| 0.498 |
|
<24.9 | 71 | 92.91±16.37 |
| 9.78±2.71 |
| 194.9±56.44 |
|
|
≥25.0 | 21 | 95.57±13.17 |
| 10.73±3.29 |
| 204.82±66.02 |
|
| Stage |
|
| 0.05 |
|
<0.001a |
|
<0.001a |
| Stage
I, II | 39 | 97.94±16.93 |
| 12.32±2.88 |
| 237.48±54.62 |
|
| Stage
III, IV | 53 | 91.56±13.89 |
| 9.41±2.57 |
| 180.83±50.90 |
|
| Histology |
|
| 0.236 |
| 0.017a |
| 0.001a |
| Serous
adenocarinoma | 39 | 96.44±17.76 |
| 11.06±2.92 |
| 219.91±61.14 |
|
|
Non-serous carcinoma | 53 | 92.46±12.61 |
| 9.63±2.71 |
| 182.88±50.30 |
|
| Lymph node
metastasis |
|
| 0.187 |
| 0.01a |
| 0.005a |
|
Absent | 62 | 95.24±15.74 |
| 10.98±2.81 |
| 213.27±59.07 |
|
|
Present | 30 | 90.7±15.36 |
| 9.38±2.72 |
| 178.74±46.73 |
|
| Macroscopic tumor
free (R0) |
|
| 1 |
| 0.085 |
| 0.325 |
|
Absent | 7 | 92.92±11.63 |
| 11.74±2.79 |
| 177.52±48.62 |
|
|
Present | 85 | 92.92±16.26 |
| 9.78±2.87 |
| 197.92±59.51 |
|
| Ascites |
|
| 0.983 |
| 0.048a |
| 0.024a |
|
Absent | 76 | 92.98±17.12 |
| 10.7±2.84 |
| 205.66±57.73 |
|
|
Present | 16 | 92.92±8.35 |
| 9.14±2.80 |
| 169.65±53.99 |
|
| Neo-adjuvant
chemotherapy |
|
| 0.06 |
| 0.007a |
|
<0.001a |
|
Absent | 61 | 95.57±17.72 |
| 11.1±2.99 |
| 220.47±61.37 |
|
|
Present | 31 | 89.84±11.03 |
| 9.41±2.39 |
| 180.83±40.65 |
|
| GPS |
|
| 0.315 |
| 0.012a |
| 0.002a |
|
0+1 | 68 | 94.91±15.98 |
| 11.08±2.95 |
| 218±58.89 |
|
| 2 | 24 | 91.15±14.83 |
| 9.38±2.39 |
| 176.91±43.49 |
|
| CA125 |
|
| 0.998 |
| 0.155 |
| 0.066 |
|
<35.0 U/ml | 9 | 92.91±19.27 |
| 11.22±2.70 |
| 233.13±77.05 |
|
| ≥35.0
U/ml | 83 | 92.92±15.64 |
| 9.78±2.88 |
| 194.9±56.58 |
|
Patients underwent follow-up examinations
approximately every 1–2 months for the first 6 months, every 3
months for the next 2 years, and every 6 months thereafter. The
median PFS and OS times for all patients who were alive at the time
of last follow-up were 19.0 and 32.0 months, respectively (range
for follow-up periods was 1 to 144 months for both PFS and OS). At
the last follow-up point, 44 patients were without evidence of
disease (47.8%), 32 patients had died of disease (34.8%), and 16
patients had recurrence and were currently alive with the disease
(17.4%).
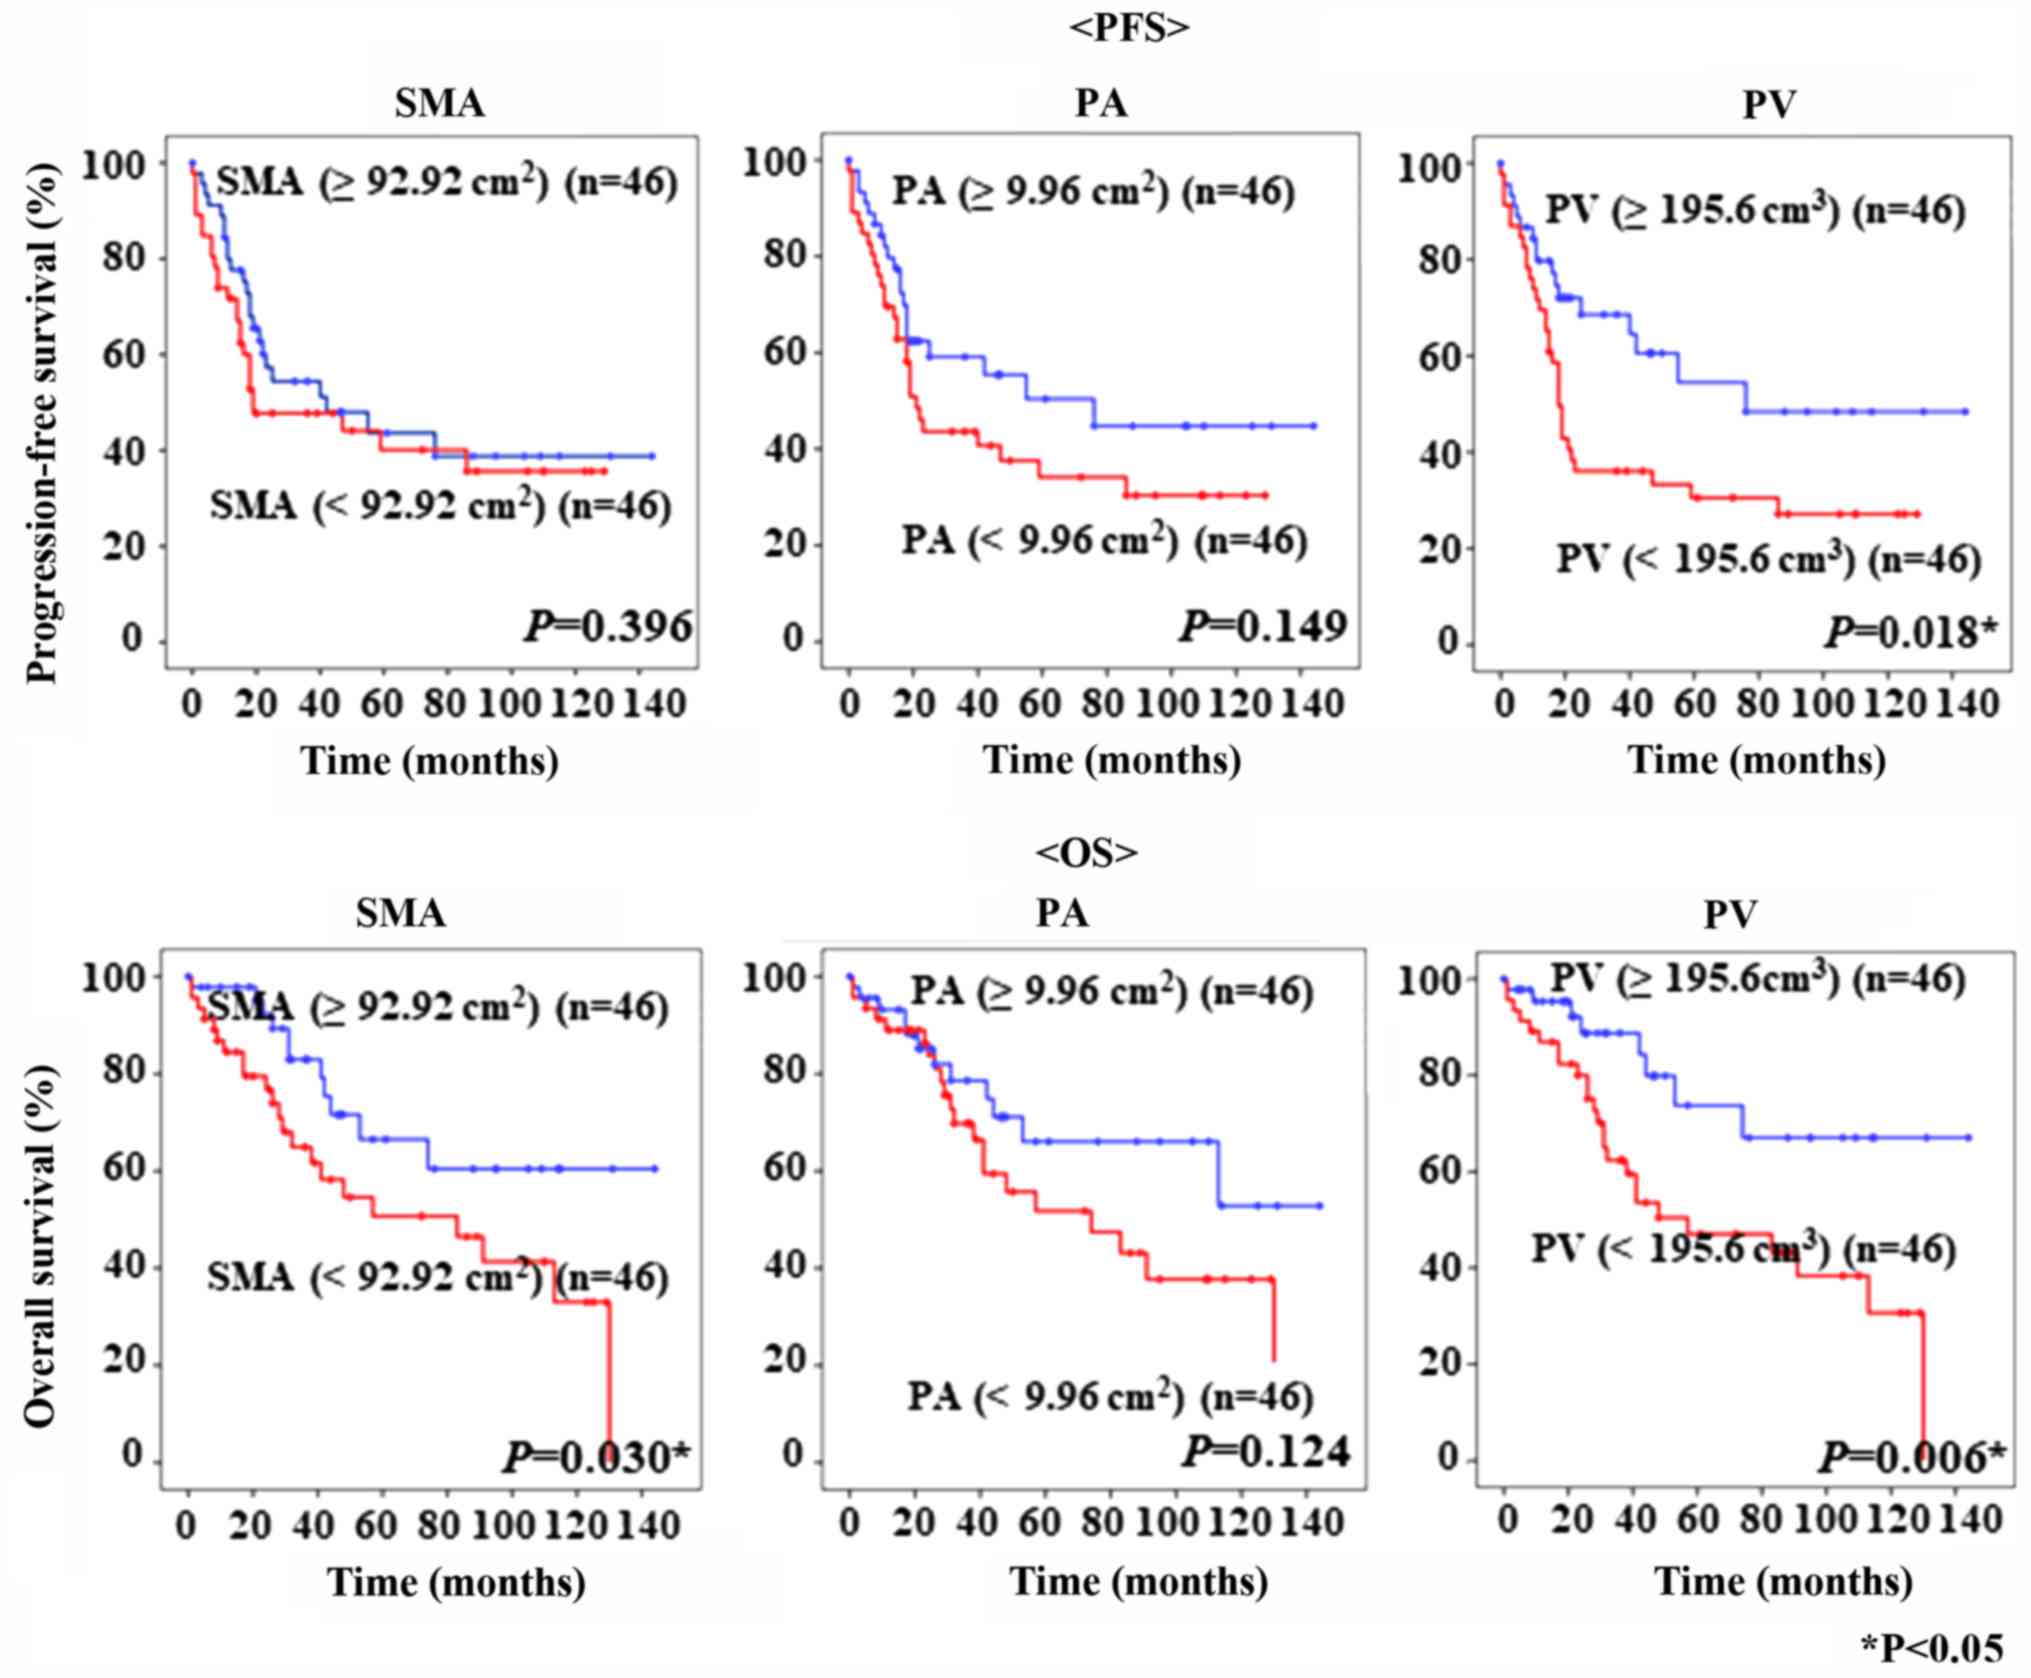
The PFS and OS of the 92 patients with epithelial OC
are shown in Fig. 3. The cut-off
values for SMA, PA, and PV, based on the median values, were 92.92
cm2, 9.96 cm2, and 195.6 cm3,
respectively. Kaplan-Mayer curves showed that patients with lower
PV had poorer PFS and OS than patients with significantly higher PV
(P=0.018 and P=0.006, respectively). Moreover, patients with low
SMA had significantly worse OS than those with higher SMA (P=0.030,
respectively). Interestingly, PV was superior to SMA and PA in
prognosis prediction (Fig. 3).
The correlations between clinical factors and PFS or
OS were assessed in univariate and multivariate analyses (Table III). In a univariate analysis of
PFS and OS, GPS (P<0.001), age (P=0.001), PV (P=0.021),
neo-adjuvant chemotherapy (P<0.001), stage (P<0.001),
histology (P<0.001), lymph node metastasis (P<0.001), no
residual tumor (P=0.001), and ascites (P<0.001) were
significantly associated with PFS, whereas GPS (P<0.001), age
(P=0.005), SMA (P=0.035), PV (P=0.009), neo-adjuvant chemotherapy
(P=0.003), stage (P<0.001), lymph node metastasis (P<0.001),
no residual tumor (P<0.001), and ascites (P=0.008) were
significantly associated with OS. In a multivariate analysis, GPS
(P=0.048 and P=0.008) and stage (P<0.001 and P=0.008) were
significantly associated with PFS and OS. However, the multivariate
analysis showed that PV was not an independent predictor of
recurrence and survival in patients with OC.
| Table III.Prognostic factors for
progression-free survival and overall survival with ovarian cancer
selected by Cox's univariate and multivariate analysis. |
Table III.
Prognostic factors for
progression-free survival and overall survival with ovarian cancer
selected by Cox's univariate and multivariate analysis.
|
| Univariate
analysis | Multivariate
analysis |
|---|
|
|
|
|
|---|
|
| Hazard ratio | 95% CI | P-value | Hazard ratio | 95% CI | P-value |
|---|
| Progression-free
survival |
|
|
|
|
|
|
| GPS
2 | 5.246 | 2.909–9.460 |
<0.001a | 2.034 | 1.006–4.115 | 0.048a |
| CA125
(≥35.0 U/ml) | 3.99 | 0.967–16.461 | 0.056 |
| – |
|
| Age
(≥70 years) | 3.235 | 1.606–6.516 | 0.001a | 1.673 | 0.740–3.780 | 0.216 |
| BMI
(≥25.0) | 0.805 | 0.411–1.576 | 0.527 |
| – |
|
|
SMA(<92.92
cm2) | 1.272 | 0.725–2.230 | 0.402 |
| – |
|
| PA
(<9.96 cm2) | 1.51 | 0.854–2.670 | 0.156 |
| – |
|
| PV
(<195.6 cm3) | 1.998 | 1.109–3.601 | 0.021a | 0.818 | 0.404–1.654 | 0.576 |
|
Neo-adjuvant chemotherapy | 3.778 | 2.113–6756 |
<0.001a | 1.162 | 0.580–2.326 | 0.672 |
| Stage
(Stage III–IV) | 11.099 | 4.636–26.572 |
<0.001a | 8.065 | 2.620–24.826 |
<0.001a |
|
Histology (Serous Ca) | 2.824 | 1.587–5.024 |
<0.001a | 0.979 | 0.490–1.958 | 0.952 |
| Lymph
node metastasis | 3.309 | 1.876–5.834 |
<0.001a | 0.85 | 0.423–1.707 | 0.648 |
| No
residual tumor (R0) | 4.24 | 1.826–9.845 | 0.001a | 1.92 | 0.761–4.842 | 0.167 |
|
Ascites | 3.424 | 1.836–6.386 |
<0.001a | 0.979 | 0.476–2.011 | 0.953 |
| Overall
survival |
|
|
|
|
|
|
| GPS
2 | 6.978 | 3.336–14.596 |
<0.001a | 3.37 | 1.381–8.223 | 0.008a |
| CA125
(≥35.0 U/ml) | 2.654 | 0.632–11.149 | 0.183 |
| – |
|
| Age
(≥70 years) | 3.076 | 1.410–6.706 | 0.005a | 1.209 | 0.459–3.186 | 0.702 |
| BMI
(≥25.0) | 0.848 | 0.382–1.882 | 0.685 |
| – |
|
| SMA
(<92.92 cm2) | 2.186 | 1.057–4.518 | 0.035a | 2.106 | 0.765–5.802 | 0.15 |
| PA
(<9.96 cm2) | 1.734 | 0.851–3.532 | 0.13 |
| – |
|
| PV
(<195.6 cm3) | 2.882 | 1.296–6.406 | 0.009a | 0.981 | 0.368–2.617 | 0.969 |
|
Neo-adjuvant chemotherapy | 2.937 | 1.455–5.929 | 0.003a | 0.709 | 0.307–1.638 | 0.42 |
| Stage
(stage III–IV) | 9.956 | 3.499–28.659 |
<0.001a | 5.896 | 1.586–21.923 | 0.008a |
|
Histology (Serous Ca) | 1.812 | 0.912–3.600 | 0.09 |
| – |
|
| Lymph
node metastasis | 3.843 | 1.917–7.703 |
<0.001a | 0.922 | 0.400–2.125 | 0.849 |
| No
residual tumor (R0) | 5.611 | 2.197–14.335 |
<0.001a | 2.85 | 0.917–8.851 | 0.07 |
|
Ascites | 2.902 | 1.323–6.367 | 0.008a | 0.905 | 0.358–2.286 | 0.833 |
Discussion
Poor prognostic factors for OC are thought to
include the existence of residual tumor tissue and chemotherapy
response (3,4). Sarcopenia is an important prognostic
risk factor for the outcome of various cancer types. This study
aimed to evaluate whether pre-treatment SMA and PA measurements by
cross-sectional CT and PV by 3D-CT, which predicts poor prognosis
for patients with OC, are associated with recurrence or
survival.
Sarcopenia, often observed in patients with cancer,
is usually regarded as a marker of malnutrition, cachexia,
progressive weight loss, fatigue, and anorexia. It is associated
with the loss of body composition of patients with cancer because
it causes a reduction in SMA. The relationship between poor
prognosis and progressive atrophy of SMA has been reported in
various cancer types (16–18). Muscle tissue areas can be objectively
measured using standard abdominal CT. Areas of SMA and PA can also
be accurately estimated using this approach. A low SMA area has
been associated with poor outcome in various types of cancer
(5).
Inflammatory markers such as malnutrition and
cachexia are important prognostic factors for survival in various
cancer types. CRP and albumin have prominent roles in tumor
inflammation (19–21). Inflammation-based prognostic scores,
including the GPS, which is a combination of CRP and albumin
parameters, is associated with survival in various cancers,
including ovarian, lung, and colorectal cancers (22–24).
Furthermore, McSorley et al clarified that low radiation
attenuation in muscle was correlated with GPS in colorectal cancer
(25). However, there are no reports
of an association between GPS and skeletal muscle mass in OC.
Multi-detector CT scanning is widely accessed in
routine practice, and 3D-CT enables volumetric data to be obtained.
Volumetric measurements on a 3D scale are more accurate compared
with conventional measurements on a one- or two-dimensional scale
(14,15). We examined body composition using
either cross-sectional CT measurement or 3D-CT measurement. In
fact, because only one slice was examined for SMA and PA on a CT
sagittal view, it was hard to confirm that it was precisely
evaluated (20). To our knowledge,
this is the first study to evaluate SMA, PA, and PV and the
possible prognostic roles of these values in the evaluation of
OC.
With respect to body composition, the median
pre-treatment SMA, PA, and PV were 92.92 cm2, 9.96
cm2, and 195.6 cm3, respectively. We
investigated the association between pre-treatment GPS and body
composition such as SMA, PA, and PV with OC. Therefore, PV was more
related to pre-treatment GPS than SMI and PA.
We examined whether SMA, PA, and PV were correlated
with clinical parameters, using CT for the first two factors and
3D-CT for the latter. We found that PA was significantly associated
with stage, histology, lymph node metastasis, ascites, neo-adjuvant
chemotherapy, and GPS. Furthermore, PV was significantly associated
with age, stage, histology, lymph node metastasis, ascites,
neo-adjuvant chemotherapy, and GPS. Our analyses revealed that
patients with low PV had significantly poorer PFS and OS than
patients with high PV. Interestingly, PV was found to be superior
to SMA and PA in prognosis prediction. Univariate analysis showed
that high PV was significantly associated with PFS and OS in our
study population. However, the multivariate analysis showed that PV
was not an independent predictor of recurrence and survival in
patients with OC.
This study has some limitations. For example, the
number of analyzed samples was small and was obtained from a
retrospective cohort in a single hospital. Thus, further
confirmation in a prospective trial would help to validate our
findings.
In conclusion, this report shows that PV could be a
potential imaging biomarker to predict poor prognosis in patients
with OC. Based on these results, further sarcopenia research is
required to predict prognosis.
Acknowledgements
The authors would like to thank all those who
contributed to this study, particularly the statisticians and
colleagues of Okayama University Graduate School of Medicine,
Dentistry and Pharmaceutical Sciences. We appreciate their help
with data management and statistical support. We would also like to
thank H. Nikki March, PhD, from Edanz Group (www.edanzediting.com/ac) for editing a draft of this
manuscript.
Funding
No funding was received.
Availability of data and materials
The datasets used and/or analyzed during the present
study are available from the corresponding author on reasonable
request.
Authors' contributions
KN and YM contributed to the conception, design and
conduction of the study and analysis and interpretation of the
data. KN contributed to the conception of the study and
interpretation of the data. H. Mat, CO and H. Mas contributed to
data collection and the conduction of the study. All the authors
have read and approved the final version of this manuscript.
Ethics approval and consent to
participate
This study was performed according to the principles
set out in the Declaration of Helsinki 1964 and all subsequent
revisions and was approved by the Institutional Review Board of
Okayama University Hospital (IRB approval no. 1704-012).
Patient consent for publication
Not applicable.
Competing interests
All authors declare that they have no competing
interests.
References
|
1
|
American Cancer Society: Cancer Facts
& Figures 2009. American Cancer Society; Atlanta, GA: 2009
|
|
2
|
Ushijima K: Current status of gynecologic
cancer in Japan. J Gynecol Oncol. 20:67–71. 2000. View Article : Google Scholar
|
|
3
|
Fathalla MF: Factors in the causation and
incidence of ovarian cancer. Obstet Gynecol Surv. 27:751–768. 1972.
View Article : Google Scholar : PubMed/NCBI
|
|
4
|
Vergote IB, Kaern J, Abeler VM, Pettersen
EO, De Vos LN and Tropé CG: Analysis of prognostic factors in stage
I epithelial ovarian carcinoma: Importance of degree of
differentiation and deoxyribonucleic acid ploidy in predicting
relapse. Am J Obstet Gynecol. 169:40–52. 1993. View Article : Google Scholar : PubMed/NCBI
|
|
5
|
Martin L, Birdsell L, Macdonald N, Reiman
T, Clandinin MT, McCargar LJ, Murphy R, Ghosh S, Sawyer MB and
Baracos VE: Cancer cachexia in the age of obesity: Skeletal muscle
depletion is a powerful prognostic factor, independent of body mass
index. J Clin Oncol. 31:1539–1547. 2013. View Article : Google Scholar : PubMed/NCBI
|
|
6
|
Fearon K, Strasser F, Anker SD, Bosaeus I,
Bruera E, Fainsinger RL, Jatoi A, Loprinzi C, MacDonald N,
Mantovani G, et al: Definition and classification of cancer
cachexia: An international consensus. Lancet Oncol. 12:489–495.
2011. View Article : Google Scholar : PubMed/NCBI
|
|
7
|
Mourtzakis M, Prado CM, Lieffers JR,
Reiman T, McCargar LJ and Baracos VE: A practical and precise
approach to quantification of body composition in cancer patients
using computed tomography images acquired during routine care. Appl
Physiol Nutr Metab. 33:997–1006. 2008. View
Article : Google Scholar : PubMed/NCBI
|
|
8
|
Shen W, Punyanitya M, Wang Z, Gallagher D,
St-Onge MP, Albu J, Heymsfield SB and Heshka S: Total body skeletal
muscle and adipose tissue volumes: Estimation from a single
abdominal cross-sectional image. J Appl Physiol (1985).
97:2333–2338. 2004. View Article : Google Scholar : PubMed/NCBI
|
|
9
|
Moses AW, Slater C, Preston T, Barber MD
and Fearon KC: Reduced total energy expenditure and physical
activity in cachectic patients with pancreatic cancer can be
modulated by an energy and protein dense oral supplement enriched
with n-3 fatty acids. Br J Cancer. 90:996–1002. 2004. View Article : Google Scholar : PubMed/NCBI
|
|
10
|
Joglekar S, Nau PN and Mezhir JJ: The
impact of sarcopenia on survival and complications in surgical
oncology: A review of the current literature. J Surg Oncol.
112:503–509. 2015. View Article : Google Scholar : PubMed/NCBI
|
|
11
|
Prado CM, Lieffers JR, McCargar LJ, Reiman
T, Sawyer MB, Martin L and Baracos VE: Prevalence and clinical
implications of sarcopenic obesity in patients with solid tumours
of the respiratory and gastrointestinal tracts: A population-based
study. Lancet Oncol. 9:629–635. 2008. View Article : Google Scholar : PubMed/NCBI
|
|
12
|
Sabel MS, Lee J, Cai S, Englesbe MJ,
Holcombe S and Wang S: Sarcopenia as a prognostic factor among
patients with stage III melanoma. Ann Surg Oncol. 18:3579–3585.
2011. View Article : Google Scholar : PubMed/NCBI
|
|
13
|
Harimoto N, Shirabe K, Yamashita YI,
Ikegami T, Yoshizumi T, Soejima Y, Ikeda T, Maehara Y, Nishie A and
Yamanaka T: Sarcopenia as a predictor of prognosis in patients
following hepatectomy for hepatocellular carcinoma. Br J Surg.
100:1523–1530. 2013. View
Article : Google Scholar : PubMed/NCBI
|
|
14
|
Yankelevitz DF, Reeves AP, Kostis WJ, Zhao
B and Henschke CI: Small pulmonary nodules: Volumetrically
determined growth rates based on CT evaluation. Radiology.
217:251–256. 2000. View Article : Google Scholar : PubMed/NCBI
|
|
15
|
Jennings SG, Winer-Muram HT, Tarver RD and
Farber MO: Lung tumor growth: Assessment with CT-comparison of
diameter and cross-sectional area with volume measurements.
Radiology. 231:866–871. 2004. View Article : Google Scholar : PubMed/NCBI
|
|
16
|
Malietzis G, Aziz O, Bagnall NM, Johns N,
Fearon KC and Jenkins JT: The role of body composition evaluation
by computerized tomography in determining colorectal cancer
treatment outcomes: A systematic review. Eur J Surg Oncol.
41:186–196. 2015. View Article : Google Scholar : PubMed/NCBI
|
|
17
|
Sarkozy C, Camus V, Tilly H, Salles G and
Jardin F: Body mass index and other anthropometric parameters in
patients with diffuse large B-cell lymphoma: Physiopathological
significance and predictive value in the immunochemotherapy era.
Leuk Lymphoma. 56:1959–1968. 2015. View Article : Google Scholar : PubMed/NCBI
|
|
18
|
Fujiwara N, Nakagawa H, Kudo Y, Tateishi
R, Taguri M, Watadani T, Nakagomi R, Kondo M, Nakatsuka T, Minami
T, et al: Sarcopenia, intramuscular fat deposition, and visceral
adiposity independently predict the outcomes of hepatocellular
carcinoma. J Hepatol. 63:131–140. 2015. View Article : Google Scholar : PubMed/NCBI
|
|
19
|
McMillan DC, Watson WS, O'Gorman P,
Preston T, Scott HR and McArdle CS: Albumin concentrations are
primarily determined by the body cell mass and the systemic
inflammatory response in cancer patients with weight loss. Nutr
Cancer. 39:210–213. 2001. View Article : Google Scholar : PubMed/NCBI
|
|
20
|
Wang CS and Sun CF: C-reactive protein and
malignancy: Clinico-pathological association and therapeutic
implication. Chang Gung Med J. 32:471–482. 2009.PubMed/NCBI
|
|
21
|
Funovics PT, Edelhauser G, Funovics MA,
Laux C, Berzaczy D, Kubista B, Kotz RI and Dominkus M:
Pre-operative serum C-reactive protein as independent prognostic
factor for survival but not infection in patients with high-grade
osteosarcoma. Int Orthop. 35:1529–1536. 2011. View Article : Google Scholar : PubMed/NCBI
|
|
22
|
Omichi C, Nakamura K, Haraga J, Masuyama H
and Hiramatsu Y: Glasgow prognostic score is an independent marker
for poor prognosis with all cases of epithelial ovarian cancer.
Cancer Med. 5:1074–1080. 2016. View
Article : Google Scholar : PubMed/NCBI
|
|
23
|
Forrest LM, McMillan DC, McArdle CS,
Angerson WJ and Dunlop DJ: Evaluation of cumulative prognostic
scores based on the systemic inflammatory response in patients with
inoperable non-small-cell lung cancer. Br J Cancer. 89:1028–1030.
2003. View Article : Google Scholar : PubMed/NCBI
|
|
24
|
Leitch EF, Chakrabarti M, Crozier JE,
McKee RF, Anderson JH, Horgan PG and McMillan DC: Comparison of the
prognostic value of selected markers of the systemic inflammatory
response in patients with colorectal cancer. Br J Cancer.
97:1266–1270. 2007. View Article : Google Scholar : PubMed/NCBI
|
|
25
|
McSorley ST, Black DH, Horgan PG and
McMillan DC: The relationship between tumour stage, systemic
inflammation, body composition and survival in patients with
colorectal cancer. Clin Nutr. 37:1279–1285. 2018. View Article : Google Scholar : PubMed/NCBI
|