Introduction
Acute myeloid leukemia (AML) is a hematologic
malignancy characterized by aberrant clonal amplification of
undifferentiated myeloid progenitors in bone marrow (BM) and
results in dysregulated hematopoiesis (1). In the USA, the morbidity and mortality
of AML are 13 and 7.1 per one hundred thousand persons,
respectively (2), and these values
in China are increasing (3). AML
outcomes are classified as favorable, intermediate and adverse.
Young patients with AML in the favorable and adverse groups had
three-year overall survival (OS) rates of 66 and 12% and three-year
disease-free survival (DFS) rates of only 55 and 10%, respectively
(4,5). Prognosis is related not only to age,
sex, karyotype, white blood cell (WBCs) count and blast cell count
but also to the expression and mutation of some critical genes
(6). Several biomarkers have been
proven to be useful in the diagnosis and prognosis of AML according
to recent studies (7,8) and some reports have shown that the
expression levels of some genes, such as SETBP1,
VEGFC and EVI1, are associated with the risk level
and the survival of patients (9-11).
However, OS and DFS of patients with AML remain poor (12,13).
Therefore, identifying additional AML-related genes is urgently
needed.
A typical feature of cancer is altered
transcriptional networks originating from genetic aberrances, which
drive disease occurrence and development (14,15).
These genetic abnormalities can act in conjunction with suitable
upstream and downstream molecules to exert procarcinogenic
activities. Therefore, the identification of novel transcriptional
networks and key nodes should help combat abnormal transcription.
Weighted gene correlation network analysis (WGCNA) is a statistical
technique based on functions in the R software package and is used
to identify groups of genes among microarray or transcriptome
sequencing data that are highly correlated with each other and with
biological traits (16). This
biological analysis method has been used in pancreas, colon and
bladder studies to identify important prognostic and therapeutic
targets in data from the Gene Expression Omnibus (GEO) and The
Cancer Genome Atlas (TCGA) (17-19).
In this study, we used WGCNA to identify genes in the coexpressed
network associated with AML.
Materials and methods
Clinical specimens
The clinical specimens used for RNA-seq were BM
cells from five patients with de novo AML (three females and
two males) with normal karyotypes. The five AML patients were
adults aged 17, 24, 26, 31 and 44 years. The French-American and
British (FAB) types were M1(2),
M4(2) and M5(1). The WBC count per liter of blood ranged
from 106x109 to 642x109. Hematopoietic stem
cells from mobilized peripheral blood (PB) of five healthy male
donors with a mean age of 33.8 years were used as controls. The
clinical specimens used to verify the differences in gene
expression included samples from patients with AML (30) and healthy individuals (43). The
thirty AML patients included 17 males and 13 females, and the
average age was 41.1 years, ranging from 24 to 64 years old.
Conventional cytogenetic analysis showed that 15 AML patients had a
normal karyotype, while the karyotype of the other patients showed
abnormalities. The FAB classification of the patients was
stratified as follows: 1 M0, 4 M1s, 7 M2s, 7 M4s and 11 M5s. The
healthy donors included 32 males and 11 females, and they ranged in
age from 11 to 58 years, with a mean age of 33.6. The collection
products from BM and PB were processes with red blood cell lysis
buffer (Beijing Solarbio Science & Technology Co., Ltd.) and
the leukocytes remaining after centrifugation were used in
subsequent RNA_seq or RT-qPCR.
This study protocol was approved by the
institutional medical Ethics Committee of Shenzhen Second People's
Hospital (Shenzhen, China). All patients and donors provided
informed consent for the molecular analysis of their samples.
Online data resources
Clinicopathological data, including blast cells, OS,
DFS and cytogenetic karyotype, of 200 AML specimens and the
corresponding mRNA expression data were downloaded from the TCGA
(https://gdc-portal.nci.nih.gov/).
Because some data were invalid, the clinical data of 170 PB blast
cells, 173 BM blast cells, 160 OS, 171 DFS and 156 karyotype
samples were finally included to investigate the prognostic
potential of candidate genes for AML. The mRNA expression data of
whole blood from 337 healthy donors were downloaded from the
Genotype-Tissue Expression (GTEx) database (https://gtexportal.org/home/index.html).
RNA sequencing
mRNA and lncRNA were isolated by removing the
ribosomal RNA from total RNA. Then, the remaining RNA was
fragmented (200-500 bp) and reverse transcribed into cDNA using
random primers. A cDNA template with an adapter was used for
fragment amplification and library construction. The libraries were
sequenced using an Illumina HiSeq 2000 system (Total Genomics
Solution Pte. Ltd.). Clean reads were retrieved after filtering out
sequences with poor quality and adaptor sequences from the raw
reads and were aligned with the reference genome (UCSC hg 19) by
HISAT (20).
Analysis of mRNA and lncRNA
expression
The transcripts of the samples were reconstructed by
StringTie (21), and redundant
transcripts were eliminated using Cuffcompare software (22). The lncRNAs were collected through
four filtering steps as follows: The short transcripts (<200 bp)
were removed, the background transcripts were removed, the known
transcripts and pre-mRNAs were removed, and the transcripts with
protein-coding potential were removed. The number of reads mapped
to the exon regions was calculated using HTseq software, and the
expression levels of lncRNAs and mRNAs were calculated as the RPKM.
CircRNA was selected as the intersection of the results, which were
predicted by find_circ and CIRI software. The expression levels of
the circRNAs were calculated with the pseudo RPKM method.
Weighted correlation network
analysis
The mRNAs, lncRNAs and circRNAs were screened from
the transcriptome profiles according to the following criteria: The
expression levels of mRNAs and lncRNAs must be ≥ one in all
specimens; the coefficient of variation must be at least 0.5; and
circRNA must be expressed in 80% of the specimens. The resulting
RNAs were used to construct the weighted gene coexpression network
by WGCNA (https://labs.genetics.ucla.edu/horvath/htdocs/CoexpressionNetwork/Rpackages/WGCNA/).
First, Pearson's method was used to calculate the pairwise
correlation coefficients of the genes and to construct the gene
expressive correlation matrix. Next, the appropriate value of the
soft-thresholding power (β) was selected to build a weighted
adjacency matrix, which was further transformed into a topological
overlap matrix (TOM) and dissimilarity matrix. The latter was used
for hierarchical clustering and dynamic cutting. The main modules
were identified after an appropriate cutHeight point for cutting
the tree was chosen and modules with similar eigengenes were
merged.
Identifying the module associated with
AML and functional enrichment analysis
The module eigengene (ME) represents a distinctive
gene expression pattern of a module in a sample. The module-trait
relationships were calculated using the correlation between
modules' MEs and traits of AML. The gene significance (GS) was used
to combine the clinical traits with the coexpression network. The
higher the absolute value of GS, the more biologically meaningful
the gene in a module is. Module significance (MS) is defined as the
average absolute GS measured for all genes in a given module. The
genes in the module of interest were subjected to Gene Ontology
(GO) analyses. A P-value <0.05 was considered to be the cut-off
criterion for significance.
Candidate prognostic target
selection
The nodes (genes) in an undirected, weighted gene
network corresponded to gene expression profiles. The edges between
genes were determined by pairwise correlations between the
expression levels of the genes. The genes in the module that were
highly associated with AML were selected as candidate genes with
the criterion of a weighted value (edge width) that was not smaller
than 0.4 between any two genes in the module. The weighted value
between the genes was derived from the TOM matrix. We graphed the
candidate gene coexpression network using Cytoscape software.
RNA extraction and RT-qPCR
Clinical specimens were washed with RBC lysis buffer
(Beijing Solarbio Science & Technology Co., Ltd.) to remove the
red blood cells (RBCs) and washed at least once with PBS buffer.
Then, for the extraction of total RNA, the remaining white cells
were suspended in RNAiso Plus reagent (Takara Bio, Inc.) and placed
in a -80˚C refrigerator according to the manufacturer's
instructions. A Prime Script II cDNA synthesis kit (Takara Bio,
Inc.) was used to perform reverse transcription. In total, 2 µg of
RNA was converted into cDNA with random primers. The RT-qPCR system
was prepared with TB Green Premix Ex Taq II (Takara Bio, Inc.) and
the reaction was performed on a QuantStudio DX (Applied Biosystems;
Thermo Fisher Scientific, Inc.). The primers for the candidate and
reference genes are listed in Table
SI.
Statistical analysis
The relationships between the percentage of blast
cells in the BM or PB of AML patients and the expression levels of
genes were statistically analyzed by Pearson's correlation, and a
two-tailed P<0.05 was considered significant followed by
Bonferroni multiple testing correction. The gene expression level
was a continuous variable that was discretized for OS and DFS
analyses. We determined the optimal cut-off point using the
maximally selected rank statistics generated by R Version 3.5.0
(https://cran.r-project.org/web/packages/maxstat/index.html)
(Table I). We compared the
difference in survival between patients with high gene expression
levels and patients with low gene expression levels by the log-rank
test, and P<0.05 indicated that the survival curves were
significantly different.
 | Table IThe optimal cut-off points of the
candidate genes for OS and DFS. |
Table I
The optimal cut-off points of the
candidate genes for OS and DFS.
| | OS | DFS |
|---|
| Genes | Cut-off point | Statistic | Cut-off point | Statistic |
|---|
| PTPRJ | 10.41 | 1.33 | 10.05 | 1.49 |
| WLS | 3.92 | 1.21 | 1.51 | 2.50 |
| EXT1 | 4.20 | 3.04 | 7.00 | 1.85 |
| KREMEN1 | 5.52 | 1.90 | 5.52 | 2.15 |
| ALPL | 0.94 | 1.89 | 3.30 | 3.57 |
| QPCT | 2.22 | 2.46 | 6.31 | 1.17 |
| CR1 | 7.99 | 1.51 | 11.60 | 2.34 |
| RASSF5 | 11.31 | 2.70 | 10.98 | 2.22 |
| RAB43 | 7.44 | 1.94 | 5.25 | 2.23 |
| SEMA4B | 8.68 | 1.99 | 8.14 | 2.06 |
| GLT1D1 | 8.34 | 1.36 | 8.34 | 1.07 |
|
SLC25A37 | 10.94 | 1.71 | 11.99 | 1.83 |
| PIK3CD | 12.46 | 1.73 | 12.46 | 1.99 |
| LMTK2 | 9.34 | 3.29 | 9.34 | 2.99 |
| IGSF6 | 5.69 | 1.80 | 5.69 | 1.52 |
| ECE1 | 9.52 | 4.78 | 9.22 | 3.65 |
| STEAP4 | 5.81 | 1.58 | 3.09 | 1.91 |
| SLC44A2 | 11.09 | 3.12 | 10.95 | 2.49 |
| CSF3R | 14.50 | 4.14 | 13.43 | 4.31 |
| DOK3 | 11.80 | 1.24 | 10.52 | 2.51 |
Results
Construction of the modules by WGCNA
among transcriptomes
The cDNA libraries of ten samples comprising
leukemic cells from 5 AML patients with a normal karyotype and
hematopoietic cells from 5 healthy donors were constructed for
Illumina sequencing. A total of 1,022,008,940 clean reads with
153.3 Gb clean bases were obtained. The average Q20 and Q30 of the
samples were 97.03% and 92.95, respectively (Table SII) and the top 20 differentially
expressed genes (DEGs) are listed in Table SIII.
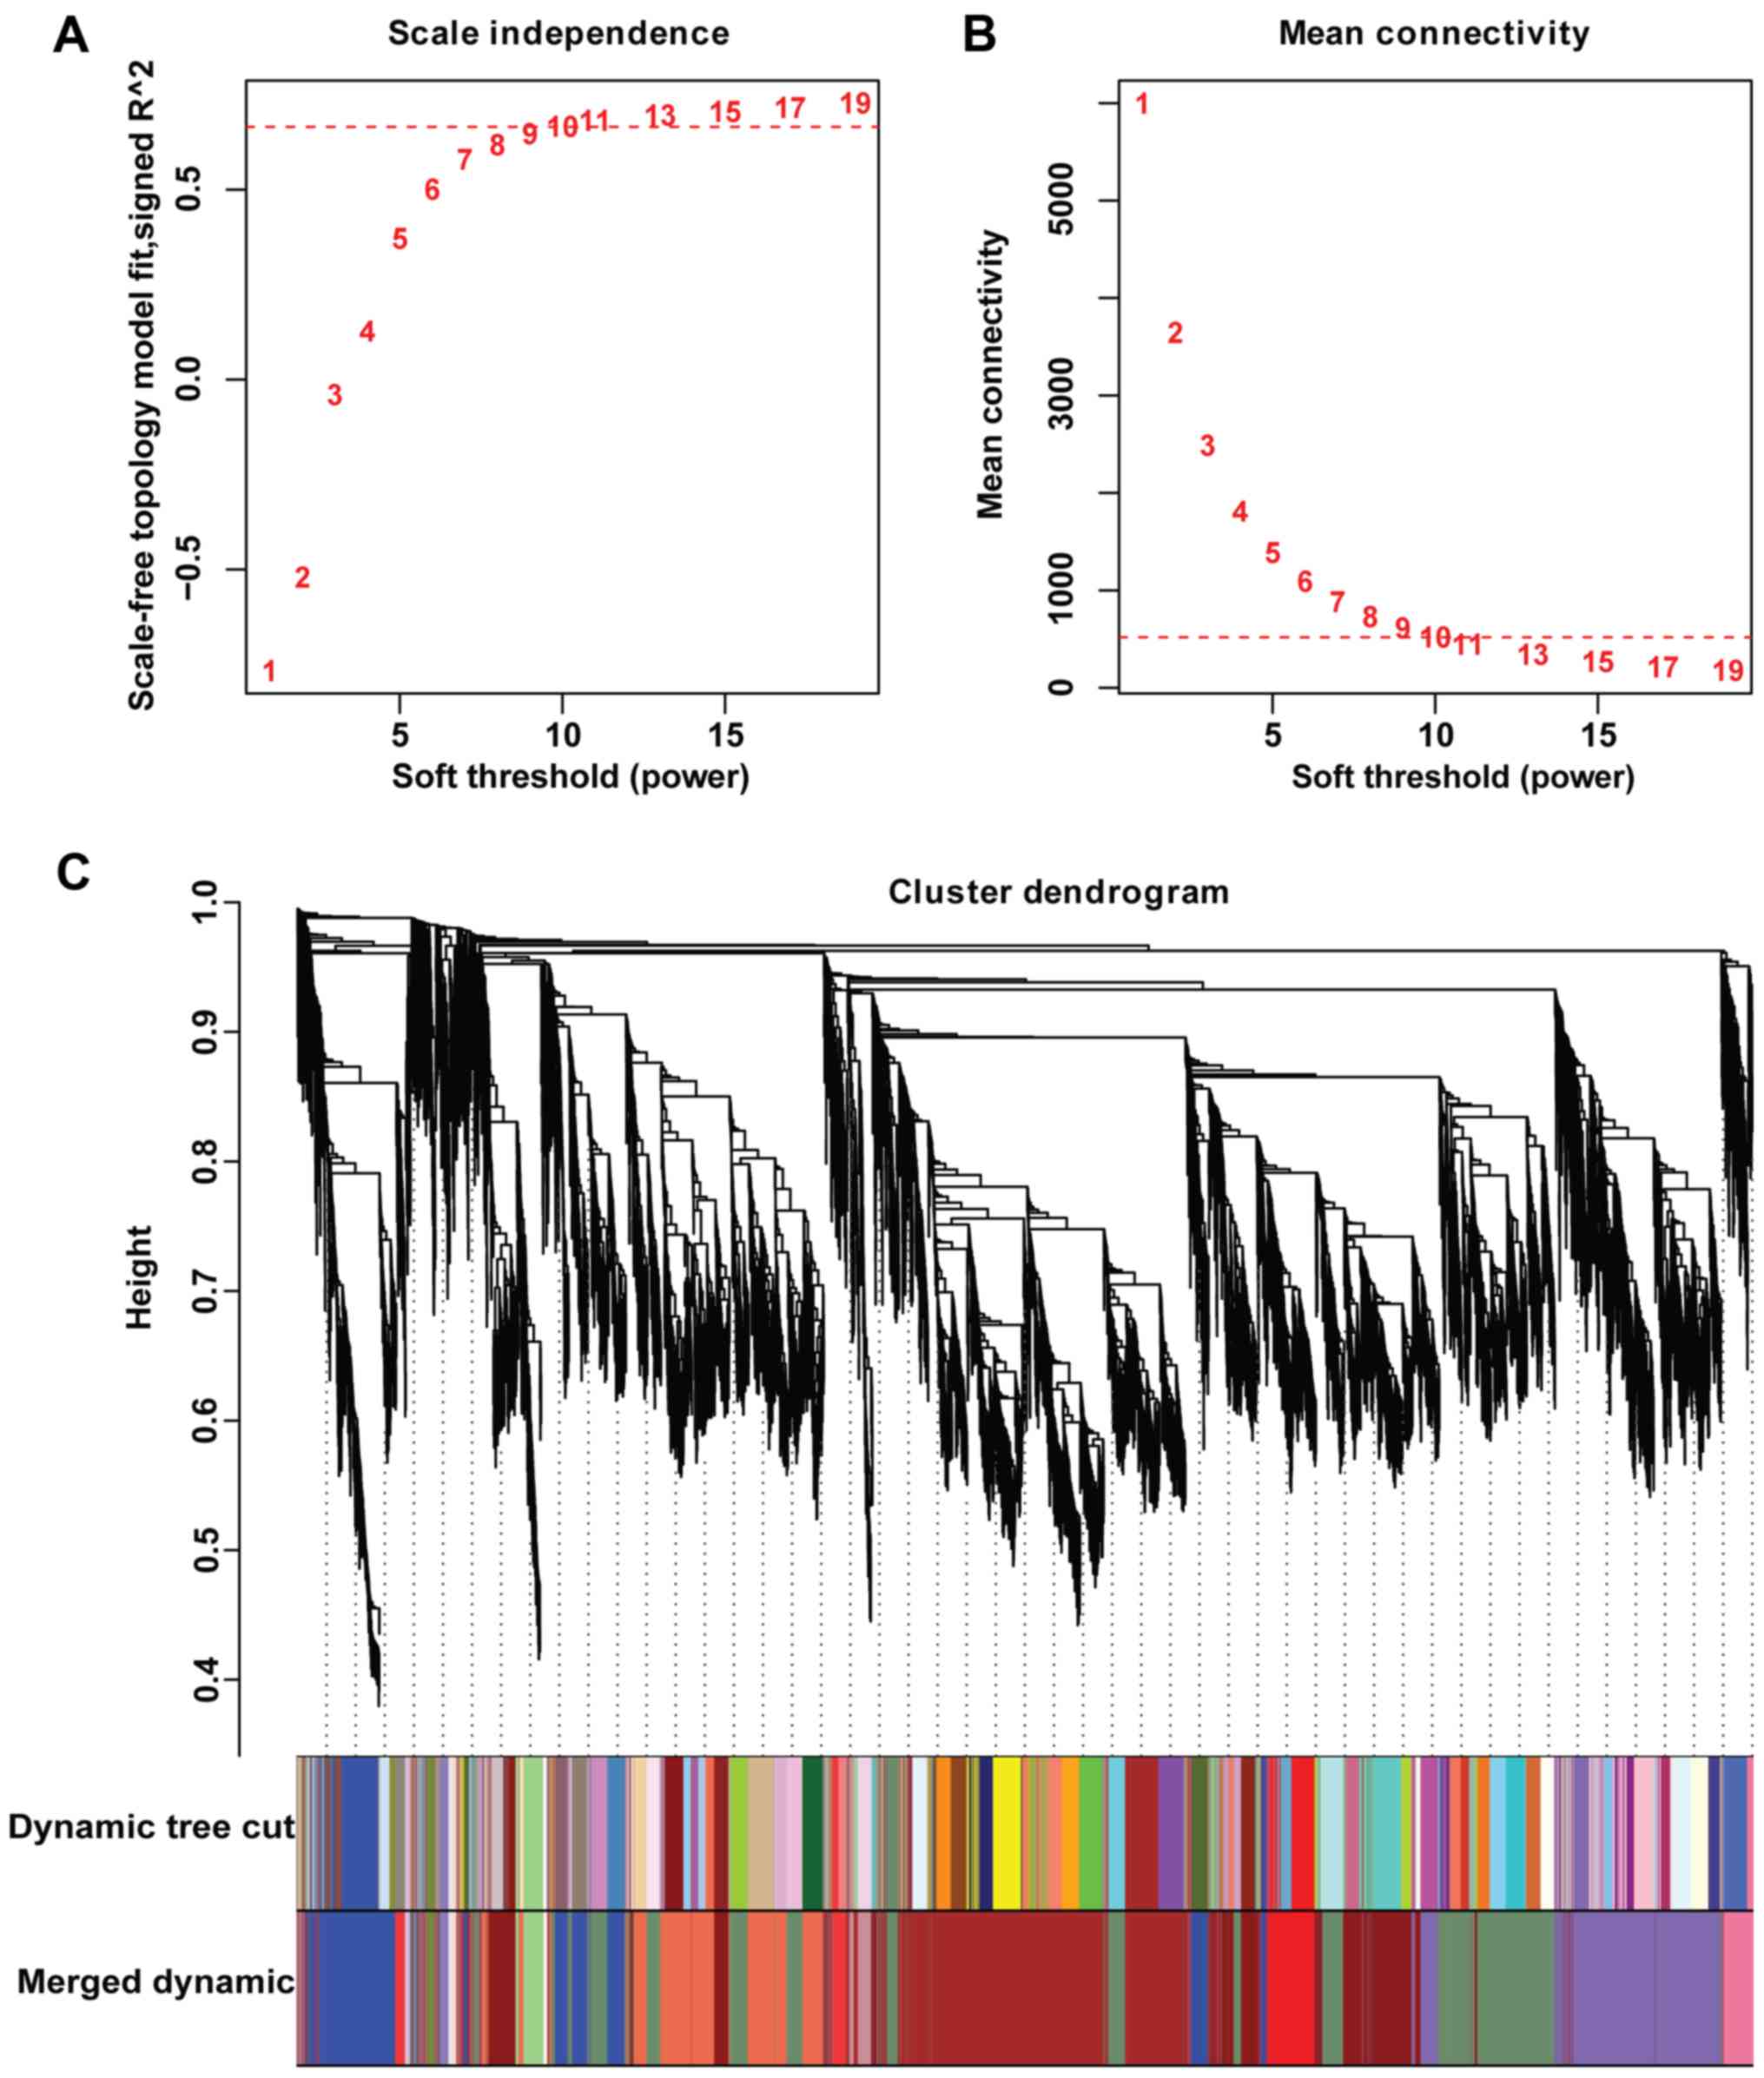
A total of 12,894 genes identified from RNA_seq were
used to construct the gene coexpression network by WGCNA. The
correlation coefficient matrix was calculated by Pearson's
correlations among the 12,894 genes. Then, the adjacency matrix was
constructed through index transformation, and the soft-thresholding
power (β) value was 10 according to the approximate scale-free
topology criterion (Fig. 1A and
B). A module is a group of genes
with highly interconnected traits, as revealed by the topological
overlap, and the modules were identified using hierarchical
clustering dendrograms. Eighteen modules were obtained through the
dynamic branch cutting method (cutHeight=0.18; Fig. 1C).
The red module was closely related to
AML
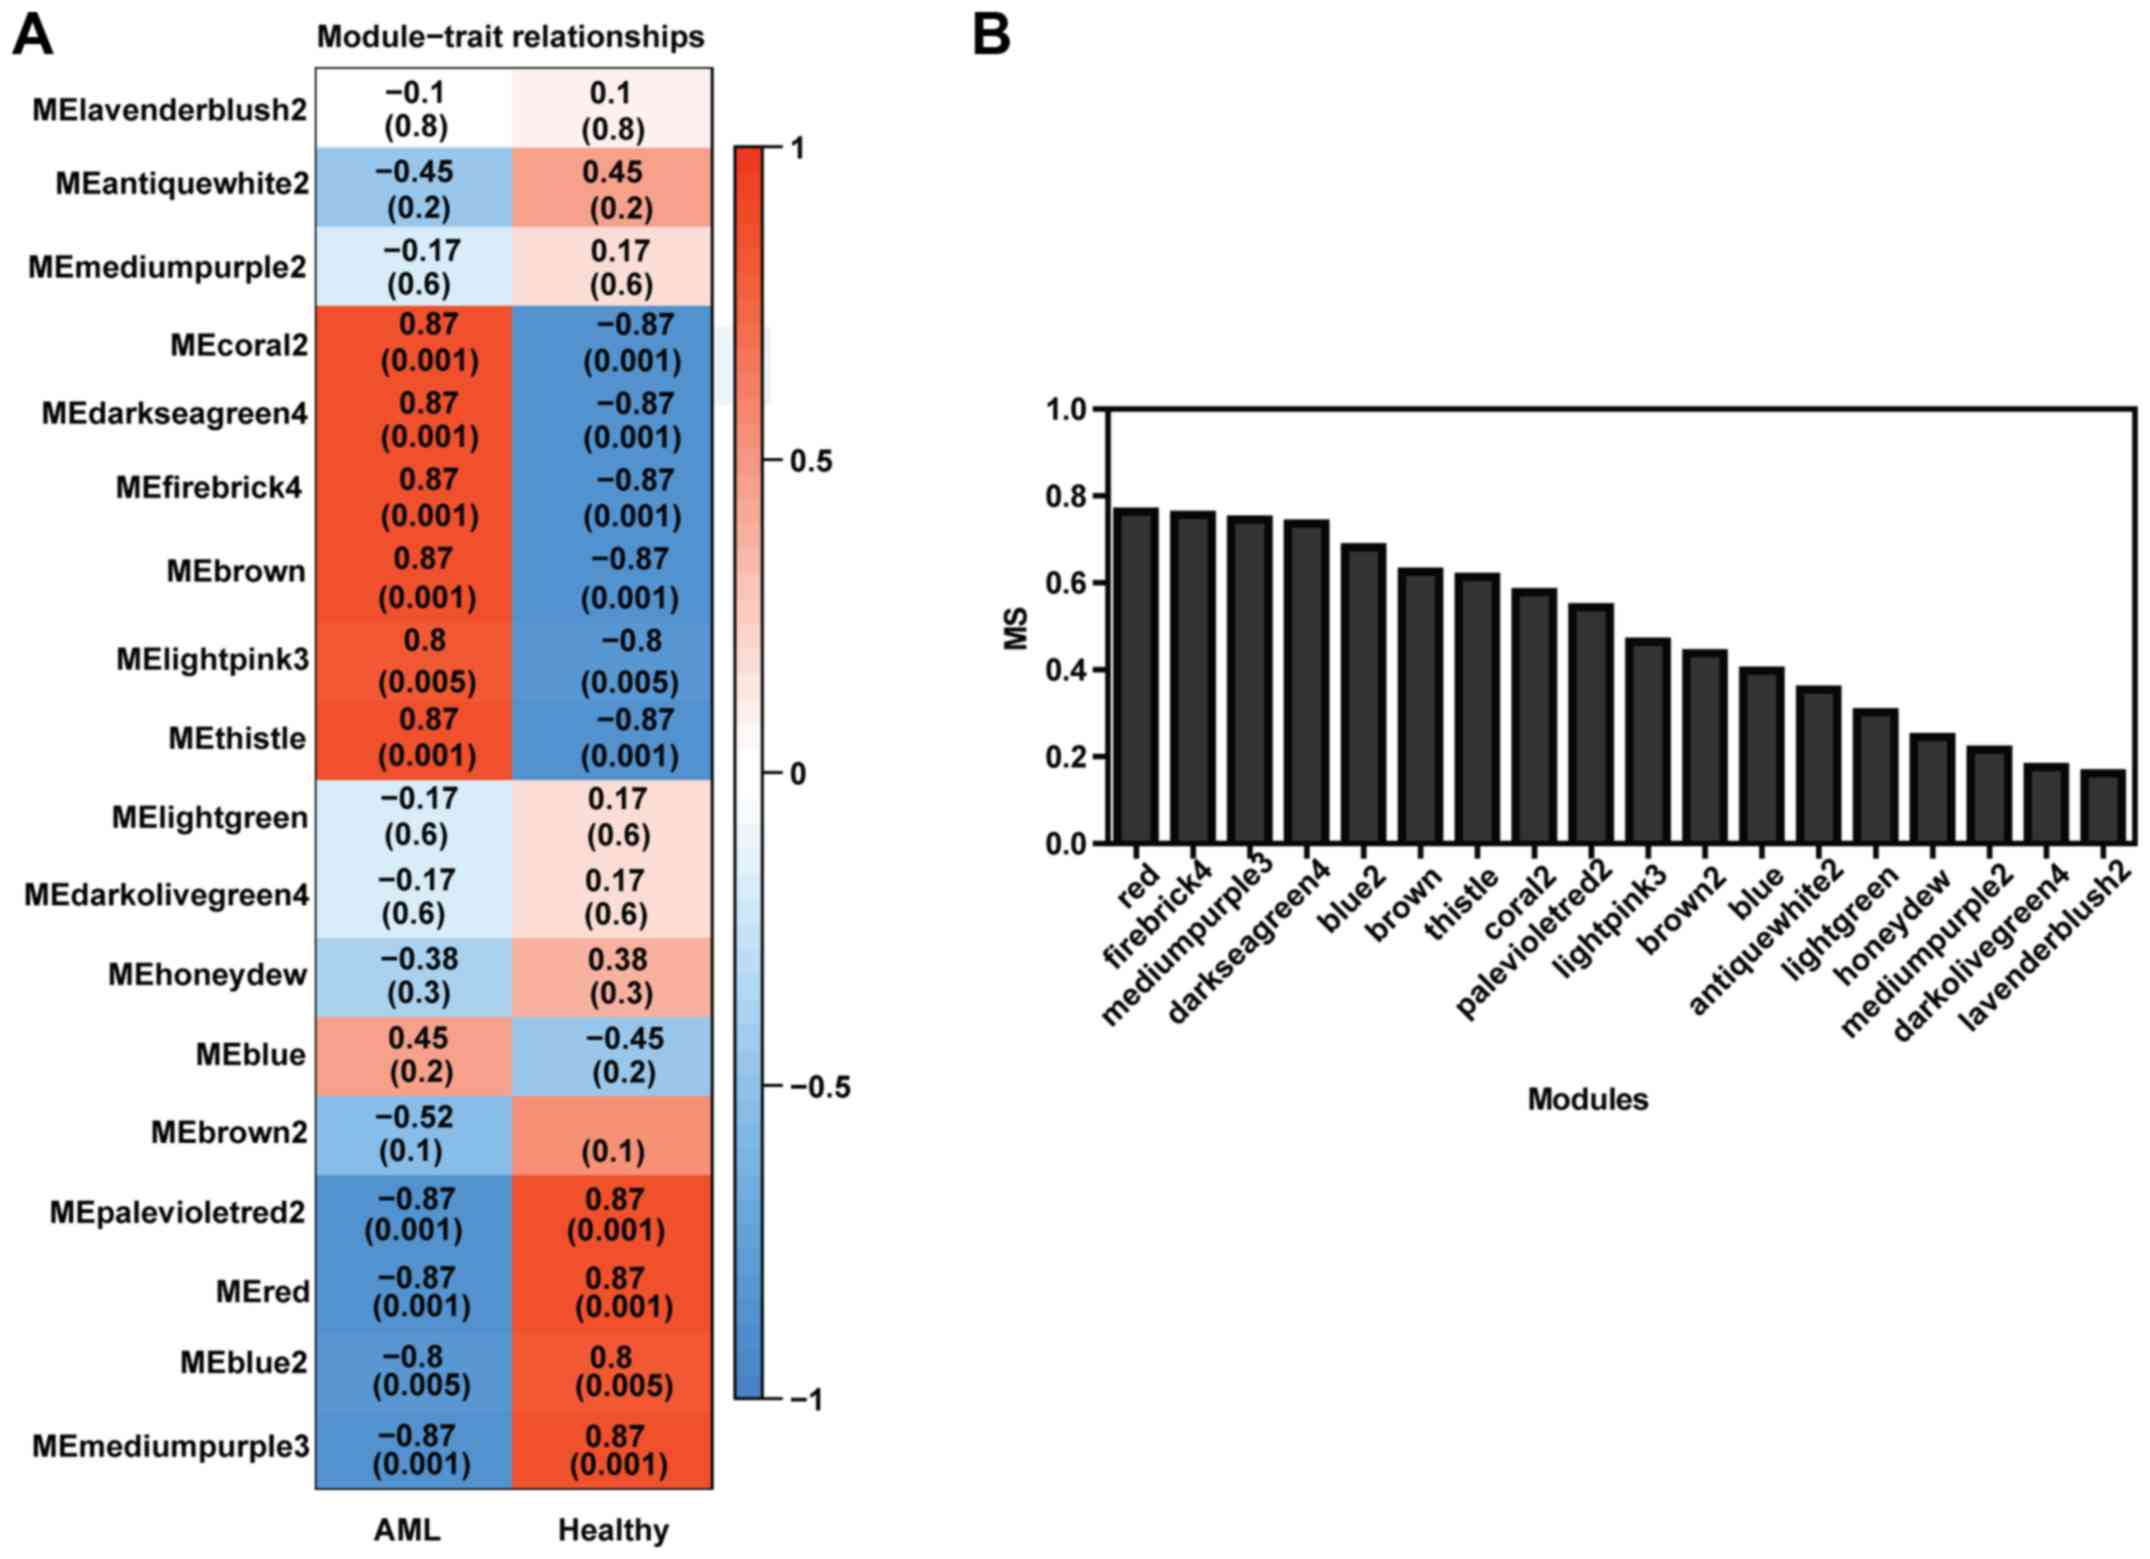
Although six modules have significantly positive
relationships with clinical traits and four modules have remarkably
negative associations with the AML according to their correlation
coefficients and P-values (Fig. 2A),
we found that, among the eighteen modules, the red module had the
greatest MS value (slightly higher than the firebrick4 module,
Fig. 2B). This finding suggested
that the red module may be the most biologically meaningful in AML.
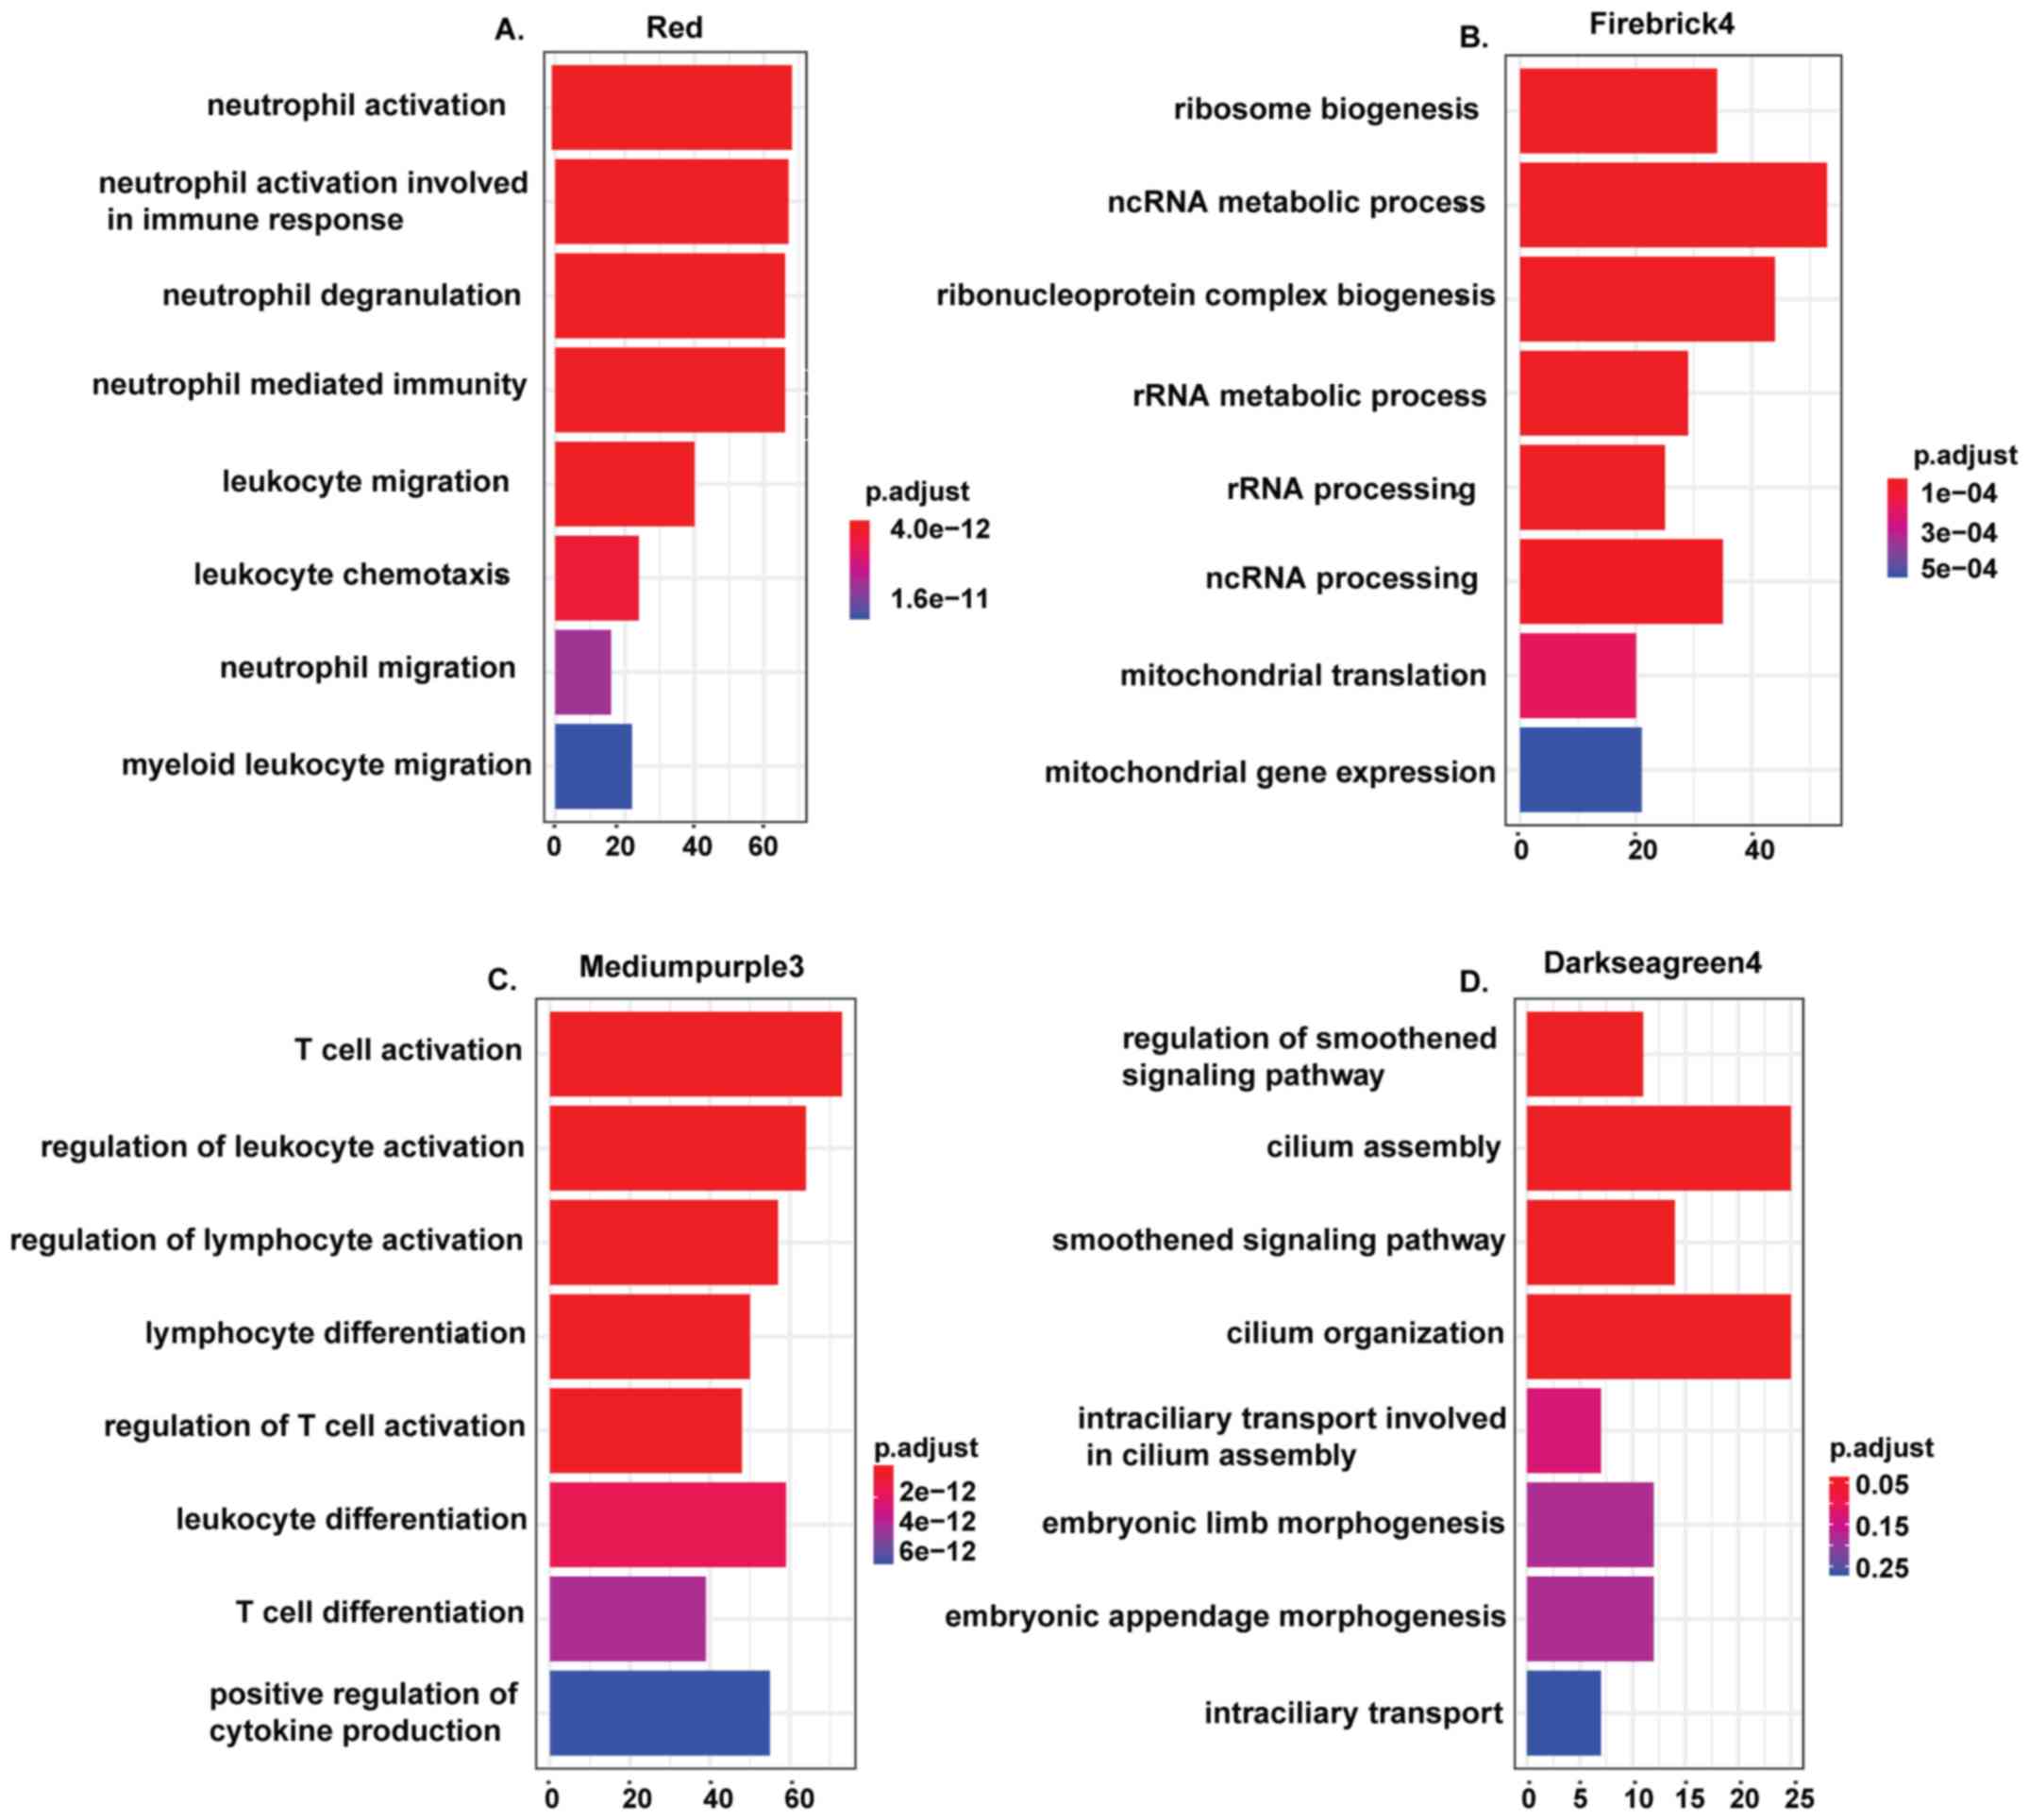
Furthermore, the protein-coding genes presented in each module were
subjected to GO functional enrichment analysis. Assessment of the
biological processes showed that the genes within the red module
were enriched in processes associated with the biological
characteristics of hematopoietic cells such as neutrophil
activation (P-value=2.38x10-45), neutrophil
degranulation (P-value=7.47x10-43) and leukocyte
migration (P-value=2.09x10⁻¹⁸; Fig. 3A), while the genes in firebrick4
module were enriched in genes related to ribosome biogenesis
(P-value=2.51x10⁻¹²) and ncRNA metabolic process
(P-value=3.14x10⁻¹¹; Fig.
3B); genes in mediumpurple3 were mainly enriched in T cell
activation (P-value=5.31x10⁻²⁷; Fig. 3C); and genes in the darkseagreen4
were enriched in the regulation of the smoothened signaling pathway
(P-value=1.71x10⁻⁵; Fig.
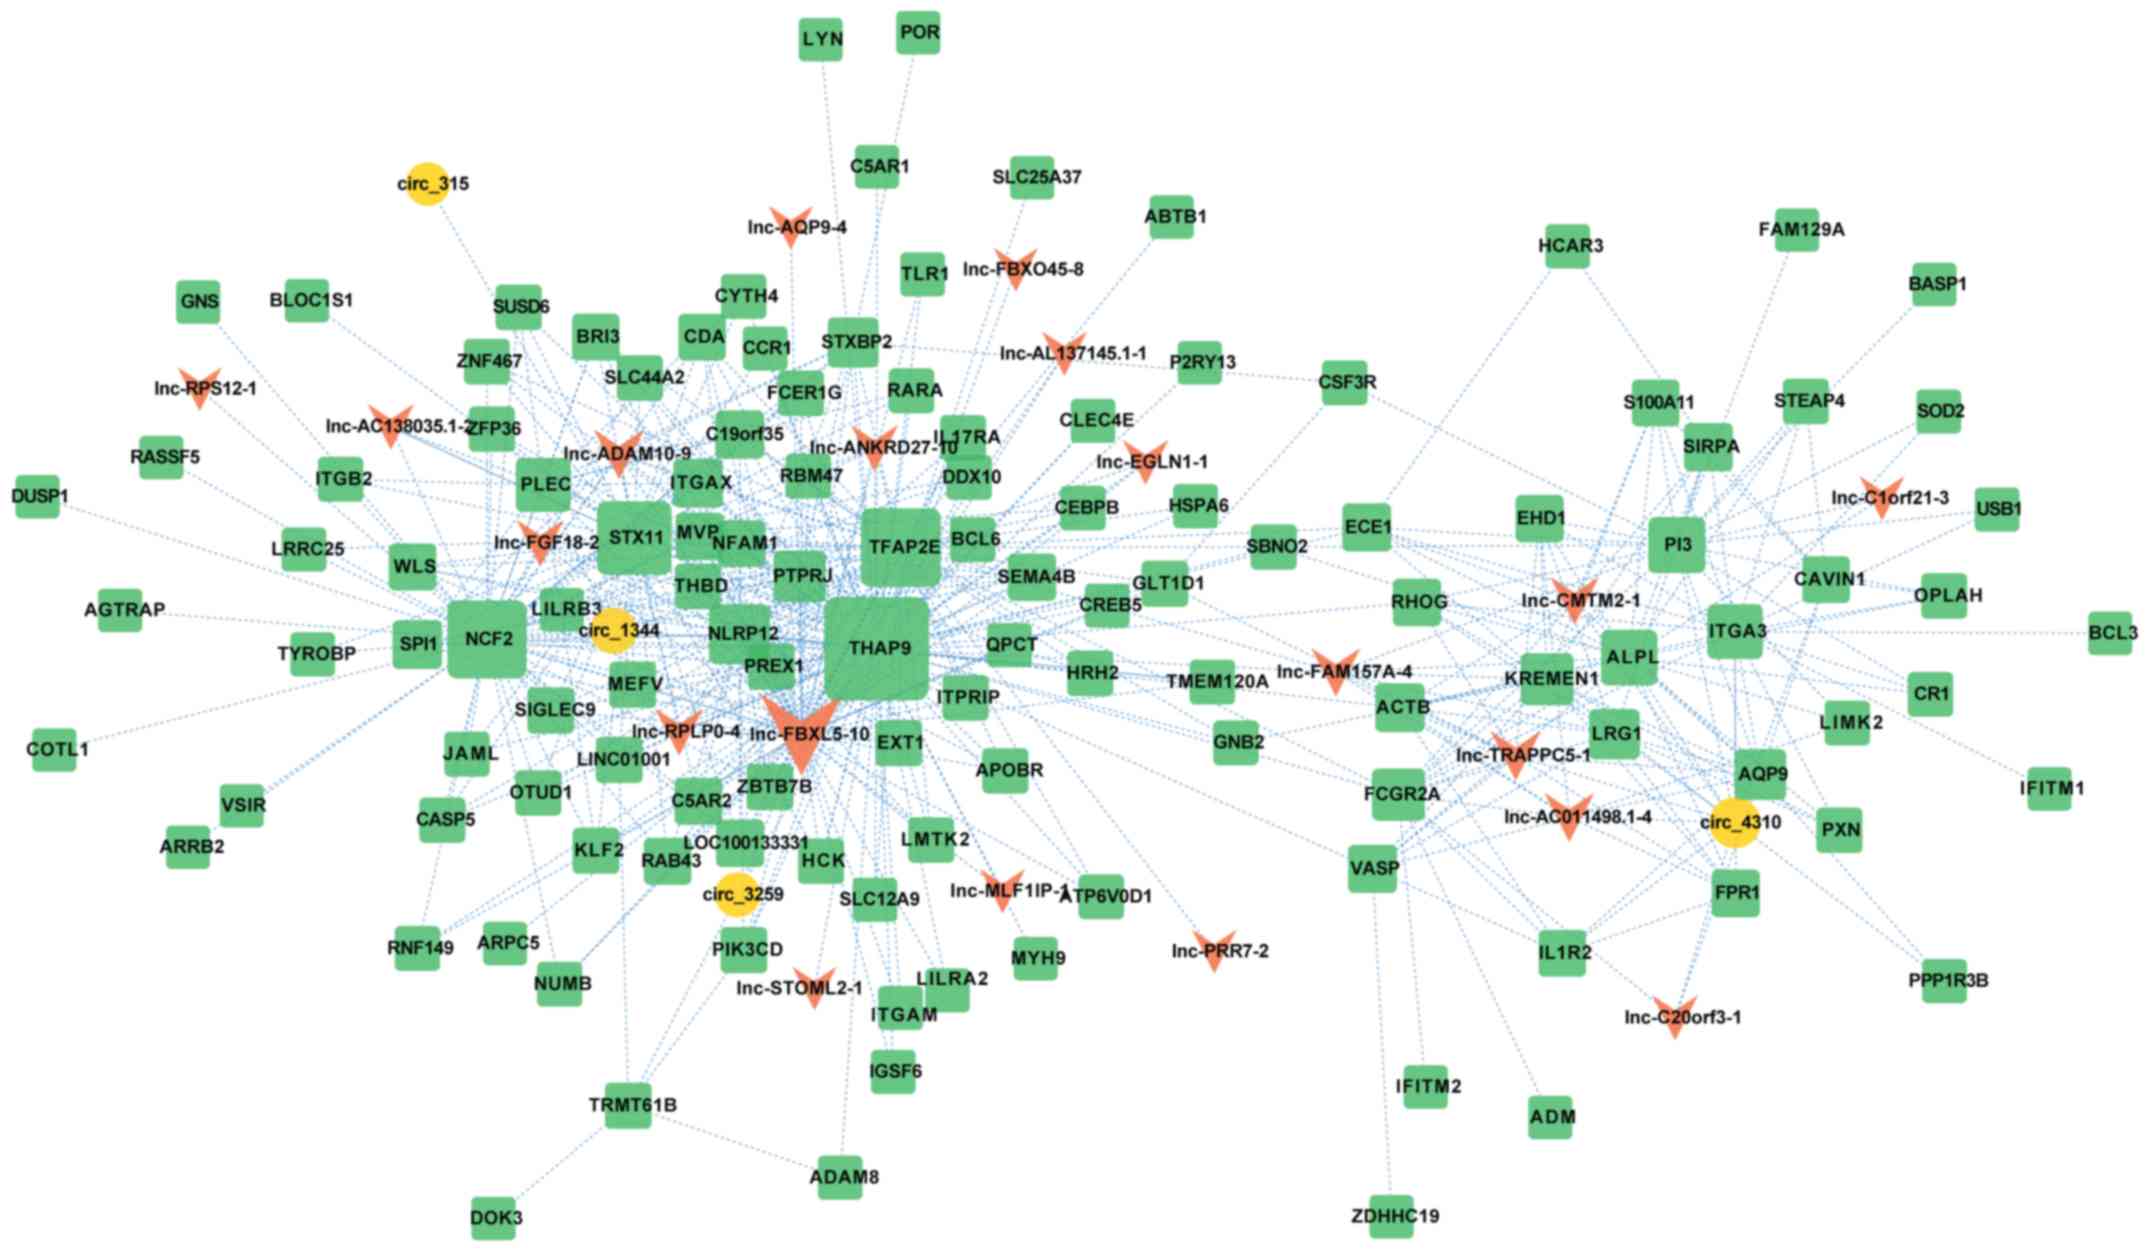
3D). The functional annotation of the genes in the red module
revealed that they are intimately associated with the physiological
development of hematopoietic cells and significantly correlated
with AML. Based on the high pairwise-weighted values of genes in
the red module, we drew the central nodes and their pattern of
connectivity (Fig. 4). The network
was composed of 147 nodes and 482 edges, corresponding to 123
mRNAs, 20 lncRNAs and 4 circRNAs (Table
SIV).
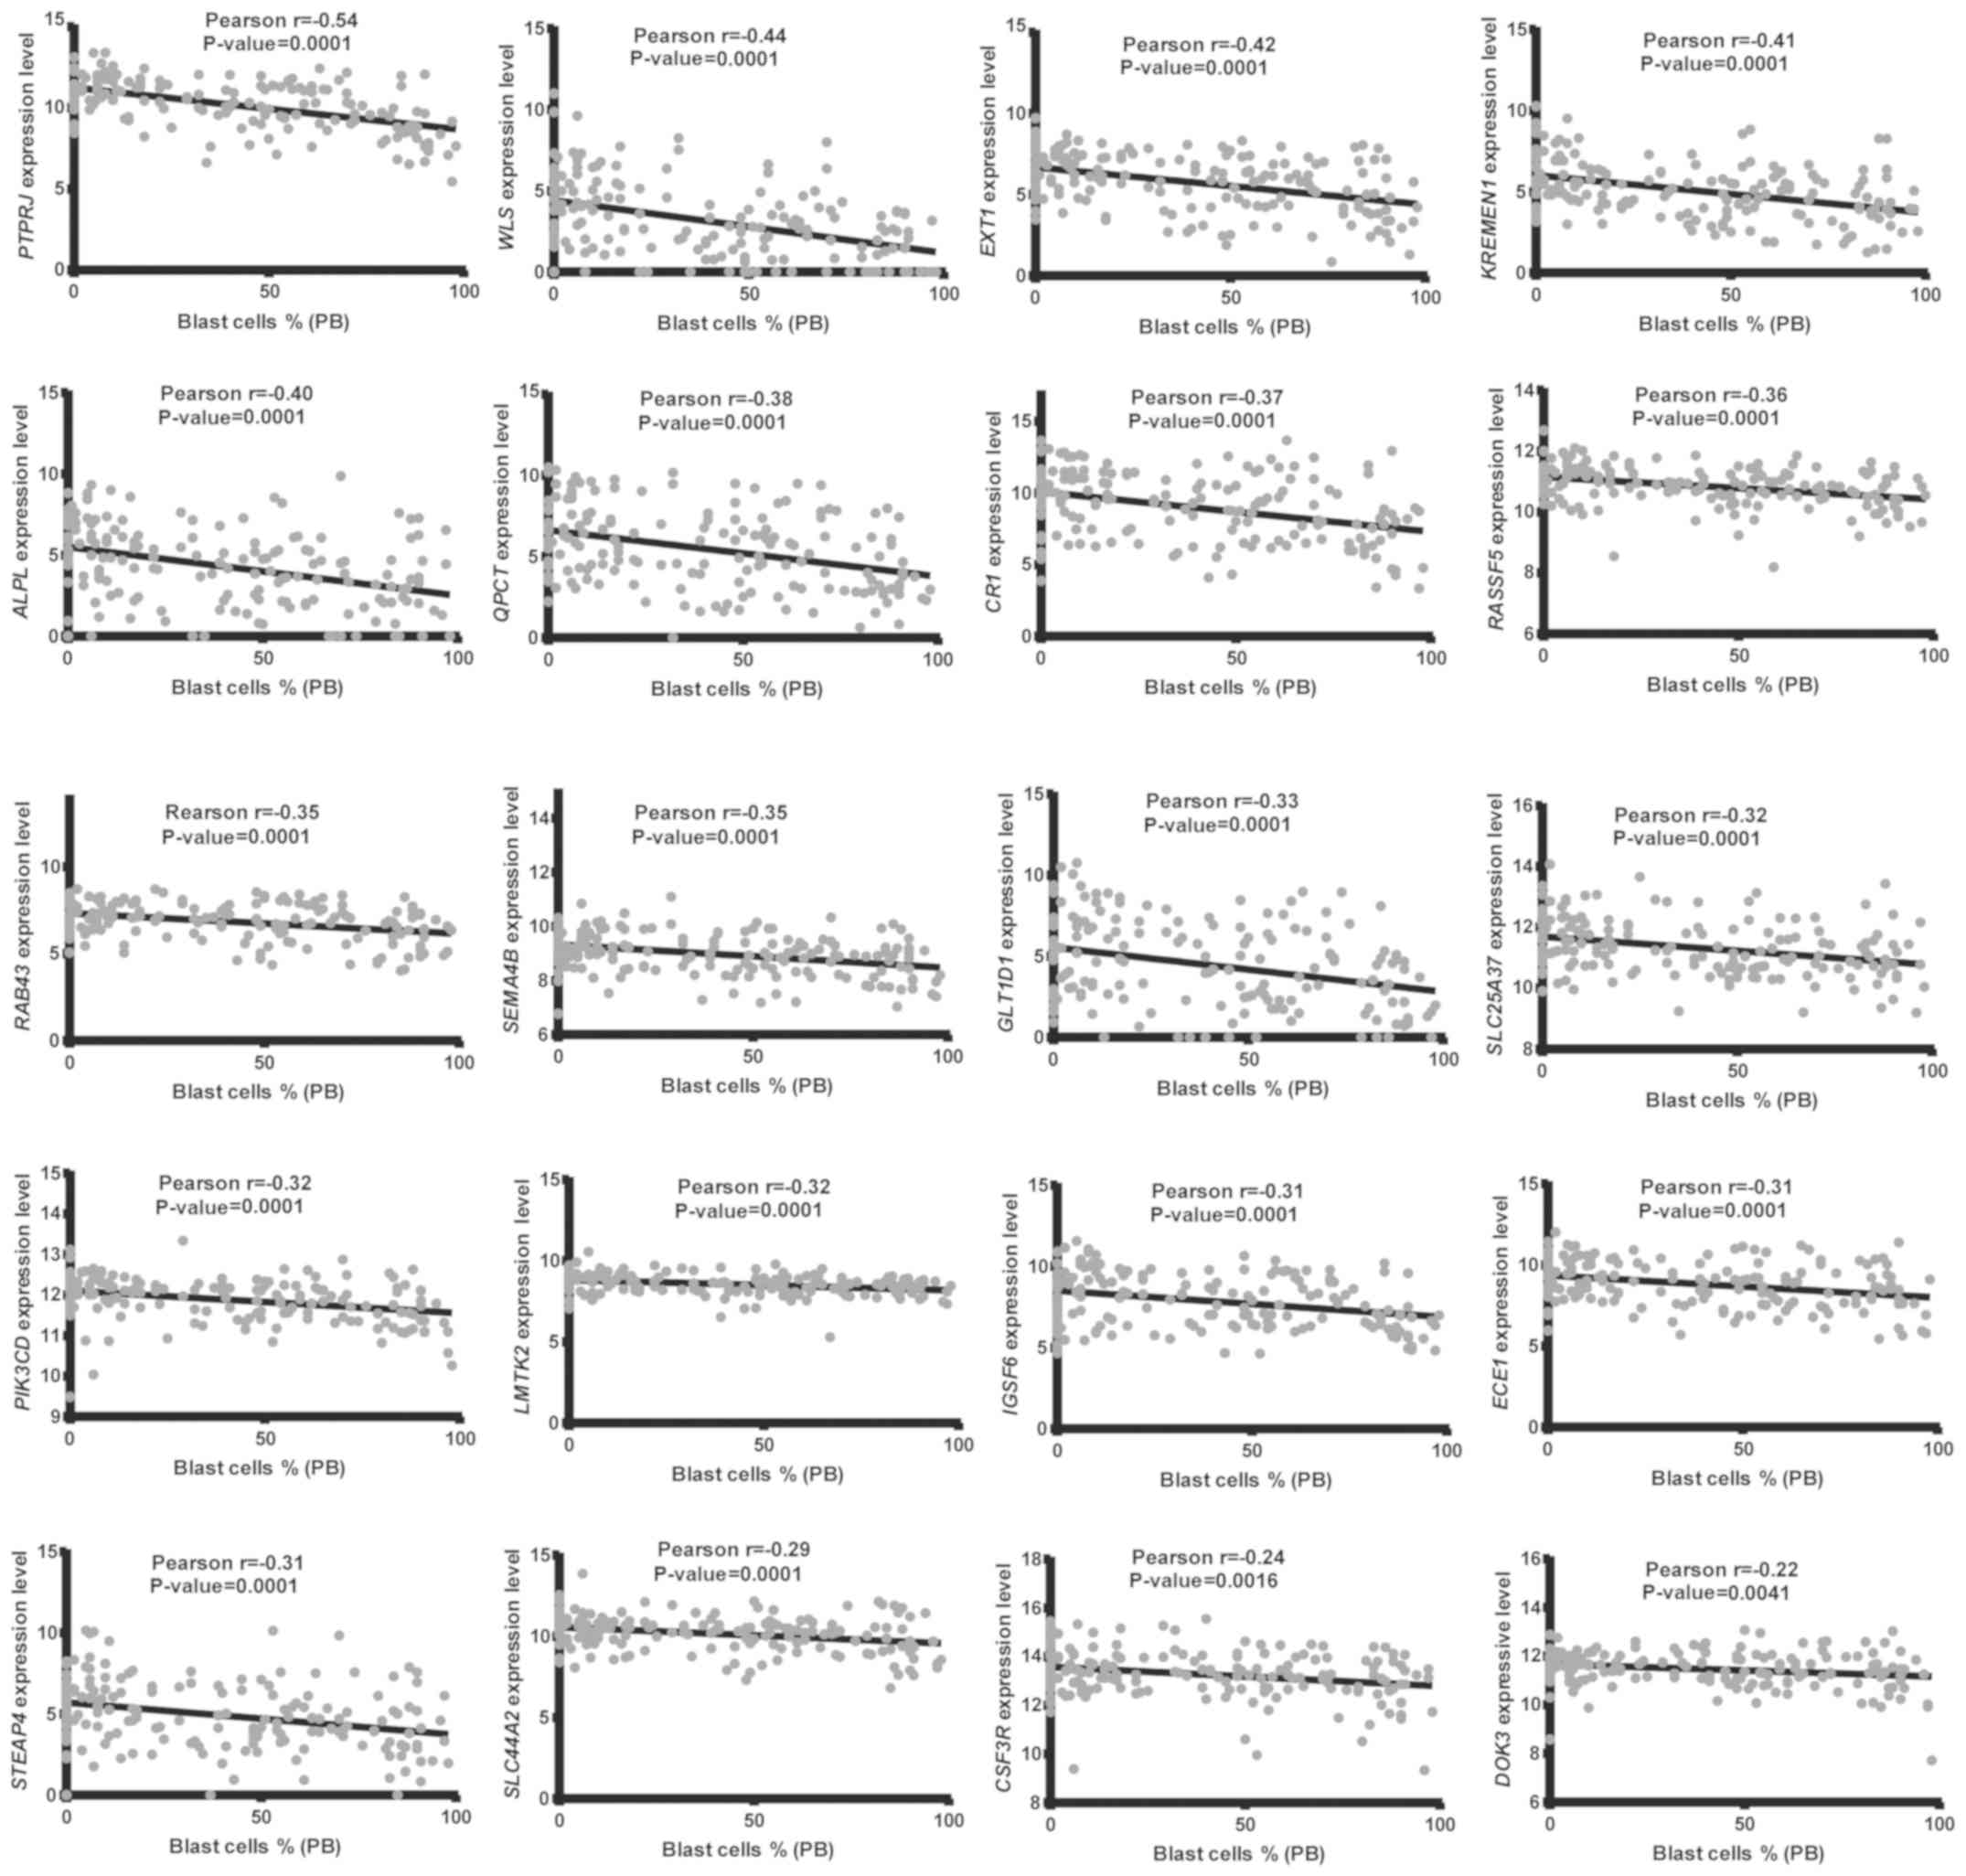
Genes associated with the blast cells
of AML patients
The circRNAs (4),
lncRNAs (20), and some mRNAs
(9) were removed from the 147 nodes
in the network because of the lack of expression data on these RNAs
in the TCGA database. The correlation between the expression levels
of the remaining 114 genes and the blast cell percentage in BM
(173) and PB (170) of patients diagnosed with AML were
investigated. The results demonstrated that 23 genes had negative
correlations with the percentage of blast cells in BM, although the
relationships were weak (Pearson's r value ranged from -0.33 to
-0.15; Fig. S1). In addition, 20 of
the 23 genes had a significant negative relationship with the
percentage of blast cells in PB (Pearson's value is from -0.22 to
-0.54; Fig. 5). These 20 genes were
correlated with blast cells in both BM and PB and may play
important roles in regulating the growth of leukemic cells.
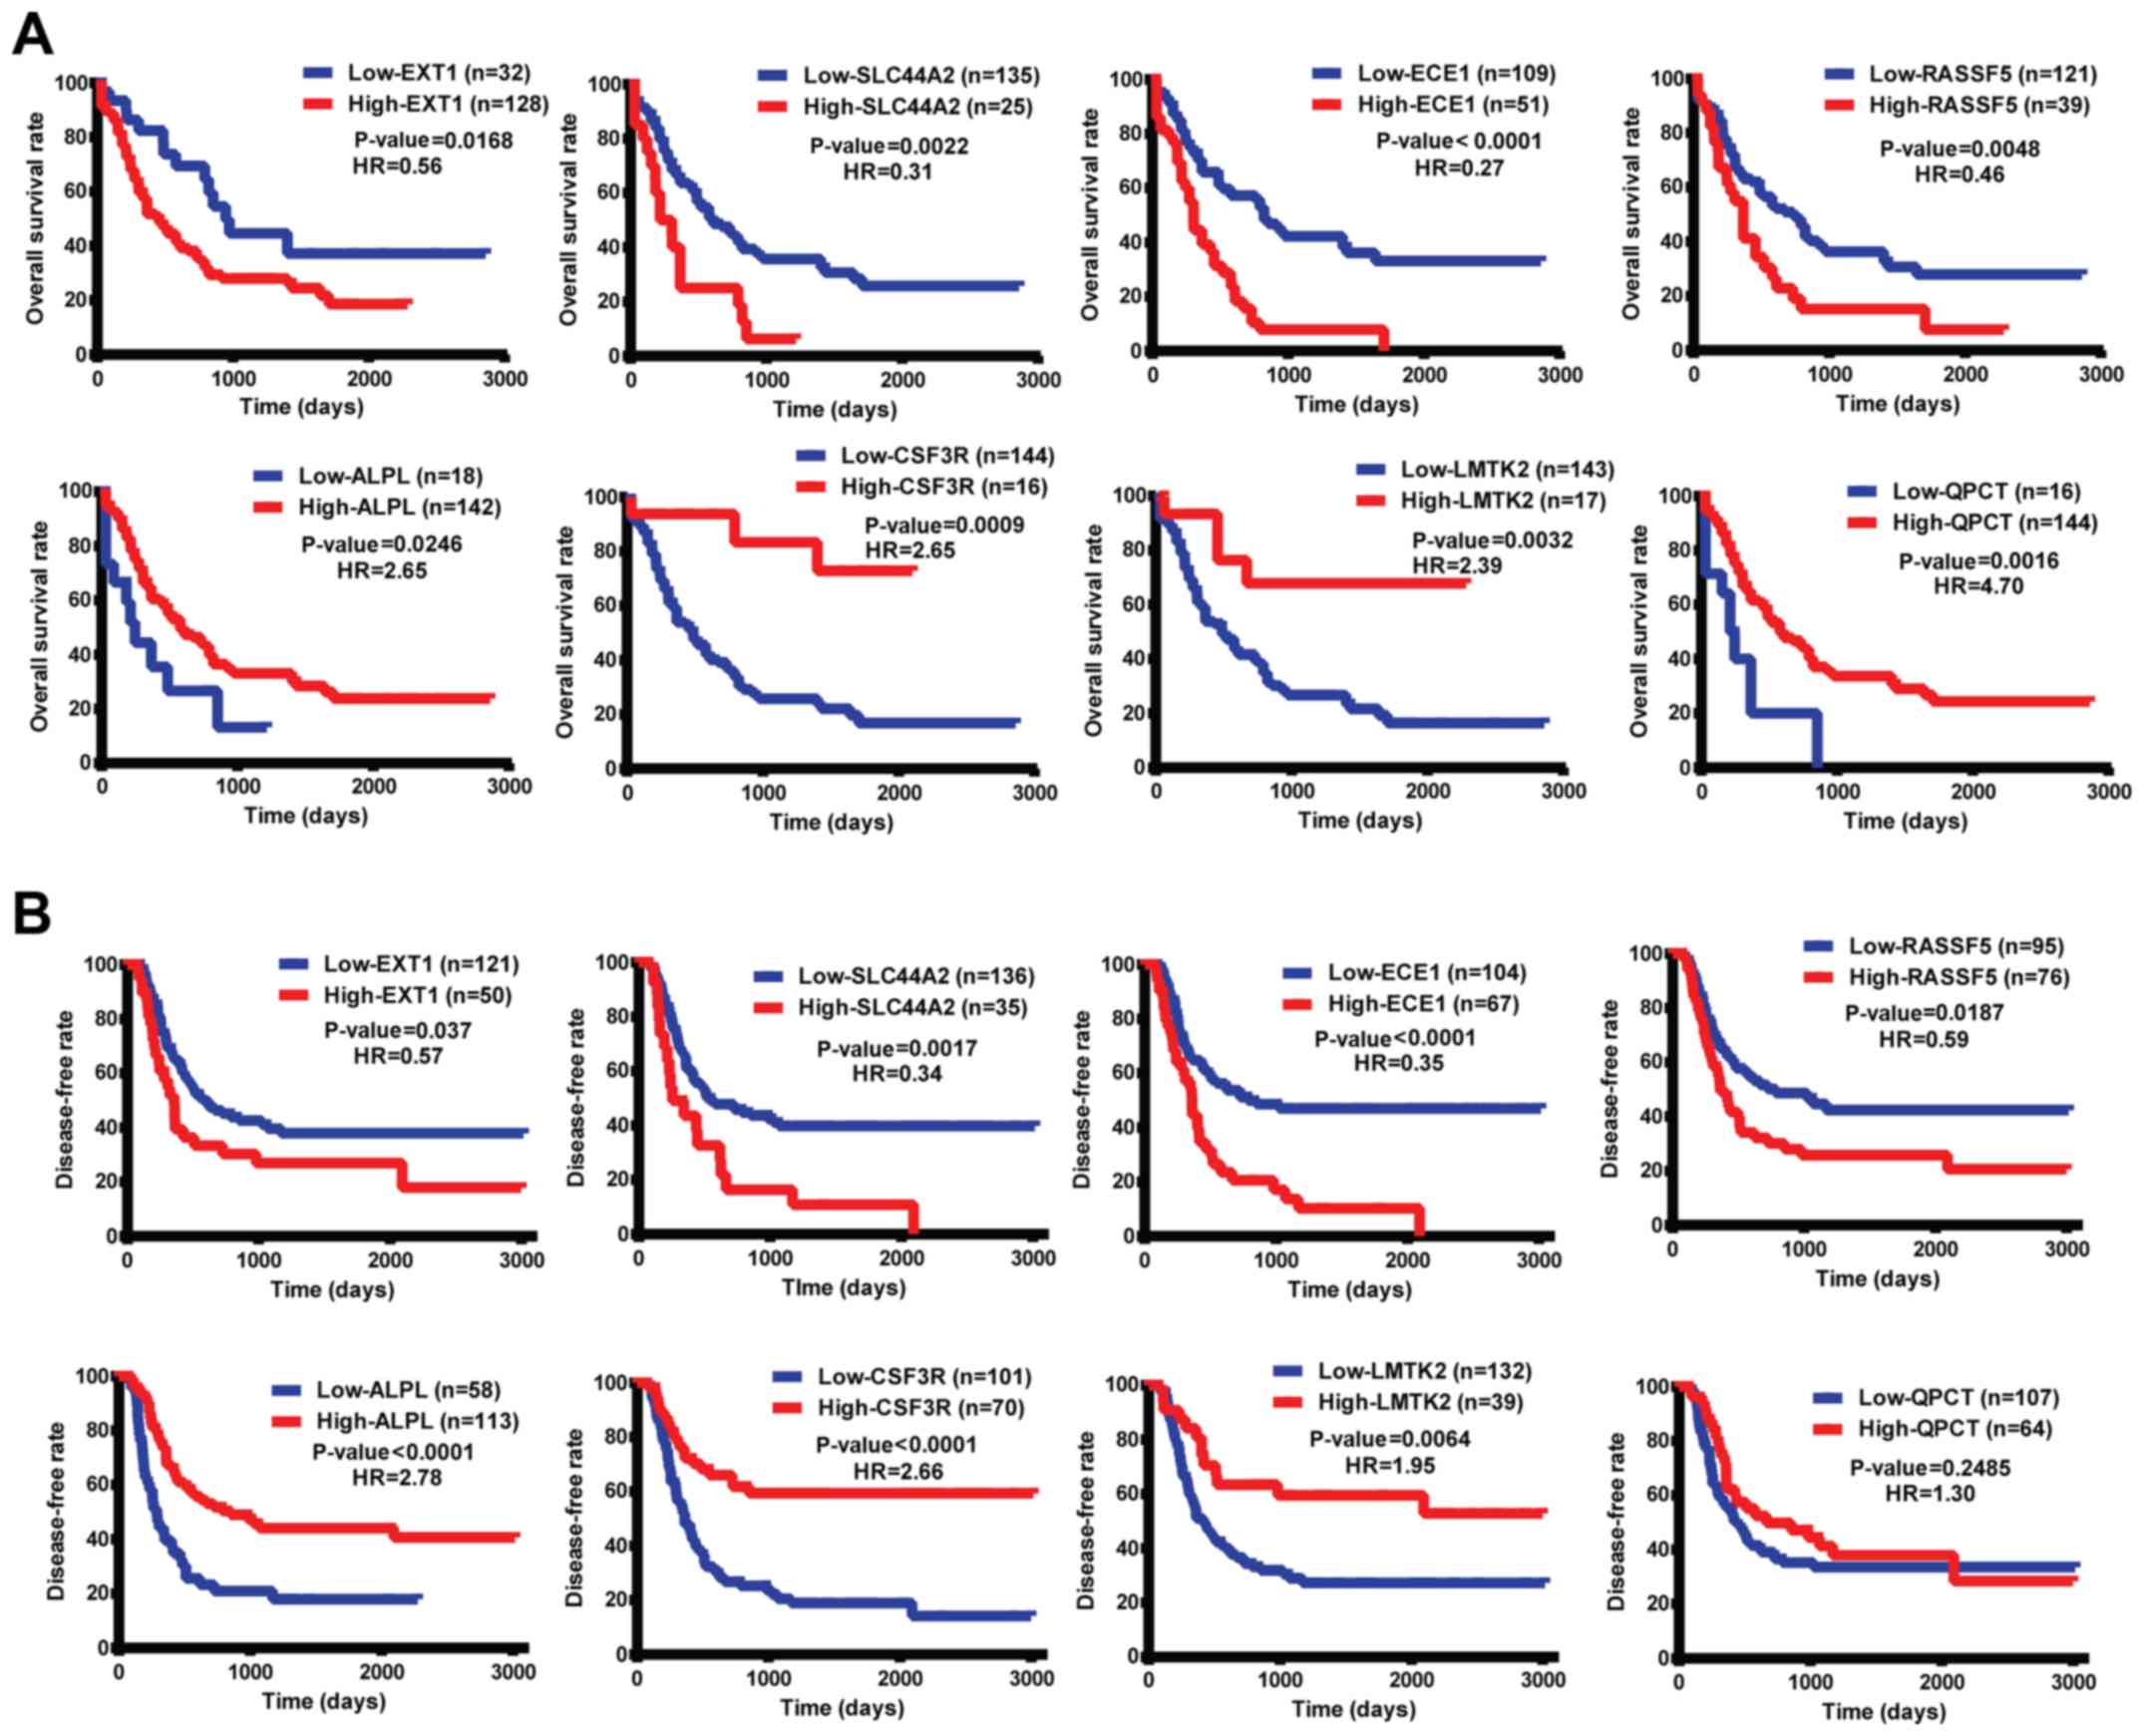
Genes associated with OS and DFS of
AML patients
Next, we used the endpoints of OS and DFS to analyze
the association of the 20 genes with the survival of AML patients.
The AML patients were categorized into low (≤ cut-off point) and
high (> cut-off point) groups based on the expression levels of
the 20 genes. Log-rank analysis showed that the OS of AML patients
between the two groups was significantly different when the
patients were stratified by the expression levels of the
EXT1, SLC44A2, ALPL, CSF3R,
ECE1, LMTK2, QPCT and RASSF5 genes.
Patients with low expression levels of EXT1, SLC44A2,
ECE1 and RASSF5 exhibited higher survival rates than
those with high expression levels of these genes, while patients
with high expression levels of ALPL, CSF3R,
LMTK2 and QPCT had better survival rates than those
with low expression levels of these genes (Fig. 6A). In addition, all these genes (with
the exception of QPCT) were correlated with DFS (Fig. 6B).
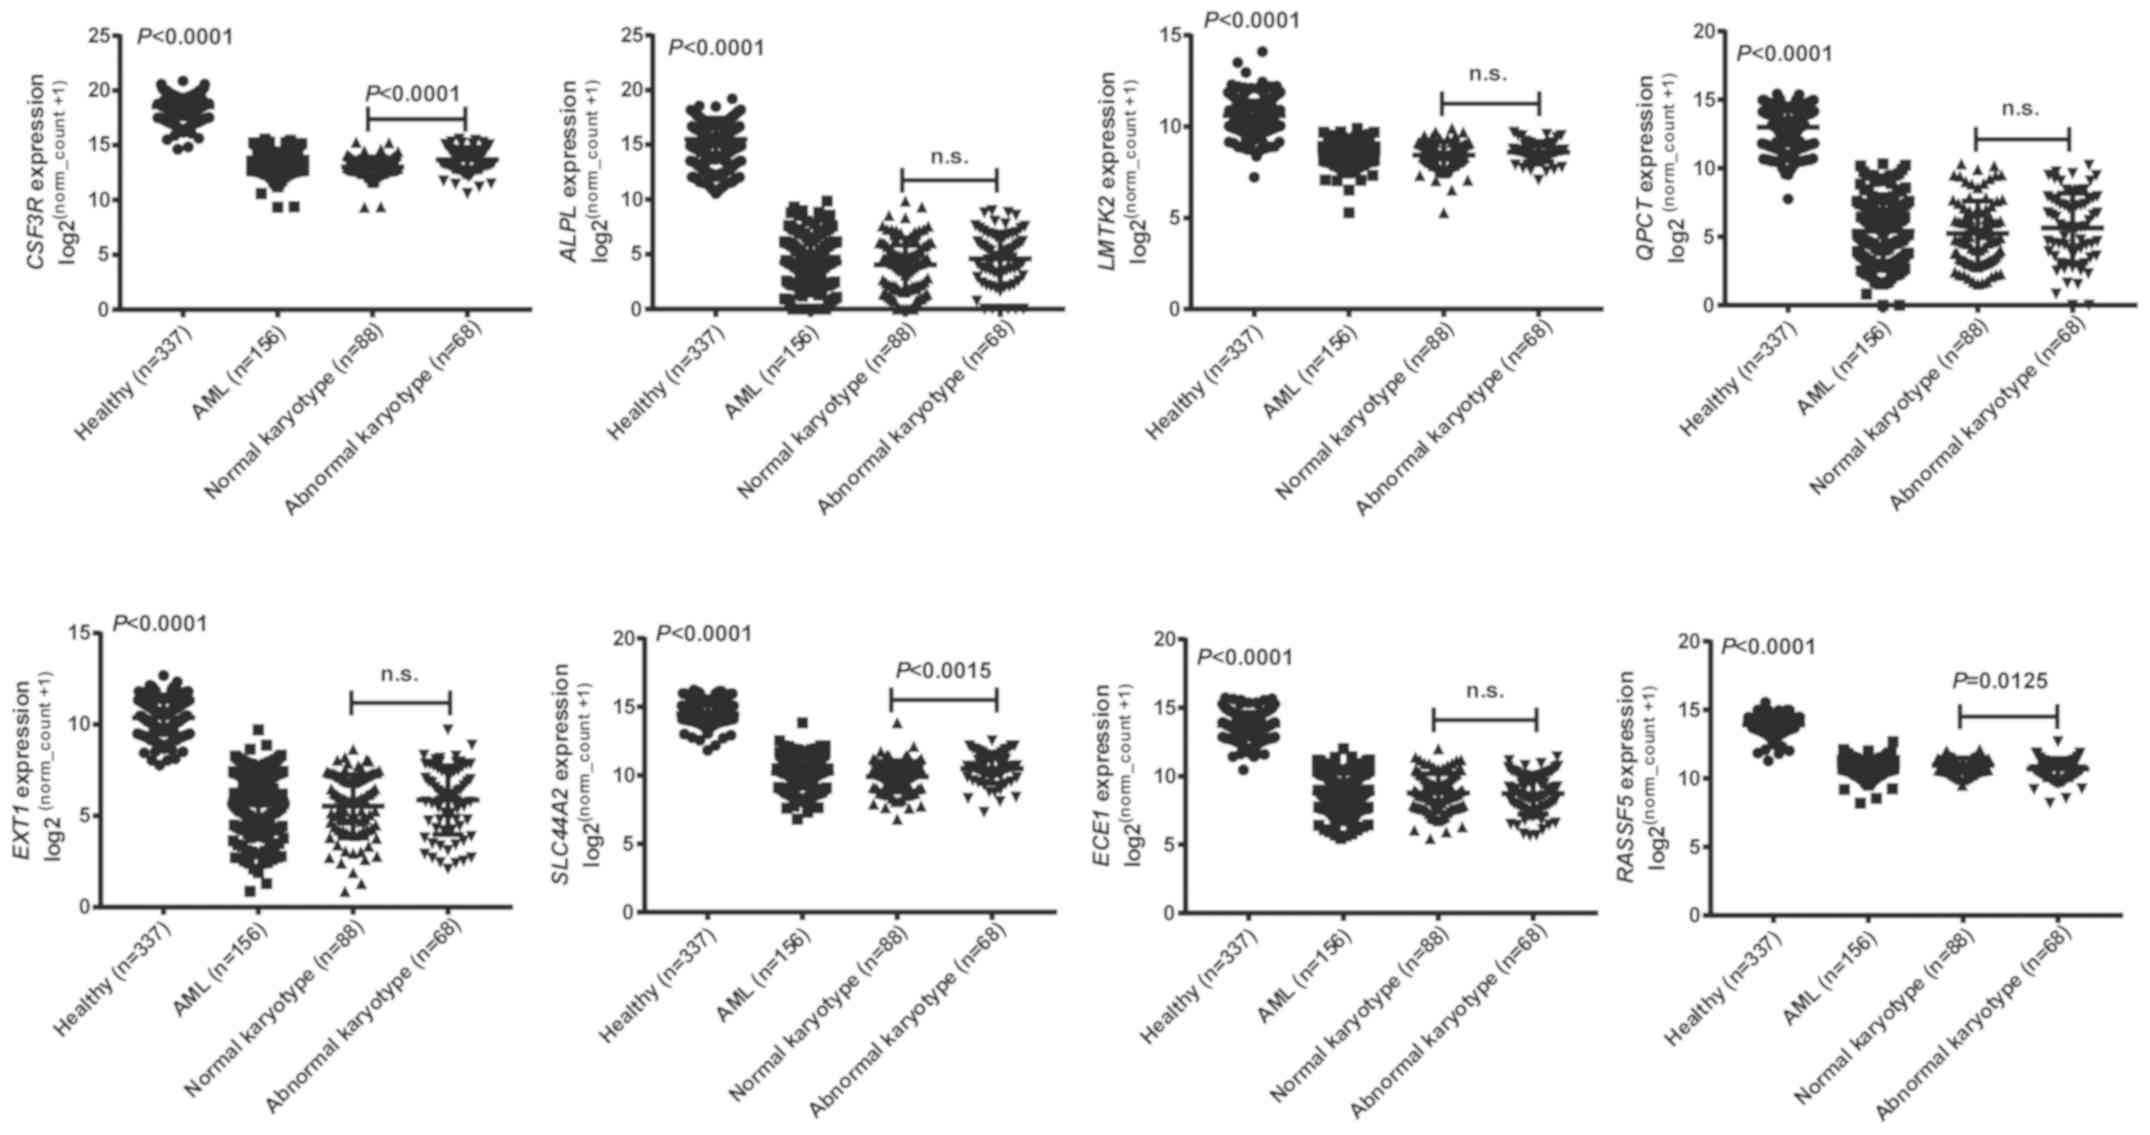
Validation of the differences in
expression levels of candidate genes between the AML and healthy
groups
Our RNA-seq data showed that the expression levels
of EXT1, SLC44A2, ALPL, CSF3R,
ECE1, LMTK2, QPCT, and RASSF5 were
significantly lower in AML patients than in healthy controls
(Fig. S2). More gene expression
data of normal donors (337) and AML patients (156) were downloaded
from the GTEx and TCGA databases to verify the differences in the
expression levels of the genes of interest initially observed
between the healthy and AML groups. This larger dataset also showed
that the expression levels of these eight genes were significantly
decreased in AML patients. In addition, CSF3R and
SLC44A2 had remarkably reduced expression in the normal
karyotypic group compared with the abnormal karyotypic group, while
RASSF5 tended to have lower expression in AML patients with
an abnormal karyotype (Fig. 7).
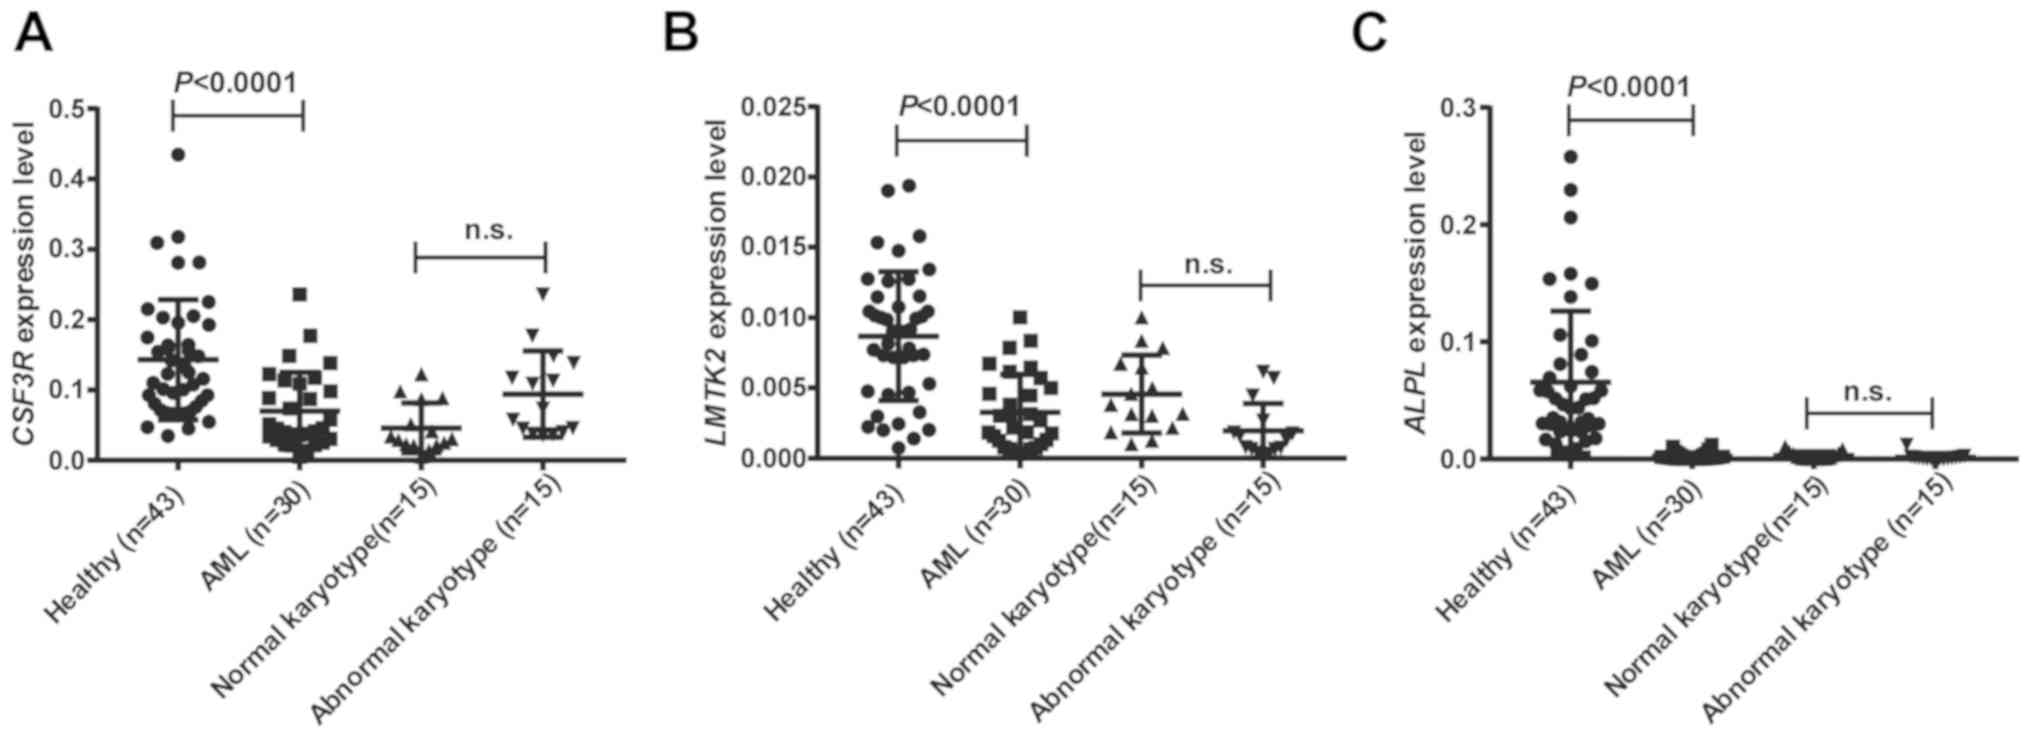
Further confirmation that the expression levels of
CSF3R, LMTK2 and ALPL were downregulated in
AML patients compared with healthy controls was established using
clinical samples (Fig. 8A-C). This
result is logically consistent with the positive correlation of the
three genes with OS and DFS in AML patients. Therefore, CSF3R,
LMTK2 and ALPL show great potential as new prognostic markers of
AML.
Discussion
WGCNA is an efficient bioinformatics method used to
reduce complicated transcriptomes into several gene modules with
high interconnectivity and to determine the associations of these
modules with clinical traits (16).
In this way, we identified that the constructed red module was
strongly negatively associated with AML, and the functional
annotations revealed that the genes in the red modules are enriched
in processes relating to neutrophils activation, neutrophil
degranulation and leukocyte migration. Through a series of
correlation analyses, we found that three genes with anomalous low
expression levels were significantly inversely correlated with the
percentage of blast cells but positively correlated with the
survival of AML patients.
The three genes CSF3R, ALPL, and
LMTK2 had extremely downregulated expression levels in AML
patients compared with healthy controls, and the downregulation of
these genes was associated with worse OS and DFS in AML patients.
Receptor for colony stimulating factor 3 (CSF3R) is well known to
regulate the production, differentiation, and function of
granulocytes (23). Mutations in
this gene are frequently present in patients with chronic
neutrophilic leukemia (CNL) and can be used as accurate diagnostic
markers for CNL (24). Mutations in
CSF3R are rare in AML and have been reported to highly
overlap with CEBPα mutations in AML patients, which predicts a poor
outcome (25,26). Our data show that CSF3R is
tended to underexpressed in AML patients with a normal karyotype
and may serve as a special genetic biomarker for the prognosis and
treatment of AML patients with a normal karyotype.
Tissue-nonspecific alkaline phosphatase (ALPL) plays a role in bone
biomineralization, and mutations in this gene are used to diagnose
hypophosphatasia (27). Further
studies are needed to reveal the functions of ALPL in AML. Lemur
tyrosine kinase 2 (LMTK2) is a tumor suppressor that is
downregulated in some neurodegenerative diseases (28) and can inhibit the activity of PP1C by
controlling GSK3β phosphorylation (29). The effect of LMTK2 on the
pathogenesis of AML has not been studied, but LMTK2 is predicted to
enhance the cytotoxic activity of natural killer cells to kill
leukemic blast cells via inhibition of GSK3β (30).
In the present study, we using RNA_seq combined with
WGCNA statistical method finding CSF3R, ALPL and LMTK2 are
potential prognostic markers for AML but need to be studied more
thoroughly to confirm their biological functions in this disease.
However, the limitation of RNA_seq is the result simply represents
the mean expression of genes in white blood cells which contain
diverse cell populations (31). The
newly developed single-cell RNA sequencing can compensate for the
defect and provide more huge and accurate data. The latest method
would help in finding exceptional subpopulations and genes of
interest in the future.
Supplementary Material
A total of 23 genes in the red module
were associated with the percentage of blast cells in BM. The
correlation coefficients were calculated by Pearson's method with
Bonferroni multiple testing correction and a two-tailed value of
P<0.05 indicated a statistically significant difference, n=173.
BM, bone marrow.
The candidate genes were downregulated
in the AML samples compared with the healthy samples, which was
confirmed by the RNA_seq data. The base mean is reported as the
mean of the normalized counts of all ten samples. Differences were
tested for significance according to unpaired t-tests, and
P<0.05 indicated a statistically significant difference. AML,
Acute myeloid leukemia.
The sequences of the forward and
reverse primers for reverse transcription-quantitative PCR.
Overview of the RNA_seq data.
The top 20 up and down differentially
expressed genes.
Information on the candidate genes in
the red module network.
Acknowledgements
Not applicable.
Funding
The present study work was supported by grants from
the National Natural Science Foundation of China (grant no.
81350027), the Major Projects of the Guangdong Natural Team (grant
no. 2014A030312012) and the Clinic Research Program of Shenzhen
Second People's Hospital (grant no. 20173357201802).
Availability of data and materials
The RNA_seq data from clinical samples were analyzed
in the current study and are available in the public repository in
the NCBI database (SRA accession: PRJNA576718). The data used to
confirm this research are available from TCGA (https://gdc-portal.nci.nih.gov/) and GTEx
(https://gtexportal.org/home/index.html).
Authors' contributions
JL, QZ and XD contributed to design and supervision
of the project. YP and QZ were responsible for writing the
manuscript. YP and XD analyzed the RNA data using WGCNA and NA
contributed to the collection of the clinical specimens. All
authors have read and approved the final version of this
manuscript.
Ethics approval and consent to
participate
This study protocol was approved by the
institutional medical Ethics Committee of Shenzhen Second People's
Hospital (Shenzhen, China). All patients and donors provided
informed consent for the molecular analysis of their samples.
Patient consent for publication
Not applicable.
Competing interests
The authors declare that they have no competing
interests.
References
|
1
|
Estey EH: Acute myeloid leukemia: 2013
update on risk-stratification and management. Am J Hematol.
88:318–327. 2013.PubMed/NCBI View Article : Google Scholar
|
|
2
|
Desai P, Hassane D and Roboz GJ: Clonal
hematopoiesis and risk of acute myeloid leukemia. Best Pract Res
Clin Haematol. 32:177–185. 2019.PubMed/NCBI View Article : Google Scholar
|
|
3
|
Chang KH, Hwang WL, Muo CH, Hsu CY and
Teng CJ: Outcome and late effects among acute myeloid leukemia
survivors: A nationwide population-based study. Support Care
Cancer. 24:4993–5000. 2016.PubMed/NCBI View Article : Google Scholar
|
|
4
|
Dohner H, Estey E, Grimwade D, Amadori S,
Appelbaum FR, Büchner T, Dombret H, Ebert BL, Fenaux P and Larson
RA: Diagnosis and management of AML in adults: 2017 ELN
recommendations from an international expert panel. Blood.
129:424–447. 2017.PubMed/NCBI View Article : Google Scholar
|
|
5
|
Mrozek K, Marcucci G, Nicolet D, Maharry
KS, Becker H, Whitman SP, Metzeler KH, Schwind S, Wu YZ and
Kohlschmidt J: Prognostic significance of the European LeukemiaNet
standardized system for reporting cytogenetic and molecular
alterations in adults with acute myeloid leukemia. J Clin Oncol.
30:4515–4523. 2012.PubMed/NCBI View Article : Google Scholar
|
|
6
|
Deschler B and Lübbert M: Acute myeloid
leukemia: Epidemiology and etiology. Cancer. 107:2099–2107.
2006.PubMed/NCBI View Article : Google Scholar
|
|
7
|
Junge A, Bacher U, Mueller BU, Keller P,
Solenthaler M and Pabst T: Adverse outcome of AML with aberrant
CD16 and CD56 NK cell marker expression. Hematol Oncol: Jun 3, 2018
(Epub ahead of print).
|
|
8
|
Zahran AM, Mohammed Saleh MF, Sayed MM,
Rayan A, Ali AM and Hetta HF: Up-regulation of regulatory T cells,
CD200 and TIM3 expression in cytogenetically normal acute myeloid
leukemia. Cancer Biomark. 22:587–595. 2018.PubMed/NCBI View
Article : Google Scholar
|
|
9
|
Cristobal I, Blanco FJ, Garcia-Orti L,
Marcotegui N, Vicente C, Rifon J, Novo FJ, Bandres E, Calasanz MJ,
Bernabeu C and Odero MD: SETBP1 overexpression is a novel
leukemogenic mechanism that predicts adverse outcome in elderly
patients with acute myeloid leukemia. Blood. 115:615–625.
2010.PubMed/NCBI View Article : Google Scholar
|
|
10
|
de Jonge HJ, Valk PJ, Veeger NJ, ter Elst
A, den Boer ML, Cloos J, de Haas V, van den Heuvel-Eibrink MM,
Kaspers GJ and Zwaan CM: High VEGFC expression is associated with
unique gene expression profiles and predicts adverse prognosis in
pediatric and adult acute myeloid leukemia. Blood. 116:1747–1754.
2010.PubMed/NCBI View Article : Google Scholar
|
|
11
|
Groschel S, Lugthart S, Schlenk RF, Valk
PJ, Eiwen K, Goudswaard C, van Putten WJ, Kayser S, Verdonck LF and
Lübbert M: High EVI1 expression predicts outcome in younger adult
patients with acute myeloid leukemia and is associated with
distinct cytogenetic abnormalities. J Clin Oncol. 28:2101–2107.
2010.PubMed/NCBI View Article : Google Scholar
|
|
12
|
Vasu S, Kohlschmidt J, Mrozek K, Eisfeld
AK, Nicolet D, Sterling LJ, Becker H, Metzeler KH, Papaioannou D
and Powell BL: Ten-year outcome of patients with acute myeloid
leukemia not treated with allogeneic transplantation in first
complete remission. Blood Adv. 2:1645–1650. 2018.PubMed/NCBI View Article : Google Scholar
|
|
13
|
Dohner H, Estey EH, Amadori S, Appelbaum
FR, Buchner T, Burnett AK, Dombret H, Fenaux P, Grimwade D and
Larson RA: Diagnosis and management of acute myeloid leukemia in
adults: Recommendations from an international expert panel, on
behalf of the European LeukemiaNet. Blood. 115:453–474.
2010.PubMed/NCBI View Article : Google Scholar
|
|
14
|
Assi SA, Bonifer C and Cockerill PN:
Rewiring of the transcription factor network in acute myeloid
leukemia. Cancer Inform. 18(1176935119859863)2019.PubMed/NCBI View Article : Google Scholar
|
|
15
|
Thoms JAI, Beck D and Pimanda JE:
Transcriptional networks in acute myeloid leukemia. Genes
Chromosomes Cancer. 58:859–874. 2019.PubMed/NCBI View Article : Google Scholar
|
|
16
|
Langfelder P and Horvath S: WGCNA: An R
package for weighted correlation network analysis. BMC
Bioinformatics. 9(559)2008.PubMed/NCBI View Article : Google Scholar
|
|
17
|
Zhou Z, Cheng Y, Jiang Y, Liu S, Zhang M,
Liu J and Zhao Q: Ten hub genes associated with progression and
prognosis of pancreatic carcinoma identified by co-expression
analysis. Int J Biol Sci. 14:124–136. 2018.PubMed/NCBI View Article : Google Scholar
|
|
18
|
Liu R, Zhang W, Liu ZQ and Zhou HH:
Associating transcriptional modules with colon cancer survival
through weighted gene Co-expression network analysis. BMC Genomics.
18(361)2017.PubMed/NCBI View Article : Google Scholar
|
|
19
|
Li S, Liu X, Liu T, Meng X, Yin X, Fang C,
Huang D, Cao Y, Weng H, Zeng X and Wang X: Identification of
biomarkers correlated with the TNM staging and overall survival of
patients with bladder cancer. Front Physiol. 8(947)2017.PubMed/NCBI View Article : Google Scholar
|
|
20
|
Kim D, Langmead B and Salzberg SL: HISAT:
A fast spliced aligner with low memory requirements. Nat Methods.
12:357–360. 2015.PubMed/NCBI View Article : Google Scholar
|
|
21
|
Pertea M, Pertea GM, Antonescu CM, Chang
TC, Mendell JT and Salzberg SL: StringTie enables improved
reconstruction of a transcriptome from RNA-seq reads. Nat
Biotechnol. 33:290–295. 2015.PubMed/NCBI View
Article : Google Scholar
|
|
22
|
Trapnell C, Roberts A, Goff L, Pertea G,
Kim D, Kelley DR, Pimentel H, Salzberg SL, Rinn JL and Pachter L:
Differential gene and transcript expression analysis of RNA-seq
experiments with TopHat and Cufflinks. Nat Protoc. 7:562–578.
2012.PubMed/NCBI View Article : Google Scholar
|
|
23
|
Touw IP and van de Geijn GJ: Granulocyte
colony-stimulating factor and its receptor in normal myeloid cell
development, leukemia and related blood cell disorders. Front
Biosci. 12:800–815. 2007.PubMed/NCBI View
Article : Google Scholar
|
|
24
|
Elliott MA and Tefferi A: Chronic
neutrophilic leukemia: 2018 update on diagnosis, molecular genetics
and management. Am J Hematol. 93:578–587. 2018.PubMed/NCBI View Article : Google Scholar
|
|
25
|
Maxson JE, Ries RE, Wang YC, Gerbing RB,
Kolb EA, Thompson SL, Guidry Auvil JM, Marra MA, Ma Y and Zong Z:
CSF3R mutations have a high degree of overlap with CEBPA mutations
in pediatric AML. Blood. 127:3094–3098. 2016.PubMed/NCBI View Article : Google Scholar
|
|
26
|
Su L, Gao S, Tan Y, Lin H, Liu X, Liu S,
Yang Y, Sun J and Li W: CSF3R mutations were associated with an
unfavorable prognosis in patients with acute myeloid leukemia with
CEBPA double mutations. Ann Hematol. 98:1641–1646. 2019.PubMed/NCBI View Article : Google Scholar
|
|
27
|
Tenorio J, Alvarez I, Riancho-Zarrabeitia
L, Martos-Moreno GA, Mandrile G, de la Flor Crespo M, Sukchev M,
Sherif M, Kramer I and Darnaude-Ortiz MT: Molecular and clinical
analysis of ALPL in a cohort of patients with suspicion of
Hypophosphatasia. Am J Med Genet A. 173:601–610. 2017.PubMed/NCBI View Article : Google Scholar
|
|
28
|
Bencze J, Morotz GM, Seo W, Bencs V,
Kalman J, Miller CCJ and Hortobágyi T: Biological function of Lemur
tyrosine kinase 2 (LMTK2): Implications in neurodegeneration. Mol
Brain. 11(20)2018.PubMed/NCBI View Article : Google Scholar
|
|
29
|
Conti A, Majorini MT, Fontanella E,
Bardelli A, Giacca M, Delia D, Mano M and Lecis D: Lemur tyrosine
kinase 2 (LMTK2) is a determinant of cell sensitivity to apoptosis
by regulating the levels of the BCL2 family members. Cancer Lett.
389:59–69. 2017.PubMed/NCBI View Article : Google Scholar
|
|
30
|
Parameswaran R, Ramakrishnan P, Moreton
SA, Xia Z, Hou Y, Lee DA, Gupta K, deLima M, Beck RC and Wald DN:
Repression of GSK3 restores NK cell cytotoxicity in AML patients.
Nat Commu. 7(11154)2016.PubMed/NCBI View Article : Google Scholar
|
|
31
|
van Galen P, Hovestadt V, Wadsworth Ii MH,
Hughes TK, Griffin GK, Battaglia S, Verga JA, Stephansky J, Pastika
TJ and Lombardi Story J: Single-cell RNA-seq reveals AML
hierarchies relevant to disease progression and immunity. Cell.
176:1265–81.e24. 2019.PubMed/NCBI View Article : Google Scholar
|