Introduction
Hepatic hemangioma is the most common benign tumor
of the liver, with a prevalence of 0.4-7.3%, and an incidence of
1.7% on abdominal ultrasonographic examination (1,2).
Hepatic hemangiomas are composed of multiple and large vessels
lined by a single layer of endothelial cells within a thin fibrous
stroma (2,3). Advances in abdominal imaging
technology and their widespread application have improved the
detection of benign liver tumors and most hepatic hemangiomas can
be accurately diagnosed by imaging techniques. Ultrasonography (US)
is the most commonly performed screening method because it is
non-invasive, inexpensive, and commonly available, and has high
specificity and sensitivity (3). On
abdominal US, hemangiomas are generally visualized as homogeneous,
hyperechoic, and well-defined lesions, although several studies
have reported variations of these appearances in large lesions, and
that the internal echoes become inhomogeneous as the mass increases
in size (2,4-7).
However, little is known regarding the causes for the relationship
between hemangioma size and echogenicity. While, it is well known
that a giant hemangioma leads to coagulation abnormality,
Kasabach-Merritt syndrome (KMS). However, the relationship between
coagulation abnormality and hemangioma size or echogenicity is not
clear. In most cases, hepatic hemangiomas are small and cause no
symptoms. Therefore, most hepatic hemangiomas are diagnosed
incidentally and have little clinical significance. Large
hemangiomas occasionally can cause signs and symptoms sufficiently
severe to require treatment. However, the management of patients
with asymptomatic hemangiomas remains under debate. The reason is
that previous studies have not shown the sufficient data that are
available on the natural history of hepatic hemangiomas and their
tendency to cause hemangioma-related complications. The aim of this
study is to investigate the correlation between tumor size and the
internal echo pattern revealed by US and the clinical factors,
especially coagulation factors, to elucidate the natural history
and growth pattern of hemangiomas.
Patients and methods
Patients
This study was approved by the ethics review board
of Tottori university hospital (approval numbers: 18A023) and the
ethical committee of Hino hospital (approval numbers: 2018-4). Of
16,403 abdominal US examinations performed at our hospitals between
January 2016 and December 2018, 214 patients were diagnosed with
hepatic hemangioma and were consecutively enrolled in this study
after giving informed consent. Those with infectious diseases,
liver cirrhosis, or malignant tumors were excluded from the study.
Patients with abnormal values of thrombin-antithrombin III complex
(TAT) (>3.0 ng/ml), D-dimer (>1.0 µg/ml), and fibrin and
fibrinogen degradation products (FDP) (>5.0 µg/ml) were referred
for cardiovascular medicine consultation to prevent complications
of thrombosis such as deep vein thrombosis or lung thrombosis.
Methods
Hepatic hemangiomas were diagnosed by US and
multiphase contrast-enhanced helical computed tomography (CT).
Their appearance on US is of homogeneous, hyperechoic, well-defined
lesions, although larger hemangiomas showed mixed echogenicity. On
CT, they were characterized as well-defined, homogeneous, hypodense
lesions with peripheral nodular enhancement followed by progressive
centripetal enhancement (1,7). In the most hemangiomas (diameter ≤20
mm), the final diagnosis was established based on the US features,
clinical observation, and negative biochemical results. Relatively
large lesions (diameter >20 mm) were diagnosed using both US and
CT. Abdominal US was performed in all patients, and CT was
performed in 67 patients. The US findings were reviewed and the
following were recorded: Total number of hepatic hemangiomas, size,
echogenicity, location, diameter of the portal vein, and the
splenic index. In the case of multiple hemangiomas, the tumor with
the largest diameter was selected for analysis. All patients were
examined by US examiners who had 30 years of experience.
Hepatic hemangiomas can be divided into two major
groups: Capillary hemangiomas and cavernous hemangiomas (2). In the present study, however,
hemangiomas were not classified into the two tumor types due to
difficulties in distinguishing them by US and CT. According to a
previous study, most hemangiomas (~80%) are cavernous type
(8). Using the method described in
a previous study of giant cavernous hemangiomas (9), we divided the hepatic hemangiomas into
three groups according to maximum diameter: Small group (<20
mm), medium group (20-40 mm), and large group (>40 mm). The
internal echo pattern was classified into two groups: Homogeneous
group (homogeneous hyperechoic, homogeneous hypoechoic, and
isoechoic) and mixed group (mixed hyperechoic and mixed hypoechoic)
(1).
Routine laboratory tests were performed using
automated methods. Blood platelet counts in the range
14-38x104/mm3 were considered normal.
Prothrombin time (PT) was determined by the coagulation method
using one-stage prothrombin-time assay (Japan Clinical Laboratory,
Kyoto, Japan), with values in the range 70-130% considered normal.
Fibrinogen was determined by rapid physiological coagulation
technique using the clotting method (Japan Clinical Laboratory,
Kyoto, Japan), with values in the range 180-400 mg/dl considered
normal. Plasma TAT concentration was determined by a
chemiluminescent enzyme immunoassay (Special Reference Laboratory,
Tokyo, Japan). The normal TAT level is <3.0 ng/ml and the lower
detection limit is 1.0 ng/ml. In 55 of 214 patients, the TAT level
was <1.0 ng/ml. The concentrations of D-dimer and FDP were
determined by a latex immunoturbidimetric assay (Japan Clinical
Laboratory, Kyoto, Japan). The normal D-dimer and FDP levels are
<1.0 and <5.0 µg/ml, respectively, with lower limits of
sensitivity of 0.5 µg/ml for D-dimer and 2.6 µg/ml for FDP. In 77
and 187 of 214 patients, the D-dimer and FDP levels were <0.5
and <2.6 µg/ml, respectively. The values of TAT, D-dimer and FDP
in 55, 77 and 187 of 214 patients were undetectable, therefore we
categorized measured values as normal (TAT <3.0 ng/ml, D-dimer
<1.0 µg/ml, FDP<5.0 µg/ml) and abnormal value (TAT≥3.0 ng/ml,
D-dimer ≥1.0 µg/ml, FDP≥5.0 µg/ml) and analyzed the difference
among groups.
Follow-up study was performed with repeated US and
blood examinations in patients with follow-up period over at least
one year. The largest diameter of each tumor was recorded on the
printed US images. Of the 214 patients with hepatic hemangiomas, 93
patients received at least two US and coagulation examinations in
the follow-up period. The average follow-up period after the
initial examination was 21.1 months (range, 12-29 months).
Statistical analysis
All measurements are expressed as the mean ± SD.
Differences among the three size groups were analyzed using one-way
analysis of variance and Tukey's post hoc test, and the differences
between the two echo pattern groups were analyzed using an unpaired
t-test. Categorical variables were analyzed using the Chi-square
test. Correlation analysis was carried out by univariate linear
regression analysis. The multivariate forward stepwise regression
analysis was used to identify independent factors related to the
tumor size of hepatic hemangiomas. The data were analyzed using
Stat Flex version 6.0 (Artech Co., Ltd.). A P-value <0.05 was
considered statistically significant.
Results
Patient characteristics
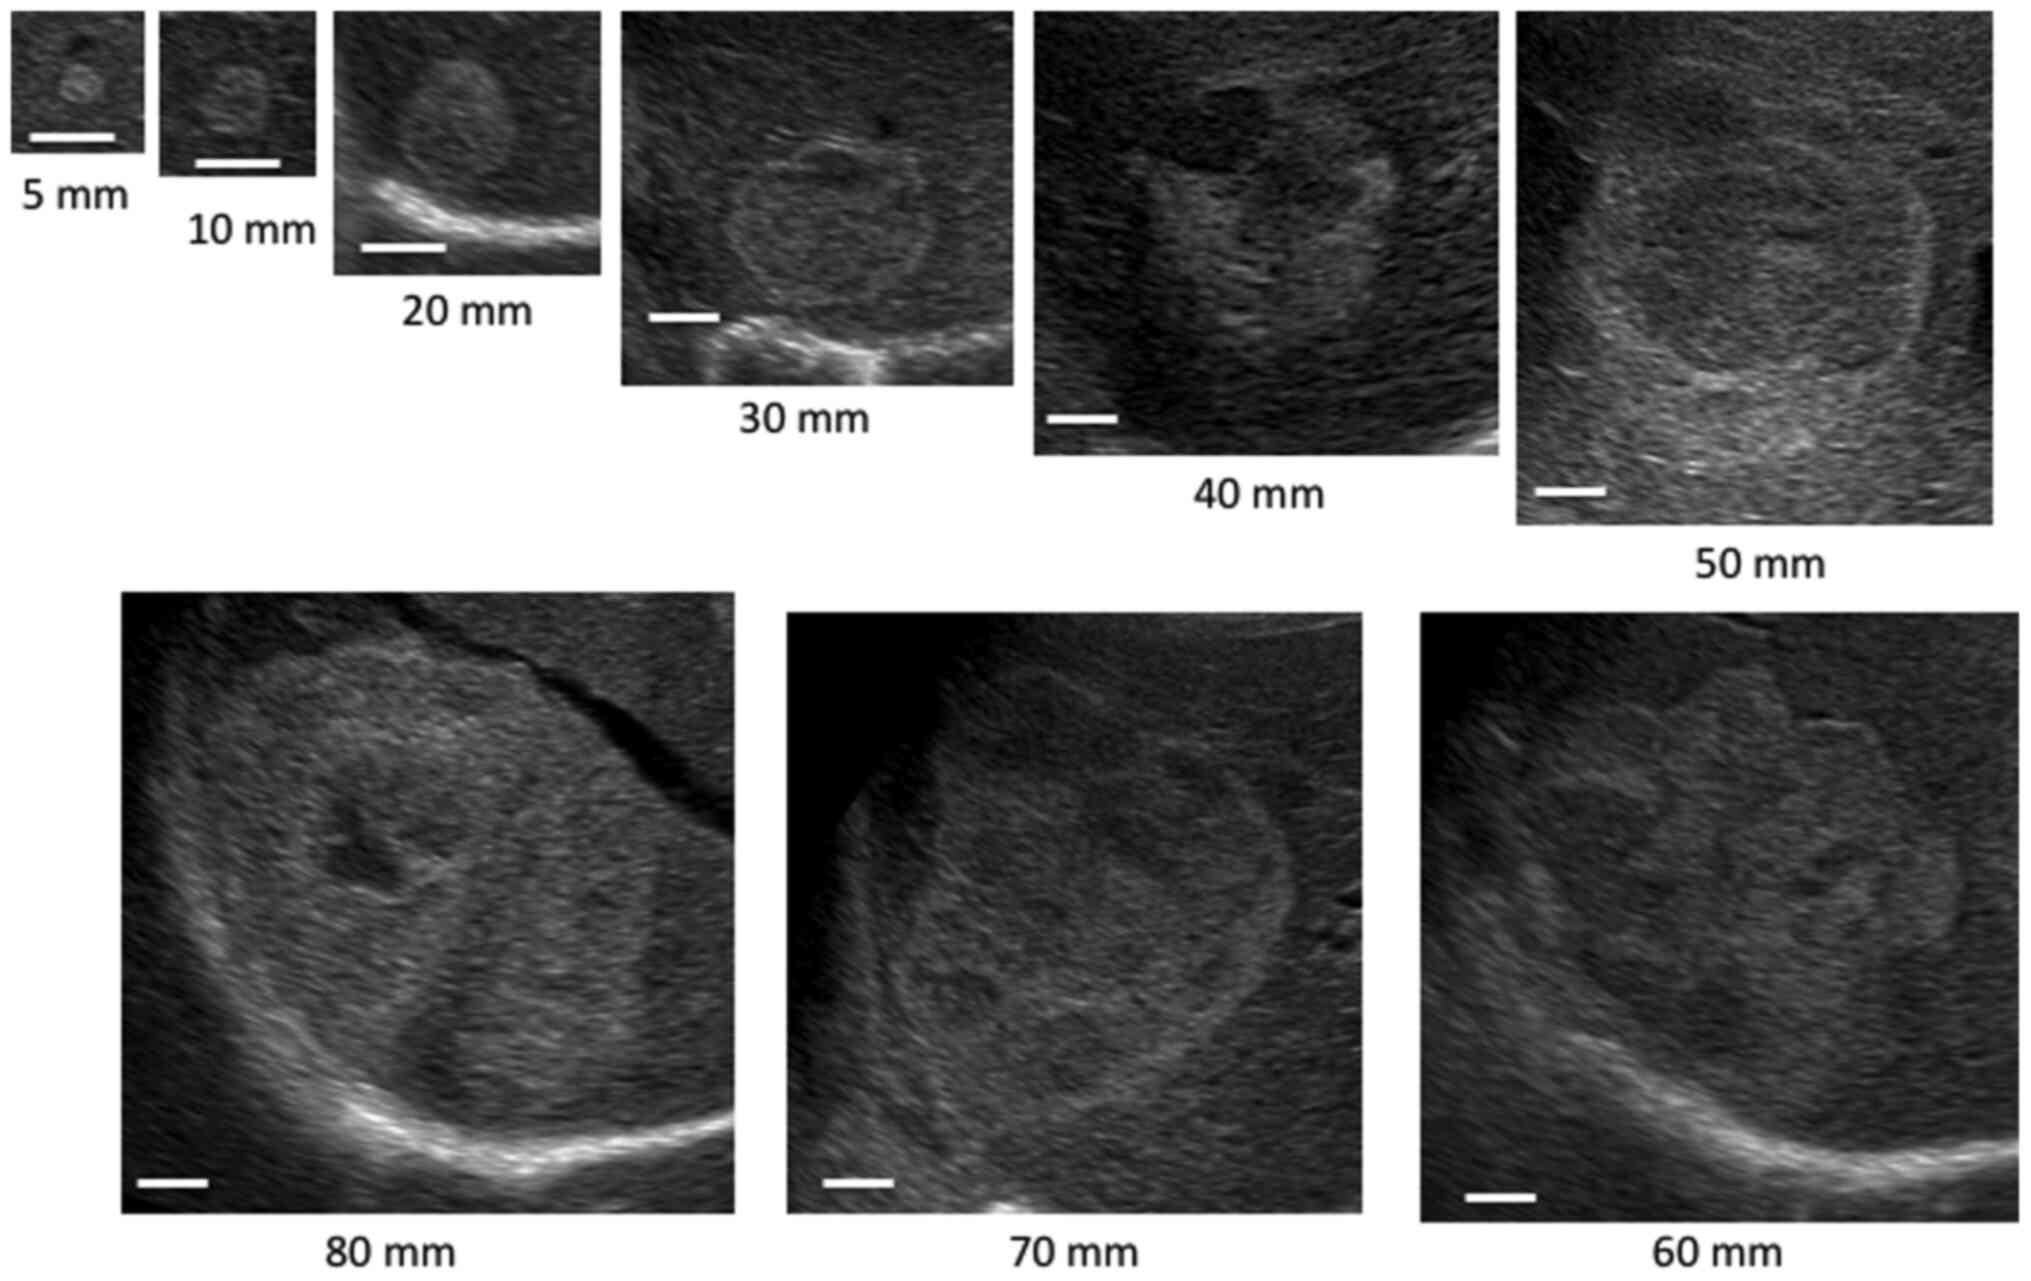
Fig. 1 shows the
internal echo patterns of hemangiomas according to mean tumor
diameter. Most of small group were homogeneous. As the size
increased, the internal echo pattern became the mixed echo
type.
Among the 216 patients with hepatic hemangiomas, 2
patients were excluded because of high values of protein induced by
vitamin K absence-II (PIVKA-II), which prevented differentiation
from malignant tumors. A total of 214 patients were enrolled in the
present study. The laboratory findings of these patients are listed
in Table I. There were 74 men and
140 women (male:female ratio, 1:1.9), with a median age of 55 years
(range, 23-89 years). All patients, except one patient with
abdominal distension, were asymptomatic, and their hemangiomas had
been discovered at a routine health examination or as an incidental
finding on radiological studies. At the time of diagnosis, serum
laboratory tests were normal in 190 of 214 (88.8%) patients.
Twenty-four patients had slight elevation in transaminases,
glutamyl transpeptidase, or alkaline phosphatase. Thirty-two
patients (15.0%) had underlying chronic liver disease. No patient
had received surgical treatment.
 | Table ILaboratory findings of 214 patients
with hepatic hemangioma. |
Table I
Laboratory findings of 214 patients
with hepatic hemangioma.
| Parameters | Value |
|---|
| Age, years | 55±15 |
| Sex, n
(male/female) | 74/140 |
| Biochemistry | |
|
Total
bilirubin, mg/dl | 0.6±0.3 |
|
Albumin
(g/dl) | 4.3±0.3 |
|
ALT,
U/l | 20±14 |
|
GGT,
U/l | 38±44 |
|
ALP,
U/l | 232±78 |
|
BUN,
mg/dl | 14.5±3.9 |
|
Cr,
mg/dl | 0.69±0.19 |
|
LDL-chol,
mg/dl | 99±24 |
|
Glucose,
mg/dl | 101±29 |
| Hematology and
coagulation | |
|
Hemoglobin,
g/dl | 13.5±1.3 |
|
WBC,
/µl | 5,500±1,600 |
|
Platelet,
x104/mm3 | 22.3±5.4 |
|
PT, % | 94.3±13.1 |
|
Fibrinogen,
mg/dl | 275±71 |
|
TATa,
ng/ml | 1.69±0.89 |
|
D-dimerb,
µg/ml | 1.03±0.72 |
|
FDPc,
µg/ml | 4.06±1.24 |
| Serology | |
|
M2BPGi,
COI | 0.57±0.41 |
|
AFP,
ng/ml | 3.5±1.6 |
|
PIVKA-II,
mAU/ml | 19.1±6.6 |
| Associated liver
diseases, n (%) | |
|
Hepatitis
B | 6 (2.8) |
|
Hepatitis
C | 5 (2.3) |
|
Autoimmune
hepatitis | 8 (3.7) |
|
Primary
biliary cholangitis | 2 (0.9) |
|
Alcoholic
liver disease | 6 (2.8) |
|
Nonalcoholic
steatohepatitis | 5 (2.3) |
| Concomitant
diseases, n (%) | |
|
Hypertension | 37 (17.3) |
|
Hyperlipidemia | 21 (9.8) |
|
Diabetes | 10 (4.7) |
The US findings are listed in Table II. The sonographic appearance of
the hemangiomas was hyperechoic in 159 (74.3%), hypoechoic in 2
(0.9%), and isoechoic in 1 (0.5%) patient. The lesions presented a
mixed echo pattern in 52 (24.3%), with hyperechoic areas
alternating with hypoechoic or anechoic areas. 145 (67.8%) patients
were in small group, 48 (22.4%) in medium group, and 21 (9.8%) in
large group. The lesions were located in the right liver lobe in
180 (84.1%), in the left liver lobe in 32 (15.0%), and bilaterally
in 2 (0.9%) patients. A single hemangioma was detected in 173
(80.8%) patients. The remaining 41 (19.2%) patients had multiple
tumors. Median portal diameter and splenic index were 10.8 mm and
1,295 mm2, respectively.
| Table IIUltrasonographic findings of 214
patients with hepatic hemangioma. |
Table II
Ultrasonographic findings of 214
patients with hepatic hemangioma.
|
Characteristics | Value |
|---|
| Echo pattern, n
(%) | |
|
Hyperechoic | 159 (74.3) |
|
Hypoechoic | 2 (0.9) |
|
Isoechoic | 1 (0.5) |
|
Mixed | 52 (24.3) |
| Size of hemangioma,
n (%) | |
|
Small
(<20 mm) | 145 (67.8) |
|
Medium
(20-40 mm) | 48 (22.4) |
|
Large
(>40 mm) | 21 (9.8) |
| Location of
hemangioma, n (%) | |
|
Right
lobe | 180 (84.1) |
|
Left
lobe | 32 (15.0) |
|
Bilateral | 2 (0.9) |
| Number of
hemangioma, n (%) | |
|
Single | 173 (80.8) |
|
Multiple | 41 (19.2) |
| Portal vein
diameter, mm | 10.8±2.0 |
| Spleen index,
mm2 | 1,295±558 |
Association among hemangioma size,
echo patterns and clinical parameters including coagulation
factors
Table III shows
the relationship of tumor size to the clinical parameters. There
was no significant difference in terms of mean age or the
male:female ratio among the three groups. Albumin concentration was
significantly lower in the large group than in the other groups
(P<0.01), but no biochemistry values except albumin and BUN
showed significant differences among the three groups. Hemoglobin
concentration was significantly lower in the large group than in
the medium group (P<0.05). Values of Mac-2 binding protein
glycosylation isomer (M2BPGi) were significantly higher in the
large group than in the small group (P<0.05) and PIVKA-II levels
were significantly higher in the medium and large group (both
P<0.01) than in the small group. Almost all tumors (99.3%) in
the small group were homogenous. In the medium group, a homogeneous
pattern was seen in 37.5% (18/48) of hemangiomas and a mixed echo
pattern in 62.5% (30/48). All hemangiomas in the large group had
mixed echo patterns. Portal vein diameter was significantly higher
in the medium and large group (both P<0.01) than in the small
group. Table IV shows the
relationship of the echo pattern to the clinical parameters. The
mean age and the male:female ratio were similar in the homogeneous
and mixed groups. Albumin concentration was significantly lower
(P<0.001) and the values of BUN, Cr, glucose, and PIVKA-II were
significantly higher in the mixed group than in the homogeneous
group. Tumor size in the mixed group was significantly larger than
in the homogeneous group (P<0.0001). Portal vein diameter and
splenic index were significantly elevated in the mixed group
(P<0.001 and P<0.05, respectively).
| Table IIIAssociation between tumor size and
clinical parameters in 214 patients with hepatic hemangioma. |
Table III
Association between tumor size and
clinical parameters in 214 patients with hepatic hemangioma.
| Parameters | Small (n=145) | Medium (n=48) | Large (n=21) | P-value |
|---|
| Age, years | 53±15 | 57±14 | 59±14 | 0.130 |
| Male/female, n | 47/98 | 19/29 | 8/13 | 0.622 |
| Biochemistry | | | | |
|
Total
bilirubin, mg/dl | 0.6±0.3 | 0.6±0.3 | 0.5±0.2 | 0.693 |
|
Albumin,
g/dl | 4.4±0.2 | 4.4±0.3 |
4.1±0.3a,b | 0.001 |
|
ALT,
U/l | 21±15 | 20±11 | 18±9 | 0.645 |
|
GGT,
U/l | 39±46 | 41±40 | 30±32 | 0.637 |
|
ALP,
U/l | 231±79 | 232±76 | 231±84 | 0.997 |
|
BUN,
mg/dl | 14.2±3.7 | 14.6±4.3 |
16.6±3.9c | 0.038 |
|
Cr,
mg/dl | 0.68±0.16 | 0.71±0.24 | 0.75±0.17 | 0.248 |
|
LDL-chol,
mg/dl | 98±24 | 102±26 | 99±20 | 0.286 |
|
Glucose,
mg/dl | 98±27 | 104±34 | 109±33 | 0.147 |
| Hematology | | | | |
|
Hemoglobin,
g/dl | 13.5±1.3 | 13.7±1.2 |
12.8±1.7b,c | 0.029 |
|
WBC,
/µl | 5,600±1,600 | 5,500±1,500 | 5,400±1,600 | 0.786 |
| Serology | | | | |
|
M2BPGi,
COI | 0.55±0.42 | 0.64±0.50 |
0.77±0.40c,d | 0.017 |
|
AFP,
ng/ml | 3.4±1.5 | 3.8±1.6 | 3.3±2.0 | 0.082 |
|
PIVKA-II,
mAU/ml | 17.9±6.5 | 21.0±6.4 |
22.8±6.1a,b | <0.001 |
| Echo pattern, n
(%) | | | | <0.001 |
|
Homogeneous
type | 144 (99.3) | 18 (37.5) | 0 (0.0) | |
|
Mixed
type | 1 (0.7) | 30 (62.5) | 21 (100.0) | |
| Portal vein
diameter, mm | 10.4±1.9 |
11.3±1.6c |
12.3±2.0a | <0.001 |
| Spleen index,
mm2 | 1,227±515 | 1,368±527 |
1,604±749c | 0.042 |
| Table IVAssociation between echo pattern and
clinical parameters in 214 patients with hepatic hemangioma. |
Table IV
Association between echo pattern and
clinical parameters in 214 patients with hepatic hemangioma.
| Parameters | Homogenous type
(n=162) | Mixed type
(n=52) | P-value |
|---|
| Age, years | 54±15 | 57±14 | 0.153 |
| Male/female, n | 54/108 | 20/32 | 0.611 |
| Biochemistry | | | |
|
Total
bilirubin, mg/dl | 0.6±0.3 | 0.5±0.2 | 0.628 |
|
Albumin,
g/dl | 4.4±0.2 | 4.2±0.3 | <0.001 |
|
ALT,
U/l | 20±14 | 19±12 | 0.973 |
|
GGT,
U/l | 38±45 | 39±40 | 0.903 |
|
ALP,
U/l | 234±82 | 222±69 | 0.364 |
|
BUN,
mg/dl | 14.1±3.7 | 15.7±4.4 | 0.026 |
|
Cr,
mg/dl | 0.68±0.16 | 0.75±0.24 | 0.046 |
|
LDL-chol,
mg/dl | 100±24 | 97±24 | 0.539 |
|
Glucose,
mg/dl | 97±26 | 111±36 | 0.014 |
| Hematology | | | |
|
Hemoglobin,
g/dl | 13.6±1.3 | 13.2±1.4 | 0.118 |
|
WBC,
/µl | 5,600±1,500 | 5,500±1,700 | 0.647 |
| Serology | | | |
|
M2BPGi,
COI | 0.55±0.40 | 0.73±0.53 | 0.074 |
|
AFP,
ng/ml | 3.4±1.4 | 3.8±1.9 | 0.278 |
|
PIVKA-II,
mAU/ml | 18.1±6.6 | 22.1±5.7 | <0.001 |
| Tumor size, mm | 12.4±5.2 | 40.3±18.8 | <0.001 |
| Portal vein
diameter, mm | 10.5±1.9 | 11.7±2.0 | <0.001 |
| Spleen index,
mm2 | 1,240±529 | 1,458±602 | 0.018 |
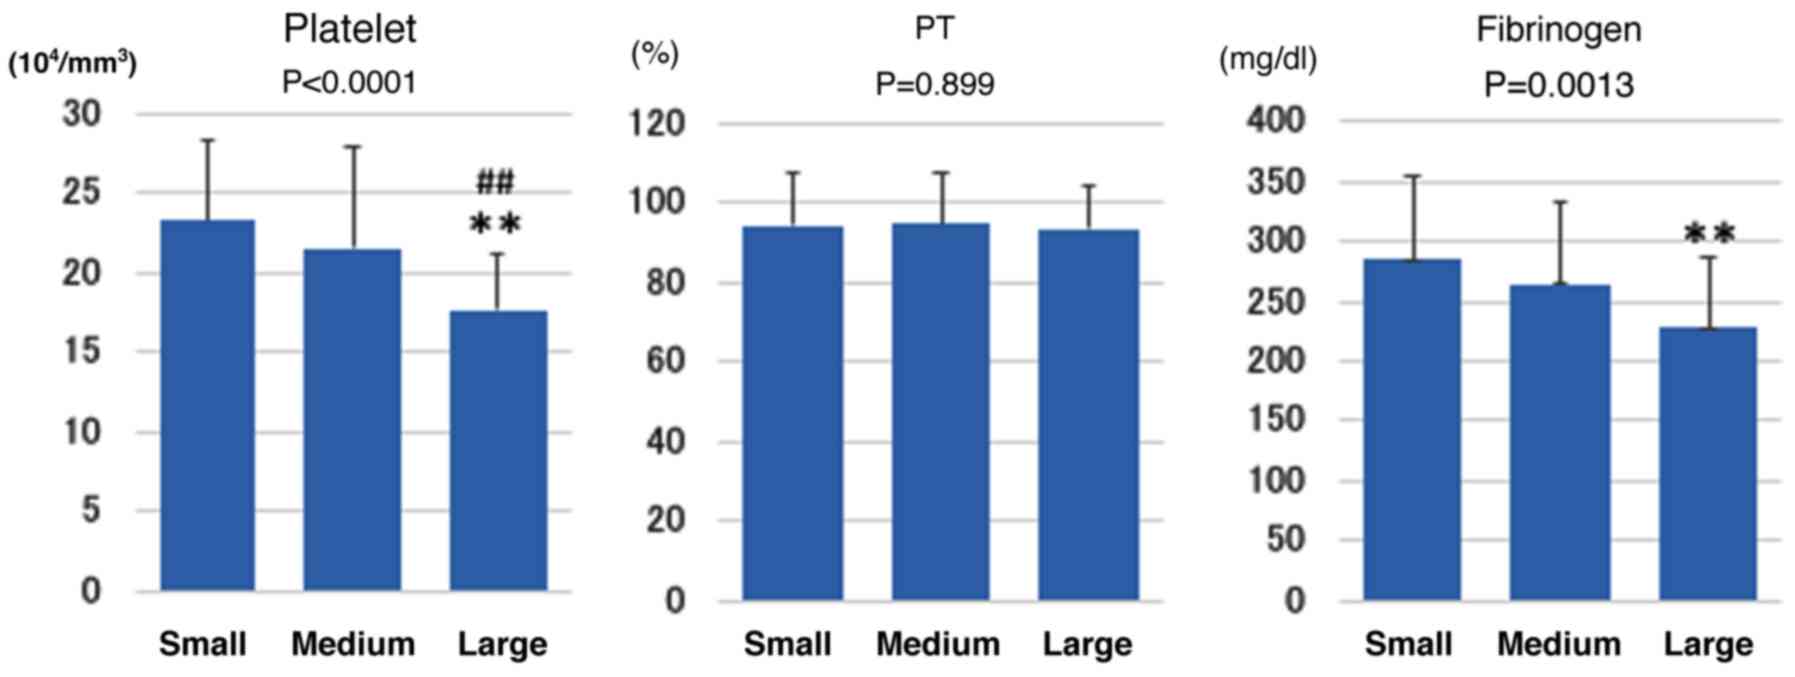
Fig. 2 shows the
relationship of tumor size to the coagulation markers (platelet, PT
and fibrinogen). Platelet count was significantly lower in the
large group than in the small and medium groups (P<0.01) and
fibrinogen level was significantly lower in the large group than in
the small group (P<0.01). PT was similar among all groups.
Table V shows the relationship of
tumor size to the coagulation markers (TAT, D-dimer and FDP). The
number of patients with the abnormal value of TAT, D-dimer, and FDP
significantly increased along with the tumor size (all
P<0.0001).
| Table VAssociation between tumor size and
coagulation markers in 214 patients with hepatic hemangioma. |
Table V
Association between tumor size and
coagulation markers in 214 patients with hepatic hemangioma.
| Coagulation
markers | Small (n=145) | Medium (n=48) | Large (n=21) | P-value |
|---|
| TAT | | | | |
|
Normal
value | 145 | 46 | 12 | <0.001 |
|
Abnormal
value | 0 | 2 | 9 | |
| D-dimer | | | | |
|
Normal
value | 132 | 36 | 0 | <0.001 |
|
Abnormal
value | 13 | 12 | 21 | |
| FDP | | | | |
|
Normal
value | 145 | 48 | 11 | <0.001 |
|
Abnormal
value | 0 | 0 | 10 | |
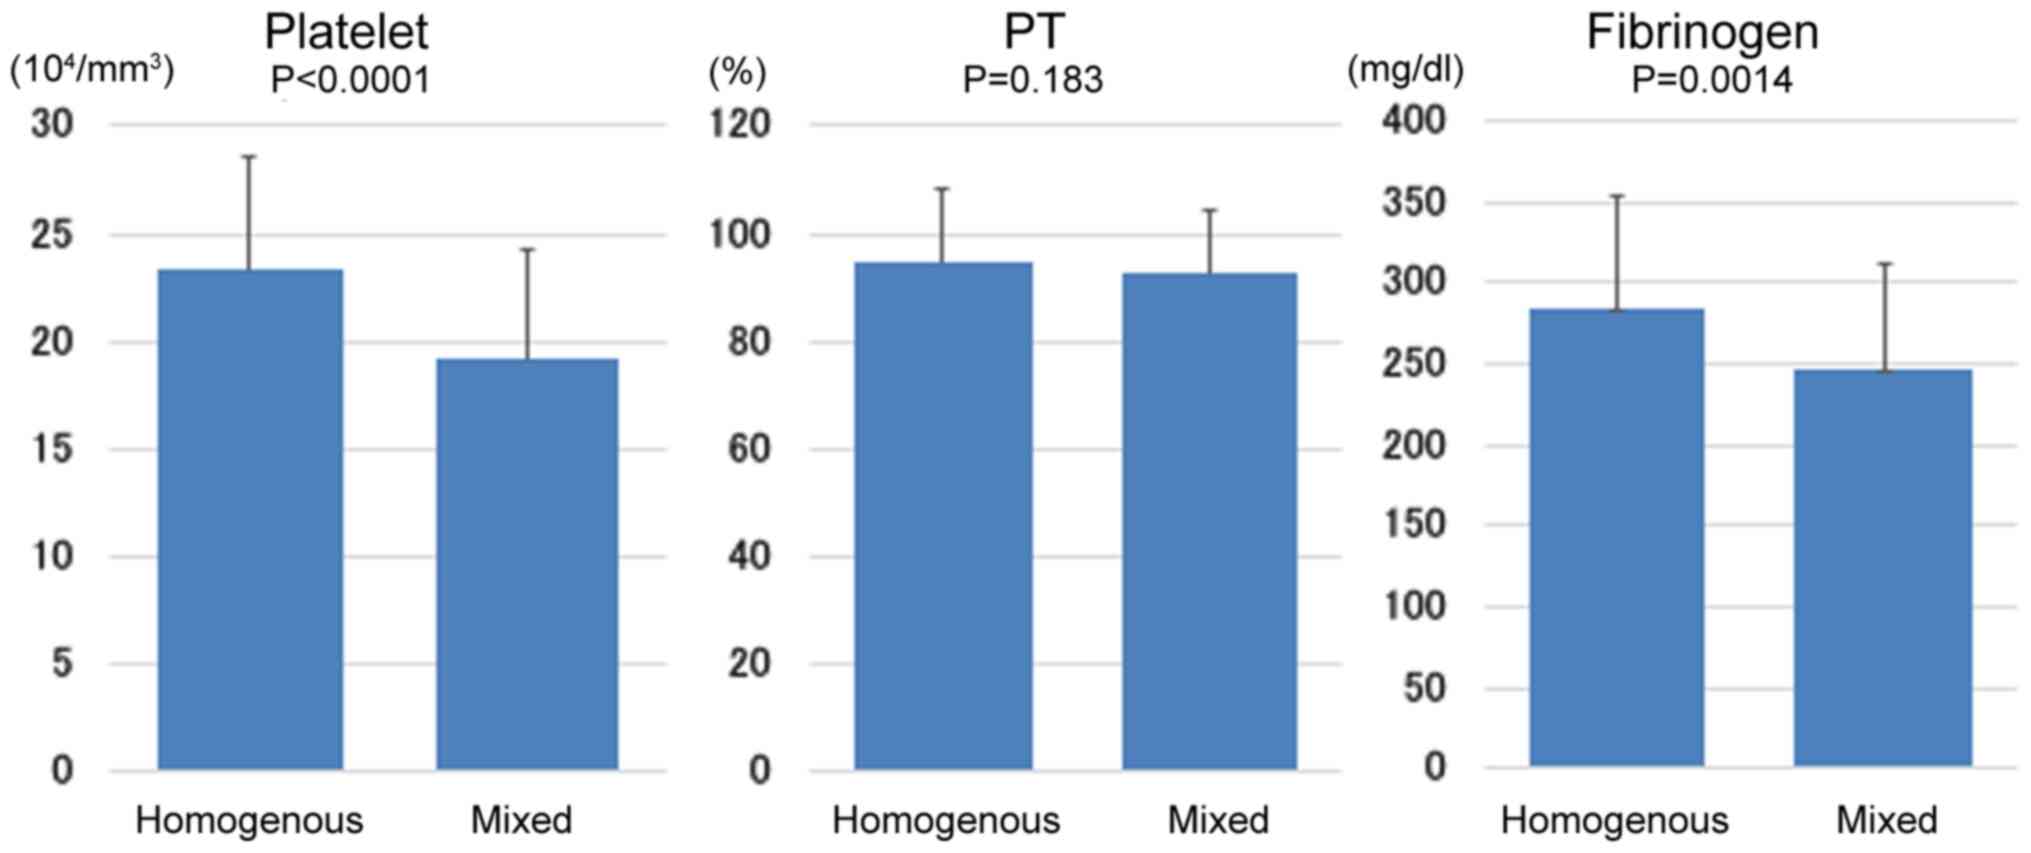
Fig. 3 shows the
relationship of echo pattern to the coagulation markers (platelet,
PT and fibrinogen). Platelet count (P<0.0001) and fibrinogen
level (P<0.01) were significantly lower in the mixed group than
in the homogeneous group. PT was similar in these two groups.
Table VI shows the relationship of
echo pattern to the coagulation markers (TAT, D-dimer and FDP). The
number of patients with the abnormal values of TAT, D-dimer, and
FDP was significantly higher in the mixed group than in the
homogeneous group (all P<0.0001).
| Table VIAssociation between echo pattern and
coagulation markers in 214 patients with hepatic hemangioma. |
Table VI
Association between echo pattern and
coagulation markers in 214 patients with hepatic hemangioma.
| Coagulation
markers | Homogenous
(n=162) | Mixed (n=52) | P-value |
|---|
| TAT | | | |
|
Normal
value | 162 | 40 | <0.001 |
|
Abnormal
value | 0 | 12 | |
| D-dimer | | | |
|
Normal
value | 148 | 19 | <0.001 |
|
Abnormal
value | 14 | 33 | |
| FDP | | | |
|
Normal
value | 162 | 42 | <0.001 |
|
Abnormal
value | 0 | 10 | |
Ninety-three patients were followed up for at least
12 months. The average follow-up period after the initial
examination was 21.1 months (range, 12-29 months). There was no
significant difference between the first and last data in the
follow-up period in terms of hemangioma size, platelet count,
fibrinogen level; and all of the TAT, D-dimer, and FDP values (data
not shown).
Univariate and multivariate analyses were performed
to assess for predictors of tumor size (Table VII). Albumin, Cr, platelet count,
fibrinogen level, PIVKA-II, portal vein diameter, and spleen index
were significantly correlated with tumor size. To evaluate the
significant factors contributing to the tumor size, albumin, Cr,
platelet count, fibrinogen level, PIVKA-II, portal vein diameter,
spleen index, the abnormal values of TAT, D-dimer and FDP were
included in a stepwise multivariate analysis. TAT (P<0.05),
D-dimer and FDP (both P<0.0001) were identified as independent
factors related to the tumor size.
| Table VIIUnivariate and multivariate
regression analyses of factors associated with tumor size in 214
patients with hepatic hemangioma. |
Table VII
Univariate and multivariate
regression analyses of factors associated with tumor size in 214
patients with hepatic hemangioma.
| | Univariate
analysis | Multivariate
analysis |
|---|
| Variables | r | P-value | β | SE (β) | P-value |
|---|
| Albumin | -0.162 | 0.018 | 2.680 | 3.04 | 0.379 |
| Cr | 0.156 | 0.023 | 0.625 | 3.97 | 0.875 |
| Platelet | -0.305 | 0.001 | -0.237 | 0.14 | 0.094 |
| Fibrinogen | 0.223 | 0.001 | -0.020 | 0.01 | 0.052 |
| TAT | a | | 9.419 | 3.67 | 0.011 |
| D-dimer | a | | 11.959 | 2.02 | <0.001 |
| FDP | a | | 30.690 | 4.10 | <0.001 |
| PIVKA-II | 0.263 | <0.001 | 0.203 | 0.11 | 0.076 |
| Portal vein
diameter | 0.329 | <0.001 | 0.735 | 0.39 | 0.064 |
| Spleen index | 0.181 | 0.008 | -0.0001 | <0.01 | 0.961 |
Discussion
Hepatic hemangiomas are the most common benign
tumors of the liver, and have a prevalence of 0.4-7.3% on autopsy
series and an incidence of 1.7% on abdominal US examination
(1,2). The prevalence in the present study was
1.3%. The majority of the present patients were asymptomatic, and
the lesions were detected incidentally during routine abdominal US
examinations. Patients were asymptomatic even in the case of very
large hemangiomas, although one patient who had a relatively large
and superficially located hemangioma had abdominal distension.
We classified the internal echo patterns into
homogeneous (homogeneous hyperechoic, homogeneous hypoechoic, and
isoechoic) and mixed (mixed hyperechoic and mixed hypoechoic) type
(1). The sonographic appearance was
homogeneous in 75.7% and mixed in 24.3% of the present lesions.
Hemangiomas are usually visualized on US as well-defined,
homogeneous, hyperechoic lesions. However, the appearance can vary
in larger lesions because of intra-tumoral thrombosis, hemorrhage,
fibrosis, or calcification, resulting in a heterogeneous or
sometimes hypoechoic appearance (7,8,10). In
the present study, a mixed echo pattern was seen in 1 of 145 masses
(0.7%) with diameter <20 mm, in 30 of 48 (62.5%) with diameter
20-40 mm, and in all 21 (100%) with diameter >40 mm. This result
clearly demonstrates that the internal echo pattern becomes
inhomogeneous with increasing size of the mass. Central
degeneration resulting from thrombosis or hemorrhagic necrosis may
cause the decreased echogenicity seen in part or completely
throughout large hemangiomas (6).
The size and internal echo pattern of hepatic hemangiomas may be
caused by intra-tumoral thrombosis or hemorrhage. Some authors have
reported that the heterogeneous appearance of larger lesions is the
result of intra-tumoral thrombosis or hemorrhage (10) and that the internal echoes become
increasingly inhomogeneous as the mass increases in size because of
the histopathological presence of thrombosis, fibrosis, hemorrhage
or calcification (1).
KMS is well known as a giant hepatic hemangioma
characterized by a large vascular anomaly and consumption
coagulopathy (11). The primary
pathophysiology of KMS developing secondarily to hepatic hemangioma
is considered as the entrapment of platelets in the vascular spaces
of the hemangioma, and activation of coagulation and fibrinolysis
mechanisms (11,12). A proposed mechanism for the platelet
trapping is adhesion to the endothelium of the hemangioma, with
aggregation and activation of platelets. Excessive flow and shear
stress within the vessels of the hemangioma can also contribute to
platelet activation. Consumption of platelets and coagulation
factors, as well as ongoing fibrinolysis, results in intralesional
bleeding and enlargement of the hemangioma (13); consequently, hemangiomas may lead to
KMS during a certain period of life (11). PT and activated partial
thromboplastin time (APTT) are typically prolonged, fibrinogen is
reduced, and FDP and D-dimer can be elevated. Localized
intralesional bleeding may occur, thus enlarging the lesion and
exacerbating the underlying process (14).
Meanwhile hepatic hemangiomas are also a congenital
vascular malformation, consisting of vascular channels ranging in
size from capillary to cavernous and lined by a single layer of
flattened endothelial cells within a thin fibrous stroma (3,6,15). The
pathogenesis of hemangioma is not well understood; however, these
lesions can enlarge with time or can involute with regressive
changes such as thrombosis, necrosis, calcification, and/or
fibrosis (4). The internal echoes
become inhomogeneous as the mass increases in size because of the
histopathological presence of thrombosis, fibrosis, hemorrhage, or
calcification (1). Bleeding
disorders caused by excessive flow and shear stress within the
vessels of the hemangioma result from intravascular coagulation
within the tumor (11,16). In the present study, patients with
larger and mixed echo type hemangiomas had significantly lower
platelet counts and fibrinogen levels than those of the other
types, and the values of TAT, D-dimer, and FDP were significantly
elevated with increasing tumor size; those of the mixed echo group
were significantly higher than those of the homogenous group. We
examined independent factors among the clinical parameters for the
size of hemangiomas and found that serum TAT, D-dimer and FDP were
important independent factors. From these results, we speculate
that lesion size and echogenicity on US are associated with
coagulation factors, especially TAT, D-dimer, and FDP. These
factors are well known as hemostatic and fibrinolytic biomarkers
that are considered useful for the diagnosis of thrombosis
(17,18). Therefore, we can conclude that
differences in the size and echogenicity of hemangiomas are caused
by intra-tumoral thrombosis and subsequent hemorrhage.
TAT is induced by thrombin and is direct evidence of
the increased activation of coagulation and the consumption of
inhibitors. Therefore, the TAT level reflects the early phase of
thrombosis and is a useful predictor of prethrombotic state.
Elevated TAT reflects activation of the coagulation system and
indicates a hypercoagulable state in which, together with the
stasis of blood flow that occurs within the vessels of a
hemangioma, thrombosis can easily form (18). D-dimer, a product of fibrin
degradation, reflects both the activation of fibrinolysis and the
severity of the hypercoagulable state. Elevated D-dimer can result
from the marked activation of blood coagulation, leading to massive
formation of intravascular thrombosis. Accordingly, increased
plasma levels of D-dimer are considered to reflect the presence of
intravascular thrombosis (19). FDP
consists of both fibrin and fibrinogen-degradation products, and
the levels of FDP are often closely correlated with D-dimer. More
than 50% of patients with FDP values >5.0 µg/ml have some
thrombosis, suggesting that these patients may have a
hypercoagulable state. Thus, high plasma levels of FDP, including
D-dimer, reflect a thrombotic state and suggest the presence of
venous thromboembolism (17). As
D-dimer and FDP reflect secondary fibrinolysis after clot
formation, they may not be useful as early predictive markers for
thromboembolism. In contrast, the TAT level is direct evidence of
the increased activation of coagulation and the consumption of
inhibitors. The half-life of TAT is short, whereas that of D-dimer
is long. Thus, TAT levels increase rapidly and diminish relatively
soon after the onset of thromboembolism (18). In the present study, almost all
patients with prominent elevation of D-dimer and FDP also had high
TAT levels, suggesting a hypercoagulable state and subsequent
repeated formation of thromboembolism and fibrinolysis within the
vessels of hemangiomas.
Fibrinogen is converted to fibrin by activated
thrombin and is a key protein in the coagulation pathway, clot
formation, and in supporting platelet aggregation, which forms the
final step of the coagulation cascade. Platelets are also crucial
in the coagulation system (20). A
previous study reported that plasma fibrinogen levels were
correlated with platelet counts (21). Our results demonstrated that
patients with larger lesions or mixed echo pattern had
significantly lower platelet counts and fibrinogen levels. We
speculated that there could be two possible causes for the decrease
in fibrinogen levels and platelet counts as complications
associated with hemangiomas, which are, respectively: (1) enhanced thrombotic formation through
platelet aggregation, (2) increased
consumption of fibrinogen caused by increased activation of
fibrinolysis; and (1) entrapment of
platelets in the vascular spaces of the hemangioma and activation
of coagulation, (2) consumption of
platelets in addition to ongoing fibrinolysis. In several previous
studies of 51Cr-platelets or 125I-fibrinogen (22-25),
there was a rapid removal of radioactive platelets and fibrinogen
from the circulation in hemangioma patients. Low platelet counts
and fibrinogen levels were considered to be the result of
intravascular coagulation in the hemangioma, and it was concluded
that platelets and fibrinogen were consumed or degraded in the
hemangioma. These decreases in platelet counts and fibrinogen
levels were not low enough to be directly related to systemic
bleeding disorders, but rather an indirect effect of intra-tumoral
hemorrhage, along with thrombosis.
Portal vein diameter and splenic index were
significantly elevated in our patients with larger tumor size and
mixed echo pattern. An experimental model with portal hypertension
has shown that portal pressure positively correlated with spleen
size (26). Portal hypertension
develops because of increased intrahepatic vascular resistance,
often caused by chronic liver disease, that leads to structural
distortion by such as fibrosis and microvascular thrombosis
(27,28). In our study, M2BPGi (29,30), a
biochemical marker of liver fibrosis, was significantly elevated in
patients with relatively large hemangiomas; in addition, chronic
liver disease as underlying disease was present in 15 of 145
patients (10.3%) in the small group, in 11 of 48 (22.9%) in the
medium group, and in 6 of 21 (28.6%) in the large group, with
significant difference in each group (P<0.05; data not shown).
This finding suggests that the values of M2BPGi in each group might
be influenced by the presence of chronic liver disease as
underlying disease. However; the mean M2BPGi values in the large
group were within normal values and were <1.00 COI, which is the
optimal cutoff value in patients with fibrosis grade F1(30). Therefore the elevation of portal
vein diameter and spleen index seen in our study might be not
caused by liver fibrosis. Based on our results and those of
previous studies, we speculate that these high values may have been
caused by increased vascular resistance due to microvascular
thrombosis within hemangiomas (27,28),
regional circulatory disorders and liver fibrosis surrounding the
hemangiomas (31,32), and possibly by intrahepatic fibrosis
due to chronic liver disease. Although the effects of these factors
on intrahepatic vascular resistance leading to portal hypertension
are not certain, it is possible that the existence of hepatic
hemangiomas may play a role in triggering portal hypertension.
The significance of change in size of hemangiomas is
controversial. Several studies that have examined the natural
course of hepatic hemangiomas reported that the vast majority
remained stable in size (3,5,6,33).
Among the studies that have reported hemangioma enlargement, there
is general agreement that these lesions increase in size following
intra-tumoral thrombosis or hemorrhage (2,34). In
contrast, some authors have reported that hemangiomas might undergo
degeneration and fibrous replacement, which would explain the size
decrease in one of the hemangiomas (35), and others have reported that the
size decrease in hemangiomas is associated with the changes in
hepatic blood flow and intrahepatic environment that occur with the
progression of liver fibrosis (3,31,32),
with regional circulatory disorders in the peripheral liver that
are triggered by intra-tumoral thrombus formation (36), and with suppression caused by
pressure from the surrounding tissue after tumor size has increased
to a certain degree (37).
In the present study, most of the hepatic
hemangiomas remained stable in size and there was little change in
echo pattern during their natural course. The average follow-up
period after the initial examination was 21.1 months (range, 12-29
months) and the number of follow-up patients was 93. Our study
suffered from limitations regarding the length of follow up and the
number of patients; therefore, we could not reach significant
conclusions from our data. A longer follow-up period and a larger
number of patients are needed to solve this issue. Because tumors
<20 mm in diameter accounted for more than half of the
hemangiomas in the present study, measurement error could easily
have occurred in these patients during the follow-up period. It is
necessary to find an appropriate method to reduce the possibility
of false positive findings caused by such error. However, based on
our results and those of previous studies, we can speculate that
the change in the size of hemangiomas depends on the various
influences of growth factors caused by intra-tumoral thrombosis,
hemorrhage, and necrosis; inhibitory factors caused by
intra-tumoral degeneration and fibrous replacement; or
extra-tumoral circulatory disorders, liver fibrosis, or pressure
from surrounding tumor.
In conclusion, our study is the first to demonstrate
a relationship between tumor size and the internal echo pattern of
hepatic hemangiomas and coagulation factors. Although further
studies are required to evaluate the exact relationship, we
speculate that differences in tumor size and echogenicity are
caused by intra-tumoral thrombosis and subsequent hemorrhage.
Acknowledgements
Not applicable.
Funding
No funding was received.
Availability of data and materials
The datasets used and/or analyzed during the current
study are available from the corresponding author on reasonable
request.
Authors' contributions
SM was involved in conceptualization, methodology,
formal analysis, investigation, data curation, the confirmation of
data authenticity, review and editing of the manuscript,
visualization, supervision and project administration. MK was
involved in conceptualization, methodology, formal analysis,
statistical analysis, data curation, the confirmation of data
authenticity, review and editing of the manuscript, visualization
and supervision. TM performed data curation. HI was involved in the
acquisition of data and confirmation of data authenticity, review
and editing of the manuscript, visualization and supervision. All
authors read and approved the final manuscript.
Ethics approval and consent to
participate
The present study was approved by our hospital
ethical committee (Hino Hospital, Tottori, Japan; approval no.
2018-4) and performed according to the Declaration of Helsinki.
Consent to participate was acquired using an opt-out system.
Patient consent for publication
Consent for publication was acquired using an
opt-out system.
Competing interests
The authors declare that they have no competing
interests.
References
|
1
|
Ito H, Tsujimoto F, Nakajima Y, Igarashi
G, Okamura T, Sakurai M, Nobuoka S and Otsubo T: Sonographic
characterization of 271 hepatic hemangiomas with typical appearance
on CT imaging. J Med Ultrasonics. 39:61–68. 2012.PubMed/NCBI View Article : Google Scholar
|
|
2
|
Li J, Huang L, Liu C, Yan J, Xu F, Wu M
and Yan Y: New recognition of the natural history and growth
pattern of hepatic hemangioma in adults. Hepatol Res. 46:727–733.
2016.PubMed/NCBI View Article : Google Scholar
|
|
3
|
Okano H, Shiraki K, Inoue H, Ito T,
Yamanaka T, Deguchi M, Sugimoto K, Sakai T, Ohmori S, Murata K, et
al: Natural course of cavernous hepatic hemangioma. Oncol Rep.
8:411–414. 2001.PubMed/NCBI View Article : Google Scholar
|
|
4
|
Kim GE, Thung SN, Tsuji WM and Ferrell LD:
Hepatic cavernous hemangioma: Underrecognized associated histologic
features. Liver Int. 26:334–338. 2006.PubMed/NCBI View Article : Google Scholar
|
|
5
|
Gandolfi L, Leo P, Solmi L, Vitelli E,
Verros G and Colecchia A: Natural history of hepatic hemangiomas:
Clinical and ultrasound study. Gut. 32:677–680. 1991.PubMed/NCBI View Article : Google Scholar
|
|
6
|
Gibney RG, Hendin AP and Cooperberg PL:
Sonographically detected hepatic hemangiomas: Absence of change
over time. Am J Rentgenol. 149:953–957. 1967.PubMed/NCBI View Article : Google Scholar
|
|
7
|
Erdogan D, Busch ORC, Delden OM, Bennink
RJ, Kate FJ, Gouma DJ and Guiik TM: Management of liver hemangiomas
according to size and symptoms. J Gastroenterol Hepatol.
22:1953–1958. 2007.PubMed/NCBI View Article : Google Scholar
|
|
8
|
Duxburg MS and Garden OJ: Giant hemangioma
of the liver: Observation or resection? Dig Surg. 27:7–11.
2010.PubMed/NCBI View Article : Google Scholar
|
|
9
|
Carlo ID, Koshy R, Mudares SA and Ardiri
A: Giant carvenous liver hemangiomas: Is it the time to change the
size categories? Hepatobiliary Pancreat Dis Int. 15:21–29.
2016.PubMed/NCBI View Article : Google Scholar
|
|
10
|
Herman P, Coata ML, Machado MA, Pugliese
V, D'Albuquerque LA, Machado MC, Gama-Rodrigues JJ and Saad WA:
Management of hepatic hemangiomas: A 14-year experience. J
Gastrointest Surg. 9:853–859. 2005.PubMed/NCBI View Article : Google Scholar
|
|
11
|
Bozkaya H, Cinar C, Unalp OV, Parildar M
and Oran I: Unusual treatment of Kasabach-Merritt syndrome
secondary to hepatic hemangioma: Embolization with bleomycin. Wien
Klin Wochenschr. 127:488–490. 2015.PubMed/NCBI View Article : Google Scholar
|
|
12
|
Hall GW: Kasabach-Merritt syndrome:
Pathogenesis and management. Br J Hematol. 112:851–862.
2001.PubMed/NCBI View Article : Google Scholar
|
|
13
|
Rodriguez V, Lee A, Witman PM and Anderson
PA: Kasabach-merritt phenomenon: Case series and retrospective
review of the mayo clinic experience. J Pediatr Hematol Oncol.
31:522–526. 2009.PubMed/NCBI View Article : Google Scholar
|
|
14
|
O'Rafferty C, O'Regan GM, Irvine AD and
Smith OP: Recent advances in the pathobiology and management of
Kasabach-Merritt phenomenon. Br J Hematol. 171:38–51.
2015.PubMed/NCBI View Article : Google Scholar
|
|
15
|
Hoekstra LT, Bieze M, Erdogan D, Roelofs
JJ, Beuers UH and Gulik TM: Management of giant hemagiomas: An
update. Expert Rev Gastroenterol Hepatol. 7:263–268.
2013.PubMed/NCBI View Article : Google Scholar
|
|
16
|
Mewes T, Moldenhauer H, Pfeifer J and
Papenberg J: The Kasabach-Merritt syndrome: Severe bleeding
disorder caused by celiac arteriography-reversal by heparin
treatment. Am J Gastroenterl. 84:965–971. 1989.PubMed/NCBI
|
|
17
|
Wada H and Sakuragawa N: Are
fibrin-related markers useful for the diagnosis of thrombosis?
Semin Thromb Hemost. 34:33–38. 2008.PubMed/NCBI View Article : Google Scholar
|
|
18
|
Lee SY, Niikura T, Iwakura T, Sakai Y,
Kuroda R and Kurosaka M: Thrombin-antithrombin III complex tests: A
useful screening tool for postoperative venous thromembolism in
lower limb and pelvic fracture. J Orthop Surg. 25:1–6.
2017.PubMed/NCBI View Article : Google Scholar
|
|
19
|
Deng Y, He L, Yang J and Wang J: Serum
D-dimer as an indicator of immediate mortality in patients with
in-hospital cardiac arrest. Thromb Res. 143:161–165.
2016.PubMed/NCBI View Article : Google Scholar
|
|
20
|
Tang L, Liu K, Wang J, Wang C, Zhao P and
Liu J: High preoperative plasma fibrinogen levels are associated
with distant metastases and impaired prognosis after curative
resection in patients with colorectal cancer. J Surg Oncol.
102:428–432. 2010.PubMed/NCBI View Article : Google Scholar
|
|
21
|
Wang GY, Jiang N, Yi HM, Wang GS, Zhang
JW, Li H, Zhang J, Zhang Q, Yang Y and Chen GH: Pretransplant
elevated plasma fibrinogen level is a novel prognostic predictor
for hepatocellular carcinoma recurrence and patient survival
following liver transplantation. Ann Transplant. 21:125–130.
2016.PubMed/NCBI View Article : Google Scholar
|
|
22
|
Suzuki H, Nimura Y, Kamiya J, Kondo S,
Nagino M, Kanai M and Miyachi M: Preoperative transcatheter
arterial embolization for giant carvenous hemangioma of the liver
with consumption coagulopathy. Am J Gastroenterol. 92:688–691.
1997.PubMed/NCBI
|
|
23
|
Blix S and Aas K: Giant hemangioma,
thrombocytopenia, fibrinogenopenia, and fibrinolytic activity. Acta
Med Scand. 169:63–70. 1961.
|
|
24
|
Wochner RD, Kulapongs P and Bachmann F:
125I-fibrinogen turnover and coagulation studies in a patient with
Kasabach-Merritt syndrome. J Lab Clin Med. 70(997)1967.
|
|
25
|
Hillman RS and Philips LL:
Clotting-fibrinolysis in a cavernous hemangioma. Am J Dis Child.
113:649–653. 1967.PubMed/NCBI View Article : Google Scholar
|
|
26
|
Iwaki Y: Pathophysiology of portal
hypertension. Cli Liver Dis. 18:281–291. 2014.PubMed/NCBI View Article : Google Scholar
|
|
27
|
McConnell M and Iwakiri Y: Biology of
portal hypertension. Hepatol Int. 12 (Suppl 1):S11–S23.
2018.PubMed/NCBI View Article : Google Scholar
|
|
28
|
Mehta G, Gustot T, Mookerjee RP,
Garcia-Pagan JC, Fallon MB, Shah VH, Moreau R and Jalan R:
Inflammation and portal hypertension-The undiscovered country. J
Hepatol. 61:155–163. 2014.PubMed/NCBI View Article : Google Scholar
|
|
29
|
Shirabe K, Bekki Y, Gantumur D, Araki K,
Ishii N, Kuno A, Narimatsu H and Mizokami M: Mac-2 binding protein
glycan isomer (M2BPGi) is a new serum biomarker for assessing liver
fibrosis: More than a biomarker of liver fibrosis. J Gastroenterol.
53:819–826. 2018.PubMed/NCBI View Article : Google Scholar
|
|
30
|
Toshima T, Shirabe K, Ikegami T, Yoshizumi
T, Kuno A, Togayachi A, Gotoh M, Narimatsu H, Korenaga M, Mizokami
M, et al: A novel serum marker, glycosylated Wisteria floribunda
agglutinin-positive Mac-2 binding protein (WFA(+)-M2BP), for
assessing liver fibrosis. J Gastroenterol. 50:76–84.
2015.PubMed/NCBI View Article : Google Scholar
|
|
31
|
Kobayashi T, Kawano M, Tomita Y, Tamano M,
Saigusa S, Horinaka M, Monma T, Koguma T, Yanagisawa N, Ohe T, et
al: Follow-up study of hepatic hemangiomas. Nippon Shokakibyo
Gakkai Zasshi. 92:41–46. 1995.PubMed/NCBI(In Japanese).
|
|
32
|
Miyaki D, Aikata H, Waki K, Murakami H,
Hashimoto Y, Nagaoki H, Katamura Y, Kataoka T, Takagi S, Hiramatsu
K, et al: Significant regression of a cavernous hepatic hemangioma
to a sclerosed hemangioma over 12 years: A case study. Nippon
Shokakibyo Gakkai Zasshi. 108:954–961. 2011.PubMed/NCBI(In Japanese).
|
|
33
|
Yeh WC, Yang PM, Huang GT, Sheu JC and
Chen DS: Long-term follow-up of hepatic hemangiomas by
ultrasonography: With emphasis on the growth rate of the tumor.
Hepatogastroenterology. 54:475–479. 2007.PubMed/NCBI
|
|
34
|
Nghiem HV, Bogost GA, Ryan JA, Lund P,
Freeny PC and Rice KM: Cavernous hemangiomas of liver: Enlargement
over time. Am J Rentgenol. 169:137–140. 1997.PubMed/NCBI View Article : Google Scholar
|
|
35
|
Bree RL, Schwab RE and Neiman HL: Solitary
echogenic spot in the liver: Is it diagnostic of a hemangioma? Am J
Rentgenol. 140:41–45. 1983.PubMed/NCBI View Article : Google Scholar
|
|
36
|
Tsumaki N, Waguri N, Yonayama O, Hama H,
Kawahisa J, Yokoo K, Aiba T, Furukawa K, Sugimura K, Igarashi K, et
al: A case of sclerosed hemangioma with a significant morphological
change over a period of 17 years. Kanzo. 49:268–274. 2008.
|
|
37
|
Ogawa K, Takeuchi K, Okuda C, Tamura T,
Koizumi Y, Koyama R, Imamura T, Inoue Y and Arase Y: Change in size
of hepatic hemangiomas during long-term observation: 80 lesions
with observation for over 10 years. Jpn J Med Ultrasonics.
41:749–756. 2014.
|