Introduction
Red blood cell distribution width (RDW) is expressed
as the ratio of the standard deviation of red blood cell volume and
mean corpuscular volume, and is determined from the width of the
erythrocyte volume distribution curve at a level of 20% above the
baseline (1). RDW is an easily
acquired and cost-effective parameter that is often measured as
part of the complete blood count, and it reflects red blood cell
volume heterogeneity, which may be attributable to the presence of
small and large red blood cells. RDW is generally used together
with mean corpuscular volume to diagnose and distinguish between
different types of anemia (2). High
RDW levels may be found in iron deficiency and megaloblastic
anemia.
It was recently reported that RDW may be a poor
prognostic factor in heart failure, sepsis and sarcoidosis
(3-5).
High RDW has also been associated with poor prognosis in several
malignancies, such as colon, breast and esophageal cancer (6-8).
The treatment options and prognosis assessment for malignant tumors
are mainly based on the TNM stage, which has certain limitations,
as patients with early-stage cancer may have a poor prognosis.
Although the mechanisms underlying increased RDW remain unclear,
several factors, including inflammation and malnutrition, may be
involved. Few studies have reported an association between
preoperative RDW levels and the long-term prognosis of patients
with non-small cell lung cancer (NSCLC) to date. Historically, the
standard surgical strategy for NSCLC has been lobectomy, although
previous studies have also included cases of sublobar resection,
the curability of which remains debatable (9,10).
The aim of the present study was to investigate the
prognostic impact of preoperative levels of RDW on the long-term
survival of patients who have undergone radical surgery for
NSCLC.
Patients and methods
Patient selection
Between January 2006 and December 2013, a total of
338 patients with lung cancer who had undergone anatomical
resection (lobectomy or pneumonectomy) at the Department of
Thoracic Surgery of Kansai Medical University Hospital (Hirakata,
Japan) were retrospectively analyzed. Patients with sublobar
resection (segmentectomy or wedge resection), serious coexistent
infections, small cell carcinoma, cN3 or cM1 were excluded. The
clinical records of all patients were reviewed.
Diagnosis and follow-up
The diagnosis of lung cancer was confirmed by
bronchoscopic biopsy, computed tomography (CT)-guided biopsy or
surgical specimen examination. Clinical and pathological staging
was based on the 8th edition of the TNM classification of the Union
for International Cancer Control (11). Tumor histological classification was
based on the World Health Organization classification system
(12). The interval between
follow-ups was 3 months for the first 2 years, and 6 months
thereafter for up to 5 years. A full examination and chest X-ray
were performed at each visit, and a CT scan was performed annually.
Other investigations, such as brain magnetic resonance imaging
and/or positron emission tomography, were performed when clinically
indicated.
Data collection and analysis
Laboratory samples and clinicopathological data,
including age at surgery, sex, body mass index (BMI), Brinkman
index, history of diabetes mellitus, heart diseases, other
malignancies, Charlson Comorbidity Index, percent vital capacity
(%VC), percent forced expiratory volume in 1 sec (FEV1.0%), maximum
standardized uptake value (SUVmax) and clinical TNM stage, were
collected prior to surgery. The complete blood cell count and
carcinoembryonic antigen (CEA) level were measured using two
automatic analyzers (Sysmex XE-2100, Sysmex Corporation; AU5400
Chemistry System, Beckman Coulter, Inc.).
The normal range for RDW in our institution was ≥38
and <50 fl, and patients were divided into two groups, the high
(RDW ≥50 fl, n=25) and low (RDW <50 fl, n=313) RDW groups. The
following categorical variables were compared between the high and
low RDW groups: Age (<68/≥68), sex (male/female), BMI
(≤23/>23), Brinkman index (<400/≥400), anemia
(absent/present), CEA (≤5/>5), diabetes mellitus
(absent/present), heart disease (absent/present), past history of
malignancy (absent/present), Charlson Comorbidity Index (0-1/2+),
%VC (≥80/<80), FEV1.0% (≥70/<70), SUVmax (<4.4/≥4.4),
clinical TNM stage (I, II or III) and pathological subtype
(adenocarcinoma, squamous cell carcinoma or other types of
carcinoma). The cutoff values of age, BMI, Brinkman index and
SUVmax were set as 68 years, 23 kg/m2, 400 and 4.4,
respectively, which were the median values of each variable. The
cutoff values of anemia, CEA, %VC and FEV1.0% were determined by
the normal range. The normal ranges of hemoglobin concentrations in
our institution are 12.9-17.2 g/dl in male patients and 11.3-15.4
g/dl in female patients. Survival outcomes, including overall and
recurrence-free survival rates, were compared.
Statistical analysis
The χ2 and Fisher's exact tests were used
to compare categorical covariates between the groups. The survival
curves were constructed using the Kaplan-Meier method, and the
differences between the groups were compared using the log-rank
test. The prognostic factors of overall and recurrence-free
survival were also compared between groups using the univariate and
multivariate Cox proportional hazard model. A stepwise backward
elimination method with a probability level of 0.15 was used to
select the most powerful sets of outcome predictors.
All statistical analyses were performed using the
statistical software packages Stata/SE 14.2 (StataCorp LP) and EZR
(Saitama Medical Center, Jichi Medical University), which is a
graphical user interface for R (The R Foundation for Statistical
Computing) (13). For all analyses,
P<0.05 was considered to indicate a statistically significant
difference.
Results
Clinicopathological
characteristics
The present study included 338 patients (25 with a
high RDW and 313 with a low RDW), 100 of whom succumbed to the
disease (15 in the high RDW and 85 in the low RDW group) and 110
presented with recurrence (12 in the high RDW and 98 in the low RDW
group). The baseline characteristics of all eligible cases (n=338)
are summarized in Table I.
 | Table IPatient characteristics according to
the RDW groups. |
Table I
Patient characteristics according to
the RDW groups.
| | RDW (fl) | |
|---|
| Variables (patient
no. evaluated per variable) | <50 | ≥50 | P-value |
|---|
| Age, years (338) | | | 0.859 |
|
<68 | 156 | 12 | |
|
≥68 | 157 | 13 | |
| Sex (338) | | | 0.03a |
|
Male | 191 | 21 | |
|
Female | 122 | 4 | |
| Body mass index,
kg/m2 (338) | | | 0.328 |
|
≤23 | 156 | 15 | |
|
>23 | 157 | 10 | |
| Brinkman index | | | 0.349 |
|
<400 | 143 | 9 | |
|
≥400 | 170 | 16 | |
| Anemia (338) | | | 0.053 |
|
Absent | 280 | 19 | |
|
Present | 33 | 6 | |
| Carcinoembryonic
antigen, ng/ml (326) | | | 0.428 |
|
≤5 | 212 | 15 | |
|
>5 | 101 | 10 | |
| Diabetes mellitus
(338) | | | 0.02a |
|
Absent | 260 | 25 | |
|
Present | 53 | 0 | |
| Heart disease
(338) | | | 0.694a |
|
Absent | 291 | 23 | |
|
Present | 22 | 2 | |
| History of
malignancy (338) | | | 1a |
|
Absent | 260 | 21 | |
|
Present | 53 | 4 | |
| Charlson
Comorbidity Index (338) | | | 0.282 |
|
0-1 | 56 | 7 | |
|
2+ | 257 | 18 | |
| %VC (336) | | | 0.137a |
|
≥80 | 306 | 23 | |
|
<80 | 7 | 2 | |
| FEV1.0% (338) | | | 0.019 |
|
≥70 | 241 | 14 | |
|
<70 | 72 | 11 | |
| SUVmax (246) | | | 0.098 |
|
<4.4 | 114 | 5 | |
|
≥4.4 | 199 | 20 | |
| cTNM (338) | | | 0.559a |
|
I | 269 | 20 | |
|
II | 39 | 5 | |
|
III | 5 | 0 | |
| Pathological
subtype (338) | | | 0.116 |
|
Adenocarcinoma | 244 | 15 | |
|
Squamous
cell carcinoma | 38 | 5 | |
|
Others | 31 | 5 | |
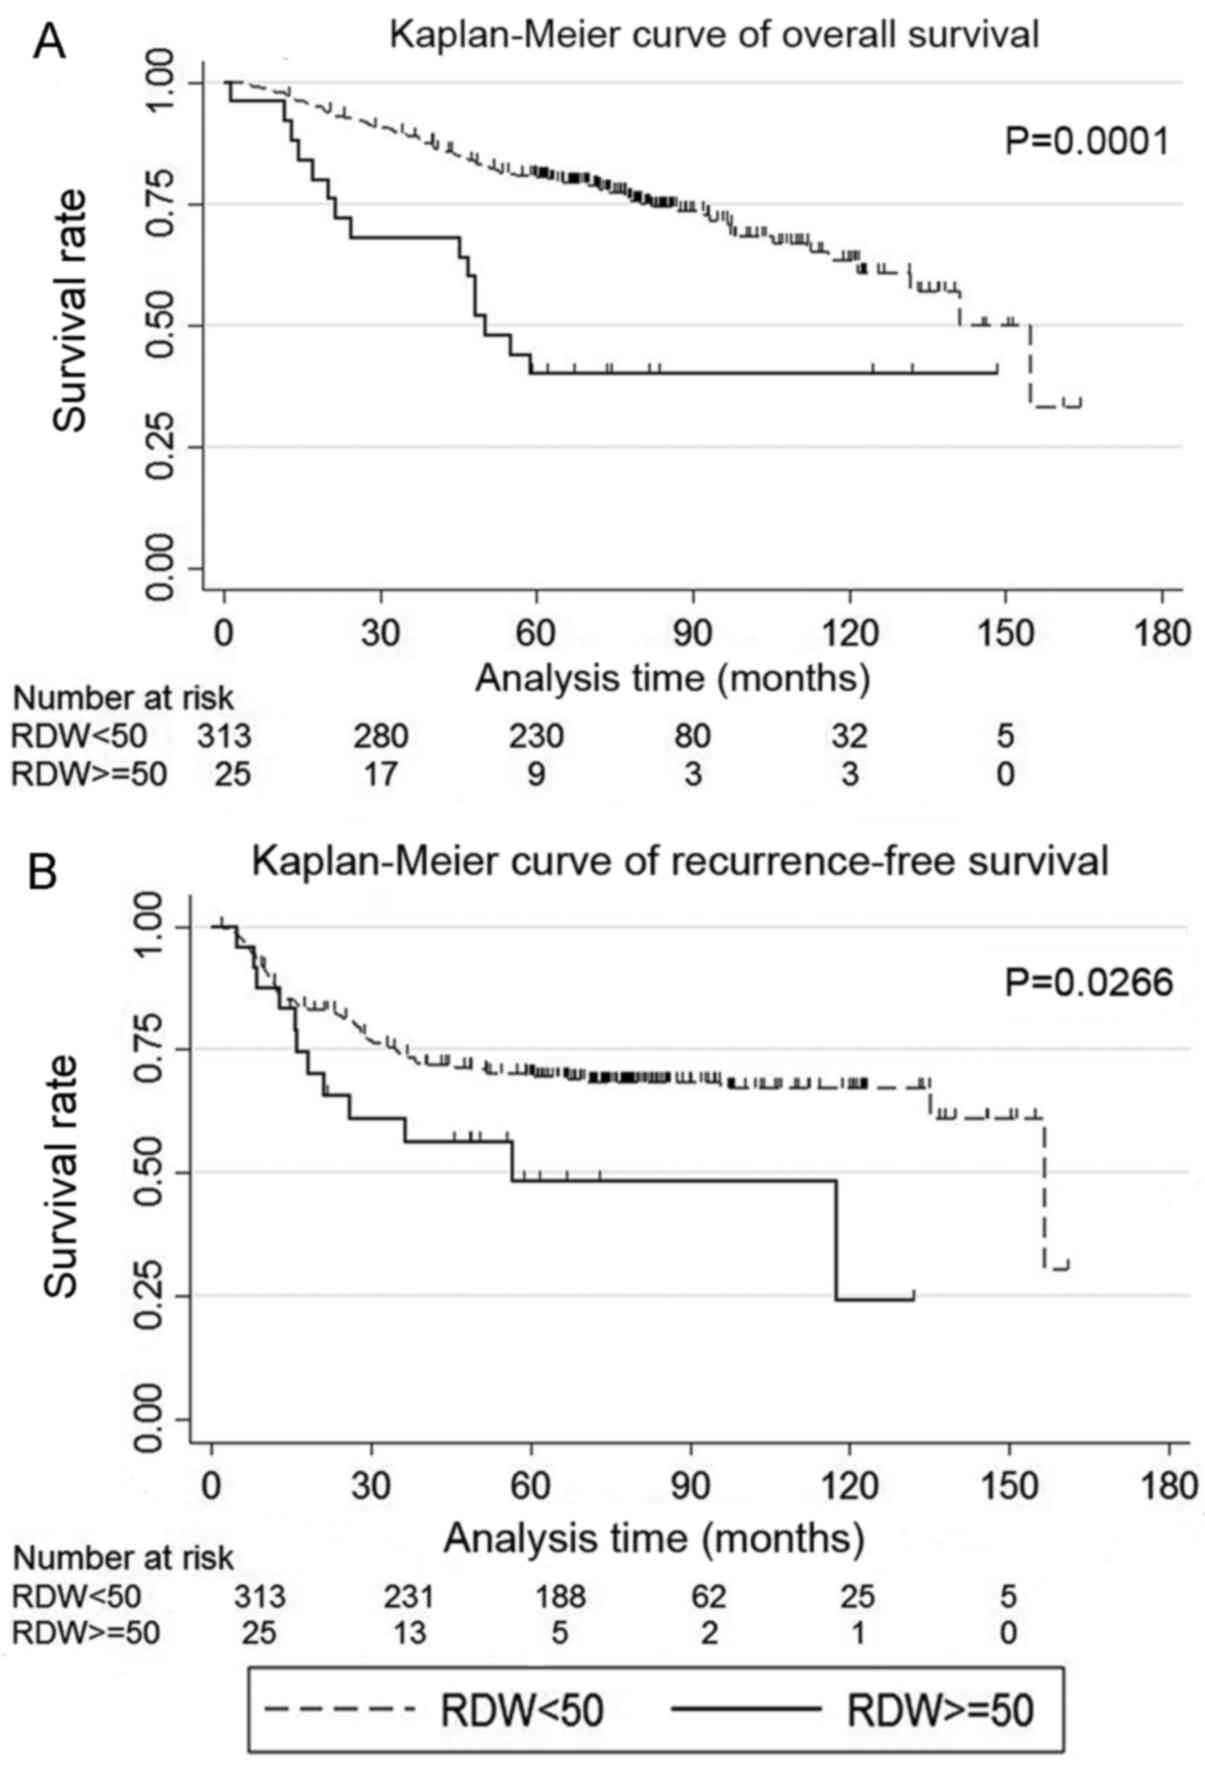
Survival
High RDW (RDW ≥50 fl) was more common in male
patients, patients without diabetes mellitus and patients with
chronic obstructive pulmonary disease (Table I). The low RDW group exhibited
higher overall and recurrence-free survival rates compared with the
high RDW group (P=0.0001 and 0.0266, respectively; Fig. 1A and B). Anemia was detected in 39 patients,
including 2, 34 and 3 patients with microcytic, normocytic and
macrocytic anemia, respectively. The 5-year overall survival rates
for the high and low RDW groups were 0.40% (95% CI: 0.21-0.58) and
0.80% (95% CI: 0.76-0.84), respectively, and the recurrence-free
survival rates were 0.48% (95% CI: 0.25-0.68) and 0.70% (95% CI:
0.64-0.75), respectively.
Univariate and multivariate analysis
of postoperative survival in lung cancer
Univariate analysis of overall survival revealed
that RDW, age, sex, CEA, heart disease, history of malignancy,
Charlson Comorbidity Index, %VC, SUVmax, cTNM and pathological
subtype were significant predictors (Table IIA). Multivariate analysis revealed
that RDW, CEA, Charlson Comorbidity Index, SUVmax and cTNM were
independent prognostic factors for overall survival (Table IIB). Univariate analysis of
recurrence-free survival revealed that RDW, CEA, SUVmax and cTNM
were significant predictors (Table
IIIA). Multivariate analysis revealed that CEA, SUVmax and cTNM
were independent prognostic factors for recurrence-free survival
(Table IIIB).
| Table IIUnivariate and multivariate Cox
proportional hazard models for overall survival. |
Table II
Univariate and multivariate Cox
proportional hazard models for overall survival.
| A, Univariate
analysis |
|---|
| Variables | Hazard ratio | 95% CI | P-value |
|---|
| RDW | 2.95 | 1.70-5.12 | <0.001 |
| Age | 1.74 | 1.16-2.60 | 0.007 |
| Sex | 0.61 | 0.40-0.95 | 0.027 |
| Body mass
index | 1.05 | 0.71-1.55 | 0.809 |
| Brinkman index | 1.37 | 0.91-2.04 | 0.128 |
| Anemia | 1.09 | 0.58-2.04 | 0.787 |
| Carcinoembryonic
antigen | 1.91 | 1.28-2.84 | 0.001 |
| Diabetes
mellitus | 0.87 | 0.49-1.53 | 0.628 |
| Heart disease | 1.89 | 1.01-3.55 | 0.047 |
| History of
malignancy | 1.66 | 1.04-2.65 | 0.034 |
| Charlson
Comorbidity Index | 2.17 | 1.40-3.37 | <0.001 |
| %VC | 2.78 | 1.13-6.87 | 0.027 |
| FEV1.0% | 1.47 | 0.96-2.24 | 0.078 |
| SUVmax | 2.50 | 1.52-4.13 | <0.001 |
| cTNM | | | |
|
I | 1 | | |
|
II | 2.22 | 1.35-3.63 | 0.002 |
|
III | 5.50 | 2.00-15.11 | 0.001 |
| Pathological
subtype | | | |
|
Adenocarcinoma | 1 | 0.56-1.90 | 0.918 |
|
Squamous
cell carcinoma | 1.03 | 1.10-3.35 | 0.022 |
|
Others | 1.92 | | |
| B, Multivariate
analysis |
| Variables | Hazard ratio | 95% CI | P-value |
| RDW | 2.29 | 1.3-4.01 | 0.004 |
| Carcinoembryonic
antigen | 1.89 | 1.26-2.84 | 0.002 |
| Charlson
Comorbidity Index | 2.28 | 1.26-2.84 | <0.001 |
| SUVmax | 1.98 | 1.19-3.3 | 0.009 |
| cTNM | | | |
|
I | 1 | | |
|
II | 1.70 | 1.03-2.81 | 0.039 |
|
III | 7.05 | 2.51-19.8 | <0.001 |
| Table IIIUnivariate and multivariate Cox
proportional hazard models for recurrence-free survival. |
Table III
Univariate and multivariate Cox
proportional hazard models for recurrence-free survival.
| A, Univariate
analysis |
|---|
| Variables | Hazard ratio | 95% CI | P-value |
|---|
| RDW | 1.95 | 1.07-3.56 | 0.03 |
| Age | 0.96 | 0.66-1.40 | 0.852 |
| Sex | 0.99 | 0.68-1.46 | 0.97 |
| Body mass
index | 0.92 | 0.63-1.34 | 0.658 |
| Brinkman index | 1.00 | 0.69-1.46 | 0.99 |
| Anemia | 0.78 | 0.41-1.50 | 0.463 |
| Carcinoembryonic
antigen | 1.99 | 1.36-2.90 | <0.001 |
| Diabetes
mellitus | 1.00 | 0.60-1.68 | 0.997 |
| Heart disease | 1.63 | 0.87-3.04 | 0.125 |
| History of
malignancy | 1.11 | 0.67-1.82 | 0.683 |
| Charlson
Comorbidity Index | 0.87 | 0.52-1.47 | 0.608 |
| %VC | 1.64 | 0.60-4.45 | 0.334 |
| FEV1.0% | 1.00 | 0.64-1.55 | 1 |
| SUVmax | 2.06 | 1.32-3.20 | 0.001 |
| cTNM | | | |
|
I | 1 | | |
|
II | 2.65 | 1.68-4.19 | <0.001 |
|
III | 4.76 | 1.74-13.04 | 0.002 |
| Pathological
subtype | | | |
|
Adenocarcinoma | 1 | 0.29-1.16 | 0.125 |
|
Squamous
cell carcinoma | 0.58 | 0.80-2.47 | 0.237 |
|
Others | 1.41 | | |
| B, Multivariate
analysis |
| Variables | Hazard ratio | 95% CI | P-value |
| Carcinoembryonic
antigen | 1.90 | 1.30-2.79 | 0.001 |
| SUVmax | 1.73 | 1.11-2.71 | 0.017 |
| cTNM | | | |
|
I | 1 | | |
|
II | 2.25 | 1.42-3.57 | 0.035 |
|
III | 5.74 | 2.06-16.0 | 0.001 |
Discussion
The present study identified high RDW as an
independent prognostic factor for overall survival in patients with
complete resection of NSCLC, irrespective of age. RDW is a measure
of variability in the size of circulating erythrocytes, and is
usually examined as part of complete blood count using an automatic
measurement system.
RDW is used to differentiate the etiology of anemia,
and it is easy to measure and cost-effective. In addition to the
conventional use of RDW, elevated RDW is considered to be
associated with chronic inflammation and poor nutritional status
(14). Inflammation prevents
erythrocyte maturation by inhibiting iron metabolism and the
response to erythropoietin, leading to an increase in RDW (14). Recently, elevated RDW levels were
found to be associated with adverse outcomes in patients with heart
failure, sepsis, breast cancer, esophageal carcinoma and lung
cancer (3,4,6,7,15).
To date, eight studies have investigated the role of
RDW in lung cancer (Table IV)
(15-22).
All studies but one reported that high RDW was associated with poor
prognosis in patients with lung cancer. The exact mechanism of how
high RDW affects the prognosis of patients with lung cancer has not
been elucidated. In previous studies, surgical treatment for NSCLC
included sublobar resection (15,18-22);
the novelty of the present study was that it investigated patients
with NSCLC who had undergone lobectomy.
| Table IVReview of the association between RDW
and overall survival in lung cancer. |
Table IV
Review of the association between RDW
and overall survival in lung cancer.
| Study, year | Number of
patients | Hazard ratio of
high RDW | 95% CI | Other variables in
the estimated model | (Refs.) |
|---|
| Toyokawa et
al, 2019 | 273 | 2.44 | 1.28-4.49 | Sex, PS, BMI,
smoking history, CEA, Surgical procedure, pathological stage,
histology, CONUT score, hemoglobin | (15) |
| Bozkaya et
al, 2019 | 153 | 1.607a | 1.041-2.480 | Age, PS, weight
loss, GPS, NLR, number of metastatic sites | (16) |
| Kiriu et al,
2019 | 47 | 3.04 | 1.02-7.65 | NLR, smoking
history, age, sex, PS | (17) |
| Kobayashi et
al, 2019 | 166 | 2.8b | 1.2-6.5 | Sex, CEA, GPS, NLR,
ALI | (18) |
| Ichinose et
al, 2016 | 275c | 2.1 | 1.3-3.6 | Sex, T factor, N
factor, sublobar resection | (19) |
| Kos et al,
2016 | 146 | NS | Not listed | Age, sex, PS,
stage, histology, treatment | (20) |
| Koma et al,
2013 | 332 | 2.15 | 1.04-4.46 | Stage, PS, other
disease, treatment, albumin, CRP | (21) |
| Warwick et
al, 2014 | 917 | 1.54 | 1.25-1.89 | Age, alcohol
intake, emphysema, squamous carcinoma, predicted postoperative
FEV1, T stage, N stage | (22) |
Surgical resection is considered as the main and
best treatment option for early-stage NSCLC. Sublobar resection was
previously considered as a palliative surgery for high-risk
patients with NSCLC. Several recent studies have demonstrated
comparable recurrence and survival rates between sublobar resection
and lobectomy for early-stage NSCLC, and the optimal strategy for
early-stage NSCLC remains a subject of debate (9,10).
Lobectomy remains the standard choice for NSCLC, and has been shown
to minimize the risk of recurrence and optimize the chances for
long-term survival. However, the overall survival range achieved by
lobectomy is 73-90% (23),
indicating that not all patients can benefit from surgery. Cancer
type, systemic inflammation and abnormal metabolism may be
associated with poor prognosis, even at the same cancer stage.
Cachexia is defined as a complex metabolic syndrome
with progressive weight loss and depletion of host reserves of
adipose tissue and skeletal muscle (24). Cachexia may be clinically associated
with malignancy and is reported to be associated with >20% of
cancer-related fatalities (25).
Inflammation plays a crucial role in the pathogenesis of cachexia,
leading to an imbalance between pro- and anti-inflammatory
cytokines, concomitant body weight loss and sarcopenia. Sarcopenia
is primarily associated with the elderly, and there are
considerable overlaps between cachexia and sarcopenia in
individuals aged ≥66 years (26);
the study by Ichinose et al (19) suggested that older patients had a
worse prognosis.
Cachexia has the following diagnostic criteria:
Weight loss of >5%, or any significant weight loss (>2%) in
the presence of either a low BMI or a low skeletal muscle mass.
Cachexia is considered to consist of a spectrum of abnormalities
that may progress through the following phases: Pre-cachexia,
cachexia and refractory cachexia. Pre-cachexia is a condition with
early clinical and metabolic signs, such as anorexia and
inflammation, but without substantial weight loss. On the other
hand, refractory cachexia may result from advanced cancer, or a
rapidly progressive cancer unresponsive to anticancer treatment.
This is associated with active catabolism and characterized by a
low performance status and a life expectancy of <3 months
(24).
Cachexia may occur in the early stages of cancer,
and even with the same tumor type and burden, variations in
cachexia may be associated with host genotype, cancer stage, as
well as the presence of inflammation and malnutrition (27). Argilés et al (28) reported that 50-80% of patients with
cancer experience cachexia. Pre-cachexia in patients with NSCLC is
associated with a decreased exercise capacity, without changes in
body composition, despite systemic inflammation (29,30).
In addition, anabolic resistance appears early in patients with
cancer and pre-cachexia without any signs of malnutrition (29,30). A
high RDW may reflect the inflammation and malnutrition associated
with cachexia, and may be valuable for detecting early stages of
this condition. One possible explanation for the differences in
survival between patients with high and low RDW may be variations
in the severity of cachexia.
Thus far, inflammation-based prognostic systems,
such as neutrophil-to-lymphocyte ratio, platelet-to-lymphocyte
ratio and Glasgow prognostic score (GPS), have been reported in the
field of clinical oncology (31-33).
The former two are based on two cellular components, whereas the
latter is based on two protein components. None of these indicators
is superior to the others, and each plays a complementary role. GPS
has been shown to predict the source of cachexia, as well as its
prognosis (34). Similar to GPS,
RDW is an indicator that is easy to measure and may be used to
evaluate the degree of cachexia.
The present retrospective study had several
limitations. First, it was conducted by a single institution and,
therefore, it had a high risk of bias in terms of data selection
and analysis. Second, the sample size was relatively small, and
further data accumulation is required. Third, due to the lack of
body weight loss data, we were unable to determine the stage of
cachexia. Further studies are required to investigate body weight
loss. Fourth, the day of blood sample collection differed among
patients. It is possible that variations in RDW were not assessed
during the time period from the day of collection to the day of
surgery. Finally, no repeat measurements of RDW were performed,
which may have led to novel discoveries.
In conclusion, it was herein demonstrated that high
preoperative RDW is an independent prognostic factor for overall
survival in patients with NSCLC. Measuring RDW is simple and
cost-effective. Cachexia may occur at any stage of cancer, mainly
due to inflammation, even when there are no changes in body
composition, and it is also associated with sarcopenia and
malnutrition. Elevated RDW may indicate the degree of cachexia
progression; therefore, it may be useful as a surrogate marker for
predicting the survival of patients with NSCLC undergoing standard
lung lobectomy.
Acknowledgements
Not applicable.
Funding
No funding was received.
Availability of data and materials
The datasets used and/or analyzed during the present
study are available from the corresponding author on reasonable
request.
Authors' contributions
HM wrote the manuscript. HM and YT collected the
data. NM, TU, TS and HH collected important background information,
prepared the preliminary manuscript and helped with preliminary
data collection. TM made substantial contributions to the study
conception and design, and gave final approval for this manuscript
to be published. All the authors have read and approved the final
manuscript.
Ethics approval and consent to
participate
Prior to study initiation, the Research Review Board
of Kansai Medical University Hospital examined and approved the
research protocol (approval no. 2019313). The study was conducted
in accordance with the principles outlined in the Declaration of
Helsinki. The need for patient informed consent was waived,
provided that the patient data were anonymized.
Patient consent for publication
Not applicable.
Competing interests
The authors declare that they have no competing
interests.
References
|
1
|
Walters JG and Garrity PF: RDW-SD and
RDW-CV: Their relationship to RBC distribution curves and
anisocytosis. Sysmex J Int. 3:40–45. 1993.
|
|
2
|
Sultana GS, Haque SA, Sultana T and Ahmed
AN: Value of red cell distribution width (RDW) and RBC indices in
the detection of iron deficiency anemia. Mymensingh Med J.
22:370–376. 2013.PubMed/NCBI
|
|
3
|
Felker GM, Allen LA, Pocock SJ, Shaw LK,
McMurray JJ, Pfeffer MA, Swedberg K, Wang D, Yusuf S, Michelson EL,
et al: Red cell distribution width as a novel prognostic marker in
heart failure: Data from the charm program and the duke databank. J
Am Coll Cardiol. 50:40–47. 2007.PubMed/NCBI View Article : Google Scholar
|
|
4
|
Jo YH, Kim K, Lee JH, Kang C, Kim T, Park
HM, Kang KW, Kim J and Rhee JE: Red cell distribution width is a
prognostic factor in severe sepsis and septic shock. Am J Emerg
Med. 31:545–548. 2013.PubMed/NCBI View Article : Google Scholar
|
|
5
|
Ozsu S, Ozcelik N, Oztuna F and Ozlu T:
Prognostic value of red cell distribution width in patients with
sarcoidosis. Clin Respir J. 9:34–38. 2015.PubMed/NCBI View Article : Google Scholar
|
|
6
|
Bilgin B, Sendur MA, Hizal M, Dede DS,
Akinci MB, Kandil SU, Yaman S, Yalçin A, Kiliç M and Yalçin B:
Prognostic effect of red cell distribution width-to-platelet ratio
in colorectal cancer according to tumor stage and localization. J
Cancer Res Ther. 15:54–60. 2019.PubMed/NCBI View Article : Google Scholar
|
|
7
|
Huang DP, Ma RM and Xiang YQ: Utility of
red cell distribution width as a prognostic factor in young breast
cancer patients. Medicine (Baltimore). 95(e3430)2016.PubMed/NCBI View Article : Google Scholar
|
|
8
|
Wan GX, Chen P, Cai XJ, Li LJ, Yu XJ, Pan
DF, Wang XH, Wang XB and Cao FJ: Elevated red cell distribution
width contributes to a poor prognosis in patients with esophageal
carcinoma. Clin Chim Acta. 452:199–203. 2016.PubMed/NCBI View Article : Google Scholar
|
|
9
|
Winckelmans T, Decaluwé H, De Leyn P and
Van Raemdonck D: Segmentectomy or lobectomy for early-stage
non-small-cell lung cancer: A systematic review and meta-analysis.
Eur J Cardiothorac Surg. 57:1051–1060. 2020.PubMed/NCBI View Article : Google Scholar
|
|
10
|
Ijsseldijk MA, Shoni M, Siegert C, Seegers
J, van Engelenburg AK, Tsai TC, Lebenthal A and Ten Broek RP:
Oncological outcomes of lobar resection, segmentectomy, and wedge
resection for T1a non-small-cell lung carcinoma: A systematic
review and meta-analysis. Semin Thorac Cardiovasc Surg. 32:582–590.
2020.PubMed/NCBI View Article : Google Scholar
|
|
11
|
Brierley JD, Gospodarowicz MK and
Wittekind CH (eds): TNM classification of malignant tumours. 8th
edition. John Wiley & Sons, Chichester, West Sussex, pp106-112,
2017.
|
|
12
|
Travis WD, Brambilla E, Muller-Hermelink
HK and Harris CC: Pathology and genetics of tumours of the lung,
pleura, thymus and heart. In: World Health Organization
Classification of Tumours. Kleihues P and Sobin LH (eds). Lyon,
International Agency for Research on Cancer Press, pp9-124,
2004.
|
|
13
|
Kanda Y: Investigation of the freely
available easy-to-use software ‘EZR' for medical statistics. Bone
Marrow Transplant. 48:452–458. 2013.PubMed/NCBI View Article : Google Scholar
|
|
14
|
Förhécz Z, Gombos T, Borgulya G, Pozsonyi
Z, Prohászka Z and Jánoskuti L: Red cell distribution width in
heart failure: Prediction of clinical events and relationship with
markers of ineffective erythropoiesis, inflammation, renal
function, and nutritional state. Am Heart J. 158:659–666.
2009.PubMed/NCBI View Article : Google Scholar
|
|
15
|
Toyokawa G, Shoji F, Yamazaki K, Shimokawa
M and Takeo S: Significance of the red blood cell distribution
width in resected pathologic stage I nonsmall cell lung cancer.
Semin Thorac Cardiovasc Surg. 32:1036–1045. 2020.PubMed/NCBI View Article : Google Scholar
|
|
16
|
Bozkaya Y, Kurt B and Gürler F: A
prognostic parameter in advanced non-small cell lung cancer: The
ratio of hemoglobin-to-red cell distribution width. Int J Clin
Oncol. 24:798–806. 2019.PubMed/NCBI View Article : Google Scholar
|
|
17
|
Kiriu T, Yamamoto M, Nagano T, Koyama K,
Katsurada M, Tamura D, Nakata K, Tachihara M, Kobayashi K and
Nishimura Y: Prognostic value of red blood cell distribution width
in non-small cell lung cancer treated with anti-programmed cell
death-1 antibody. In Vivo. 33:213–220. 2019.PubMed/NCBI View Article : Google Scholar
|
|
18
|
Kobayashi S, Karube Y, Inoue T, Araki O,
Maeda S, Matsumura Y and Chida M: Advanced lung cancer inflammation
index predicts outcomes of patients with pathological stage IA lung
adenocarcinoma following surgical resection. Ann Thorac Cardiovasc
Surg. 25:87–94. 2019.PubMed/NCBI View Article : Google Scholar
|
|
19
|
Ichinose J, Murakawa T, Kawashima M,
Nagayama K, Nitadori JI, Anraku M and Nakajima J: Prognostic
significance of red cell distribution width in elderly patients
undergoing resection for non-small cell lung cancer. J Thorac Dis.
8:3658–3666. 2016.PubMed/NCBI View Article : Google Scholar
|
|
20
|
Kos M, Hocazade C, Kos FT, Uncu D, Karakas
E, Dogan M, Uncu HG, Ozdemir N and Zengin N: Evaluation of the
effects of red blood cell distribution width on survival in lung
cancer patients. Contemp Oncol (Pozn). 20:153–157. 2016.PubMed/NCBI View Article : Google Scholar
|
|
21
|
Koma Y, Onishi A, Matsuoka H, Oda N,
Yokota N, Matsumoto Y, Koyama M, Okada N, Nakashima N, Masuya D, et
al: Increased red blood cell distribution width associates with
cancer stage and prognosis in patients with lung cancer. PLoS One.
8(e80240)2013.PubMed/NCBI View Article : Google Scholar
|
|
22
|
Warwick R, Mediratta N, Shackcloth M, Shaw
M, McShane J and Poullis M: Preoperative red cell distribution
width in patients undergoing pulmonary resections for
non-small-cell lung cancer. Eur J Cardio Thorac Surg. 45:108–113.
2014.PubMed/NCBI View Article : Google Scholar
|
|
23
|
Goldstraw P, Chansky K, Crowley J,
Rami-Porta R, Asamura H, Eberhardt WE, Nicholson AG, Groome P,
Mitchell A, Bolejack V, et al: The IASLC lung cancer staging
project: Proposals for revision of the TNM stage groupings in the
forthcoming (eighth) edition of the TNM classification for lung
cancer. J Thorac Oncol. 11:39–51. 2016.PubMed/NCBI View Article : Google Scholar
|
|
24
|
Fearon K, Strasser F, Anker SD, Bosaeus I,
Bruera E, Fainsinger RL, Jatoi A, Loprinzi C, MacDonald N,
Mantovani G, et al: Definition and classification of cancer
cachexia: An international consensus. Lancet Oncol. 12:489–495.
2011.PubMed/NCBI View Article : Google Scholar
|
|
25
|
Tisdale MJ: Cachexia in cancer patients.
Nat Rev Cancer. 2:862–871. 2002.PubMed/NCBI View
Article : Google Scholar
|
|
26
|
Cruz-Jentoft AJ, Bahat G, Bauer J, Boirie
Y, Bruyère O, Cederholm T, Cooper C, Landi F, Rolland Y, Sayer AA,
et al: Sarcopenia: Revised European consensus on definition and
diagnosis. Age Ageing. 48(601)2019.PubMed/NCBI View Article : Google Scholar
|
|
27
|
Fearon KC, Glass DJ and Guttridge DC:
Cancer cachexia: Mediators, signaling, and metabolic pathways. Cell
Metab. 16:153–166. 2012.PubMed/NCBI View Article : Google Scholar
|
|
28
|
Argilés JM, Busquets S, Stemmler B and
López-Soriano FJ: Cancer cachexia: Understanding the molecular
basis. Nat Rev Cancer. 14:754–762. 2014.PubMed/NCBI View
Article : Google Scholar
|
|
29
|
Op den Kamp CM, Langen RC, Minnaard R,
Kelders MC, Snepvangers FJ, Hesselink MK, Dingemans AC and Schols
AM: Pre-cachexia in patients with stages I-III non-small cell lung
cancer: Systemic inflammation and functional impairment without
activation of skeletal muscle ubiquitin proteasome system. Lung
Cancer. 76:112–117. 2012.PubMed/NCBI View Article : Google Scholar
|
|
30
|
Deutz NE, Safar A, Schutzler S, Memelink
R, Ferrando A, Spencer H, van Helvoort A and Wolfe RR: Muscle
protein synthesis in cancer patients can be stimulated with a
specially formulated medical food. Clin Nutr. 30:759–768.
2011.PubMed/NCBI View Article : Google Scholar
|
|
31
|
Templeton AJ, McNamara MG, Šeruga B,
Vera-Badillo FE, Aneja P, Ocaña A, Leibowitz-Amit R, Sonpavde G,
Knox JJ, Tran B, et al: Prognostic role of neutrophil-to-lymphocyte
ratio in solid tumors: A systematic review and meta-analysis. J
Natl Cancer Inst. 106(dju124)2014.PubMed/NCBI View Article : Google Scholar
|
|
32
|
Łochowski M, Łochowska B, Zawadzka I,
Cieślik-Wolski B, Kozik D and Kozak J: Prognostic value of
neutrophil-to-lymphocyte, platelet-to-lymphocyte and
lymphocyte-to-monocyte ratio ratios in patients operated on due to
non-small cell lung cancer. J Thorac Dis. 11:3377–3384.
2019.PubMed/NCBI View Article : Google Scholar
|
|
33
|
Forrest LM, McMillan DC, McArdle CS,
Angerson WJ and Dunlop DJ: Evaluation of cumulative prognostic
scores based on the systemic inflammatory response in patients with
inoperable non-small-cell lung cancer. Br J Cancer. 89:1028–1030.
2003.PubMed/NCBI View Article : Google Scholar
|
|
34
|
McMillan DC: Systemic inflammation,
nutritional status and survival in patients with cancer. Curr Opin
Clin Nutr Metab Care. 12:223–226. 2009.PubMed/NCBI View Article : Google Scholar
|