Introduction
Neuroblastoma (NB) is the most common extracranial
solid tumor in children and accounts for approximately 15% of
pediatric cancer-associated deaths. It is characterized by extreme
heterogeneity, ranging from spontaneous regression to malignant
progression (1,2). Although low- and intermediate-risk NB
patients are successfully treated with >90% long-term event-free
survival rates, more than half of high-risk NB patients have
experienced tumor relapse/regrowth and progression with a long-term
survival rate of 40-50% (3,4). Patients with high-risk disease account
for approximately half of newly diagnosed cases and are treated by
the standard regimen consisting of induction chemotherapy,
high-dose chemotherapy with autologous stem cell rescue, surgery,
radiotherapy, and immunotherapy (5,6).
Despite these intensive multimodal therapies, as many as 20% of
high-risk patients have residual disease that is refractory or
progressive during induction chemotherapy (7,8). The
rest of the high-risk patients usually achieve remission, but the
larger part of those patients has minimal residual disease (MRD)
that causes relapse/regrowth and progression after completion of
the standard regimen (9). Patients
with relapse/regrowth are rarely cured, with <10% long-term
survival (10).
Vanillylmandelic acid (VMA) and homovanillic acid
(HVA) levels in urine and neuron-specific enolase (NSE) and lactate
dehydrogenase (LDH) levels in serum are classic tumor markers of NB
(11). To date, NB has been
diagnosed by elevated catecholamine metabolites (VMA and HVA),
histopathology, and extensive imaging (12,13).
The International Neuroblastoma Staging System (INSS) also
considered conventional serum markers (NSE and LDH) as an optional
aid due to their limited diagnostic sensitivity and specificity
(13). Although tumor markers (VMA,
HVA, NSE, and LDH) were well characterized at initial diagnosis and
during response assessment, their prognostic value in predicting
tumor relapse/regrowth and progression was far from optimal
(14). Indeed, the International
Neuroblastoma Risk Group (INRG) classification system and the
International Neuroblastoma Response Criteria (INRC) considered no
tumor markers as diagnostically sensitive/specific enough to be
incorporated as risk factors or response criteria, respectively
(15,16). Despite these limitations, tumor
markers are widely used as standard clinical evaluations for NB
patients in current clinical practice.
To achieve optimal outcomes for high-risk NB
patients, an accurate evaluation of MRD is essential to monitor the
disease burden and treatment response. An increasing number of MRD
assays using different methods and samples has been reported. For
instance, immunophenotyping with flow cytometry (FCM) and detection
of DNA methylation were applied to detect MRD in NB patients. NB
patients with NB84+/CD56+/CD45- or
GD2+/CD81+/CD56+/CD45-
cells in BM samples had significantly poor outcomes compared to NB
patients without NB84+/CD56+/CD45-
or
GD2+/CD81+/CD56+/CD45-
cells in BM samples (17,18). DNA methylation of the tumor
suppressor RASSF1A was reported to be a highly specific DNA marker
for MRD detection and is better suited for MRD quantification in BM
samples (19). However, MRD in NB
patients was most commonly identified by detecting
neuroblastoma-associated mRNAs (NB-mRNAs) by quantitative PCR
(qPCR) due to the absence of recurrent oncogenic-fusion genes in NB
cells (20,21). Whereas single NB-mRNA (TH or PHOX2B
mRNA) was initially evaluated in BM and PB samples (22-24),
multiple NB-mRNAs were later used to achieve more sensitive MRD
detection. Several sets of NB-mRNAs have been reported to have
significant prognostic value for NB patients (25-28).
However, these sets used considerably different NB-mRNAs and
resulted in a significant but limited prognostic power with low
accuracy (0.5 < area under curve (AUC) <0.7) (28,29).
We initially validated 14 NB-mRNAs (included in all multiple marker
sets of NB-mRNAs) and selected 11 NB-mRNAs based on their
expression in spheres of NB cells by qPCR, which enabled the early
detection of relapse/regrowth in two high-risk NB cases (30,31).
We then developed a new MRD assay that quantified 7NB-mRNAs (CRMP1,
DBH, DDC, GAP43, ISL1, PHOX2B, and TH mRNAs) using droplet digital
PCR (ddPCR). This ddPCR-based MRD assay outperformed the qPCR-based
MRD assay, and the level of 7NB-mRNAs in BM predicted tumor
relapse/regrowth with moderate accuracy (0.7 < AUC <0.9)
(32).
Although MRD in BM and PB (BM-MRD and PB-MRD) has
been shown to be a strong prognostic factor independent of standard
clinical evaluations (28), its
interrelation with tumor markers remains uncharacterized. In the
present study, we determined the levels of tumor markers (VMA, HVA,
NSE and LDH) and MRD (BM-MRD and PB-MRD) in 133 pairs of
concurrently collected BM, PB, and urine samples from 19 high-risk
NB patients during the entire course of treatment, and examined
their interrelation in overall sample pairs and subgroups of sample
pairs.
Patients and methods
NB patients and samples
Nineteen high-risk NB patients defined by the
Children's Oncology Group (COG) Neuroblastoma Risk Stratification
System (2,33) or the INRG Classification System
(15) were included in this study.
All patients were diagnosed and treated at Kobe Children's Hospital
or Kobe University Hospital between June 2011 and January 2018
based on the JN-H-11 (UMIN000005045) or JN-H-15 (UMIN000016848)
protocol of the Japanese Children's Cancer Group (JCCG)
Neuroblastoma Committee (JNBSG). All BM, PB, and urine samples were
collected concurrently (<7 days apart) as frequently as possible
during the entire course of treatment. This study was approved by
the Ethics Committee of Kobe University Graduate School of Medicine
and Kobe Children's Hospital and was conducted in accordance with
the guidelines for Clinical Research of Kobe University Graduate
School of Medicine. Written informed consent was obtained from all
patients.
Disease evaluation
Disease evaluation was conducted as described
previously (32). Briefly,
evaluation was conducted at every collection time point in
accordance with the INRC based on the available medical records
(13,34). Responses were assigned to
‘remission’ corresponding to complete response (CR) or very good
partial response (VGPR), ‘stable’ corresponding to partial response
(PR), mixed response (MR), or no response (NR), or ‘progression’
corresponding to progressive disease (PD) for all BM, PB, and urine
sample pairs.
Tumor marker
Tumor marker data (VMA and HVA in urine, NSE, and
LDH in serum) were extracted from the medical records. All patients
were subjected to a food/drink restriction (bananas, citrus fruits,
coffee, vanilla-containing confectionery, and salicylic acid
preparations are on the list) for urine sample collection. A spot
urine sample in the early morning was used to measure VMA and HVA.
Normal reference ranges of VMA, HVA, NSE, and LDH were 1.2-4.9
µg/mg creatinine, 1.6-5.5 µg/mg creatinine, 0-16.3 ng/ml, and
124-270 IU/l for most children, respectively.
MRD in BM and PB
BM and PB sample preparation and 7NB-mRNA ddPCR
assays were performed as described previously (32). Briefly, all BM and PB samples were
separated using Mono-Poly resolving medium (DS Pharma Biomedical),
and nucleated cells were collected. Total RNA was extracted with a
TRIzol Plus RNA purification kit (Life Technologies; Thermo Fisher
Scientific, Inc.). cDNA was synthesized from 1 or 0.5 µg total RNA
using a Quantitect reverse transcription kit (Qiagen GmbH) and
stored at -80˚C until use. The 7NB-mRNA ddPCR assay measured the
expression of 7NB-mRNAs (CRMP1, DBH, DDC, GAP43, ISL1, PHOX2B, and
TH mRNA) and a reference gene mRNA (HPRT1 mRNA) with optimized
probe and primer sets, cDNA, and standard thermal cycling
conditions using a QX200 ddPCR system (Bio-Rad Laboratories, Inc.)
according to the digital Minimum Information for Publication of
Quantitative Digital PCR Experiments guidelines (35,36).
The level of 7NB-mRNAs (combined signature) was defined as the
weighted sum of 7 relative copy numbers (level of each NB-mRNA), in
which the reciprocal of the 90th percentile in non-NB control
samples was used for the weighting for each NB-mRNA. For BM
samples, the level of 7NB-mRNAs was calculated as the mean of the
right and left samples.
Statistical analysis
Correlation between the level of 7NB-mRNAs in BM and
PB samples and the levels of VMA, HVA, NSE, and LDH in urine and PB
samples was assessed using Spearman's rank correlation test.
Reported P-values are two-sided, and P<0.05 was considered
statistically significant. Correlation coefficient r values were
interpreted as follows: 0.00-0.09 as ‘negligible’, 0.10-0.39 as
‘weak’, 0.40-0.69 as ‘moderate’, 0.70-0.89 as ‘strong’, and
0.90-1.00 as ‘very strong’ according to a previous report (37). EZR (version 1.35, www.jichi.ac.jp/saitama-sct/SaitamaHP.files/statmedEN.html;
Saitama Medical Center, Jichi Medical University, Saitama, Japan),
which is a modified version of R commander designed to add
statistical functions that is frequently used in biostatistics
(38) was used for statistical
analyses.
Results
Characteristics of BM, PB, and urine
sample pairs
A total of 133 BM, PB, and urine sample pairs
collected concurrently (<7 days apart) from 19 high-risk NB
patients were enrolled in the present study. As summarized in
Table I, all sample pairs were
subdivided into subgroups according to each sample or patient
evaluation. For each sample evaluation, all BM samples were
pathologically analyzed by histology/immunohistochemistry (IHC) of
biopsies or cytology/immunocytology (IC) of aspirates according to
the INRC recommendations (34).
Consequently, BM infiltration at sampling was present in 21 samples
and absent in 112 samples. Sample pairs were drawn as frequently as
possible during the entire course of high-risk NB treatment, and
the collection time points were defined as ‘diagnosis’ at initial
diagnosis, ‘treatment’ including induction chemotherapy, high-dose
chemotherapy with autologous peripheral blood stem cell
transplantation (PBSCT), surgery, and radiation, ‘post-treatment’
including 13-cis-retinoic acid (13-cis-RA) treatment
and follow-up before relapse, ‘relapse’ at relapse diagnosis, and
‘post-relapse’ including all treatments and follow-up after
relapse. Consequently, samples were subdivided into 10 diagnosis,
32 treatment, 36 post-treatment, 9 relapse, and 46 post-relapse
samples. Disease status at sampling was retrospectively evaluated
as remission, stable and and progression. Consequently, samples
were subdivided into 21 remission, 87 stable, and 25 progression
samples (Table I). For each patient
evaluation, all sample pairs were subdivided according to the
following prognostic factors: Age at diagnosis, primary tumor site,
BM metastasis at diagnosis, DNA ploidy, MYCN status,
relapse/regrowth, and recurrent tumor site. Consequently, 80%
(107/133) were derived from ≥18 month old patients, 80% (106/133)
from patients with an adrenal grand tumor, 92% (122/133) from
patients with BM metastasis at diagnosis, 70% (93/126) from
patients with diploid tumors, 34% (45/133) from patients with
MYCN-amplified tumors, 68% (90/133) from patients with
relapse/regrowth, and 39% (35/90) from CNS-relapse/regrowth
patients (Table I).
 | Table IPatient and sample
characteristics. |
Table I
Patient and sample
characteristics.
| Variable | Patients, n
(%) | Samples, n (%) |
|---|
| BM infiltration at
samplinga | | |
|
Present | 10 | 21(16) |
|
Absent | 16 | 112(84) |
| Collection time
point of samplea | | |
|
Diagnosis | 10 | 10(7) |
|
Treatment | 9 | 32(24) |
|
Post-treatment | 10 | 36(27) |
|
Relapse | 8 | 9(7) |
|
Post-relapse | 9 | 46(35) |
| Disease status of
samplea | | |
|
Remission | 6 | 21(16) |
|
Stable | 13 | 87(65) |
|
Progression | 13 | 25(19) |
| Sexb | | |
|
Male | 13(68) | 87 |
|
Female | 6(32) | 46 |
| Age at
diagnosisb | | |
|
<18
months | 3(16) | 26 |
|
≥18
months | 16(84) | 107 |
| Primary tumor
siteb | | |
|
Adrenal
gland | 14(74) | 106 |
|
Non-adrenal
gland | 5(26) | 27 |
| BM metastasis at
diagnosisb | | |
|
Present | 16(84) | 122 |
|
Absent | 3(16) | 11 |
|
Histopathologyb | | |
|
Favorable | 0 (0) | 0 |
|
Unfavorable | 19(100) | 133 |
| DNA
ploidyb | | |
|
Diploid | 14(74) | 93 |
|
Hyperdiploid | 3(16) | 33 |
|
Unknown | 2(10) | 10 |
| MYCN
statusb | | |
|
Amplified | 7(37) | 45 |
|
Non-amplified | 12(63) | 88 |
|
Relapse/regrowthb | | |
|
Present | 11(58) | 90 |
|
Absent | 8(42) | 43 |
| Recurrent tumor
siteb | | |
|
CNS | 4(36) | 35 |
|
Non-CNS | 7(64) | 55 |
Correlations between tumor markers and
MRD in overall sample pairs
We first analyzed the correlations of tumor markers
(VMA, HVA, NSE, and LDH) with MRD (BM-MRD and PB-MRD) in 133
overall sample pairs. VMA (3.3-308.3, median 10.0 µg/mg
creatinine), HVA (6.2-575.8, median 19.5 µg/mg creatinine), NSE
(8.2-2,510.0, median 21.6 ng/ml), and LDH (128-5,567, median 274
IU/l) showed weak but significant correlations with both BM-MRD
(0.1-22, 630.8, median 3.2 copies) and PB-MRD (0.1-284.5, median
5.9 copies). Very similar degrees of correlation (r=0.221-0.355,
P<0.03) were detected among different combinations of tumor
markers (VMA, HVA, NSE, and LDH) and MRD (BM-MRD and PB-MRD)
(Fig. 1).
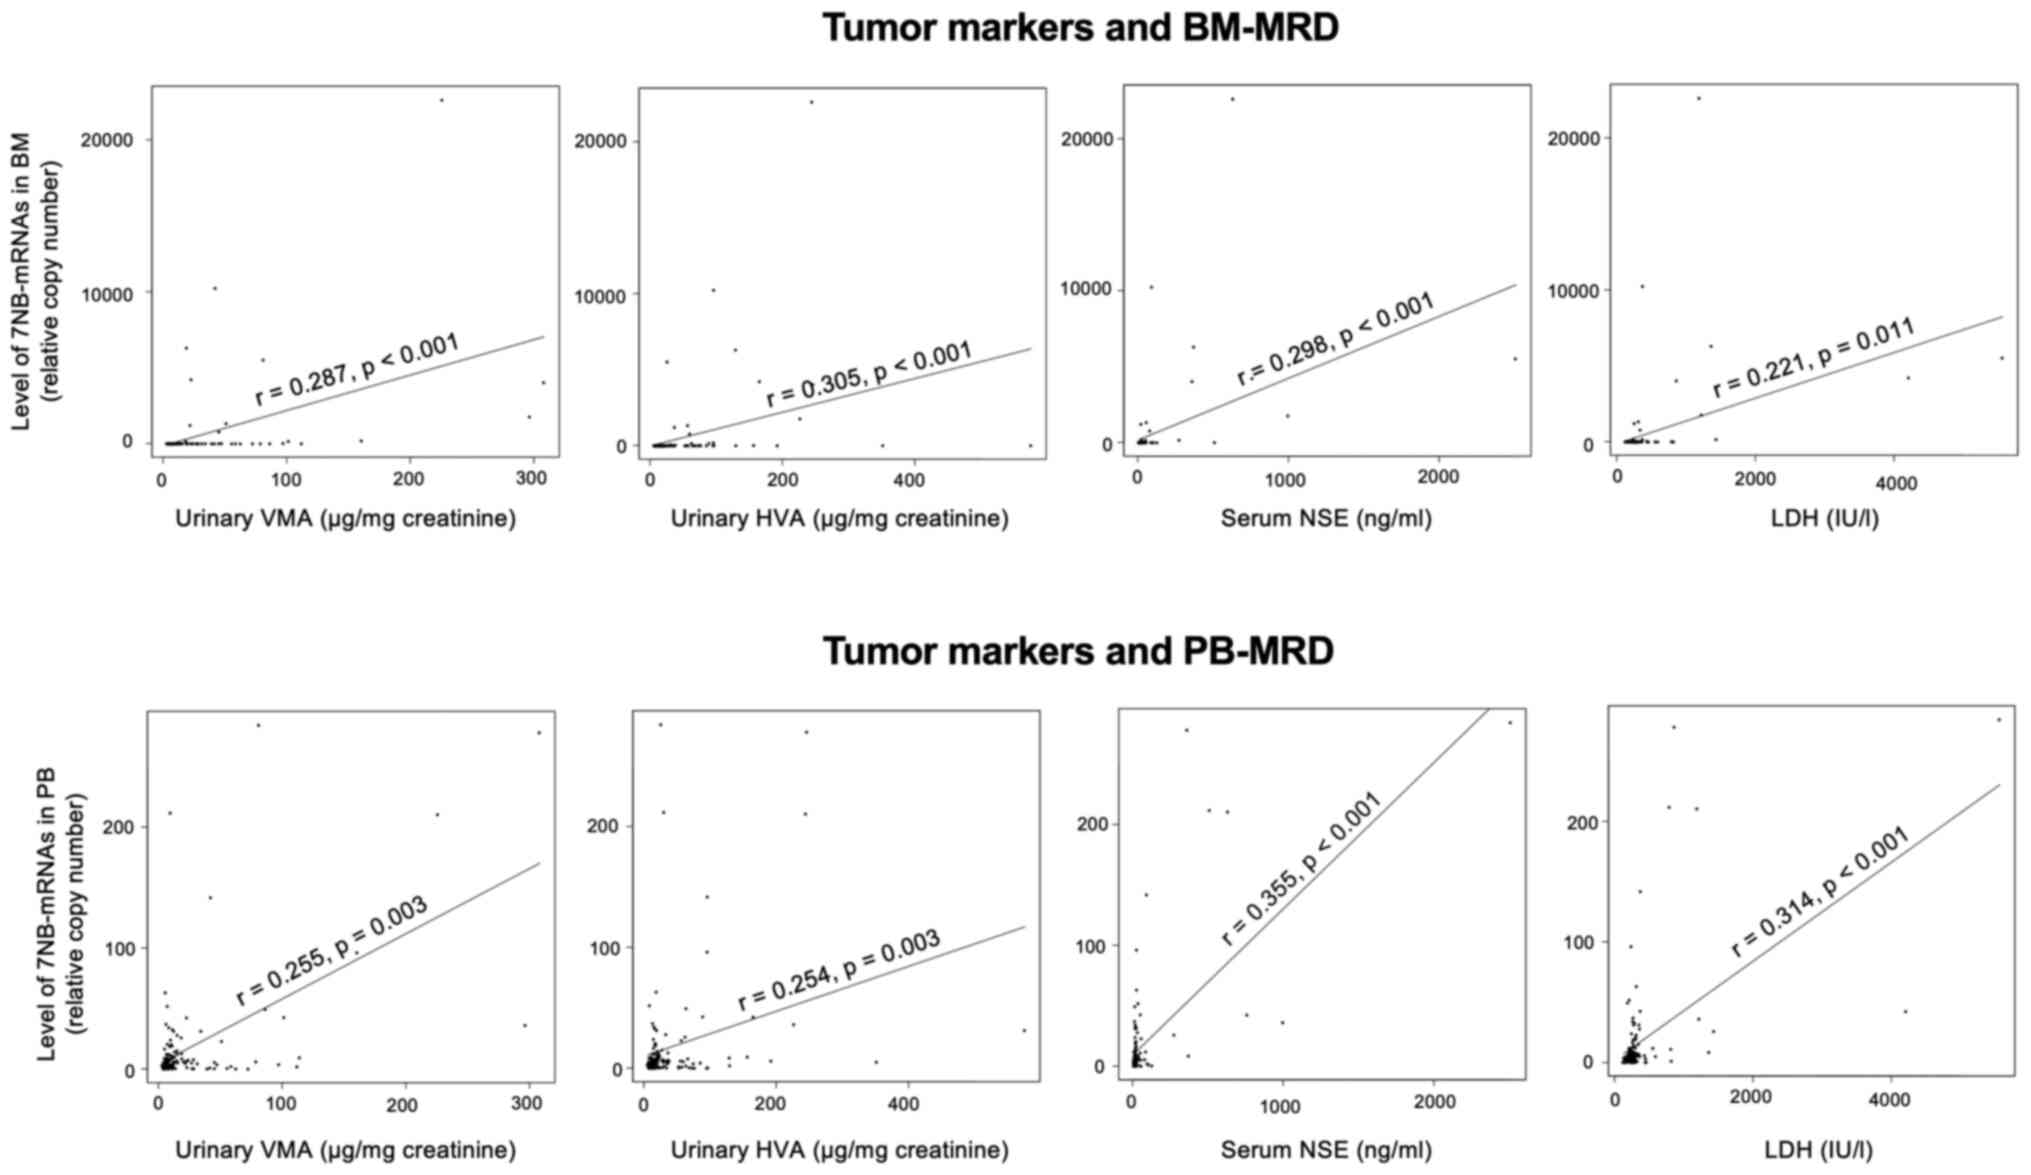 | Figure 1Correlations between tumor markers
and MRD in overall sample pairs. The levels of 7 neuroblastoma-mRNA
(relative copy number) were determined by droplet digital
polymerase chain reaction and its correlations with the levels of
VMA (µg/mg creatinine), HVA (µg/mg creatinine), NSE (ng/ml) and LDH
(IU/l) were assessed by Spearman's rank correlation coefficient in
133 pairs of concurrently collected BM, PB and urine samples. MRD,
minimal residual disease; VMA, vanillylmandelic acid; HVA,
homovanillic acid; NSE, neuron-specific enolase; LDH, lactate
dehydrogenase; BM, bone marrow; PB, peripheral blood. |
Correlations between tumor markers and
MRD in subgroups according to each patient's evaluation
To characterize the observed correlations between
tumor markers (VMA, HVA, NSE, and LDH) and MRD (BM-MRD and PB-MRD)
in overall sample pairs, we then analyzed them in subgroups
according to each patient's evaluation: Age at diagnosis, primary
tumor site, BM metastasis at diagnosis, DNA ploidy, MYCN status,
relapse/regrowth, and recurrent tumor site (Table I). Among these evaluations, primary
tumor site, BM metastasis at diagnosis, and relapse/regrowth showed
a constant impact on the degrees of correlations between tumor
markers (VMA, HVA, NSE, and LDH) and MRD (BM-MRD and PB-MRD). In
subgroups of patients with adrenal gland tumors, the correlations
of VMA, HVA, NSE, and LDH with BM-MRD became stronger than the
overall sample pairs. The same was true for PB-MRD. The
correlations of tumor markers (VMA, HVA, NSE, and LDH) with MRD
(BM-MRD and PB-MRD) also became stronger than the overall sample
pairs in subgroups of patients with BM metastasis at diagnosis and
with relapse/regrowth. In contrast, tumor markers did not show
statistically significant correlations with MRD in subgroups of
patients without adrenal gland tumors, BM metastasis at diagnosis,
and in patients without relapse/regrowth (Fig. 2).
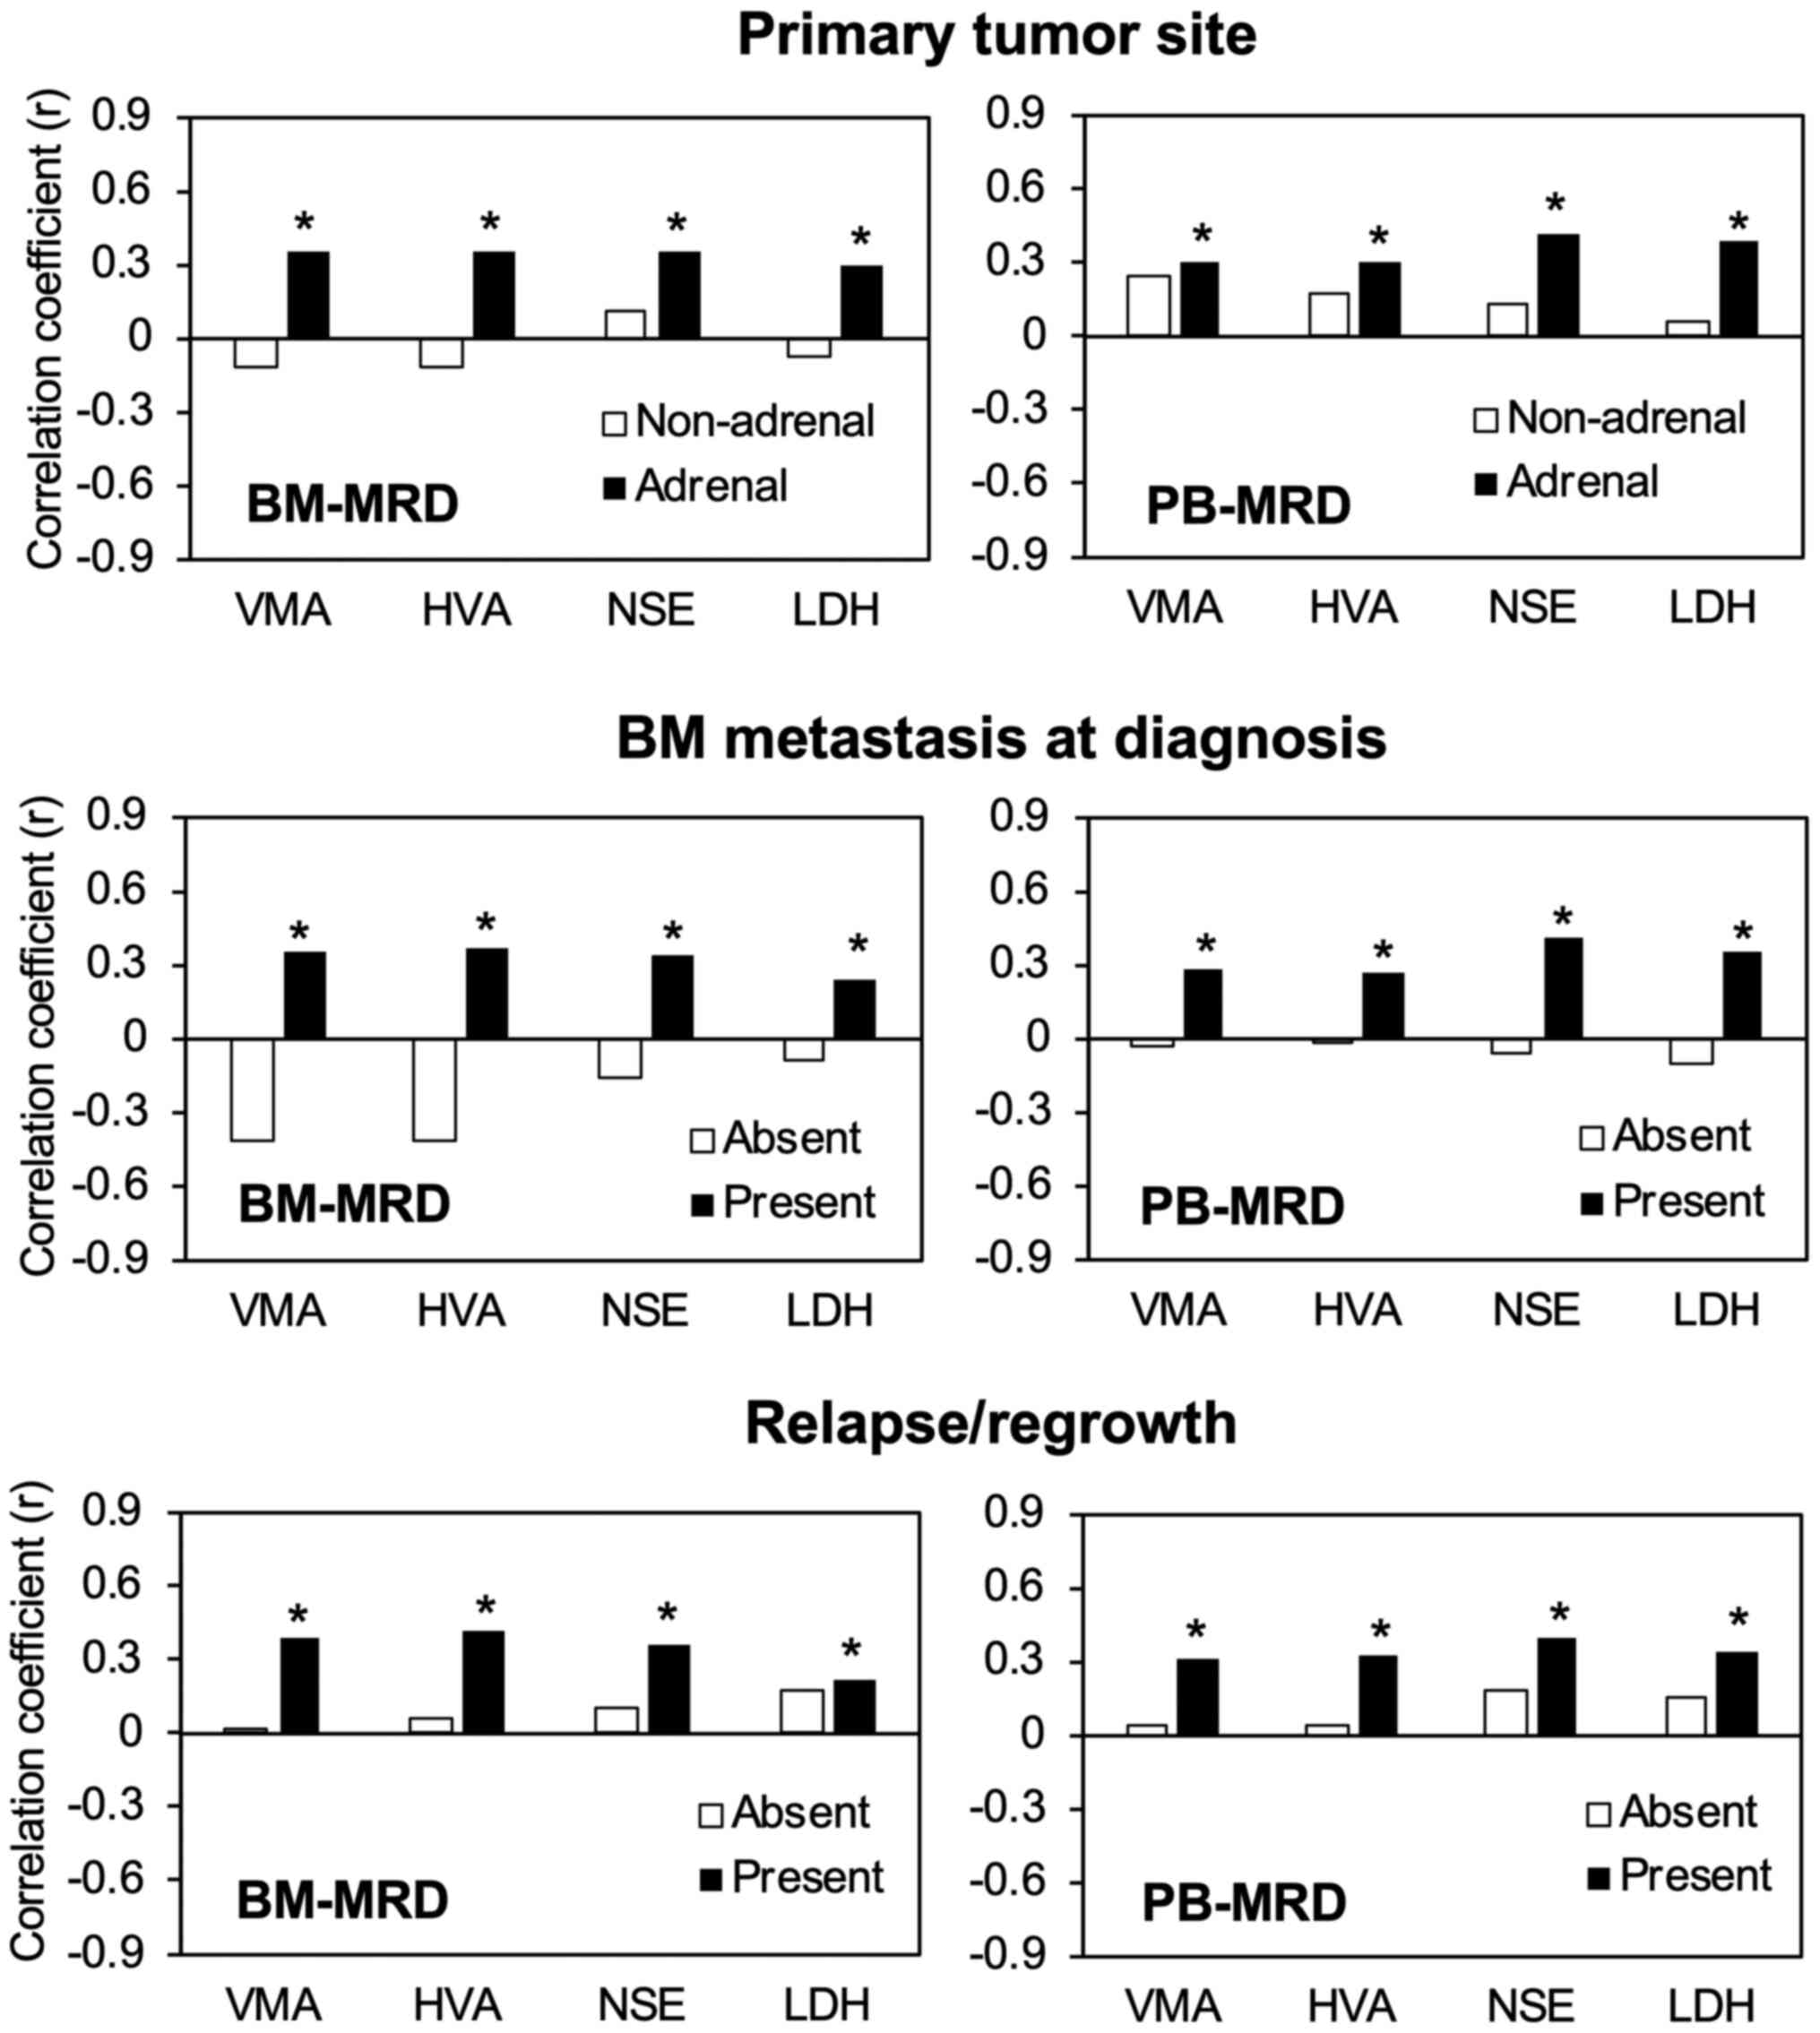 | Figure 2Correlations between tumor markers
and MRD in subgroups of sample pairs according to each patient
evaluation. Levels of 7 neuroblastoma-mRNA (relative copy number)
were determined by droplet digital polymerase chain reaction and
its correlations with the levels of VMA (µg/mg creatinine), HVA
(µg/mg creatinine), NSE (ng/ml) and LDH (IU/l) were assessed by
Spearman's rank correlation coefficient in subgroups of
concurrently collected BM, PB and urine sample pairs: Primary tumor
site (non-adrenal, 27 pairs; adrenal, 106 pairs), BM metastasis at
diagnosis (absent, 11 pairs; present, 122 pairs) and
relapse/regrowth (absent, 43 pairs; present, 90 pairs).
*P<0.05 (significant correlation). MRD, minimal
residual disease; VMA, vanillylmandelic acid; HVA, homovanillic
acid; NSE, neuron-specific enolase; LDH, lactate dehydrogenase; BM,
bone marrow; PB, peripheral blood. |
Correlations between tumor markers and
MRD in subgroups according to each sample evaluation
Next, we analyzed the correlations between tumor
markers (VMA, HVA, NSE, and LDH) and MRD (BM-MRD and PB-MRD) in
subgroups according to each sample evaluation: BM infiltration at
sampling, collection time point, and disease status (Table I). In subgroups according to BM
infiltration at sampling, the correlation became moderate or strong
(r=0.49-0.821, P<0.026) in the positive subgroup and
non-significant in the negative subgroup, except for a weak
correlation (r=0.228, P=0.016) between NSE and PB-MRD in the
negative subgroup. In subgroups according to the collection time
point, the correlations between tumor markers (VMA, HVA, NSE, and
LDH) and MRD (BM-MRD and PB-MRD) varied considerably in the
diagnosis, treatment, post-treatment, relapse, and post-relapse
subgroups. In subgroups according to disease status, the
correlations between tumor markers (VMA, HVA, NSE, and LDH) and MRD
(BM-MRD and PB-MRD) also varied substantially in the remission,
stable, and progression subgroups (Fig.
3).
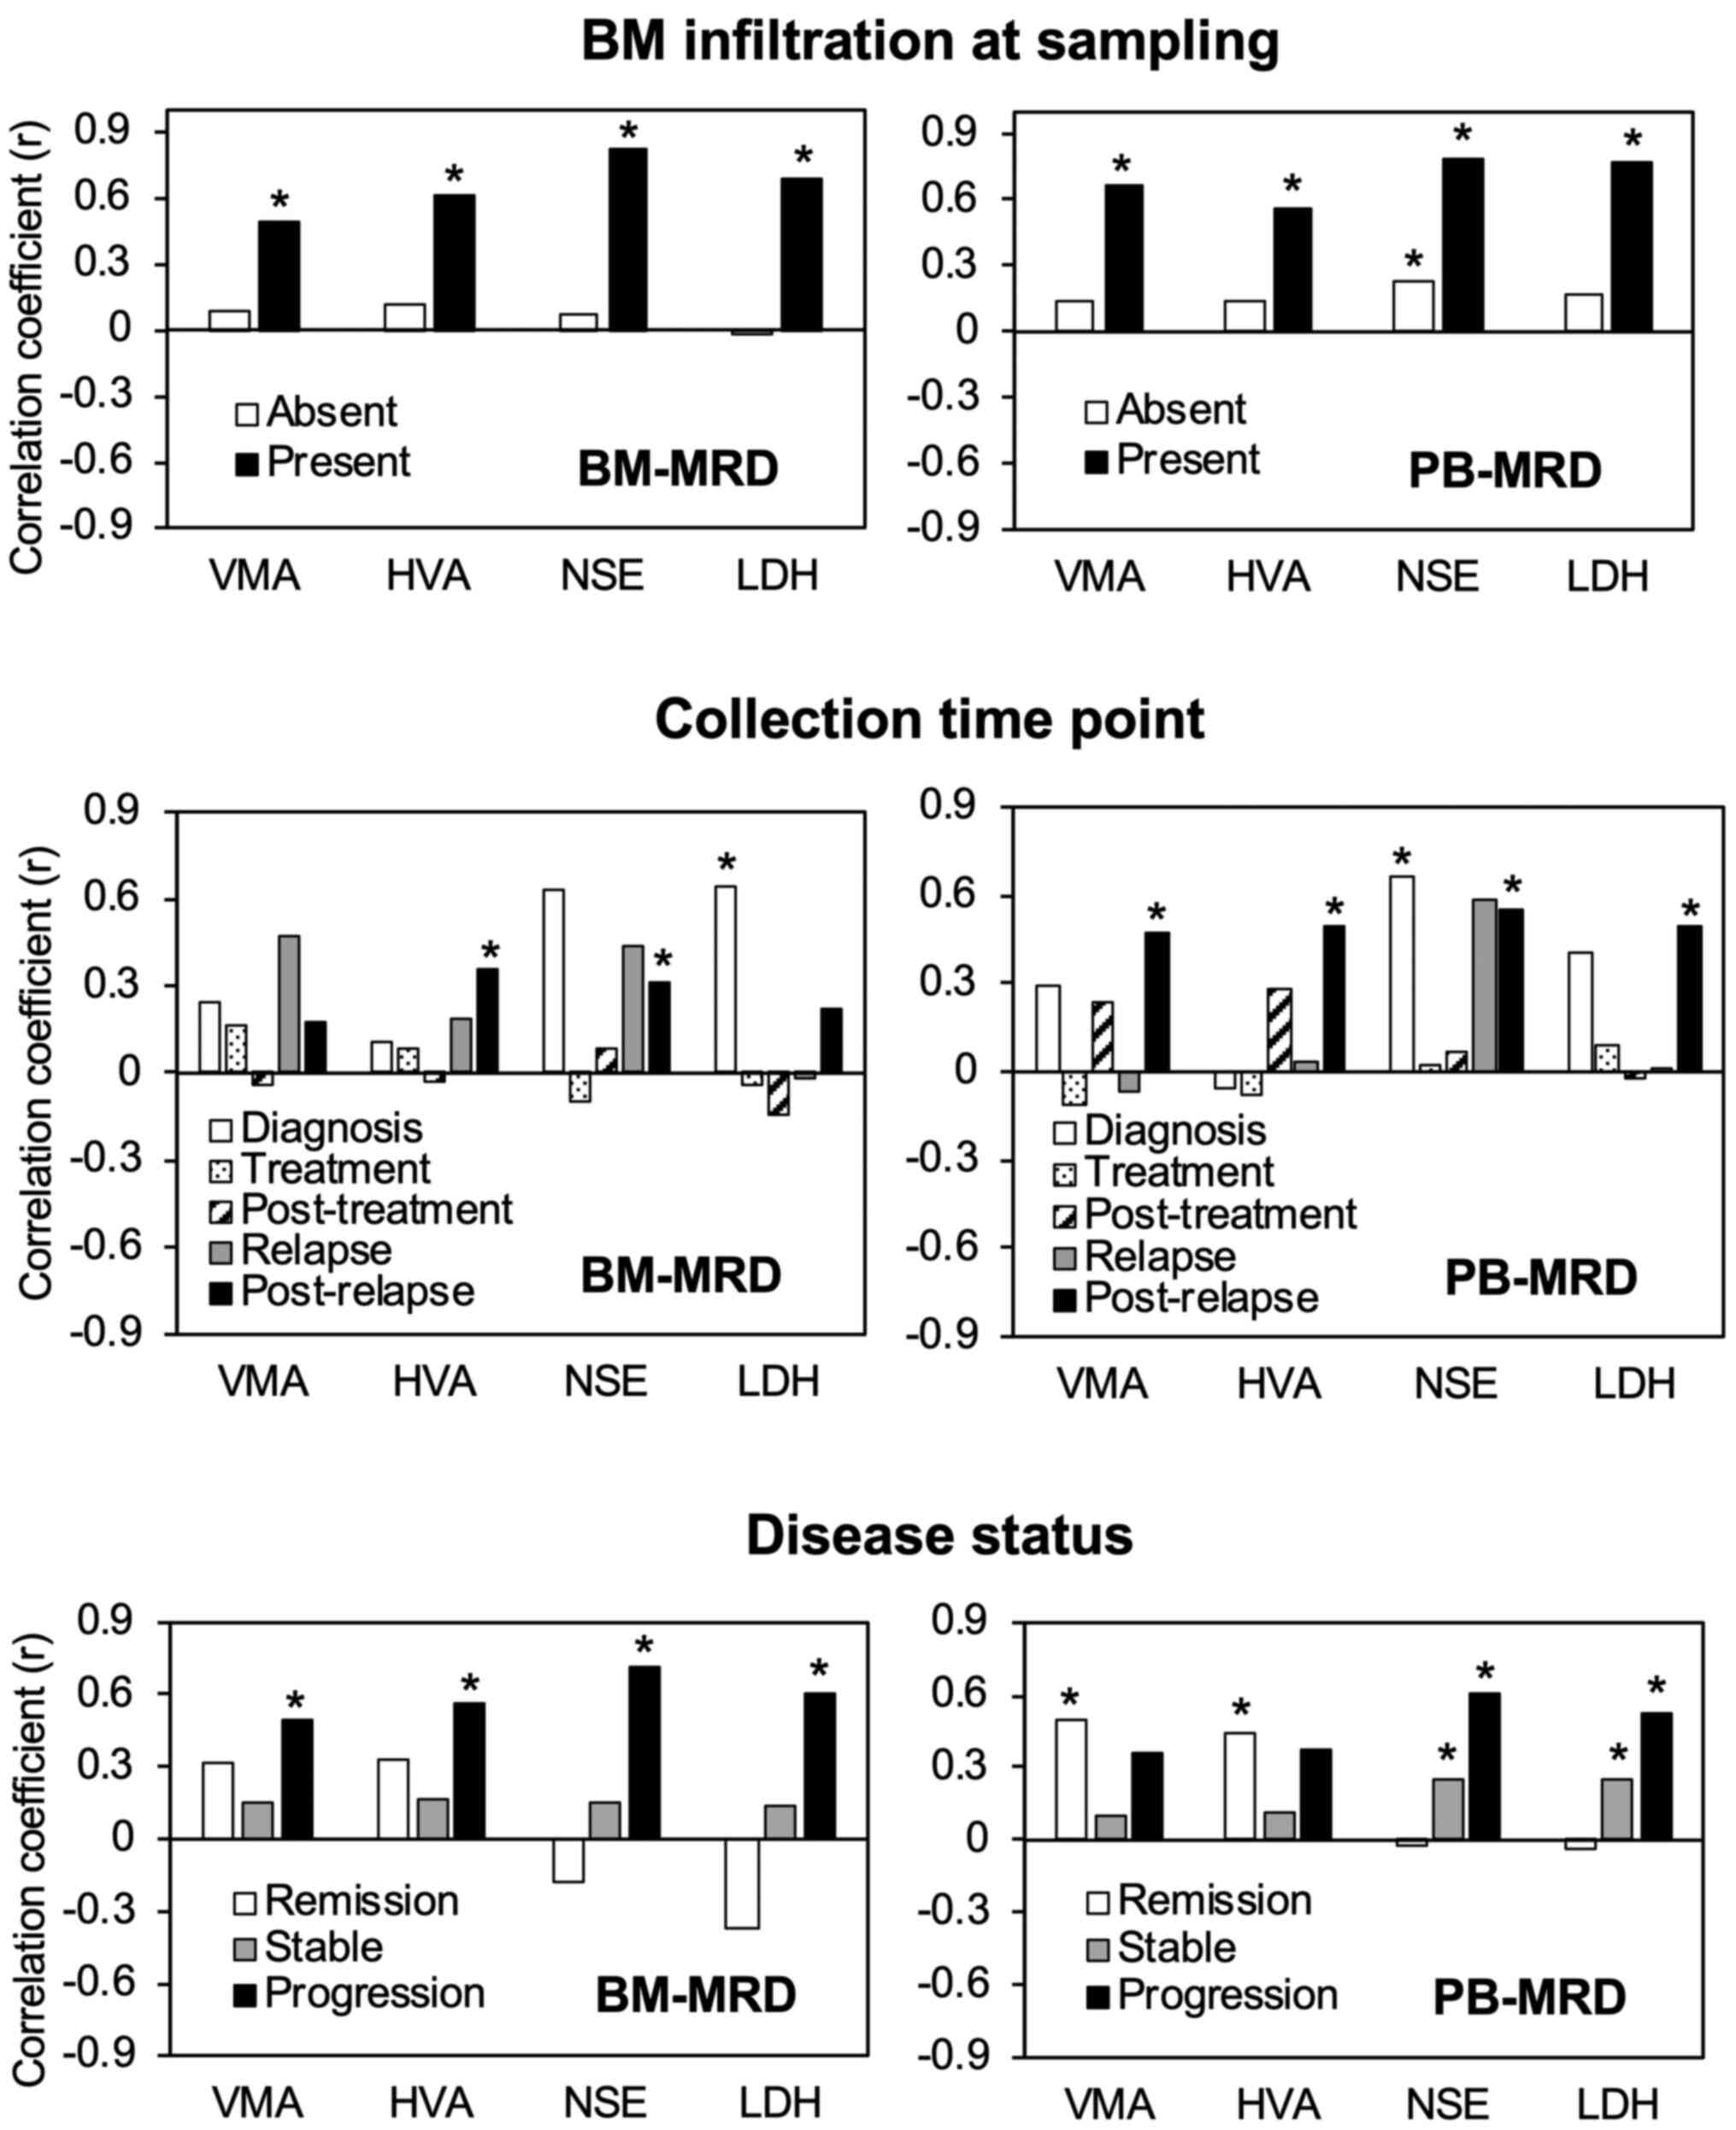 | Figure 3Correlations between tumor markers
and MRD in subgroups of sample pairs according to each sample
evaluation. Correlations between tumor markers and MRD in subgroups
of sample pairs according to each patient evaluation. Levels of 7
neuroblastoma-mRNA (relative copy number) were determined by
droplet digital polymerase chain reaction and its correlations with
the levels of VMA (µg/mg creatinine), HVA (µg/mg creatinine), NSE
(ng/ml) and LDH (IU/l) were assessed by Spearman's rank correlation
coefficient in subgroups of concurrently collected BM, PB and urine
sample pairs: BM infiltration at sampling (absent, 112 pairs;
present, 21 pairs), collection time point (diagnosis, 10 pairs;
treatment, 32 pairs; post-treatment, 36 pairs; relapse, 9 pairs;
post-relapse, 46 pairs) and disease status (remission, 21 pairs;
stable, 87 pairs; progression, 25 pairs). *P<0.05
(significant correlation). MRD, minimal residual disease; VMA,
vanillylmandelic acid; HVA, homovanillic acid; NSE, neuron-specific
enolase; LDH, lactate dehydrogenase; BM, bone marrow; PB,
peripheral blood. |
Discussion
In the present study, we determined the levels of
tumor markers (VMA, HVA, NSE, and LDH) and MRD (BM-MRD and PB-MRD)
in 133 pairs of concurrently collected BM, PB, and urine samples
from 19 high-risk NB patients during the entire course of
treatment. Representative data obtained from a typical relapsed NB
patient were presented in Fig. S1.
To avoid multiple testing, we designed the present study as a
descriptive study that did not set an endpoint for the correlation
between tumor markers and MRD, and showed that tumor markers had
limited correlations with MRD in high-risk NB patients. The
correlation was weak but significant in overall sample pairs and
was more constantly affected by patient factors (primary tumor
site, BM metastasis at diagnosis, and relapse/regrowth) than sample
factors (BM infiltration at sampling, disease status, and
collection time point).
VMA, HVA, NSE, and LDH are currently used as
standard clinical evaluations of NB despite their limitations in
diagnostic sensitivity/specificity for risk factors/response
criteria (15,16,39).
MRD (BM-MRD and PB-MRD) can be monitored by quantifying 7NB-mRNAs
(CRMP1, DBH, DDC, GAP43, ISL1, PHOX2B, and TH mRNA) using ddPCR
(32). Among the four tumor markers
and seven NB-mRNAs, two tumor markers (VMA and HVA) are
catecholamine metabolites and three NB-mRNAs (DBH, DDC, and TH
mRNA) are the transcripts of catecholamine biosynthetic enzymes.
Elevated levels of tumor markers (VMA, HVA, NSE, and LDH) and MRD
(BM-MRD and PB-MRD) are associated with the existence and/or
increase of tumor burden (9,11).
Although MRD has been shown to be a strong prognostic factor
independent of standard clinical evaluations (28), the interrelation of MRD (BM-MRD and
PB-MRD) with tumor markers (VMA, HVA, NSE, and LDH) has never been
characterized during the course of treatment in high-risk NB
patients. The present results revealed that tumor markers showed a
weak but significant correlation with MRD in overall sample pairs,
including all stages of high-risk NB treatment (Fig. 1). While the level of PB-MRD was
substantially lower than that of BM-MRD (28,32),
the levels of BM-MRD and PB-MRD were equally correlated with tumor
markers in urine (VMA and HVA) and PB (NSE and LDH) (BM-MRD:
r=0.221-0.305, P<0.01, PB-MRD: r=0.254-0.355, P<0.03).
The most striking result of the present study was a
constant impact of patient factors on the degree of interrelation
between tumor markers (VMA, HVA, NSE, and LDH) and MRD (BM-MRD and
PB-MRD) (Fig. 2). As each patient
had 1-19 sample pairs (12 patients had >6 sample pairs) to be
analyzed, subgroups of sample pairs were generated according to the
following patient factors: Primary tumor site, BM metastasis at
diagnosis, relapse/regrowth, age at diagnosis, DNA ploidy, MYCN
status, and the recurrent tumor site (Figs. 2 and S2). Among these patient factors, three
(primary tumor site, BM metastasis at diagnosis, and
relapse/regrowth) had a constant impact on the degree of
correlation between tumor markers and MRD (Figs. 2 and S2). In contrast, a variable impact of
sample factors (BM infiltration at sampling, disease status, and
collection time point) was found in the present study (Fig. 3). Since the existence and/or
increase of tumor burden has been shown to be associated with
elevated levels of both tumor markers and MRD, it is naturally
assumed that their association would be influenced by their levels.
However, disease status and collection time point did not have a
constant impact on their correlation, although BM infiltration at
sampling had a considerable impact. Taken together, patient factors
intrinsic to patients/tumors rather than sample factors
representing the status at sampling might be involved in the
interrelation between tumor markers and MRD in high-risk NB
patients.
However, there were limitations to this study. The
small number of patients and samples is a limitation of this study.
Another limitation is that a part of patient factors (age at
diagnosis, DNA ploidy, MYCN status, and recurrent tumor site) show
variable impacts on the correlations between tumor markers (VMA,
HVA, NSE, and LDH) and MRD (BM-MRD and PB-MRD). The reason for the
different impacts of patient factors is not clear at present; thus,
further studies are required.
In summary, there are limited correlations between
tumor markers (VMA, HVA, NSE, and LDH) and MRD (BM-MRD and PB-MRD)
in high-risk NB patients. Although the interrelations between tumor
markers and MRD vary substantially among subgroups of sample pairs,
the interrelations are more constantly affected by patient factors
rather than sample factors. Prospective studies with
scheduled/pre-determined sample collection time points, clinical
studies with uniform treatment strategies, and studies with a
larger numbers of NB patients and samples, ensuring minimal bias,
are required to validate the present results.
Supplementary Material
Levels of VMA, HVA, NSE, LDH, PB-MRD
and BM-MRD in a relapsed NB case. A 25-month old male with an
adrenal tumor was diagnosed with stage 4, MYCN non-amplified,
high-risk NB and was treated with the standard regimen (JNBSG
JN-H-11 protocol; UMIN000005045) consisting of induction
chemotherapy, high-dose chemotherapy with autologous stem cell
rescue, surgery, and radiotherapy. At 61 weeks following diagnosis,
a new tumor mass had emerged in the brain and BM cytology revealed
NB cells. He was clinically diagnosed with tumor relapse and was
treated by salvage chemotherapy and high-dose chemotherapy with
allogenic stem cell rescue. During the 25-month treatment period,
10 pairs of BM, PB and urine samples were collected. The levels of
VMA (μg/mg creatinine) and HVA (μg/mg creatinine) in urine samples,
as well as the levels of NSE (ng/ml) and LDH (IU/l) in PB samples
were extracted from the patient's medical records. The levels of
PB-MRD and BM-MRD were determined by measuring 7NB-mRNA (relative
copy number) in PB and BM samples with droplet digital polymerase
chain reaction. MRD, minimal residual disease; VMA,
vanillylmandelic acid; HVA, homovanillic acid; NSE, neuron-specific
enolase; LDH, lactate dehydrogenase; BM, bone marrow; PB,
peripheral blood; NB, neuroblastoma.
Correlations between tumor markers and
MRD in subgroups of sample pairs according to each sample
evaluation. Correlation between tumor markers and MRD in subgroups
of sample pairs according to each patient evaluation. Levels of 7
neuroblastoma-mRNA (relative copy number) were determined by
droplet digital polymerase chain reaction and their correlations
with the levels of VMA (μg/mg creatinine), HVA (μg/mg creatinine),
NSE (ng/ml) and LDH (IU/l) were assessed by Spearman's rank
correlation coefficient in subgroups of concurrently collected BM,
PB and urine sample pairs: Age at diagnosis (<18 months, 26
pairs; ≥18 months, 107 pairs), DNA ploidy (hyperdiploid, 33 pairs;
diploid, 93 pairs), MYCN status (non-amplified, 88 pairs;
amplified, 45 pairs) and recurrent tumor site (non-CNS, 55 pairs;
CNS, 35 pairs). *P<0.05 (significant correclation).
MRD, minimal residual disease; VMA, vanillylmandelic acid; HVA,
homovanillic acid; NSE, neuron-specific enolase; LDH, lactate
dehydrogenase; BM, bone marrow; PB, peripheral blood; CNS, central
nervous system.
Acknowledgements
The authors would like to thank Dr Tomoko Fujikawa
at the Pediatric Department of Kobe University Hospital and Dr
Sayaka Nakamura, Dr Machiko Miyamoto, Dr Jun Noguchi, Dr Ryunosuke
Tojyo, Dr Shotaro Inoue and Dr Akihiro Nishimura at the Hematology
and Oncology Department at Kobe Children's Hospital for collecting
BM, PB and urine samples.
Funding
The present study was supported in part by Grants-in-Aid for
Scientific Research (KAKENHI) from the Japan Society for the
Promotion of Science (grant nos. 17K10110, 19K17361 and 19K17331)
and the Institutional Research Fund of Sysmex Corporation to Kobe
University.
Availability of data and materials
All data generated or analyzed during this study are
included in this published article.
Authors' contributions
SU, KSL, KKMT and NNis. drafted the initial
manuscript. SU, KSL, KKMT, DH, YK, KI and NNis conceptualized and
designed the study. SU, KSL, KKMT, NNak, TI, NY, AT, AS, TM, NNin,
CN, and ST collected the samples, acquired the data and carried out
analyses. SU, KSL, KKMT and NNis performed statistical analysis and
interpreted the data. SU, KSL, DH, YK, KI and NNis critically
revised the article for important intellectual content. All authors
have read and approved the final manuscript.
Ethics approval and consent to
participate
The present study was approved by the Ethics
Committee of Kobe University Graduate School of Medicine (approval
no. 180278) and Kobe Children's Hospital (approval no. 30-80).
Informed consent to participate in the present study was obtained
from all patients.
Patient consent for publication
Not applicable.
Competing interests
NNis received institutional research funding from
Sysmex Corporation to Kobe University. The remaining authors
declare that they have no competing interests.
References
|
1
|
Brodeur GM: Neuroblastoma: Biological
insights into a clinical enigma. Nat Rev Cancer. 3:203–216.
2003.PubMed/NCBI View
Article : Google Scholar
|
|
2
|
Maris JM, Hogarty MD, Bagatell R and Cohn
SL: Neuroblastoma. Lancet. 369:2106–2120. 2007.PubMed/NCBI View Article : Google Scholar
|
|
3
|
Pinto NR, Applebaum MA, Volchenboum SL,
Matthay KK, London WB, Ambros PF, Nakagawara A, Berthold F,
Schleiermacher G, Park JR, et al: Advances in risk classification
and treatment strategies for neuroblastoma. J Clin Oncol.
33:3008–3017. 2015.PubMed/NCBI View Article : Google Scholar
|
|
4
|
Morgenstern DA, Potschger U, Moreno L,
Papadakis V, Owens C, Ash S, Pasqualini C, Luksch R, Garaventa A,
Canete A, et al: Risk stratification of high-risk metastatic
neuroblastoma: A report from the HR-NBL-1/SIOPEN study. Pediatr
Blood Cancer. 65(e27363)2018.PubMed/NCBI View Article : Google Scholar
|
|
5
|
Smith V and Foster J: High-risk
neuroblastoma treatment review. Children (Basel).
5(114)2018.PubMed/NCBI View Article : Google Scholar
|
|
6
|
MacFarland S and Bagatell R: Advances in
neuroblastoma therapy. Curr Opin Pediatr. 31:14–20. 2019.PubMed/NCBI View Article : Google Scholar
|
|
7
|
Maris JM: Recent advances in
neuroblastoma. N Engl J Med. 362:2202–2211. 2010.PubMed/NCBI View Article : Google Scholar
|
|
8
|
Tolbert VP and Matthay KK: Neuroblastoma:
Clinical and biological approach to risk stratification and
treatment. Cell Tissue Res. 372:195–209. 2018.PubMed/NCBI View Article : Google Scholar
|
|
9
|
Uemura S, Ishida T, Thwin KKM, Yamamoto N,
Tamura A, Kishimoto K, Hasegawa D, Kosaka Y, Nino N, Lin KS, et al:
Dynamics of minimal residual disease in neuroblastoma patients.
Front Oncol. 9(455)2019.PubMed/NCBI View Article : Google Scholar
|
|
10
|
London WB, Castel V, Monclair T, Ambros
PF, Pearson AD, Cohn SL, Berthold F, Nakagawara A, Ladenstein RL,
Iehara T and Matthay KK: Clinical and biologic features predictive
of survival after relapse of neuroblastoma: A report from the
International Neuroblastoma Risk Group project. J Clin Oncol.
29:3286–3292. 2011.PubMed/NCBI View Article : Google Scholar
|
|
11
|
Riley RD: A systematic review of molecular
and biological tumor markers in neuroblastoma. Clin Cancer Res.
10:4–12. 2004.PubMed/NCBI View Article : Google Scholar
|
|
12
|
Brodeur GM, Seeger RC, Barrett A, Berthold
F, Castleberry RP, D'Angio G, De Bernardi B, Evans AE, Favrot M,
Freeman AI, et al: International criteria for diagnosis, staging,
and response to treatment in patients with neuroblastoma. J Clin
Oncol. 6:1874–1881. 1988.PubMed/NCBI View Article : Google Scholar
|
|
13
|
Brodeur GM, Pritchard J, Berthold F,
Carlsen NL, Castel V, Castelberry RP, De Bernardi B, Evans AE,
Favrot M, Hedborg F, et al: Revisions of the international criteria
for neuroblastoma diagnosis, staging, and response to treatment. J
Clin Oncol. 11:1466–1477. 1993.PubMed/NCBI View Article : Google Scholar
|
|
14
|
Simon T, Hero B, Hunneman DH and Berthold
F: Tumour markers are poor predictors for relapse or progression in
neuroblastoma. Eur J Cancer. 39:1899–1903. 2003.PubMed/NCBI View Article : Google Scholar
|
|
15
|
Cohn SL, Pearson ADJ, London WB, Monclair
T, Ambros PF, Brodeur GM, Faldum A, Hero B, Iehara T, Machin D, et
al: The international neuroblastoma risk group (INRG)
classification system: An INRG task force report. J Clin Oncol.
27:289–297. 2009.PubMed/NCBI View Article : Google Scholar
|
|
16
|
Park JR, Bagatell R, Cohn SL, Pearson AD,
Villablanca JG, Berthold F, Burchill S, Boubaker A, McHugh K,
Nuchtern JG, et al: Revisions to the international neuroblastoma
response criteria: A consensus statement from the national cancer
institute clinical trials planning meeting. J Clin Oncol.
35:2580–2587. 2017.PubMed/NCBI View Article : Google Scholar
|
|
17
|
Bozzi F, Gambirasio F, Luksch R, Collini
P, Brando B and Fossati-Bellani F: Detecting
CD56+/NB84+/CD45-immunophenotype
in the bone marrow of patients with metastatic neuroblastoma using
flow cytometry. Anticancer Res. 26:3281–3287. 2006.PubMed/NCBI
|
|
18
|
Popov A, Druy A, Shorikov E, Verzhbitskaya
T, Solodovnikov A, Saveliev L, Tytgat GAM, Tsaur G and Fechina L:
Prognostic value of initial bone marrow disease detection by
multiparameter flow cytometry in children with neuroblastoma. J
Cancer Res Clin Oncol. 145:535–542. 2019.PubMed/NCBI View Article : Google Scholar
|
|
19
|
Stutterheim J, Ichou FA, den Ouden E,
Versteeg R, Caron HN, Tytgat GA and van der Schoot CE: Methylated
RASSF1a is the first specific DNA marker for minimal residual
disease testing in neuroblastoma. Clin Cancer Res. 18:808–814.
2012.PubMed/NCBI View Article : Google Scholar
|
|
20
|
Beiske K, Ambros PF, Burchill SA, Cheung
IY and Swerts K: Detecting minimal residual disease in
neuroblastoma patients-the present state of the art. Cancer Lett.
228:229–240. 2005.PubMed/NCBI View Article : Google Scholar
|
|
21
|
Brownhill SC and Burchill SA: PCR-based
amplification of circulating RNAs as prognostic and predictive
biomarkers-Focus on neuroblastoma. Pract Lab Med. 7:41–44.
2017.PubMed/NCBI View Article : Google Scholar
|
|
22
|
Burchill SA, Bradbury FM, Smith B, Lewis
IJ and Selby P: Neuroblastoma cell detection by reverse
transcriptase-polymerase chain reaction (RT-PCR) for tyrosine
hydroxylase mRNA. Int J Cancer. 57:671–675. 1994.PubMed/NCBI View Article : Google Scholar
|
|
23
|
Viprey VF, Corrias MV, Kågedal B, Oltra S,
Swerts K, Vicha A, Ladenstein R and Burchill SA: Standardisation of
operating procedures for the detection of minimal disease by
QRT-PCR in children with neuroblastoma: Quality assurance on behalf
of SIOPEN-R-NET. Eur J Cancer. 43:341–350. 2007.PubMed/NCBI View Article : Google Scholar
|
|
24
|
Stutterheim J, Gerritsen A,
Zappeij-Kannegieter L, Kleijn I, Dee R, Hooft L, van Noesel MM,
Bierings M, Berthold F, Versteeg R, et al: PHOX2B is a novel and
specific marker for minimal residual disease testing in
neuroblastoma. J Clin Oncol. 26:5443–5449. 2008.PubMed/NCBI View Article : Google Scholar
|
|
25
|
Stutterheim J, Zappeij-Kannegieter L,
Versteeg R, Caron HN, van der Schoot CE and Tytgat GAM: The
prognostic value of fast molecular response of marrow disease in
patients aged over 1 year with stage 4 neuroblastoma. Eur J Cancer.
47:1193–1202. 2011.PubMed/NCBI View Article : Google Scholar
|
|
26
|
Viprey VF, Gregory WM, Corrias MV,
Tchirkov A, Swerts K, Vicha A, Dallorso S, Brock P, Luksch R,
Valteau-Couanet D, et al: Neuroblastoma mRNAs predict outcome in
children with stage 4 neuroblastoma: A European HR-NBL1/SIOPEN
study. J Clin Oncol. 32:1074–1083. 2014.PubMed/NCBI View Article : Google Scholar
|
|
27
|
Cheung NK, Ostrovnaya I, Kuk D and Cheung
IY: Bone marrow minimal residual disease was an early response
marker and a consistent independent predictor of survival after
anti-GD2 immunotherapy. J Clin Oncol. 33:755–763. 2015.PubMed/NCBI View Article : Google Scholar
|
|
28
|
Marachelian A, Villablanca JG, Liu CW, Liu
B, Goodarzian F, Lai HA, Shimada H, Tran HC, Parra JA, Gallego R,
et al: Expression of five neuroblastoma genes in bone marrow or
blood of patients with relapsed/refractory neuroblastoma provides a
new biomarker for disease and prognosis. Clin Cancer Res.
23:5374–5383. 2017.PubMed/NCBI View Article : Google Scholar
|
|
29
|
Akobeng AK: Understanding diagnostic tests
3: Receiver operating characteristic curves. Acta Paediatr.
96:644–647. 2007.PubMed/NCBI View Article : Google Scholar
|
|
30
|
Hartomo TB, Kozaki A, Hasegawa D, Van
Huyen Pham T, Yamamoto N, Saitoh A, Ishida T, Kawasaki K, Kosaka Y,
Ohashi H, et al: Minimal residual disease monitoring in
neuroblastoma patients based on the expression of a set of
real-time RT-PCR markers in tumor-initiating cells. Oncol Rep.
29:1629–1636. 2013.PubMed/NCBI View Article : Google Scholar
|
|
31
|
Hirase S, Saitoh A, Hartomo TB, Kozaki A,
Yanai T, Hasegawa D, Kawasaki K, Kosaka Y, Matsuo M, Yamamoto N, et
al: Early detection of tumor relapse/regrowth by consecutive
minimal residual disease monitoring in high-risk neuroblastoma
patients. Oncol Lett. 12:1119–1123. 2016.PubMed/NCBI View Article : Google Scholar
|
|
32
|
Thwin KKM, Ishida T, Uemura S, Yamamoto N,
Lin KS, Tamura A, Kozaki A, Saito A, Kishimoto K, Mori T, et al:
Level of seven neuroblastoma-associated mRNAs detected by droplet
digital PCR is associated with tumor relapse/regrowth of high-risk
neuroblastoma patients. J Mol Diagn. 22:236–246. 2020.PubMed/NCBI View Article : Google Scholar
|
|
33
|
Weinstein JL, Katzenstein HM and Cohn SL:
Advances in the diagnosis and treatment of neuroblastoma.
Oncologist. 8:278–292. 2003.PubMed/NCBI View Article : Google Scholar
|
|
34
|
Burchill SA, Beiske K, Shimada H, Ambros
PF, Seeger R, Tytgat GA, Brock PR, Haber M, Park JR and Berthold F:
Recommendations for the standardization of bone marrow disease
assessment and reporting in children with neuroblastoma on behalf
of the International Neuroblastoma Response Criteria Bone Marrow
Working Group. Cancer. 123:1095–1105. 2017.PubMed/NCBI View Article : Google Scholar
|
|
35
|
Bustin SA, Benes V, Garson JA, Hellemans
J, Huggett J, Kubista M, Mueller R, Nolan T, Pfaffl MW, Shipley GL,
et al: The MIQE guidelines: Minimum information for publication of
quantitative real-time PCR experiments. Clin Chem. 55:611–622.
2009.PubMed/NCBI View Article : Google Scholar
|
|
36
|
Huggett JF, Foy CA, Benes V, Emslie K,
Garson JA, Haynes R, Hellemans J, Kubista M, Mueller RD, Nolan T,
et al: The digital MIQE guidelines: Minimum information for
publication of quantitative digital PCR experiments. Clin Chem.
59:892–902. 2013.PubMed/NCBI View Article : Google Scholar
|
|
37
|
Schober P, Boer C and Schwarte LA:
Correlation coefficients. Anesth Analg. 126:1763–1768.
2018.PubMed/NCBI View Article : Google Scholar
|
|
38
|
Kanda Y: Investigation of the freely
available easy-to-use software ‘EZR’ for medical statistics. Bone
Marrow Transplant. 48:452–458. 2013.PubMed/NCBI View Article : Google Scholar
|
|
39
|
Moroz V, Machin D, Hero B, Ladenstein R,
Berthold F, Kao P, Obeng Y, Pearson ADJ, Cohn SL and London WB: The
prognostic strength of serum LDH and serum ferritin in children
with neuroblastoma: A report from the International Neuroblastoma
Risk Group (INRG) project. Pediatr Blood Cancer.
67(e28359)2020.PubMed/NCBI View Article : Google Scholar
|


