Introduction
Chemoresistance (intrinsic and acquired) is the main
reason for cancer chemotherapy failure and patients' death in the
Western world (1). There are
several cellular processes that contribute to both intrinsic and
acquired chemoresistance (2). One
of such processes is active extrusion of drugs from cells by
ATP-binding cassette transporters (ABC transporters), which are
membrane proteins (3). This process
has low drug specificity and is termed multi-drug resistance (MDR).
Here, we use the term MDR solely to describe the catalytic process
of drug transport across the membrane (from inside to outside of
the cell). Activity of MDR in tumor cells has been shown to
correlate with clinical chemoresistance, and MDR is its likely
driver (4).
A promising approach in cancer research is studying
circulating tumor cells (CTCs). CTCs exist as individual cells or
multicellular clusters that detach from the primary tumor,
circulate in the bloodstream, and give rise to systemic metastases
and tumor relapse (5). CTC clusters
are reported to be more chemoresistant than individual CTCs
(6), and the density of CTC
clusters in blood was found to correlate with clinical features of
cancer (7).
The presumed roles of MDR transport and CTC clusters
in the development of chemoresistance logically lead to a question:
Can cell clustering influence intrinsic and acquired MDR
differently? To the best of our knowledge, this question has never
been addressed. Addressing this question requires a cytometry
technique capable of accurately measuring MDR activity and
applicable to both single cells and intact clusters. Classical
cytometry techniques cannot be used for accurate measurements of
MDR activity, making the above-posed question difficult to approach
experimentally. In contrast, cytometry of reaction rate constant
(CRRC) can be used for this purpose. CRRC utilizes time-lapse
fluorescence microscopy to measure a rate constant of a catalytic
reaction in individual cells, thus, facilitating accurate frequency
determination for subpopulations of cells with distinct activities
of this reaction (8). Time-lapse
fluorescence images are used to build kinetic traces of substrate
conversion into a product. A reaction rate constant is then found
for every cell using a known mechanism of the reaction. Finally, a
CRRC histogram, which plots the number of cells versus the rate
constant value, is used to accurately measure frequencies of cell
subpopulations with distinct reaction activities (8).
When applied to MDR transport, CRRC is used to
record kinetics of fluorescent substrate extrusion from cells
(Fig. 1). The extrusion process is
governed by the Michalis-Menten mechanism, which is characterized
by two parameters: The maximum velocity, Vmax,
and the Michaelis constant, KM. A ratio between
these parameters is a first order rate constant of MDR transport,
kMDR=Vmax/KM,
which can be easily determined from time dependence of
intracellular fluorescence intensity of an MDR substrate. CRRC
histograms that plot the number of cells vs. kMDR
ranges are robust towards variations in substrate concentration and
observation time (8); therefore,
such histograms facilitate accurate determining the sizes of cell
subpopulations with different MDR activities (8).
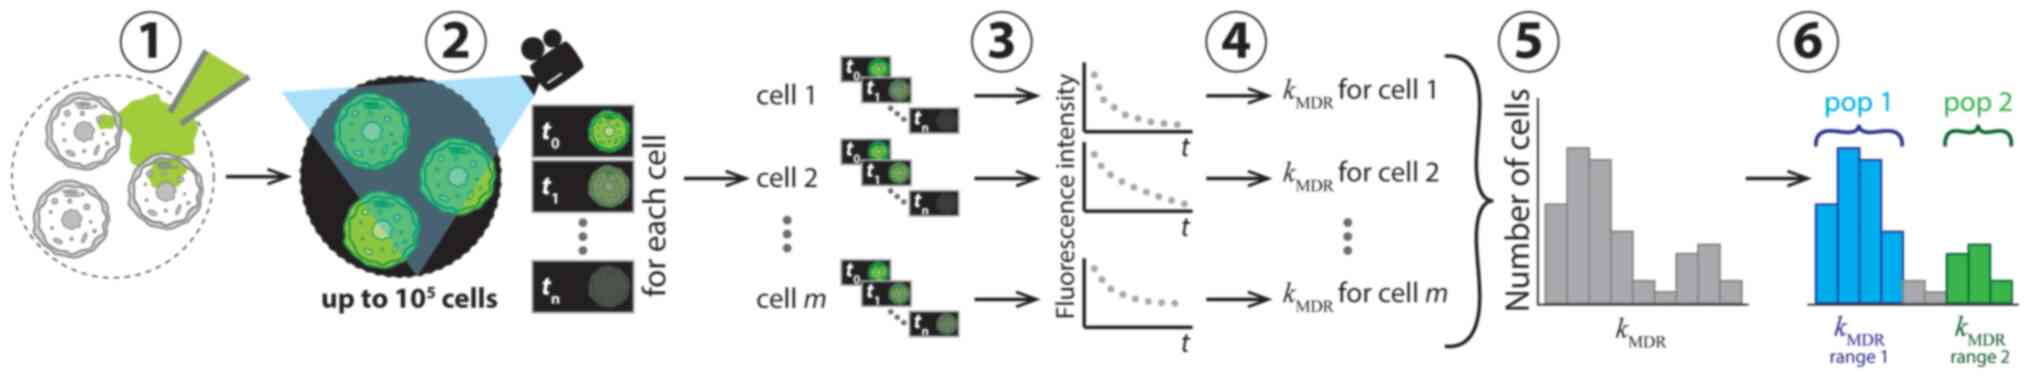 | Figure 1Conceptual representation of
application of CRRC to MDR in six consecutive steps. In step 1, the
cells were loaded with a fluorescent substrate of ABC transporters
which was then removed from the cell media to initiate substrate
extrusion. In step 2, the kinetics of decreasing fluorescence
intensity was measured microscopically. Sequential images of the
individual cells were taken at various times over a period of time
exceeding the characteristic time of the extrusion reaction. In
step 3, kinetic traces of fluorescence intensity for every cell
were constructed. In step 4, values of the reaction rate constant,
kMDR, were determined for each cell. In step 5,
these values were used to build a CRRC histogram with the number of
cells vs. kMDR. In step 6, the heterogeneity of
cell population with respect to MDR activity was characterized
accurately using the histogram: Cell subpopulations with different
MDR activities were identified and quantified. CRRC, cytometry of
reaction rate constant; MDR, multi-drug resistance; pop,
subpopulation; t, time; m, cell number in a cell population
(1, 2, m). |
The most straightforward application of CRRC is in
2D models, such as cells cultured as monolayers or cells obtained
by disintegration of cell clusters (e.g. spheroids or tissue
samples) and allowed to settle on a surface (9). However, if CRRC is based on confocal
microscopy, it can also be applied to 3D models, i.e., intact cell
clusters and spheroids in particular (9). Specific features of CRRC-based MDR
studies in spheroids are described in detail elsewhere (9). Two important remarks should be made at
this point. First, due to its transmembrane nature, the MDR process
should be studied in small spheroids of ~100 µm in diameter. Small
spheroids facilitate free MDR efflux from approximately 70% of
spheroid cells and also minimize intraspheroidal gradients of
oxygen, pH, etc. (9,10). Second, since the first order rate
constant is defined by the dynamics rather than the absolute values
of fluorescence signal, the CRRC method is robust to variations in
substrate level or signal attenuation potentially associated with
cell clustering or uneven illumination.
Thus, CRRC is uniquely capable of accurately
measuring MDR activity in both 2 and 3D models, making it suitable
for addressing our question of how MDR activity of single cells
differs from that of aggregated cells in i) drug-naïve and ii)
drug-exposed tumor cells. In this study, drug-naïve and
drug-exposed tumor cells were modeled by the parental and
cisplatin-resistant variants of the A2780 ovarian cancer (OC) cell
line (A2780S and A2780CP, respectively) (11,12).
Analytical advantages of A2780 cells include their inducible MDR
capacity (13), ability to form
small compact spheroids (14), and
extensive use in the development of CRRC (8,9). From
the clinical point of view, OC is especially prone to
chemoresistance (15), and these
cells are viewed as an appropriate general model of OC, though not
for its common high-grade serous form (16). In addition, A2780 cells were
previously used to mimic ovarian CTCs (17).
The A2780S cell subline is derived from a patient
who was not exposed to chemotherapy, and, thus, this
cisplatin-naïve cell line represents intrinsic chemoresistance
(18). The A2780CP cell subline is
derived from the A2780S subline and has been cultured in the
presence of cisplatin to develop resistance to this drug.
Therefore, A2780CP cells represent OC cells that have developed
acquired chemoresistance in response to cisplatin, a standard
chemotherapeutic agent for first-line OC treatment. Importantly,
both cell lines can be grown as monolayers or as multicellular
spheroids (14). Therefore, we can
view cultured monolayers of A2780S and A2780CP cells as models of
circulating single cells, while their cultured spheroids can be
considered as models of CTC clusters. Comparison of CRRC histograms
of a cell monolayer with that of cultured spheroids can then answer
our question. It is important to emphasize that our study is
limited to one cell line and one drug; answering our question for
other cell lines (and drugs) will require further
investigation.
Materials and methods
CRRC experimental techniques
Detailed description of experimental techniques of
CRRC for cell monolayers and cells in intact spheroids, as well as
cell source, can be found elsewhere (9); these techniques were followed exactly
with no modification of the procedures.
Cell cultures
A2780S and A2780CP cell lines are per se sublines of
A2780 cells which can be cultured in the same way. Briefly, the
cells were cultured as monolayers at 37˚C in a humidified
atmosphere of 5% CO2, in Dulbecco's modified Eagle's
medium (DMEM, containing 4.5 g/l glucose, 1.5 g/l sodium
bicarbonate, 1 mM sodium pyruvate, and 4 mM L-glutamine) and
supplemented with fetal bovine serum [10% (vol/vol)], penicillin
(100 IU) and streptomycin (100 µg/ml). Medium was produced by the
American Type Culture Collection (ATCC, ATCC30-2002) and was
obtained from Cedarlane. The medium was replaced by fresh medium
every 2 days. The culturing of small multicellular spheroids was
based on the liquid overlay approach (19) adapted for ovarian cells (20). Briefly, 96-well plates were treated
with 100 µl of 10% agarose per well to create a concave
non-adhesive surface. After the solidification of agarose, the
wells were filled with 100 µl of cell suspension (5x10³
cells/ml) in DMEM, and spheroids were allowed to form for 2-3 days
before their collection. For time-lapse imaging, spheroids were
placed onto coverslips and allowed to settle and attach to the
surface for 5 h (21).
Imaging
The imaging of MDR efflux was performed with a FV300
confocal cell imager (Olympus) in the time-lapse mode for 120 min
with single and multiple optical sections taken for monolayers and
spheroids, respectively. Cells were loaded with a fluorescent MDR
substrate (fluorescein) and allowed to extrude it. The kinetics of
substrate extrusion was monitored by measuring intracellular
fluorescence intensity over time to determine
kMDR for individual cells. To avoid the
underestimation of MDR efflux due the MDR probe accumulation in the
intercellular space, only outer spheroidal cells were taken into
consideration. The small diameter of the spheroids used in this
study (~100 µm) ensured that the outer cells constituted ~70% of
the spheroid cell population. This minimized the intra-spheroid
oxygen gradient and, thus, hypoxia with its potential effect on
MDR. It was shown previously that the outer cells in such spheroids
well represented the entire spheroidal cell population (9).
CRRC histograms
Kinetic cytometry histograms were plotted and peak
maximum positions in these histograms were determined for the
comparison of MDR activity (kMDR) in the
monolayers and spheroids of A2780S and A2780CP cell lines.
Multidrug resistance-associated
protein 1 (MRP1) expression assay
Expression levels of the MRP1 transporter in
monolayers and dissociated spheroid cells were estimated using flow
cytometry with FITC-labeled mouse anti-human MRP1 antibody QCRL-3
and an isotype control (FITC Mouse IgG2a) (BD Biosciences, cat. no.
557593 and 555573, respectively) according to the previously
published procedure (22). Briefly,
monolayers and spheroids were trypsinized with 0.25% trypsin/0.02%
EDTA to form single cell suspensions, permeabilized with 80 µg/ml
saponin, treated with the antibodies, and analyzed with a BD
FACSCanto II flow cytometer.
Statistical analysis
Differences between cells in regards to basal
transporter activity and expression (A2780S monolayer cells) and
other cell types were analyzed for statistical significance using
one-way ANOVA followed by the Dunnett test, using Origin software
(version 9.4, OriginLab). Data are presented as mean ± SE, n=3,
P<0.05 was determined to indicate a statistically significant
difference.
Results
Time-lapse imaging
We grew cultured A2780S and A2780CP cells as
monolayers and spheroids, loaded them with fluorescein (a
fluorescent substrate of ABC transporters) and imaged fluorescein
extrusion from the cells with confocal laser-scanning microscopy as
described in Materials and Methods. A standard end-point analysis,
which is commonly used in MDR studies, compares fluorescence of
cells at two time points: Immediately after loading them with the
fluorescent substrate and 2 h later (8,23,24).
Representative images in the top and bottom in Fig. 2 show a similar ability of all cell
types for nearly complete extrusion of MDR probe after 2 h.
However, images taken in the middle of this 2-h period (Fig. 2, middle row) suggest that A2780S
monolayer cells may extrude the substrate more slowly than A2780S
spheroid cells, as well as both types of A2780CP cells.
Kinetic analysis
The end-point analysis of the images does not allow
one to make any further conclusion; therefore, MDR activity was
elicited from the CRRC kinetic analysis. We processed images from
347 cells in each of the four categories (cisplatin-naïve single
cells, cisplatin-naïve spheroidal cells, cisplatin-exposed single
cells, and cisplatin-exposed spheroidal cells) to determine
kMDR for each cell and plot CRRC histograms
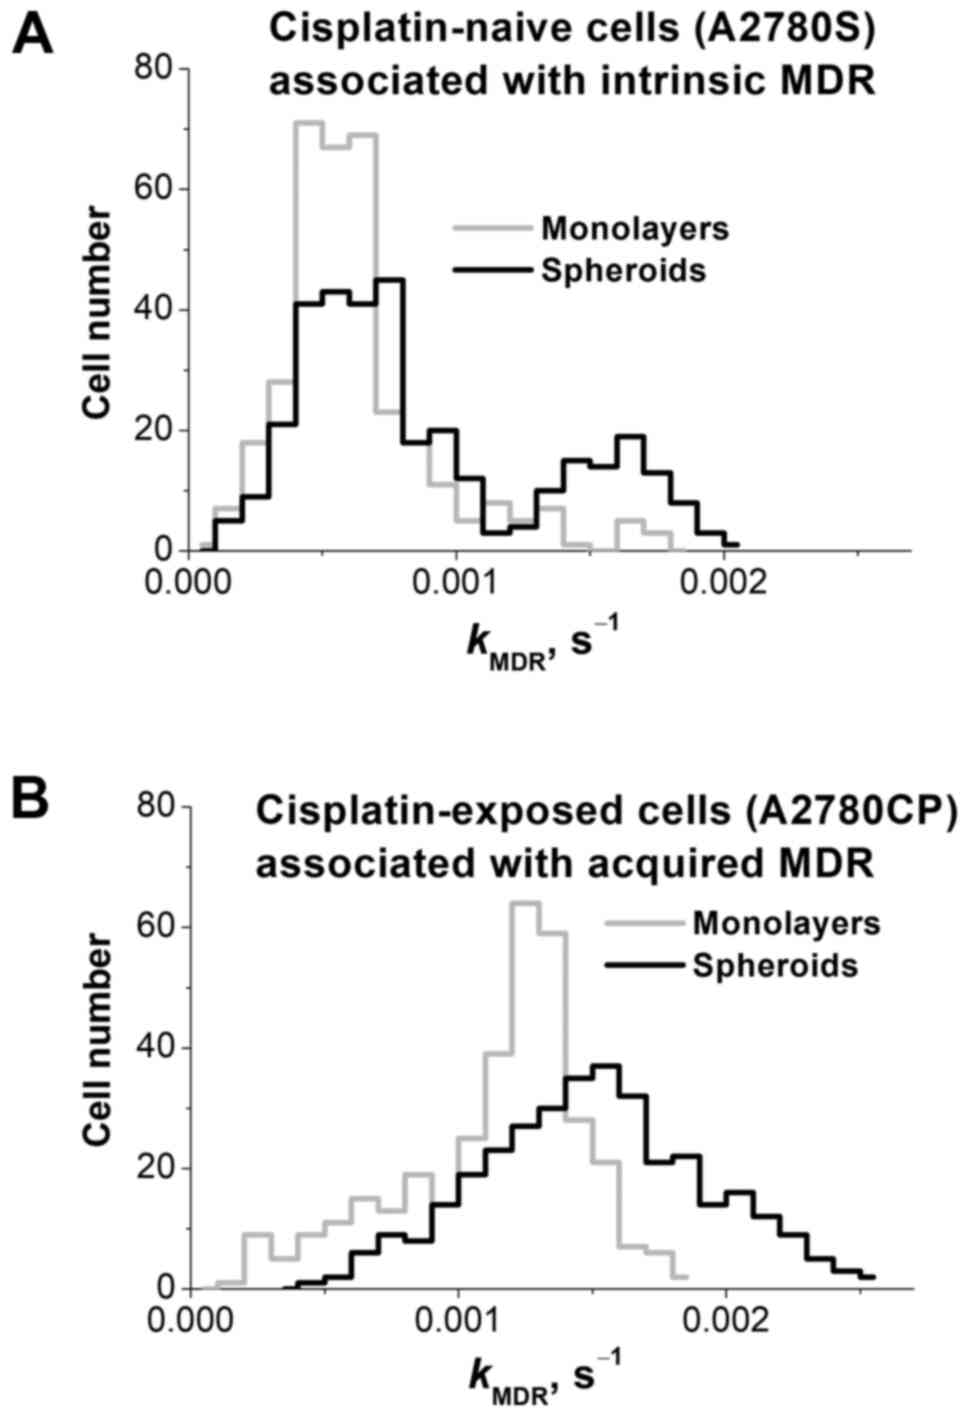
(Fig. 3).
CRRC histograms of the cisplatin-naïve A2780S cell
line are shown in Fig. 3A and
summarized in Table I; they have
been adopted from our recently published paper (9). The monolayer histogram (grey line) was
found to be unimodal, suggesting a single population of cells. The
spheroid histogram (black line) revealed a bimodal distribution,
suggesting two cell subpopulations: The first one is larger and has
the same peak kMDR value as the monolayer cells,
while the second one is smaller and has a peak
kMDR value which is almost 3 times greater. This
latter subpopulation has a greater MDR capacity, and its appearance
is caused by cell-cell interactions in the 3D spheroids (25). The presence of a cisplatin-resistant
subpopulation (presumably containing tumor initiating cells) in the
spheroids is consistent with the notion that CTC clusters have a
greater drug-resistance capacity than single CTCs. The unimodal
right-skewed histogram of monolayer A2780S cells is similar to that
reported earlier (8). Its shape is
consistent with the often reported asymmetric expression of MDR
transporters, when the majority of cells with a basal (low) level
of transporter expression form the main peak and a much smaller
subpopulation of cells with elevated transporter expression forms
the distribution tail towards higher kMDR values
(26).
 | Table IPeak positions cytometry of reaction
rate constant histograms of cisplatin-naïve and cisplatin-exposed
monolayer and spheroid cells. |
Table I
Peak positions cytometry of reaction
rate constant histograms of cisplatin-naïve and cisplatin-exposed
monolayer and spheroid cells.
| | A2780S cells | A2780CP cells |
|---|
| Parameter | Monolayer | Spheroid | Monolayer | Spheroid |
|---|
| Positions of peak
maximum (s-1) |
0.00058±0.00008 | Left-hand-side
peak, 0.00057±0.00009; Right-hand-side peak,
0.00166±0.00019a |
0.00125±0.00015a |
0.00164±0.00021a |
When A2780S cells are cultured as spheroids, the
tail becomes a distinct peak, which corresponds to a distinct
subpopulation of cells with its own elevated peak
kMDR value: The histogram becomes bimodal. This
bimodality is not associated with cell position in the 3D spheroids
as only the outer spheroidal cells were analyzed. It is remarkable
that the activation of MDR transport in spheroidal A2780S cells is
not distributed equally across all spheroidal cells. Instead, the
activation proceeds through increasing the size of the
subpopulation of cells with a greater MDR-transport activity. This
characteristic of MDR modulation agrees well with the notion that
the size and activity of the drug-resistant subpopulation determine
the overall resistance of a heterogeneous cell population (27).
CRRC histograms of the cisplatin-exposed
(drug-resistant) A2780CP cell line are depicted in Fig. 3B and summarized in Table I. Monolayer cells (grey line) showed
a unimodal distribution with the median (peak)
kMRD value exceeding that of monolayer A2780S
cells (grey line in Fig. 3A)
approximately by a factor of 2. When cultured as spheroids, A2780CP
cells also showed a unimodal distribution (black line), and the
histogram of the spheroidal A2780CP cells was moderately shifted to
the right with respect to that of the monolayer A2780CP cells. In
addition, the peak maximum of the spheroidal A2780CP cells was at
the same kMDR position as the peak maximum of the
drug-resistant subpopulation in the spheroidal A2780S cells
(right-hand-side peak in the black line in Fig. 3A). Thus, the drug-resistant
subpopulation dominates even in monolayers formed by these cells
and predictably dominates in spheroids resulting in a unimodal
kMDR distribution in the spheroid culture. The
peak maximum value in the spheroid culture slightly exceeds that in
the monolayer (by a factor of 1.2). Lower kurtosis (indicator of
distribution peakedness/flatness, -0.95 vs. 1.87) indicates that
MDR distribution in A2780CP spheroids is more heterogeneous than in
monolayers. Greater heterogeneity can be associated with the larger
fraction of cells with elevated kMDR able to
survive chemotherapy and initiate tumor relapse.
Flow-cytometry study of transporter
expression
It is interesting to learn what drives the observed
differences in kMDR values in the 2 and 3D cell
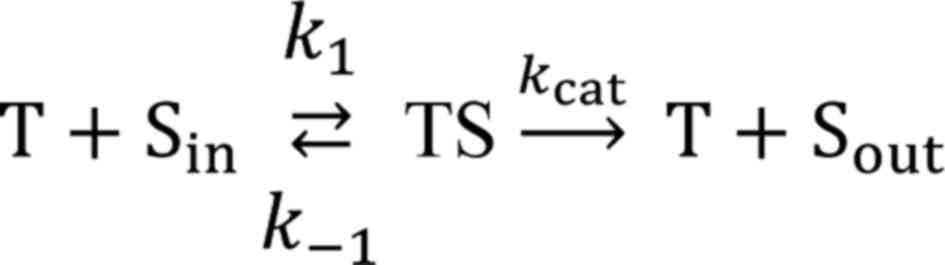
cultures between the A2780S and A2780CP cells. The MDR transport
reaction, characterized by kMDR, translocates the
intracellular substrates (Sin) across the membrane
adding it to the pool of the substrate outside the cell
(Sout). The reaction proceeds through the formation of
an intermediate complex (TS) between the transporter (T) and
substrate (S):
where k1 is a bimolecular rate
constant of TS formation while k-1 and
kcat are monomolecular rate constants of complex
dissociation backwards to Sin and forward to
Sout, respectively. The values of k1,
k-1, and kcat depend on the
transporter's microenvironment within the membrane. The
pseudo-first order rate constant kMDR used in our
study is defined as:
where [T] is the transporter concentration, and
KM=(kcat +
k-1)/k1 is the Michaelis
constant, which, accordingly, depends on transporter's
microenvironment and is indicative of complex stability. It is
clear from equation 2 that
kMDR can be influenced either by the expression
level of the transporter [(T)] or by transporter microenvironment
(kcat/KM). So, the observed
differences in kMDR values in the 2 and 3D cell
cultures between A2780S and A2780CP cells can be driven either by
different levels of transporter expression or by changes in the
transporter's microenvironment. MDR efflux in A2780 cells is
typically driven by the MRP1 transporter (13,18),
which is in line with significant fluorescein-extruding capacity of
these cells observed in this and previous studies (8,9).
Therefore, we decided to assess MRP1 expression levels in 2 and 3D
cultures to examine if the differences in MRP1 expression levels
are a cause for the observed differences in the MDR efflux
kinetics. There are multiple ways of studying expression of the
MRP1 gene, but for our purpose, the most direct and conclusive way
is immunostaining of the MRP1 transporter with
fluorescently-labeled antibody interrogated by flow cytometry. The
results of flow cytometry are frequency histograms conceptually
similar to those of CRRC histograms. Therefore, the cell-population
heterogeneity revealed from flow cytometry histograms can be
directly compared to the heterogeneity obtained from the CRRC
histograms to conclude whether or not the differences in
kMDR of the 2 and 3D cultures between A2780S and
A2780CP cells are caused by the difference in MRP1 expression
levels. Thus, we conducted flow-cytometry experiments to study the
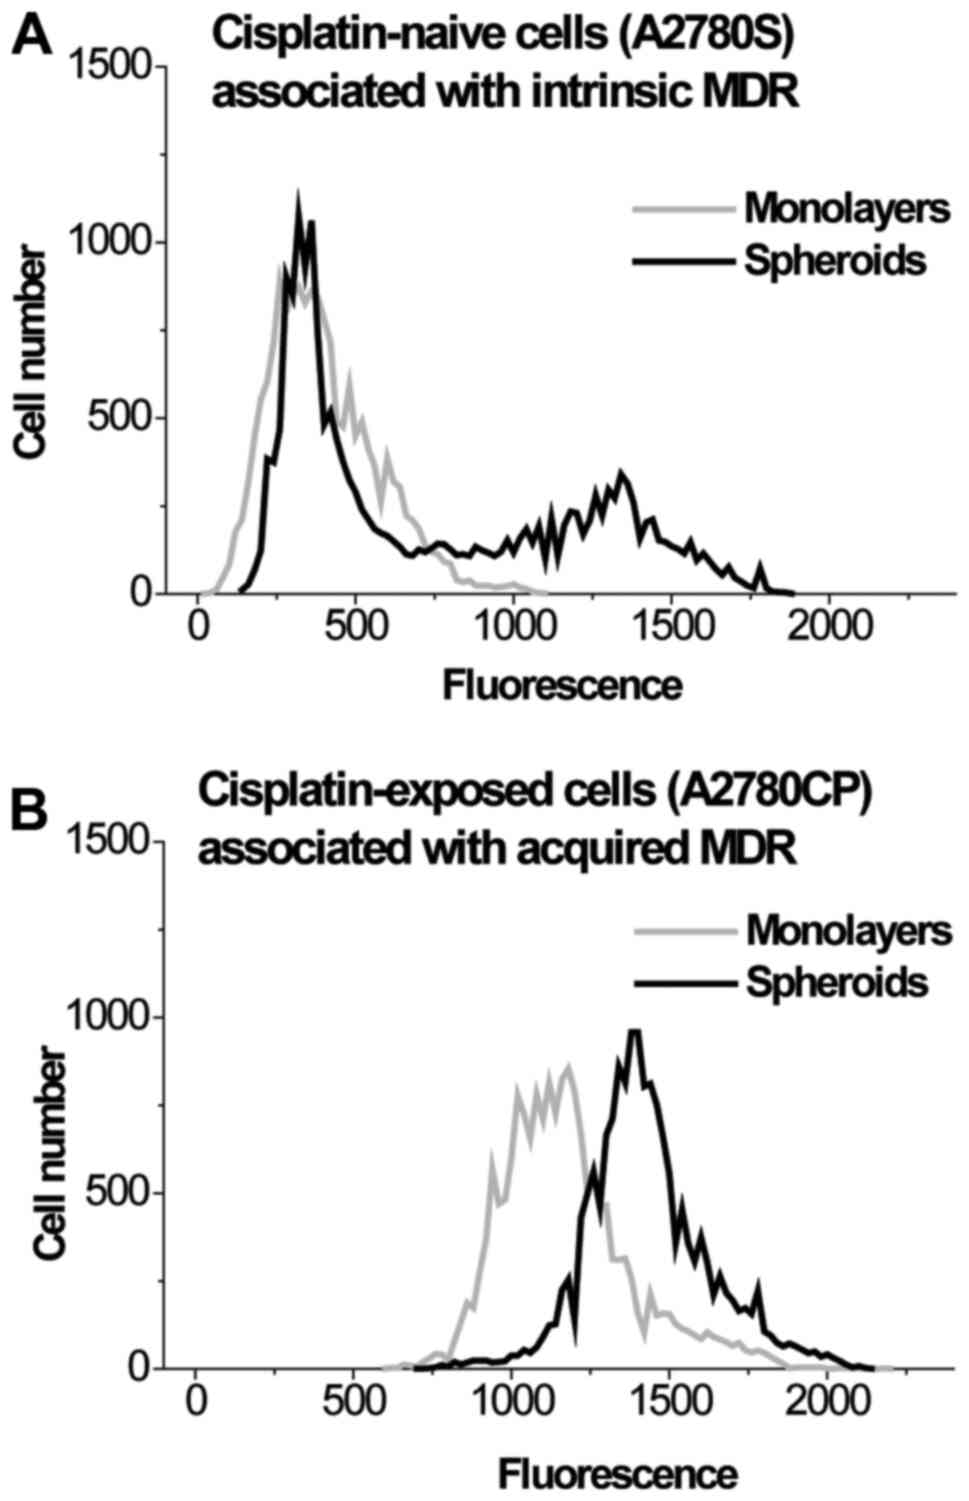
population heterogeneity of MRP1 levels. The results for the
heterogeneity of MRP1 levels in the populations of A2780S and
A2780CP cells grown in monolayers and spheroids are shown in
Fig. 4 and Table II. These results clearly indicate
that cell clustering causes the formation of a subpopulation with
increased expression of the MRP1 transporter in A2780S cells, while
this transporter is overexpressed in both the monolayer and
spheroids in A2780CP cells. Thus, the differences in
kMDR between the 2 and 3D cultures A2780S and
A2780CP cells are caused by the difference in MRP1 levels.
| Table IIPeak positions in flow-cytometry
profiles of the expression of multidrug resistance-associated
protein 1 in cisplatin-naïve and cisplatin-exposed monolayer and
spheroid cells. |
Table II
Peak positions in flow-cytometry
profiles of the expression of multidrug resistance-associated
protein 1 in cisplatin-naïve and cisplatin-exposed monolayer and
spheroid cells.
| | A2780S cells | A2780CP cells |
|---|
| Parameter | Monolayer | Spheroid | Monolayer | Spheroid |
|---|
| Positions of peak
maximum (RFU) | 311±29 | Left-hand-side
peak, 362±42; Right-hand-side peak, 1,298±151a |
1,171±164a |
1,403±139a |
Discussion
Our aim in this study was to determine if cell
clustering influences intrinsic and acquired MDR differently. To
address this question, we studied cultured monolayers (representing
individual cells) and cultured spheroids (representing clusters)
formed by cisplatin-naïve (intrinsic MDR) and cisplatin-exposed
(acquired MDR) lines of ovarian cancer A2780 cells by CRRC. MDR
efflux was characterized by accurate and robust ‘cell number vs.
MDR efflux rate constant (kMDR)’ histograms. We
observed a greater influence of cell clustering on
kMDR distribution in the intrinsic than in the
acquired MDR model. The increase of kMDR in the
clustered cells can be caused by the increased expression of MDR
transporters under 3D conditions. The results of the current study
demonstrate agreement, both qualitative and quantitative, between
the data for kMDR and MRP1 transporter level.
Qualitatively, the bimodal distribution of kMDR
in spheroids formed by drug-naïve cells agrees with the bimodal
profile of the MRP1 transporter level in these spheroids. Also, the
unimodal distributions of kMDR in other cases
agree with the unimodal MRP1 level profiles. Quantitatively, both
kMDR values and MRP1 levels in the drug-exposed
cells exceed those in the drug-naïve cells. The observed
overexpression of the MRP1 transporter in spheroids formed by
A2780S cells is in line with similar observations made in other
cell types (28). In A2780CP cells,
the MRP1 level is intrinsically high in the monolayer state and,
thus, it responds to cell clustering by only a slight increase. The
mechanism of MRP1 overexpression (gene amplification,
transcriptional and post-transcriptional regulation) will be
addressed in the extended OC spheroid study using RNA-seq and
qPCR.
The potential clinical implications of our findings
are dual. First, considering the role of clustering of OC cells in
intrinsic and acquired chemoresistance, our results provide a new
possible explanation for the benefit of debulking surgery that has
not yet been theorized; by reducing spheroids and thereby
decreasing intrinsic resistance we should improve outcomes. Second,
activation of MDR transport within spheroids was ascribed to
activation of the HIF pathway caused either by hypoxia inside the
spheroids or by cytotoxic agents (29). However, we found MDR-transport
activation not only inside the spheroids but also on their surface;
moreover, this activation is observed in both drug-naïve (intrinsic
MDR) and drug-exposed (acquired MDR) cells. These observations
strongly suggest that there are other mechanisms of MDR-transport
activation in addition to the HIF-hypoxia pathway. It should be
noted that both monolayers and spheroids were in identical cell
media during the CRRC analysis, which univocally assigns the
observed differences between the monolayers and spheroids to cell
culture dimensionality rather than media-caused differences in
metabolic processes.
We would like to elaborate on the potential effect
of cell migration on our comparative CRRC study of cell monolayers
and spheroids. CRRC of MDR transport requires tracking individual
cells through a 2-h time-lapse measurement. This can be achieved
only by using a time interval between the frames in the minute
scale, which is much shorter than the characteristic time of cell's
moving a distance equal to its diameter of approximately 15-20 µm
(note, that cell rotation without its translational movement does
not affect CRRC measurements). In our case, the time interval
between the frames was 3 min while, according to the available data
(30), it would take days for the
cells used here to move a distance of 15-20 µm in both monolayers
and spheroids. A2780 cells belong to a class of slow-migrating OC
cells (30); their migration is
noticeable only in a time-scale of several days (30). It should be noted that cell mobility
within the cell culture can vary greatly (31), and for some cell types, cells in a
2D culture have greater mobility than cells within a 3D culture
(32,33).
To conclude, this work demonstrates unique
capabilities of CRRC in studying heterogeneity of cell population
with respect to MDR activity. This study answers the question of
whether cell clustering can influence (in principle) intrinsic and
acquired MDR differently; the answer is ‘yes’. This study is, of
course, limited to one cell line; answering this question for other
cell lines will require further investigation. It is important to
emphasize that this study did not aim to answer any other question.
In particular, consequences of spheroidal MDR activation for cell
proliferation and survival were beyond the scope of this work for
two reasons. First, they are well documented, for example, in the
studies related to cell-adhesion-mediated drug resistance (34). Second, these consequences are
commonly studied in the cell-population format, and conclusions
that can be obtained from such studies cannot contribute
significantly to conclusions made from the CRRC study performed in
the single-cell format. Further, our data show that the extent of
MDR-transport activation in OC cell clusters strongly depends on
the previous chemotherapeutic history of spheroid-forming A2780
cells. This fact, if confirmed in primary ovarian tumor cells, will
help clinicians to optimize OC treatment, since therapeutic
approaches might have different outcomes for drug-naïve and
drug-exposed tumors. If the observed phenomena are found in other
types of cancer cells, the last conclusion can be extended to those
types of cancer.
Acknowledgements
The authors thank Dr Sven Kochmann (Centre for
Research on Biomolecular Interactions, York University, Toronto,
Canada) for technical help.
Funding
This research was funded by the Natural Sciences and Engineering
Research Council of Canada (grant no. 238990).
Availability of data and materials
All data generated or analyzed during this study are
included in this published article or available as supplementary
materials on: https://doi.org/10.6084/m9.figshare.13003268.v2.
Authors' contributions
VK, CP, LEA, GL, AC and SNK conceptualized the
current study. VK and SNK developed the methodology. VK and MBDO
performed the experiments. VK, MBDO and SNK analyzed the data. VK
and MBDO confirm the authenticity of all the raw data. VK drafted
the manuscript. writing-review and editing, CP, LEA, GL, AC and SNK
wrote, reviewed and edited the manuscript. supervision, SNK
supervised, provided administrative support and acquired funding
for the current study. All authors have read and agreed to the
published version of the manuscript.
Ethics approval and consent to
participate
Not applicable.
Patient consent for publication
Not applicable.
Competing interests
The authors declare that they have no competing
interests.
References
|
1
|
Rueff J and Rodrigues AS: Cancer drug
resistance: A brief overview from a genetic viewpoint. Methods Mol
Biol. 1395:1–18. 2016.PubMed/NCBI View Article : Google Scholar
|
|
2
|
Norouzi-Barough L, Sarookhani MR, Sharifi
M, Moghbelinejad S, Jangjoo S and Salehi R: Molecular mechanisms of
drug resistance in ovarian cancer. J Cell Physiol. 233:4546–4562.
2018.PubMed/NCBI View Article : Google Scholar
|
|
3
|
Srivastava R, Srivastava A and Chochung Y:
Multidrug resistance in cancer (review). Int J Oncol. 9:879–884.
1996.PubMed/NCBI View Article : Google Scholar
|
|
4
|
Zhang Y, Sriraman S, Kenny H, Luther E,
Torchilin V and Lengyel E: Reversal of chemoresistance in ovarian
cancer by co-delivery of a P-glycoprotein inhibitor and paclitaxel
in a liposomal platform. Mol Cancer Ther. 15:2282–2293.
2016.PubMed/NCBI View Article : Google Scholar
|
|
5
|
Hwang WL, Hwang KL and Miyamoto DT: The
promise of circulating tumor cells for precision cancer therapy.
Biomark Med. 10:1269–1285. 2016.PubMed/NCBI View Article : Google Scholar
|
|
6
|
Guiliano M, Shaikh A, Lo HC, Arpino G, De
Placido S, Zhang XH, Cristofanilli M, Shiff R and Trivedi MV:
Perspective on circulating tumor cell clusters: Why it takes a
village to metastasize. Mol Cancer Res. 78:845–852. 2018.PubMed/NCBI View Article : Google Scholar
|
|
7
|
Lee M, Kim EJ, Cho Y, Kim S, Chung HH,
Park NH and Song YS: Predictive value of circulating tumor cells
(CTCs) captured by microfluidic device in patients with epithelial
ovarian cancer. Gynecol Oncol. 145:361–365. 2017.PubMed/NCBI View Article : Google Scholar
|
|
8
|
Koshkin V, Kochmann S, Sorupanathan A,
Peng C, Ailles LE, Liu G and Krylov SN: Cytometry of reaction rate
constant: Measuring reaction rate constant in individual cells to
facilitate robust and accurate analysis of cell-population
heterogeneity. Anal Chem. 91:4186–4194. 2019.PubMed/NCBI View Article : Google Scholar
|
|
9
|
Koshkin V, Bleker de Oliveira M, Peng C,
Ailles LE, Liu G, Covens A and Krylov SN: Spheroid-based approach
to assess the tissue relevance of analysis of dispersed-settled
tissue cells by cytometry of the reaction rate constant. Anal Chem.
92:9348–9355. 2020.PubMed/NCBI View Article : Google Scholar
|
|
10
|
Durand RE: Flow cytometry studies of
intracellular adriamycin in multicell spheroids in vitro. Cancer
Res. 41:3495–3498. 1981.PubMed/NCBI
|
|
11
|
Xu G, Zhong Y, Munir S, Yang BB, Tsang BK
and Peng C: Nodal induces apoptosis and inhibits proliferation in
human epithelial ovarian cancer cells via activin receptor-like
kinase 7. J Clin Endocrinol Metab. 89:5523–5534. 2004.PubMed/NCBI View Article : Google Scholar
|
|
12
|
Sasaki H, Sheng Y, Kotsuji F and Tsang BK:
Down-regulation of X-linked inhibitor of apoptosis protein induces
apoptosis in chemoresistant human ovarian cancer cells. Cancer Res.
60:5659–5666. 2000.PubMed/NCBI
|
|
13
|
Jendželovská Z, Jendželovský R, Hiľovská
L, Kovaľ J, Mikeš J and Fedoročko P: Single pre-treatment with
hypericin, a St. John's wort secondary metabolite, attenuates
cisplatin- and mitoxantrone-induced cell death in A2780, A2780cis
and HL-60 cells. Toxicol In Vitro. 28:1259–1273. 2014.PubMed/NCBI View Article : Google Scholar
|
|
14
|
Raghavan S, Ward MR, Rowley KR, Wold RM,
Takayama S, Buckanovich RJ and Mehta G: Formation of stable small
cell number three-dimensional ovarian cancer spheroids using
hanging drop arrays for preclinical drug sensitivity assays.
Gynecol Oncol. 138:181–189. 2015.PubMed/NCBI View Article : Google Scholar
|
|
15
|
Ween MP, Armstrong MA, Oehler MK and
Ricciardelli C: The role of ABC transporters in ovarian cancer
progression and chemoresistance. Crit Rev Oncol Hematol.
96:220–256. 2015.PubMed/NCBI View Article : Google Scholar
|
|
16
|
Cunnea P and Stronach EA: Modeling
platinum sensitive and resistant high-grade serous ovarian cancer:
Development and applications of experimental systems. Front Oncol.
4(81)2014.PubMed/NCBI View Article : Google Scholar
|
|
17
|
Li N, Zuo H, Chen L, Liu H, Zhou J, Yao Y,
Xu B, Gong H, Weng Y, Hu Q, et al: Circfulating tumor cell
detection in epithelial ovarian cancer using dual-component
antibodies targeting EpCAM and FRα. Cancer Manag Res.
11:109939–10948. 2019.PubMed/NCBI View Article : Google Scholar
|
|
18
|
Mahdizadeh S, Karimi G, Behravan J,
Arabzadeh S, Lage H and Kalalinia F: Crocin suppresses multidrug
resistance in MRP overexpressing ovarian cancer cell line. Daru.
24(17)2016.PubMed/NCBI View Article : Google Scholar
|
|
19
|
Friedrich J, Seidel C, Ebner R and
Kunz-Schughart LA: Spheroid-based drug screen: Considerations and
practical approach. Nat Protoc. 4:309–324. 2009.PubMed/NCBI View Article : Google Scholar
|
|
20
|
Frankel A, Buckman R and Kerbel RS:
Abrogation of taxol-induced G2-M arrest and apoptosis in human
ovarian cancer cells grown as multicellular tumor spheroids. Cancer
Res. 57:2388–2393. 1997.PubMed/NCBI
|
|
21
|
Acker H, Carlsson J, Holtermann G,
Nederman T and Nylén T: Influence of glucose and buffer capacity in
the culture medium on growth and pH in spheroids of human thyroid
carcinoma and human glioma origin. Cancer Res. 47:3504–3508.
1987.PubMed/NCBI
|
|
22
|
Morrow CS, Peklak-Scott C, Bishwokarma B,
Kute TE, Smitherman PK and Townsend AJ: Multidrug resistance
protein 1 (MRP1, ABCC1) mediates resistance to mitoxantrone via
glutathione-dependent drug efflux. Mol Pharmacol. 69:1499–1505.
2006.PubMed/NCBI View Article : Google Scholar
|
|
23
|
Nakano A, Tsuji D, Miki H, Cui Q, El Sayed
SM, Ikegame A, Oda A, Amou H, Nakamura S, Harada T, et al:
Glycolysis inhibition inactivates ABC transporters to restore drug
sensitivity in malignant cells. PLoS One. 6(e27222)2011.PubMed/NCBI View Article : Google Scholar
|
|
24
|
Teng YN, Hsieh YW, Hung CC and Lin HY:
Demethoxycurcumin modulates human P-glycoprotein function via
uncompetitive inhibition of ATPase hydrolysis activity. J Agric
Food Chem. 63:847–855. 2015.PubMed/NCBI View Article : Google Scholar
|
|
25
|
Ham SL, Joshi R, Thakuri PS and Tavana H:
Liquid-based three-dimensional tumor models for cancer research and
drug discovery. Exp Biol Med (Maywood). 241:939–954.
2016.PubMed/NCBI View Article : Google Scholar
|
|
26
|
Szakács G, Annereau JP, Lababidi S,
Shankawaram U, Arciello A, Bussey KJ, Reinhold W, Guo Y, Kruh GD,
Reimers M, et al: Predicting drug sensitivity and resistance:
Profiling ABC transporter genes in cancer cells. Cancer Cell.
6:129–137. 2004.PubMed/NCBI View Article : Google Scholar
|
|
27
|
Howard GR, Johnson KE, Rodriguez Ayala A,
Yankeelov TE and Brock A: A multi-state model of chemoresistance to
characterize phenotypic dynamics in breast cancer. Sci Rep.
8(12058)2018.PubMed/NCBI View Article : Google Scholar
|
|
28
|
Sun FF, Hu YH, Xiong LP, Tu XY, Zhao JH,
Chen SS, Song J and Ye XQ: Enhanced expression of stem cell markers
and drug resistance in sphere-forming non-small cell lung cancer
cells. Int J Clin Exp Pathol. 8:6287–6300. 2015.PubMed/NCBI
|
|
29
|
He M, Wu H, Jiang Q, Liu Y, Han Li, Yan Y,
Wei B, Liu F, Deng X, Chen H, et al: Hypoxia-inducible factor-2α
directly promotes BCRP expression and mediates the resistance of
ovarian cancer stem cells to adriamycin. Mol Oncol. 13:403–421.
2019.PubMed/NCBI View Article : Google Scholar
|
|
30
|
Hallas-Potts A, Dawson JC and Herrington
CS: Ovarian cancer cell lines derived from non-serous carcinomas
migrate and invade more aggressively than those derived from
high-grade serous carcinomas. Sci Rep. 9(5515)2019.PubMed/NCBI View Article : Google Scholar
|
|
31
|
Partin AW, Schoeniger JS, Mohler JL and
Coffey DS: Fourier analysis of cell motility: Correlation of
motility with metastatic potential. Proc Natl Acad Sci USA.
86:1254–1258. 1989.PubMed/NCBI View Article : Google Scholar
|
|
32
|
Galarza S, Kim H, Atay N, Peyton SR and
Munson JM: 2D or 3D? How cell motility measurements are conserved
across dimensions in vitro and translate in vivo. Bioeng Transl
Med. 5(e10148)2019.PubMed/NCBI View Article : Google Scholar
|
|
33
|
Luzhansky ID, Schwartz AD, Cohen JD,
MacMunn JP, Barney LE, Jansen LE and Peyton SR: Anomalously
diffusing and persistently migrating cells in 2 and 3D culture
environments. APL Bioeng. 2(026112)2018.PubMed/NCBI View Article : Google Scholar
|
|
34
|
Raghavan S, Mehta P, Horst EN, Ward MR,
Rowley KR and Mehta G: Comparative analysis of tumor spheroid
generation techniques for differential in vitro drug toxicity.
Oncotarget. 7:16948–16961. 2016.PubMed/NCBI View Article : Google Scholar
|