Introduction
Adenocarcinoma is the most common histological type
of nonsmall cell lung cancer (NSCLC) (1). In 2011, a new histological typing for
lung adenocarcinoma was established in the consensus classification
by the International Association for the Study of Lung
Cancer/American Thoracic Society/European Respiratory Society
(IASLC/ATS/ERS) (2). This
classification includes three main subtypes: Adenocarcinoma in
situ (AIS), minimally invasive adenocarcinoma (MIA) and
invasive adenocarcinoma. Invasive adenocarcinoma consists of five
patterns, according to the predominant histological type (lepidic,
papillary, acinar, solid or micropapillary pattern) (2). The prognosis of AIS and MIA is
favorable, with a 5-year survival rate of 100% for both tumor types
following surgical resection. However, invasive adenocarcinoma,
excluding the lepidic predominant pattern, has a relatively less
favorable prognosis compared with AIS and MIA, even in the case of
smaller tumors (3-5).
Lee et al (4) reported that
the 5-year disease-free survival rate for invasive adenocarcinoma
with a maximum tumor size ≤3 cm after surgical resection varied
from 50-93% according to the histological pattern. Kadota et
al (5) reviewed tumor slides
with pathological stage I lung adenocarcinoma (TNM classification,
7th edition) (6), and showed that
the 5-year cumulative incidence of recurrence was 0% in patients
with AIS and MIA, 8% in lepidic predominant invasive adenocarcinoma
and 19% in non-lepidic predominant invasive adenocarcinoma. The
patients after surgical resection of early-stage lung
adenocarcinoma are commonly follow-up without adjuvant therapy. But
they also contain some worse prognostic cases. Therefore, various
biomarkers for predicting the prognosis of patients following
surgical resection have been suggested, particularly for
early-stage lung adenocarcinoma (4,7,8). It is
important that the patients after operation are classified in
personalized follow-up schedule according to prognostic biomarker
even in earlier stage.
Periostin is an extracellular matrix protein
initially identified as OSF-2 in the mouse MC3T3-E1 osteoblastic
cell line (9). In humans, the
protein is composed of ~800 amino acids, having a molecular weight
of 90 kDa (10). As a matricellular
protein, periostin has defined functions in osteology, tissue
repair, oncology, the cardiovascular and respiratory systems, as
well as in various inflammatory settings and diseases (11,12).
In oncology, periostin upregulation has been observed in various
types of neoplasms (13-18),
and the protein is hypothesized to serve a role in invasion,
angiogenesis and metastasis in vitro and in vivo
(13). In patients with NSCLC,
periostin expression is associated with overall survival and/or
tumor invasiveness (15,19); however, previous studies on NSCLC
have included patients of various stages and histological types,
and the correlation between periostin expression and the prognosis
of lung adenocarcinoma at earlier stages has not been assessed, to
the best of our knowledge.
As an imaging technique commonly used for NSCLC,
several studies have reported an association between pre-operative
computed tomography (CT) findings and postoperative prognosis
(20-24).
These studies all reported that a large degree of ground-glass
opacity (GGO) on a pre-operative CT scan is indicative of a
favorable prognosis, whereas a large solid component is associated
with a poorer outcome. However, one disadvantage was that the
patients included in these studies had varying degrees of tumor
invasiveness, tumor stages and histological types.
In an attempt to shed further light on this issue,
in the present study small lung adenocarcinomas (excluding AIS and
MIA) were examined. The cases were limited to those of T1
adenocarcinoma (TNM classification, 8th edition) (25) that were also pathologically
diagnosed as invasive adenocarcinoma according to the present
IASLC/ATS/ERS histological classification (2). To the best of our knowledge, there are
no previous reports comprehensively evaluating the prognosis using
both imaging characteristics and histological features, including
an analysis of the periostin expression level in patients with
NSCLC. In the present study, the value of thin-section CT findings
and histological features, including periostin immunostaining, in
predicting outcomes in patients after resection of T1 invasive lung
adenocarcinoma were determined.
Patients and methods
Study subjects
The Ethics Committee of Kurume University (approval
no. 09113) approved this retrospective study, and waived the
requirement for informed consent. A total of 95 consecutive
patients were included in the present study who met the following
inclusion criteria when retrospectively screened: i) surgical
resection was performed at Kurume University Hospital between
January 2000 and December 2009 with a chest thin-section CT scan
within the 4 weeks prior to surgery; ii) a histopathological
diagnosis of invasive adenocarcinoma was made with a solid
component measuring ≤3 cm on the thin-section CT scan; and iii) no
invasion of the visceral pleura was observed upon histopathological
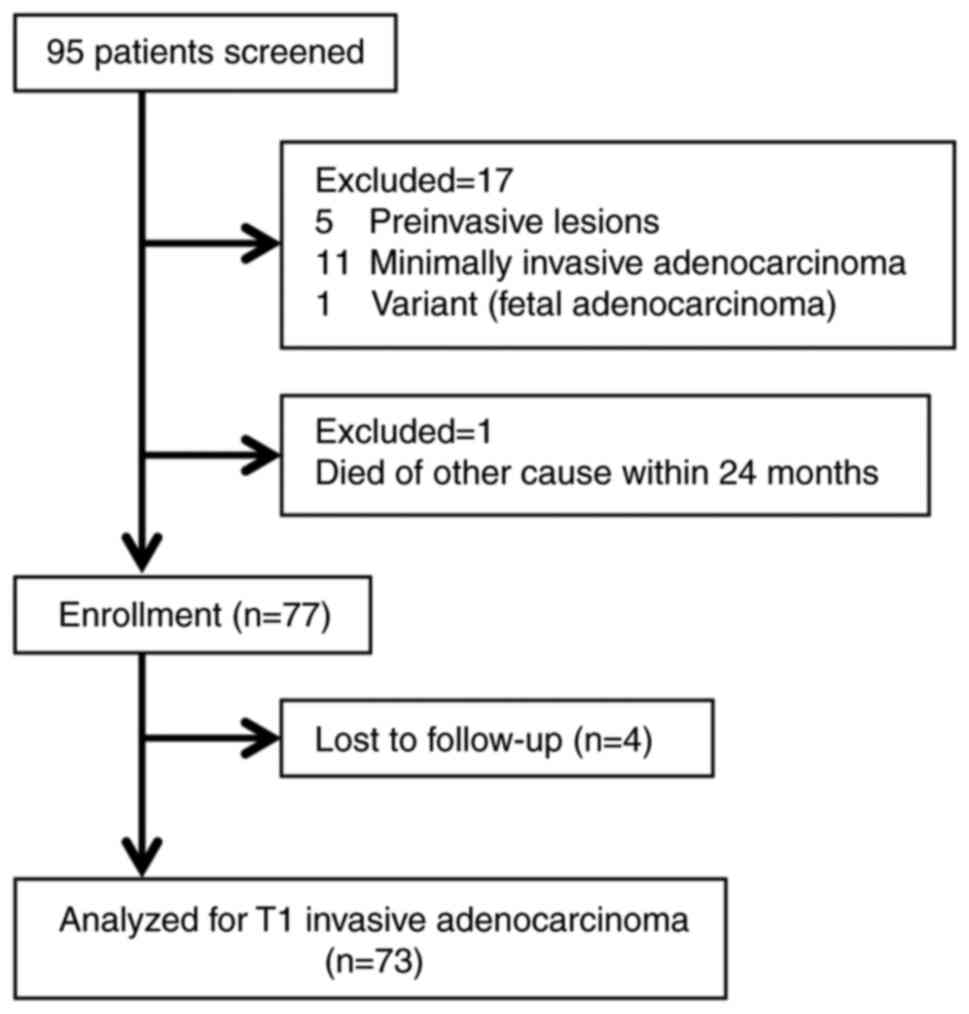
analysis. Of the 95 consecutive patients who met the inclusion
criteria, 22 were excluded from the study: 17 were excluded due to
inadequate pathological findings, 4 patients were lost to
follow-up, and 1 patient died of a cause other than cancer within
24 months following surgery. Ultimately, a total of 73 patients (39
men and 34 women) were included (Fig.
1). The basic operative procedure was a lobectomy with regional
mediastinal and hilar lymph node dissection (26). None of the recruited patients had
received any pre-operative therapies.
Postoperative adjuvant therapy, including
chemotherapy, radiation or other therapies, were performed for the
patients in accordance with established criteria.
CT scans and interpretation of
images
Pre-operative CT was performed with a variety of
scanners (16-, 64- and 128-channel multidetectors). All CT
examinations were obtained from the lung apices to the middle
portion of both kidneys on full inspiration whilst the patient was
in the supine position. Scanning parameters were as follows:
Kilovoltage peak (kVp) and current, 120 kVp and 150-450 mA,
respectively; rotation, 0.35-0.5 sec; pitch, 0.984-0.992:1; section
thickness, 1.25 mm; matrix, 512x512; and field of view, 35 cm.
These imaging data were reconstructed with a high spatial frequency
algorithm at a thickness of 1.25 mm. All images were interpreted
using a window width of 1,500-1,600 Hounsfield units (HU) and a
window level of -600 to -700 HU for the lung window settings, and a
window width of 350-400 HU and a window level of 30-40 HU for the
mediastinal window settings (27).
The CT findings were assessed independently by two
board-certified chest radiologists (with 17 and 31 years of
experience, respectively) without knowledge of any clinical or
histological findings, with the exception that all pulmonary
nodules had been pathologically diagnosed as primary lung
adenocarcinoma. When the results from the two observers differed,
final decisions were reached by consensus after calculation of the
independent interobserver agreement (κ statistic). Morphological
findings on thin-section CT for small invasive adenocarcinomas were
evaluated for the following seven parameters: i) contour; ii)
part-solid ground-glass nodule (GGN) or solid nodule; iii)
percentage of the solid component (CT solid score); iv) presence of
air-bronchogram and/or bubble-like lucencies; v) number of involved
vessels in the tumor; and the vi) shape and vii) number of linear
strands between the nodule and the visceral pleura (Fig. 2). Tumor contour was characterized as
being either smooth or irregular. For the evaluation of tumor size,
the longest diameters of the solid component and of the whole
nodule, including GGO, were measured. Measurements were performed
following multiplanar reformation in the plane showing the longest
diameters. The CT solid score was calculated by dividing the
longest diameter of the solid component by the longest diameter of
the whole nodule, and multiplying by 100. The subjects were divided
into two groups based on the CT solid score to evaluate the
association between the prognosis and solid scoring. The threshold
of solid score for the grouping was calculated using receiver
operating characteristic (ROC) curve analysis to obtain the highest
sensitivity and specificity for predicting recurrence and death.
The criteria for air-bronchogram and/or bubble-like lucencies were
the same as those described previously (28-30).
Concerning the linear strands between the nodule and visceral
pleura, it was hypothesized that it would be possible to discern
central fibrotic changes of the tumor. Linear strands were divided
into two groups according to the morphological feature on CT: Type
1, none or fine; and type 2, coarse or triangular (Fig. 2). If the lesion had linear strands
of both fine shape and coarse or triangular shape, it was
categorized as type 2. Involved vessels were considered as all
those abutting the nodule, and this was stratified on multiplanar
reformations as being 2 vessels and over or less. Recurrence on
follow-up CT included both local recurrence and distant
metastases.
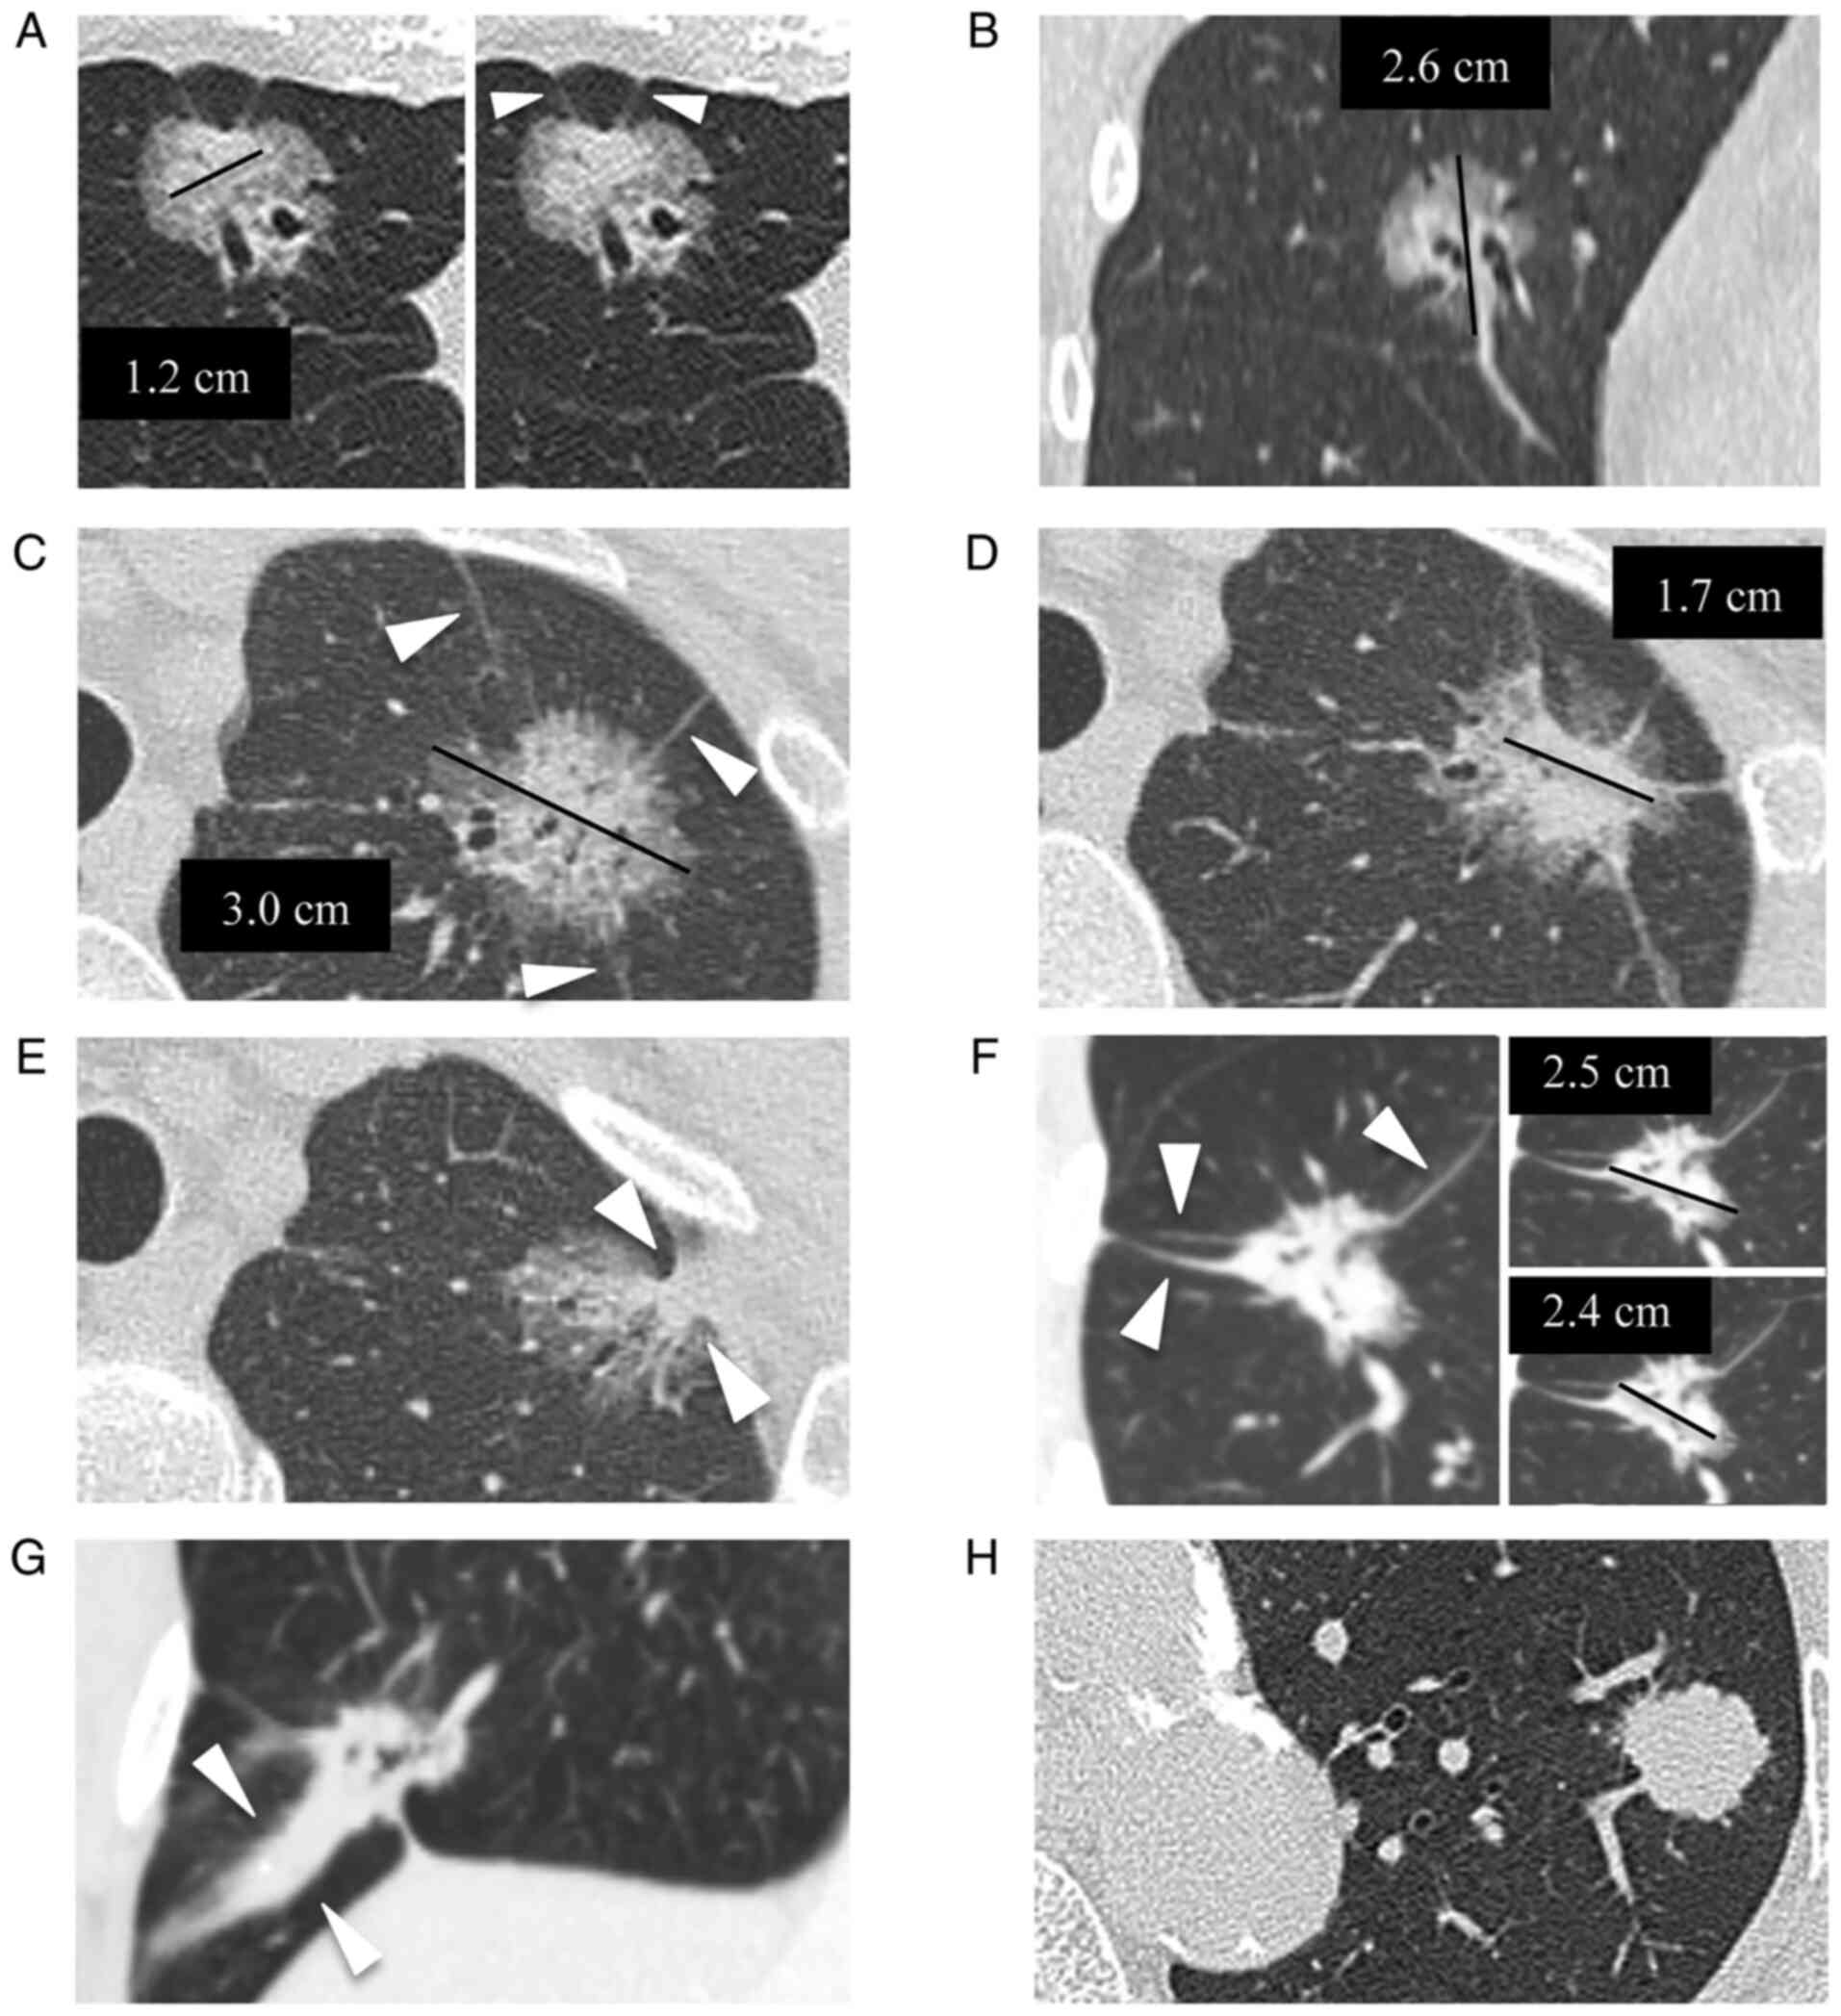 | Figure 2Examples of thin-section CT image
parameters. (A) A part-solid GGN in a 63-year-old woman located at
the right middle lobe, showing smooth contour, pathologically
diagnosed as invasive adenocarcinoma (papillary predominant). The
maximal diameter of the solid component was obtained at axial
image. The black line indicates the traced maximal diameter of the
solid part, which was measured as 1.2 cm. The shape of the linear
strand between the nodule and the visceral pleura (number, ≥2) was
fine (arrow heads). (B) Coronal image using MPR of the same patient
as in (A). The maximal diameter of the whole nodule was obtained at
coronal image. The black line indicates the traced maximal
diameter, which was measured as 2.6 cm. The CT solid score was
calculated as 46% (solid part, 1.2 cm/whole nodule, 2.6 cm). (C) A
part-solid GGN in a 62-year-old woman located at the left upper
lobe, showing irregular contour and air-bronchogram and/or
bubble-like lucencies, pathologically diagnosed as invasive
adenocarcinoma (lepidic predominant). The maximal diameter of the
whole nodule was obtained at axial image. The black line indicates
the traced maximal diameter measured as 3 cm. The number of linear
strands between the nodule and the visceral pleura was 3 (arrow
heads). (D) Different axial section of the same patient as in (C).
The maximal diameter of the solid component was also obtained at
axial image. The black line indicates the traced maximal diameter
of the solid part measured as 1.7 cm. The CT solid score was
calculated as 57% (solid part, 1.7 cm/whole nodule, 3.0 cm). (E)
Different axial section of the same patient as in (C and D). The
shape of the linear strand between the nodule and the visceral
pleura was triangular (arrow heads), which was categorized as type
2 (coarse or triangular). (F) A part-solid GGN in a 66-year-old man
located at the right lower lobe, showing irregular contour and
air-bronchogram and/or bubble-like lucencies, pathologically
diagnosed as invasive adenocarcinoma (papillary predominant). The
maximal diameters of solid component and the whole nodule were
obtained at the same axial section. The black line in the right
upper image indicates the traced maximal diameter of the whole
nodule measured as 2.5 cm, and the line in the right lower image
indicates the traced maximal diameter of the solid part measured as
2.4 cm. The CT solid score was calculated as 92% (solid part, 2.4
cm/whole nodule, 2.5 cm). The number of linear strands between the
nodule and the visceral pleura was 3 (arrow heads). (G) Coronal
image using MPR of the same patient as in (F). The shape of the
linear strand between the nodule and the visceral pleura was coarse
(arrow heads), which was categorized as type 2. (H) A solid nodule
without GGO in a 78-year-old man located at left upper lobe,
showing irregular contour, pathologically diagnosed as invasive
adenocarcinoma (acinar predominant). The maximal diameter of the
solid component corresponded to the whole nodule, measuring 2.0 cm
(CT solid score, 100%). Linear strands between the nodule and the
visceral pleura were not observed. GGN, ground-glass nodule; MPR,
multiplanar reformation; GGO, ground-glass opacity. |
Histopathological and
immunohistochemical staining and assessment
Resected lung tissues were fixed with formaldehyde,
and paraffin-embedded tissue sections were obtained. All cases were
classified according to the current TNM classification for lung
cancer described in the IASLC/ATS/ERS histological classification
(2), and the IASLC staging
classification (8th edition) (25)
by the consensus of two experienced pathologists (with 16 and 22
years of experience). Invasive adenocarcinomas were classified into
one of five predominant types: Lepidic predominant, acinar
predominant, papillary predominant, micropapillary predominant or
solid predominant with mucin production, and invasive mucinous
adenocarcinoma. Pathological T status, N status, lymphatic invasion
and vessel invasion were also assessed.
The procedure of immunohistochemical staining for
periostin was performed as previously described (11,16).
Tissue specimens were deparaffinized with xylene and serial
dilutions of ethanol, and then were washed three times for 5 min in
PBS (composition: pH 7.4, 130 mmol/l NaCl, 2 mmol/l
NaH2PO4 and 7 mmol/l
Na2HPO4) and then blocked with 10% skimmed
milk in PBS at room temperature for 30 min. Sections were incubated
overnight at 4˚C with an originally developed rat anti-human
periostin monoclonal antibody (SS19B or SS5D, diluted 1:100 in
PBS). After several washes with PBS, the sections were incubated
with the secondary antibody, namely biotin-labeled goat anti-rat
IgG (cat. no. #PK-4004; Vectastain ABC kit, Vector Laboratories,
Inc.) diluted 1:100 in PBS at room temperature for 1 h. The
sections were washed with PBS again, positive reactivity was
identified using a development reagent (Vectastain ABC kit) and the
section were then visualized with 3,3'-diaminobenzidine (Dako;
Agilent Technologies, Inc.).
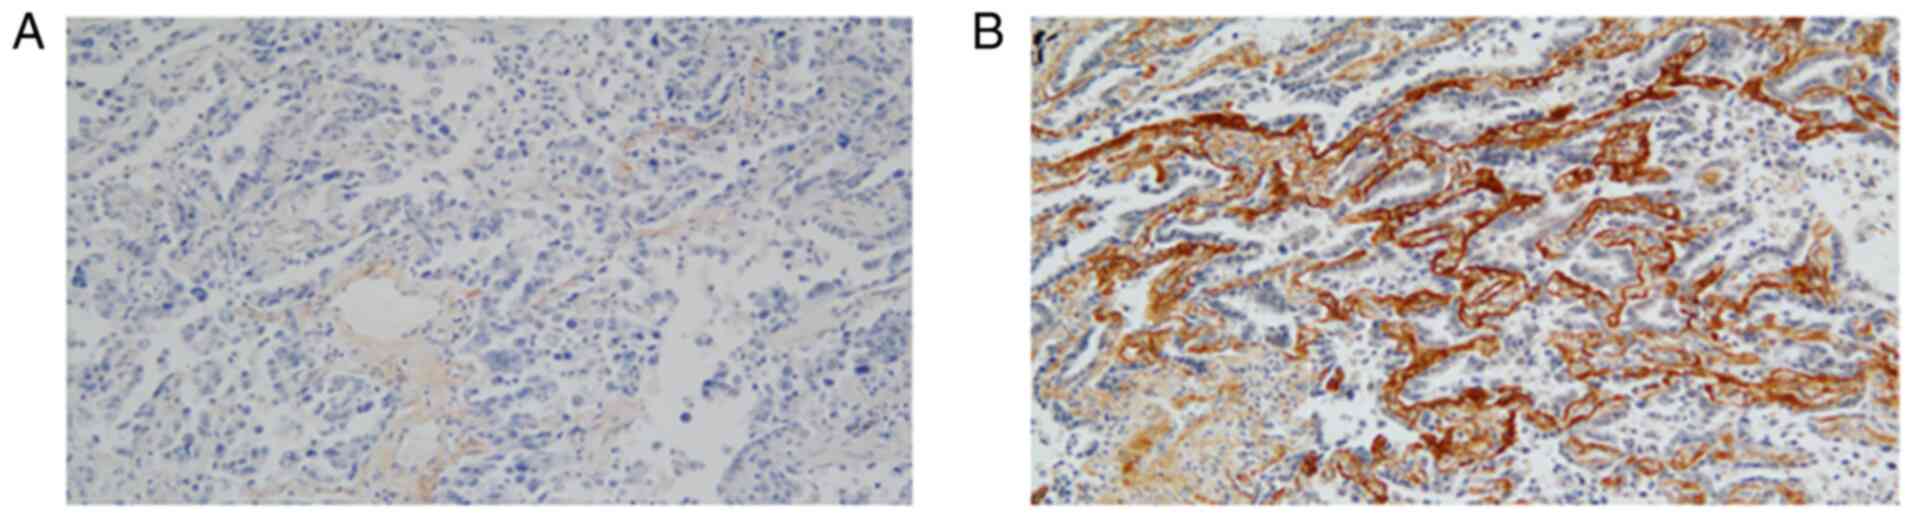
Periostin expression was evaluated on the basis of
the strength and extent of staining by an experienced pathologist
(33 years of experience) who was not one of the two pathologists
mentioned above, and who did not have knowledge of any other
clinical data or the CT findings. The strength was evaluated at the
strongest area of expression within the tumor, and was graded on a
4-point scale: 0, no stain; 1, weak; 2, moderate; or 3, strong. The
extent of staining was graded on a 3-point scale: 0, 0%; 1,
<50%; or 2, ≥50%. When the total score (sum of the strength and
extent of staining) was ≥4, periostin expression was defined as
high, whereas a score <4 was defined as low (Fig. 3) (17,18).
Statistical analysis
Interobserver agreements on thin-section CT
parameters were assessed using the κ statistic, defined as follows:
Poor, κ<0.0; slight, κ=0.0-0.20; fair, κ=0.21-0.40; moderate,
κ=0.41-0.60; substantial, κ=0.61-0.80; or almost perfect,
κ=0.81-1.00(31). Survival was
calculated from the date of surgery to the date of death or last
contact. In the latter group (patients with the date of death
unknown), survival was calculated using a right censoring survival
model. Survival outcomes were obtained either from the patients'
medical records or from the records of their primary care
physicians or surgeons.
Associations between recurrence or overall survival
(OS) and patient characteristics, pathological findings or CT
parameters were analyzed using a χ2 or Fisher's exact
test, as appropriate. Statistical differences for recurrence and OS
according to the patient's age at surgery (>65 or ≤65 years),
sex, IASLC/ATS/ERS histological typing, pathological lymphatic
invasion, pathological vessel invasion, pathological T status, N
status, each of the CT parameters described above, and periostin
expression were analyzed using univariate and multivariate Cox
proportional hazards regression models. All variables identified as
statistically significant were included in the multivariate model.
The Kaplan-Meier method was used to estimate time to recurrence or
death. In addition, the cumulative incidence of recurrence or
survival according to the risk factors assessed by multivariate
analysis were also calculated and analyzed using the log-rank test.
P<0.05 was considered to indicate a statistically significant
difference. All statistical analyses were performed using IBM SPSS
Statistics, version 23 (IBM Corp.).
Results
Patient characteristics and
pathological findings of resected specimen
The median age of the patients was 66 years (range,
45-85 years). Detailed clinicopathological characteristics of the
patients are provided in Table I.
During the follow-up period (median follow-up, 77 months; range,
11-218 months), recurrence occurred in 27 patients, and 46 patients
had no evidence of recurrence. A total of 12 patients died
following tumor recurrence. The interval between removal and
recurrence ranged from 5-94 months (median, 18 months), and the
interval until death ranged from 11-199 months (median, 54
months).
 | Table IComparison of patient characteristics
and pathological findings between the no recurrence (n=46) and
recurrence (n=27) groups, and between the survival (n=61) and death
(n=12) groups. |
Table I
Comparison of patient characteristics
and pathological findings between the no recurrence (n=46) and
recurrence (n=27) groups, and between the survival (n=61) and death
(n=12) groups.
| Categories | No recurrence, n
(%) | Recurrence, n
(%) |
P-valuea | Survival, n
(%) | Death, n (%) |
P-valuea |
|---|
| Age at surgery,
years | | | 0.057 | | | 0.221 |
|
≤65 | 18(39) | 17(63) | | 27(44) | 8(67) | |
|
>65 | 28(61) | 10(37) | | 34(56) | 4(33) | |
| Sex | | | 0.812 | | | >0.999 |
|
Male | 24(52) | 15(56) | | 33(54) | 6(50) | |
|
Female | 22(48) | 12(44) | | 28(46) | 6(50) | |
| WHO typing | | | 0.003 | | | 0.089 |
|
Lepidic
predominant | 4(9) | 3(11) | | 5(8) | 2(17) | |
|
Acinar
predominant | 3(6) | 11(41) | | 11(18) | 3(25) | |
|
Papillary
predominant | 28(61) | 6(22) | | 32(53) | 2(17) | |
|
Micropapillary
predominant | 4(9) | 2(7) | | 4(7) | 2(17) | |
|
Solid
predominant with mucin production | 3(6) | 4(15) | | 4(7) | 3(25) | |
|
Invasive
mucinous adenocarcinoma | 4(9) | 1(4) | | 5(8) | 0 (0) | |
| Pathological
lymphatic invasion | | | 0.028 | | | 0.759 |
|
Negative | 30(65) | 10(37) | | 34(56) | 6(50) | |
|
Positive | 16(35) | 17(63) | | 27(44) | 6(50) | |
| Pathological vessel
invasion | | | 0.623 | | | >0.999 |
|
Negative | 44(96) | 25(93) | | 57(93) | 12(100) | |
|
Positive | 2(4) | 2(7) | | 4(7) | 0 (0) | |
| Pathological T
status | | | 0.041 | | | 0.211 |
|
1a | 12(26) | 1(4) | | 13(21) | 0 (0) | |
|
1b | 24(52) | 16(59) | | 32(53) | 8(67) | |
|
1c | 10(22) | 10(37) | | 16(26) | 4(33) | |
| Pathological N
status | | | <0.001 | | | 0.987 |
|
Negative | 42(91) | 12(44) | | 45(74) | 9(75) | |
|
n1 | 1(2) | 6(22) | | 6(10) | 1(8) | |
|
n2 | 3(7) | 9(33) | | 10(16) | 2(17) | |
| Periostin
expression | | | 0.003 | | | >0.999 |
|
Low | 31(67) | 8(30) | | 33(54) | 6(50) | |
|
High | 15(33) | 19(70) | | 28(46) | 6(50) | |
Among patient age, sex and pathological findings,
statistically significant differences were identified between
patients with and without recurrence based on histological typing
(P=0.003), pathological lymphatic invasion (P=0.028), T status
(P=0.041), N status (P<0.001) and periostin expression (P=0.003)
(Table I). Within the histological
subtypes, patients with the acinar predominant type exhibited more
instances of recurrence (11 cases of recurrence and 3 cases without
recurrence), and patients with the papillary predominant type
exhibited fewer cases of recurrence (6 cases of recurrence and 28
cases of no recurrence; Table I).
In the micropapillary type, which is associated with a poor
prognosis in general, recurrence occurred in one-third of patients
(2 out of 6 patients). However, univariate analysis with Cox
proportional hazards regression models revealed no significant
difference between the histological subtype and recurrence.
CT parameters prior to surgery
There was a substantial to almost perfect agreement
between the two observers in terms of the classification of the
seven thin-section CT parameters (κ=0.64-0.85; Table II). Among the CT parameters, only
the CT solid score was significantly correlated with postoperative
recurrence (P=0.001; Table II).
ROC analysis was performed to define the appropriate threshold of
the CT solid score. The area under the curve (AUC) for predicting
recurrence was 0.70 [95% confidence interval (CI), 0.58-0.82] and
the AUC for predicting death was 0.62 (95% CI, 0.48-0.77). Both AUC
gave the highest sensitivity and specificity when the threshold of
the CT solid score was 80%. Recurrence occurred in 50% (25 out of
50 patients) of patients with a CT solid score >80%, compared
with only 9% (2 out of 23 patients) of those with a CT solid score
≤80%.
| Table IIComparison of CT parameters between
the no recurrence (n=46) and recurrence (n=27) groups, and between
the survival (n=61) and death (n=12) groups. |
Table II
Comparison of CT parameters between
the no recurrence (n=46) and recurrence (n=27) groups, and between
the survival (n=61) and death (n=12) groups.
| Parameters | Interobserver
agreements, k value (lower to upper 95% confidence
intervals)a | No recurrence, n
(%) | Recurrence, n
(%) |
P-valueb | Survival, n
(%) | Death, n (%) |
P-valueb |
|---|
| Contour | 0.64
(0.30-0.98) | | | 0.623 | | | 0.521 |
|
Smooth | | 2(4) | 2(7) | | 3(5) | 1(8) | |
|
Irregular | | 44(96) | 25(93) | | 58(95) | 11(92) | |
| Type of nodule | 0.83
(0.71-0.96) | | | 0.057 | | | 0.533 |
|
Part-solid
GGN | | 28(61) | 10(37) | | 33(54) | 5(42) | |
|
Solid
nodule | | 18(39) | 17(53) | | 28(46) | 7(58) | |
| CT solid score,
% | 0.71
(0.52-0.90) | | | 0.001 | | | 0.089 |
|
≤80 | | 21(46) | 2(7) | | 22(36) | 1(8) | |
|
>80 | | 25(54) | 25(93) | | 39(64) | 11(92) | |
| Air-bronchogram
and/or bubble-like lucencies | 0.85
(0.73-0.97) | | | 0.085 | | | 0.720 |
|
Absence | | 32(70) | 24(89) | | 46(75) | 10(83) | |
|
Presence | | 14(30) | 3(11) | | 15(25) | 2(17) | |
| Involved vessels,
n | 0.70
(0.53-0.86) | | | 0.331 | | | 0.124 |
|
<2 | | 27(59) | 12(44) | | 30(49) | 9(75) | |
|
≥2 | | 19(41) | 15(56) | | 31(51) | 3(25) | |
| Linear strands
(shape) | 0.75
(0.60-0.90) | | | >0.999 | | | 0.761 |
|
Type 1 (none
or fine) | | 25(54) | 14(52) | | 32(53) | 7(58) | |
|
Type 2
(Coarse or triangular) | | 21(46) | 13(48) | | 29(47) | 5(42) | |
| Linear strands,
n | 0.68
(0.48-0.89) | | | 0.532 | | | 0.438 |
|
<2 | | 39(85) | 21(78) | | 51(84) | 9(75) | |
|
≥2 | | 7(15) | 6(22) | | 10(16) | 3(25) | |
Univariate analysis using the Cox proportional
hazards model for recurrence (Table
III) found that pathological lymphatic invasion [hazard ratio
(HR), 3.16; 95% CI, 1.40-7.14; P=0.006], pathological T1b vs. T1a
(HR, 7.93; 95% CI, 1.01-62.50; P=0.048), pathological N1 vs. N0
(HR, 4.26; 95% CI, 1.79-10.10; P=0.001), CT solid score >80 vs.
≤80% (HR, 6.85; 95% CI, 1.62-29.41; P=0.009), and high periostin
expression vs. low (HR, 3.46; 95% CI, 1.51-7.94; P=0.003) were
significant predictors of recurrence. In the multivariate analysis
(Table IV), a CT solid score
>80% (HR, 10.10; 95% CI, 2.29-45.46; P=0.002) and high periostin
expression (HR, 3.72; 95% CI, 1.35-10.31; P=0.011) remained
significant for recurrence.
| Table IIIUnivariate analysis using the Cox
proportional hazards model for recurrence and overall survival. |
Table III
Univariate analysis using the Cox
proportional hazards model for recurrence and overall survival.
| | Recurrence | Overall
survival |
|---|
| | 95% CI | | 95% CI | |
|---|
| Explanatory
variables | HR | Lower | Upper | P-value | HR | Lower | Upper | P-value |
|---|
| Age at surgery
(>65 vs. ≤65 years) | 2.08 | 0.95 | 4.54 | 0.066 | 2.24 | 0.68 | 7.45 | 0.187 |
| Sex (male vs.
female) | 1.06 | 0.49 | 2.28 | 0.883 | 1.10 | 0.35 | 3.41 | 0.870 |
| Histological typing
(vs. lepidic predominant) | | | | | | | | |
|
Acinar
predominant | 3.60 | 0.37 | 34.98 | 0.270 | 0.51 | 0.11 | 2.32 | 0.382 |
|
Papillary
predominant | 7.44 | 0.95 | 58.09 | 0.056 | 0.64 | 0.17 | 2.37 | 0.506 |
|
Micropapillary
predominant | 1.48 | 0.18 | 12.51 | 0.718 | 4.20 | 0.92 | 19.40 | 0.065 |
|
Solid
predominant with mucin production | 2.38 | 0.22 | 26.35 | 0.479 | 0.49 | 0.11 | 2.24 | 0.355 |
|
Invasive
mucinous adenocarcinoma | 4.82 | 0.53 | 43.52 | 0.161 | 0.59 | 0.20 | 1.71 | 0.334 |
| Pathological
lymphatic invasion (presence vs. absence) | 3.16 | 1.40 | 7.14 | 0.006 | 1.53 | 0.48 | 4.80 | 0.468 |
| Pathological vessel
invasion (presence vs. absence) | 1.12 | 0.26 | 4.81 | 0.879 | 22.00 | 0.00 | 566.44 | 0.611 |
| Pathological T
status (vs. T1a) | | | | | | | | |
|
T1b | 7.93 | 1.01 | 62.50 | 0.048 | 1.53 | 0.46 | 5.09 | 0.488 |
|
T1c | 1.44 | 0.65 | 3.19 | 0.376 | 1.07 | 0.32 | 3.57 | 0.907 |
| Pathological N
status (vs. N0) | | | | | | | | |
|
N1 | 4.26 | 1.79 | 10.10 | 0.001 | 1.30 | 0.28 | 5.88 | 0.772 |
|
N2 | 1.14 | 0.40 | 3.23 | 0.808 | 1.39 | 0.13 | 14.29 | 0.722 |
| Contour (irregular
vs. smooth) | 1.20 | 0.28 | 5.07 | 0.805 | 1.47 | 0.19 | 11.36 | 0.715 |
| Part-solid GGN (vs.
solid nodule) | 0.56 | 0.25 | 1.22 | 0.138 | 0.63 | 0.20 | 1.99 | 0.433 |
| CT solid score
(>80 vs. ≤80%) | 6.85 | 1.62 | 29.41 | 0.009 | 6.20 | 0.80 | 47.61 | 0.081 |
| Air-bronchogram
and/or bubble-like lucencies (presence vs. absence) | 2.55 | 0.77 | 8.49 | 0.126 | 1.81 | 0.39 | 8.29 | 0.419 |
| Involved vessels, n
(≥2 vs. <2) | 1.44 | 0.67 | 3.13 | 0.346 | 2.58 | 0.69 | 9.55 | 0.156 |
| Linear strands
shape [type 2 (coarse or triangular) vs. type 1 (none or
fine)] | 1.36 | 0.64 | 2.90 | 0.425 | 1.03 | 0.33 | 3.25 | 0.960 |
| Linear strands, n
(≥2 vs. <2) | 1.74 | 0.69 | 4.33 | 0.236 | 0.59 | 0.16 | 2.17 | 0.423 |
| Periostin
expression (high vs. low) | 3.46 | 1.51 | 7.94 | 0.003 | 0.69 | 0.22 | 2.14 | 0.517 |
| Table IVMultivariate analysis using the Cox
proportional hazards model for recurrence. |
Table IV
Multivariate analysis using the Cox
proportional hazards model for recurrence.
| | Recurrence |
|---|
| | 95% CI | |
|---|
| Explanatory
variables | HR | Lower | Upper | P-values |
|---|
| CT solid score
(>80 vs. ≤80%) | 10.10 | 2.29 | 45.46 | 0.002 |
| Periostin
expression (high vs. low) | 3.72 | 1.35 | 10.31 | 0.011 |
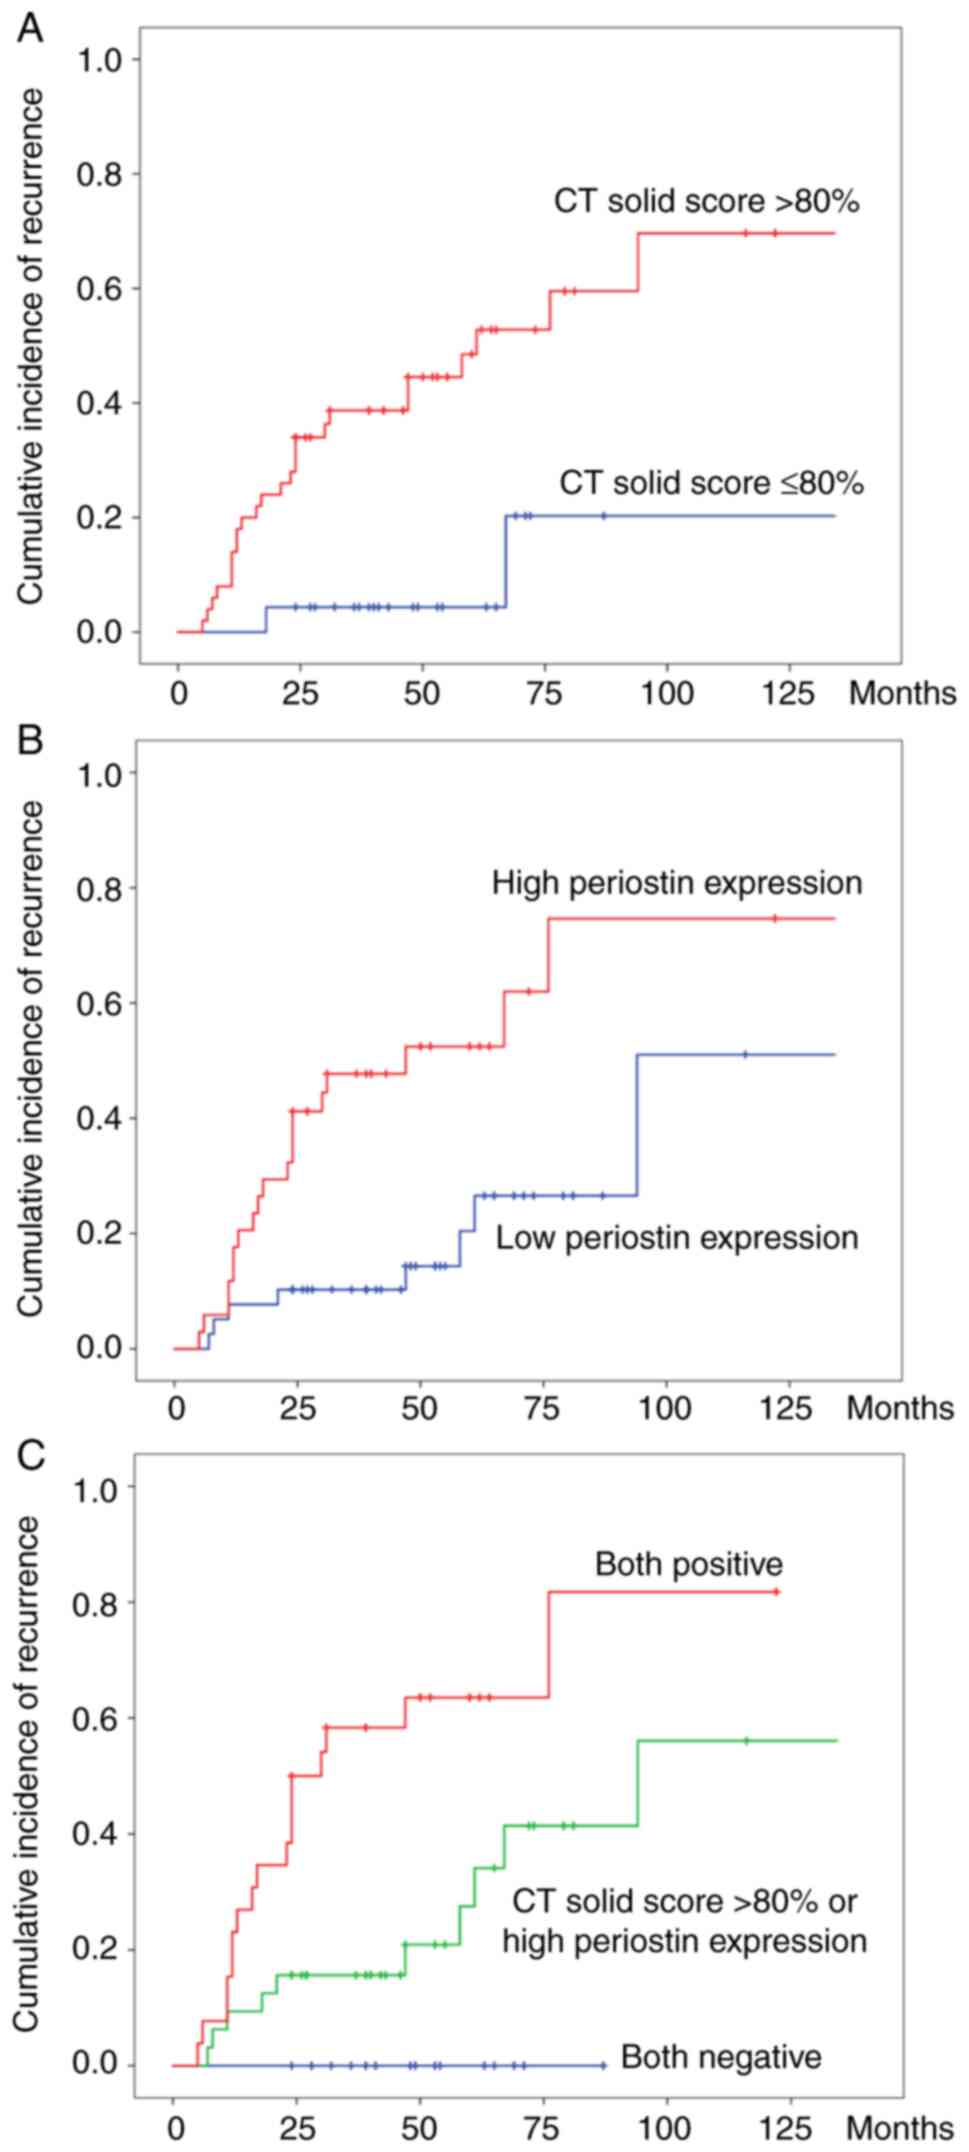
Combined analysis of the CT solid
score and periostin expression
The cumulative incidence of recurrence according to
the CT solid score and periostin expression was calculated
(Fig. 4A and B). The cumulative incidence of recurrence
was higher in patients with a CT solid score >80% and high
periostin expression compared with patients with a CT solid score
≤80% and low periostin expression. Furthermore, the cumulative
recurrence rates among the three groups (both negative, CT solid
score >80% or high periostin expression, and both positive) were
significantly different (log-rank, P<0.001; Fig. 4C). On the other hand, univariate
analysis using the Cox proportional hazards model for OS did not
reveal any significant levels of association with any of the
evaluated factors.
Discussion
Various biomarkers for predicting the prognosis of
patients following surgical resection have been suggested,
particularly for early-stage lung adenocarcinoma, which possibly
includes poorer prognostic cases. Therefore, the aim of the present
study was to search for potential alternative predictive factors,
in addition to the preoperative CT finding. In the present study,
it has been shown that the combined analysis of CT finding (the CT
solid score) and pathological feature (periostin expression) could
predict the likelihood of tumor recurrence more precisely than
working on the basis of the CT findings only. The cumulative
recurrence rates among the three groups (both negative, CT solid
score >80% or high periostin expression, and both positive) were
significantly different (log-rank, P<0.001; Fig. 4C). Notably, the cumulative
recurrence rate of the ‘both-negative’ group was revealed to be
zero. Therefore, even though CT reveals the presence of a solid
component in T1 adenocarcinoma, when the solid component is ≤80% on
thin-section CT and the periostin expression is weak in the
pathological specimen, the risk of recurrence is very low. These
results may contribute towards the provision of a more personalized
treatment schedule, even in cases with the same T1 invasive
adenocarcinoma.
As an imaging biomarker, previous studies have
suggested that the solid component of the tumor on thin-section CT
scans is associated with tumor invasiveness (20,24,32).
Present T status also gives great weight to solid component during
tumor evaluation, therefore the value of the CT solid score of the
tumor on preoperative CT scans was evaluated. Asamura et al
(33) reported that the
consolidation/tumor ratio (CTR) on preoperative CT could be used to
predict survival outcomes in patients with non-invasive
adenocarcinoma of the lung. They reported that T1 tumors with a
smaller CTR had radiographically excellent prognostic
characteristics and may show non-invasive adenocarcinomas. However,
their study included pathologically non-invasive cases, which may
have a more favorable prognosis. Among adenocarcinomas, the
prognosis of AIS and MIA is generally favorable. These types of
tumors predominantly consist of GGO on CT images, and several
studies have revealed that the extent of GGO is a favorable
prognostic factor, as GGO represents the less invasive component of
adenocarcinoma as ‘lepidic’ growth. Therefore, the present study
was limited to the assessment of invasive adenocarcinomas.
As a pathological biomarker, periostin expression
was examined using immunohistological staining. A previous study
showed that periostin acts as a ligand of integrin, which is a
cell-surface receptor that activates the PI3-K/Akt pathway and
promotes cancer cell survival, epithelial-mesenchymal transition,
invasion and metastasis (13).
Sasaki et al (15) suggested
that periostin could be involved in cell adhesion and invasion
in vitro. Murakami et al (34) investigated periostin expression
quantitatively in NSCLC via immunohistochemical analysis, and they
demonstrated that intra-tumoral periostin expression was an
independent prognostic factor in NSCLC. Therefore, in the present
study a combined analysis of the CT finding (i.e., the CT solid
score) and pathological feature (periostin expression) was
performed to determine whether the analysis could assist in
predicting the prognosis more precisely than relying on CT finding
only.
However, no predictors of OS were identified in the
present study. Due to the various chemotherapeutic regimens with or
without inclusion of immune checkpoint inhibitors that have been
recently introduced to increase OS and/or progression-free
survival, the patients with recurrence exhibited relatively
long-term survival in the present study. It is assumed that the
progression of salvage therapy contributed to extending OS in the
cases of recurrence.
The present study has some limitations. The data
were obtained from a single-center, the study was retrospective,
and the cohort size was small. Moreover pre-operative CT was
performed with a range of scanners and the performance changed
notably with time. Thus, the accuracy of the morphological
evaluation of the tumors on CT may vary from patient to patient.
Additionally, there was no general consensus available on the
optimal method for evaluating the solid component of the tumor. The
solid component may have an irregular or scattered shape, and
measurements may not be reproducible. Although the agreements of
the two independent observers on the seven CT parameters ranged
from good to excellent, the results may have been more precise if
the size of the solid component and the whole nodule were measured
using automated volumetric software. Finally, histopathological
specimens were assessed only using hematoxylin and eosin staining,
and immunohistochemical staining for periostin; other factors, such
as EGFR mutants, were not assessed.
In conclusion, the combined analysis of the CT solid
score before surgical resection and periostin expression in the
resected specimen may be predictors of an increased likelihood of
tumor recurrence, even in patients with T1 invasive adenocarcinoma.
Excessive follow-up could be avoided in patients with low risk of
recurrence. Shorter follow-up intervals should be recommended in
patients with high risk of recurrence, even in T1 adenocarcinoma of
the lung. In the latter group, recurrence may be identified earlier
relative to the normal follow-up group, and prompt introduction of
salvage treatment could increase the survival rate, even in
recurrent cases.
Acknowledgements
Not applicable.
Funding
No funding was received.
Availability of data and materials
The datasets used and/or analyzed during the current
study are available from the corresponding author on reasonable
request.
Authors' contributions
RI and KF designed the study. STan, SN, KT, JF, KO,
SO and KI made substantial contributions to the conception of the
study. KF and TA supervised the study design. RI, SN, MK, AS, TC,
TA, DM, STak, HI, KO, SO and KI acquired the data. RI, SN, KT, JF,
MK, AS, TC, HI, KO, SO and KI confirmed the authenticity of the raw
data. RI, STan, KT, JF, KO and KF analyzed and interpreted the
data. RI and KF drafted the manuscript. RI, STan, KI and KF revised
the manuscript critically for important intellectual content. All
authors read and approved the final manuscript, and all authors
provided their final approval of the version to be published.
Ethics approval and consent to
participate
The Ethics Committee of Kurume University (Kurume,
Japan) approved this retrospective study and waived the requirement
for informed consent (approval no. 09113).
Patient consent for publication
Not applicable.
Competing interests
The authors declare that they have no competing
interests.
References
|
1
|
Lewis DR, Check DP, Caporaso NE, Travis WD
and Devesa SS: US lung cancer trends by histologic type. Cancer.
120:2883–2892. 2014.PubMed/NCBI View Article : Google Scholar
|
|
2
|
Travis WD, Brambilla E, Noguchi M,
Nicholson AG, Geisinger KR, Yatabe Y, Beer DG, Powell CA, Riely GJ,
Van Schil PE, et al: International association for the study of
lung cancer/american thoracic society/european respiratory society
international multidisciplinary classification of lung
adenocarcinoma. J Thorac Oncol. 6:244–285. 2011.PubMed/NCBI View Article : Google Scholar
|
|
3
|
Yoshizawa A, Motoi N, Riely GJ, Sima CS,
Gerald WL, Kris MG, Park BJ, Rusch VW and Travis WD: Impact of
proposed IASLC/ATS/ERS classification of lung adenocarcinoma:
Prognostic subgroups and implications for further revision of
staging based on analysis of 514 Stage Ⅰ cases. Mod Pathol.
24:653–664. 2011.PubMed/NCBI View Article : Google Scholar
|
|
4
|
Lee HY, Jeong JY, Lee KS, Kim HJ, Han J,
Kim BT, Kim J, Shim YM, Kim JH and Song I: Solitary pulmonary
nodular lung adenocarcinoma: Correlation of histopathologic scoring
and patient survival with imaging biomarkers. Radiology.
264:884–893. 2012.PubMed/NCBI View Article : Google Scholar
|
|
5
|
Kadota K, Villena-Vargas J, Yoshizawa A,
Motoi N, Sima CS, Riely GJ, Rusch VW, Adusumilli PS and Travis WD:
Prognostic significance of adenocarcinoma in situ, minimally
invasive adenocarcinoma, and nonmucinous lepidic predominant
invasive adenocarcinoma of the lung in patients with stage I
disease. Am J Surg Pathol. 38:448–460. 2014.PubMed/NCBI View Article : Google Scholar
|
|
6
|
Edge SB and Compton CC: The American joint
committee on cancer: The 7th edition of the AJCC cancer staging
manual and the future of TNM. Ann Surg Oncol. 17:1471–1474.
2010.PubMed/NCBI View Article : Google Scholar
|
|
7
|
Chae HD, Park CM, Park SJ, Lee SM, Kim KG
and Goo JM: Computerized texture analysis of persistent part-solid
ground-glass nodules: Differentiation of preinvasive lesions from
invasive pulmonary adenocarcinomas. Radiology. 273:285–293.
2014.PubMed/NCBI View Article : Google Scholar
|
|
8
|
Heidinger BH, Anderson KR, Nemec U, Costa
DB, Gangadharan SP, VanderLaan PA and Bankier AA: Lung
adenocarcinoma manifesting as pure ground-glass nodules:
Correlating CT size, volume, density, and roundness with
histopathologic invasion and size. J Thorac Oncol. 12:1288–1298.
2017.PubMed/NCBI View Article : Google Scholar
|
|
9
|
Takeshita S, Kikuno R, Tezuka K and Amann
E: Osteoblast-specific factor 2: Cloning of a putative bone
adhesion protein with homology with the insect protein fasciclin I.
Biochem J. 294:271–278. 1993.PubMed/NCBI View Article : Google Scholar
|
|
10
|
Kudo Y, Siriwardena BS, Hatano H, Ogawa I
and Takata T: Periostin: Novel diagnostic and therapeutic target
for cancer. Histol histopathol. 22:1167–1174. 2007.PubMed/NCBI View Article : Google Scholar
|
|
11
|
Okamoto M, Hoshino T, Kitasato Y, Sakazaki
Y, Kawayama T, Fujimoto K, Ohshima K, Shiraishi H, Uchida M, Ono J,
et al: Periostin, a matrix protein, is a novel biomarker for
idiopathic interstitial pneumonias. Eur Respir J. 37:1119–1127.
2011.PubMed/NCBI View Article : Google Scholar
|
|
12
|
Conway SJ, Izuhara K, Kudo Y, Litvin J,
Markwald R, Ouyang G, Arron JR, Holweg CT and Kudo A: The role of
periostin in tissue remodeling across health and disease. Cell Mol
Life Sci. 71:1279–1288. 2014.PubMed/NCBI View Article : Google Scholar
|
|
13
|
Ruan K, Bao S and Ouyang G: The
multifaceted role of periostin in tumorigenesis. Cell Mol Life Sci.
66:2219–2230. 2009.PubMed/NCBI View Article : Google Scholar
|
|
14
|
Sasaki H, Dai M, Auclair D, Kaji M, Fukai
I, Kiriyama M, Yamakawa Y, Fujii Y and Chen LB: Serum level of the
periostin, a homologue of an insect cell adhesion molecule, in
thymoma patients. Cancer Lett. 172:37–42. 2001.PubMed/NCBI View Article : Google Scholar
|
|
15
|
Sasaki H, Dai M, Auclair D, Fukai I,
Kiriyama M, Yamakawa Y, Fujii Y and Chen LB: Serum level of the
periostin, a homologue of an insect cell adhesion molecule, as a
prognostic marker in nonsmall cell lung carcinomas. Cancer.
92:843–848. 2001.PubMed/NCBI View Article : Google Scholar
|
|
16
|
Fujimoto K, Kawaguchi T, Nakashima O, Ono
J, Ohta S, Kawaguchi A, Tonan T, Ohshima K, Yano H, Hayabuchi N, et
al: Periostin, a matrix protein, has potential as a novel
serodiagnostic marker for cholangiocarcinoma. Oncol Rep.
25:1211–1216. 2011.PubMed/NCBI View Article : Google Scholar
|
|
17
|
Kudo Y, Ogawa I, Kitajima S, Kitagawa M,
Kawai H, Gaffney PM, Miyauchi M and Takata T: Periostin promotes
invasion and anchorage-independent growth in the metastatic process
of head and neck cancer. Cancer Res. 66:6928–6935. 2006.PubMed/NCBI View Article : Google Scholar
|
|
18
|
Fukushima N, Kikuchi Y, Nishiyama T, kudo
A and Fukayama M: Periostin deposition in the stroma of invasive
and intraductal neoplasms of the pancreas. Modern Pathol.
21:1044–1053. 2008.PubMed/NCBI View Article : Google Scholar
|
|
19
|
Hong LZ, Wei XW, Chen JF and Shi Y:
Overexpression of periostin predicts poor prognosis in non-small
cell lung cancer. Oncol Let. 6:1595–1603. 2013.PubMed/NCBI View Article : Google Scholar
|
|
20
|
Kim EA, Johkoh T, Lee KS, Han J, Fujimoto
K, Sadohara J, Yang PS, Kozuka T, Honda O and Kim S: Quantification
of ground-glass opacity on high-resolution CT of small peripheral
adenocarcinoma of the lung: Pathologic and prognostic implications.
Am J Roentgenol. 177:1417–1422. 2001.PubMed/NCBI View Article : Google Scholar
|
|
21
|
Maeyashiki T, Suzuki K, Hattori A,
Matsunaga T, Takamochi K and Oh S: The size of consolidation on
thin-section computed tomography is a better predictor of survival
than the maximum tumor dimension in resectable lung cancer. Eur J
Cardiothorac Surg. 43:915–918. 2013.PubMed/NCBI View Article : Google Scholar
|
|
22
|
Burt BM, Leung AN, Yanagawa M, Chen W,
Groth SS, Hoang CD, Nair VS and Shrager JB: Diameter of solid tumor
component alone should be used to establish T stage in lung
adenocarcinoma. Ann Surg Oncol. 22 (Suppl 3):S1318–S1323.
2015.PubMed/NCBI View Article : Google Scholar
|
|
23
|
Shikuma K, Menju T, Chen F, Kubo T, Muro
S, Sumiyoshi S, Ohata K, Sowa T, Nakanishi T, Cho H, et al: Is
volumetric 3-dimensional computed tomography useful to predict
histological tumor invasiveness? Analysis of 211 lesions of cT1N0M0
lung adenocarcinoma. Interact Cardiovasc Thorac Surg. 22:831–838.
2016.PubMed/NCBI View Article : Google Scholar
|
|
24
|
Hattori A, Matsunaga T, Hayashi T,
Takamochi K, Oh S and Suzuki K: Prognostic impact of the findings
on thin-section computed tomography in patients with subcentimeter
non-small cell lung cancer. J Thorac Oncol. 12:954–962.
2017.PubMed/NCBI View Article : Google Scholar
|
|
25
|
International Association for the Study of
Lung Cancer: Staging Manual in Thoracic Oncology. 2nd edition.
Editorial Rx Press, North Fort Myers, FL, 2016.
|
|
26
|
Ginsberg RJ and Rubinstein LV: Randomized
trial of lobectomy versus limited resection for T1 N0 non-small
cell lung cancer. Ann Thoracic Surg. 60:615–623. 1995.PubMed/NCBI View Article : Google Scholar
|
|
27
|
Bankier AA, MacMahon H, Goo JM, Rubin GD,
Schaefer-Prokop CM and Naidich DP: Recommendations for measuring
pulmonary nodules at CT: A statement from the Fleischner Society.
Radiology. 285:584–600. 2017.PubMed/NCBI View Article : Google Scholar
|
|
28
|
Hansell DM, Bankier AA, MacMahon H, McLoud
TC, Müller NL and Remy J: Fleischner society: Glossary of terms for
thoracic imaging. Radiology. 246:697–722. 2008.PubMed/NCBI View Article : Google Scholar
|
|
29
|
Zwirewich CV, Vedal S, Miller RR and
Müller NL: Solitary pulmonary nodule: High-resolution CT and
radiologic-pathologic correlation. Radiology. 179:469–476.
1991.PubMed/NCBI View Article : Google Scholar
|
|
30
|
Li M, Wang Y, Chen Y and Zhang Z:
Identification of preoperative prediction factors of tumor subtypes
for patients with solitary ground-glass opacity pulmonary nodules.
J Cardiothorac Surg. 13(9)2018.PubMed/NCBI View Article : Google Scholar
|
|
31
|
Kundel HL and Polansky M: Measurement of
observer agreement. Radiology. 228:303–308. 2003.PubMed/NCBI View Article : Google Scholar
|
|
32
|
Miao Y, Zhang J, Zou J, Zhu Q, Lv T and
Song Y: Correlation in histological subtypes with high resolution
computed tomography signatures of early stage lung adenocarcinoma.
Transl Lung Cancer Res. 6:14–22. 2017.PubMed/NCBI View Article : Google Scholar
|
|
33
|
Asamura H, Hishida T, Suzuki K, Koike T,
Nakamura K, Kusumoto M, Nagai K, Tada H, Mitsudomi T, Tsuboi M, et
al: Radiographically determined noninvasive adenocarcinoma of the
lung: Survival outcomes of Japan clinical oncology group 0201. J
Thorac Cardiovasc Surg. 146:24–30. 2013.PubMed/NCBI View Article : Google Scholar
|
|
34
|
Murakami D, Takamori S, Kawahara A,
Mitsuoka M, Kashihara M, Yoshiyama K, Matsumoto R, Yokoyama S,
Fujimoto K, Kawaguchi A, et al: Periostin expression in non-small
cell lung cancer: Clinical significance. Kurume Med J. 64:13–20.
2017.PubMed/NCBI View Article : Google Scholar
|