Introduction
A deoxyribonuclease (DNase) is an enzyme that
catalyzes the hydrolytic cleavage of phosphodiester linkages in the
DNA backbone, thus degrading DNA. DNases are a type of nuclease, a
generic term for enzymes capable of hydrolyzing phosphodiester
bonds that link nucleotides. The two main types of DNase found in
humans are known as DNASE1 and DNASE2(1). The diversity of these enzymes enables
the body to regulate DNase activity according to different organs
(1).
DNASE1 is an endonuclease mainly produced in the
pancreas, which can remove extracellular DNA. A DNASE1 mutation was
found in pediatric patients with systemic lupus erythematosus (SLE)
(2,3). The activity of DNase in the serum of
SLE patients was also lower (4-6).
Adult SLE patients with a reduced serum DNASE1 activity have been
shown to suffer from severe nephritis and poor prognosis (7). DNASE1L1 is different from other
members of the DNase I family, which is highly expressed in the
heart and skeletal muscle, where the other members are hardly
expressed (8-11).
DNASE1L1 can act as a cell surface barrier to prevent
endocytosis-mediated gene transfer (12). The accumulation of DNASE1L1
transcript was observed in myocyte vacuoles of patients with
vacuolar myopathy (13). Fatal
infantile Pompe disease is associated with DNASE1L1 deletion
polymorphism (14). DNASE1L2
showed the best activity under acidic conditions, which differed
from that of other DNase members at a neutral pH. In addition, the
mRNA and protein levels of DNASE1L2 in the skin were much richer
than those in any other organs (10). The expression of DNASE1L2 is
associated with the terminal differentiation of epidermal
keratinocytes. The DNASE1L2 gene expression was significantly
decreased in the epidermis of psoriatic lesions affected by
keratinization (15). In addition,
DNASE1L2 may lead to the degradation of nuclear DNA during cell
death associated with differentiation in various keratinocyte
lineages (16). DNASE1L3 is
secreted into the gastrointestinal tract and body fluid by various
exocrine and endocrine organs (17-19).
DNASE1L3 and DNASE1 can degrade DNA in the serum (19). DNASE1L3 is involved in chromatin
degradation in apoptotic or necrotic cells (20-28).
The decrease in DNASE1L3 activity is related to several autoimmune
diseases. DNASE1L3 gene mutation was found in patients with SLE
(29), systemic sclerosis
(30) and low complement urticaria
vasculitis syndrome (31).
DNASE2 can make macrophages phagocytize the DNA
degradation of apoptotic cells and skin surface (32,33).
DNASE2 gene knockout can lead to the accumulation of undigested DNA
in murine macrophages, thus stimulating interferon production and
eventually leading to fatal anemia and death (34,35).
DNASE2 gene-induced deletion murine can lead to the development of
chronic polyarthritis, which is similar to human rheumatoid
arthritis (36). DNASE2B was found
to be expressed in mouse liver and lens, and human salivary gland
and lungs (37-39).
The expression level of DNASE2B in the mouse lens was ~10 times
higher than that in the liver (39). DNASE2B controls fiber nuclear
cells' degradation during lens development (40), so the deletion of DNASE2B in mice
causes nuclear degradation defects and cataract (39).
DNase family genes play an essential role in
autoimmune diseases. Autoimmune diseases are closely associated
with cancer (41). However,
studies on the relationship between DNase family genes and cancer
are rare. The DNase expression and co-expression, OS, immune
subtypes, tumor microenvironment, and drug sensitivity in 33 kinds
of tumors were examined through a series of bioinformatics
analyses. In addition, the correlation between DNase and immune
infiltration subtype, clinical stage, tumor microenvironment, and
tumor stemness score was separately studied in HCC. Furthermore,
the difference in DNASE1L3 expression between HCC and adjacent
normal tissues was also examined.
Materials and methods
The cancer genome atlas (TCGA)
pan-cancer data
TCGA pan-cancer data, including RNA-Seq, clinical
data, stemness scores and immune subtypes, were downloaded from the
Xena browser (https://xenabrowser.net/datapages/). The TCGA
pan-cancer data included 33 cancer types: ACC, BLCA, BRCA, CESC,
CHOL, COAD, DLBC, ESCA, GBM, HNSC, KICH, KIRC, KIRP, LAML, LGG,
LIHC, LUAD, LUSC, MESO, OV, PAAD, PCPG, PRAD, READ, SARC, SKCM,
STAD, TGCT, THCA, THYM, UCEC, UCS and UVM. In total, 11,057 samples
were used in this study. Among them, 15 cancer types had none or
<5 associated normal tissue samples, so only the rest of the 18
cancer types were used to investigate the presence of altered gene
expression in tumors than adjacent normal with linear mixed-effects
models. In order to investigate the association between the
expression of each of the DNase family members and overall patient
survival, 10,121 tumor samples, which had patient survival
information, were used for survival analysis. RNA-Seq data of HCC
and adjacent normal liver samples from GSE22405, GSE60502 and
GSE64041 datasets were also downloaded (https://www.ncbi.nlm.nih.gov).
Tumor microenvironment analysis
Six immune subtypes were defined to measure immune
infiltrates in the tumor microenvironment (42). The immune subtype obtained from
TCGA pan-cancer data was used to test the association between DNase
expression and immune infiltrate types in the tumor
microenvironment using ANOVA models. Tumorpurity, Estimatescore,
Stromalscore and Immunescore were used to analyze immune cell
infiltration levels and stromal cells in different tumors (43). This analysis was based on
interpreting gene expression profiles retrieved from TCGA
expression data (https://bioinformatics.mdanderson.org/estimate/)
(43). Tumor stemness features
extracted from transcriptomic and epigenetic from TCGA tumor
samples were used to measure tumor cells (44). The correlation between cancer
stemness with DNase expression was tested using the Spearman's rank
correlation coefficient.
NCI-60 analysis
The NCI-60 database, which contains data on 60
different cancer cell lines from nine different tumor types, was
accessed using the CallMiner interface (https://discover.nci.nih.gov/cellminer/). DNAse mRNA
expression and Z scores for cell sensitivity data (concentration
causing 50% cell growth inhibition) were retrieved for 59 cell
lines and were analyzed using Pearson's correlation to investigate
the relationship between gene expression and drug sensitivity. The
drug response of 262 FDA approved or drugs on clinical trials were
used for correlation analysis.
IHC staining
Tissue sections were purchased from Shanghai Outdo
Biotech Co., Ltd. The acquisition of liver tissue and the
production of tissue sections were reviewed and approved by the
Shanghai Outdo Biotech Co., Ltd. ethics committee (YBM-05-01).
Tissue sections were deparaffinized in xylene and rehydrated in a
graded series of alcohol, followed by antigen retrieval, goat
serum, primary antibody (Abcam), and biotinylated secondary
antibody incubation (Vector Laboratories, Inc.). The immunoreaction
was visualized by staining with diaminobenzidine tetrahydrochloride
solution (Vector J. Han et al Laboratories). Sections were
counterstained with hematoxylin (Sigma-Aldrich) and dehydrated
using a graded alcohol series before sealing the slides with
coverslips. The Allred scoring system was used to quantify the
protein staining accounting. Proportion scoring was as follows:
0<1%, 1=1-25, 2=26-50, 3=51-75 and 4>75%. Staining intensity
scoring was as follows: 0, none; 1, weak; 2, intermediate and 3,
strong staining, and providing a composite score (intensity x
proportion=0-12).
Statistical analysis
Gene expression was compared between normal and
tumor samples in 18 cancer types with >5 associated adjacent
normal samples using linear mixed-effects models. Boxplots were
used to show the gene expression across cancer types. Univariate
Cox expression analysis and Kaplan-Meier survival estimate followed
by log-rank test, were used to test the association between gene
expression and overall patient survival. The relationship between
the expression of DNase genes and the immune infiltrate subtypes
was tested with one-way ANOVA (Bonferroni post hoc test).
Spearman's or Pearson's correlation coefficients were used to test
the correlation between gene expression and Tumorpurity,
Estimatescore, Stromalscore, and Immunescore and drug sensitivity.
Linear regressions were used to test the association between gene
expression, and patient clinical characteristics and immune
components. DNASE1L3 protein staining in healthy liver tissue and
HCC was analyzed using paired Student's t-test. Sex, age, WHO
histological classification, N classification and M classification
were compared using unpaired Student's t-test. T classification and
AJCC 7th edition clinical stage were assessed using one-way ANOVA.
All tests and graphs were created with R 4.0.0 with Limma, ggpubr,
pheatmap, corrplot, survival, survminer, ggplot2, reshape2 and
estimate impute.
Results
DNase gene expression in pan-cancer
data
To understand the expression of DNase gene family in
tumor and adjacent normal tissues, the expression level of DNase
family genes was detected in tumor and tumor-adjacent normal
tissues from all 33 cancer types in the TCGA dataset (Table SI). In general, the expression of
DNASE2 was the highest, and the expression of DNASE2B was the
lowest in tumors (Fig. 1A).
Furthermore, the expression levels of DNase family members in
different types of cancer were tested by Spearman's rank
correlation coefficient. It was found that DNASE1 and DNASE1L2
(r=0.29), and DNASE2 and DNASE1L1 (r=0.22) had the highest positive
correlation. The negative correlation between DNASE1 and DNASE2
(r=-0.18) was the highest. These results suggested that they may
have some related functions and mechanisms (Fig. 1B). The expression levels of all six
DNase family genes were also studied in 18 types of primary tumors
and compared with a minimum of five paired adjacent normal samples
(Fig. 1C and Tables SII-SIII, unpaired Student's t-test). The
expression of DNase family genes in some types of cancer was
different from that in normal tissues (Fig. 2A-F). All six DNase family genes
were differentially expressed in LIHC compared to adjacent normal
tissue. DNASE1, DNASE1L1, DNASE1L2, DNASE2, and DNASE2B were
up-regulated in LIHC. And only DNASE1L3 was down-regulated in
LIHC.
 | Figure 1Expression of DNase genes. (A)
Boxplot to show the distribution of DNase gene expression for all
33 cancer types. (B) Correlation plot to show the correlation of
gene expression among the 6 DNase family members for all 33 cancer
types. (C) Heatmap to show the difference of DNase gene expression
comparing primary tumor to adjacent normal tissues for 18 cancer
types have more than 5 adjacent normal samples. BLCA, bladder
urothelial carcinoma; BRCA, breast invasive carcinoma; CHOL,
cholangiocarcinoma; COAD, colon adenocarcinoma; ESCA, esophageal
carcinoma; GBM, glioblastoma multiforme; HNSC, head and neck
squamous cell carcinoma; KICH, kidney chromophobe; KIRC, kidney
renal clear cell carcinoma; KIRP, kidney renal papillary cell
carcinoma; LIHC, liver hepatocellular carcinoma; LUAD, lung
adenocarcinoma; LUSC, lung squamous cell carcinoma; PRAD, prostate
adenocarcinoma; READ, rectum adenocarcinoma; STAD, stomach
adenocarcinoma; THCA, thyroid carcinoma; UCEC, uterine corpus
endometrial carcinoma. |
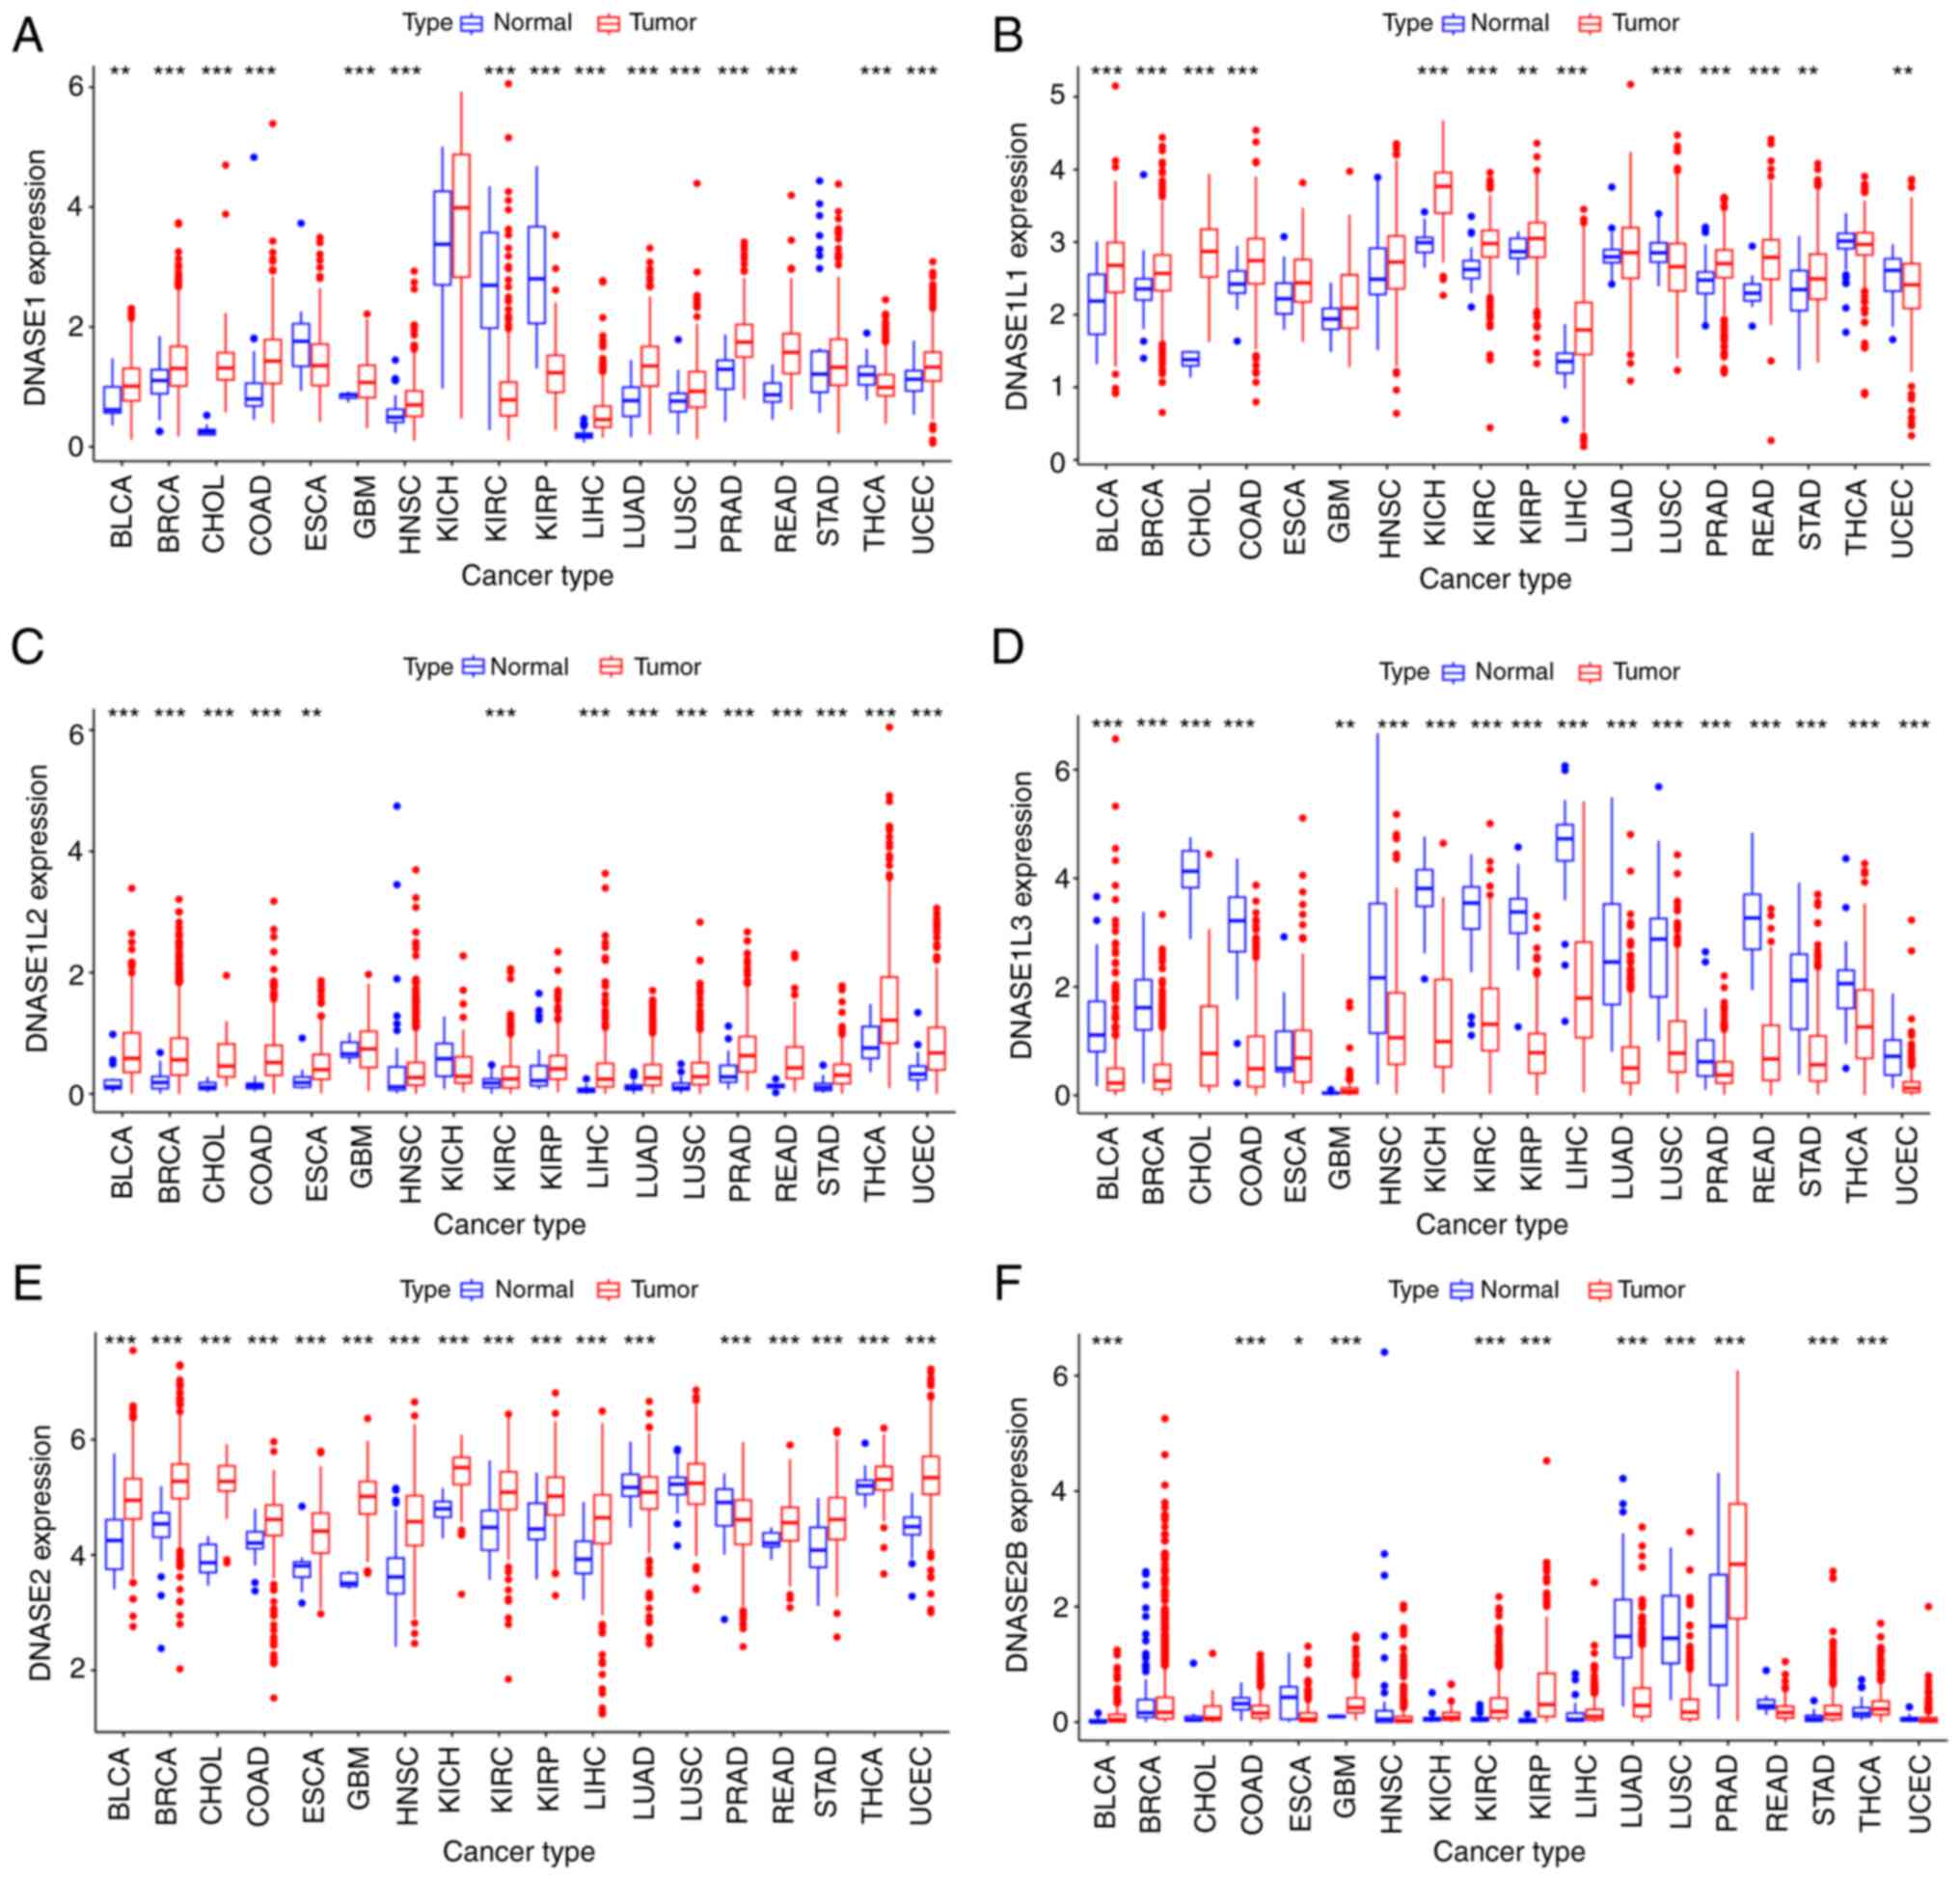 | Figure 2Expression levels of DNase genes in
primary tumor and their adjacent normal tissue for 18 cancer types
with more than 5 adjacent normal samples. (A) DNASE1, (B) DNAE1L1,
(C) DNASE1L2, (D) DNASE1L3, (E) DNASE2, (F) DNASE2B. Unpaired
Student's t-test. *P<0.05, **P<0.01,
***P<0.001. BLCA, bladder urothelial carcinoma; BRCA,
breast invasive carcinoma; CHOL, cholangiocarcinoma; COAD, colon
adenocarcinoma; ESCA, esophageal carcinoma; GBM, glioblastoma
multiforme; HNSC, head and neck squamous cell carcinoma; KICH,
kidney chromophobe; KIRC, kidney renal clear cell carcinoma; KIRP,
kidney renal papillary cell carcinoma; LIHC, liver hepatocellular
carcinoma; LUAD, lung adenocarcinoma; LUSC, lung squamous cell
carcinoma; PRAD, prostate adenocarcinoma; READ, rectum
adenocarcinoma; STAD, stomach adenocarcinoma; THCA, thyroid
carcinoma; UCEC, uterine corpus endometrial carcinoma. |
Univariate Cox expression analysis and Kaplan-Meier
survival estimation were performed to evaluate the relationship
between DNase gene expression and OS in 33 types of cancer from
TGCA dataset. The Kaplan-Meier survival estimate showed that the
DNASE1 overexpression group exhibited a favorable prognosis in
BLCA, THYM and PAAD, but a poor prognosis in KIRC (Fig. S1). The DNASE1L1 overexpression
group exhibited a favorable prognosis in SARC and ACC, but a poor
prognosis in LAML, GBM, LGG and UVM (Fig. S2). The DNASE1L2 overexpression
group exhibited a better prognosis in BLCA, CESC and PAAD, but a
poor prognosis in ACC, UVM, MESO, COAD and KIRC (Fig. S3). The DNASE1L3 overexpression
group exhibited a favorable prognosis in LIHC, SARC, KICH, CESC,
LUAD, KIRC, KIRP, ACC, PAAD and PCPG, but a poor prognosis in UVM
(Fig. S4). The DNASE2
overexpression group exhibited a favorable prognosis in SKCM, MESO
and SARC, but a poor prognosis in LGG and KICH (Fig. S5). The DNASE2B overexpression
group exhibited a favorable prognosis in KIRP, SKCM, LUAD, BLCA,
KIRC and DLBC, but a poor prognosis in LGG and UVM (Fig. S6). Univariate Cox expression
analysis results showed that DNASE1 predicted a poor prognosis in
BLCA, HNSC, PAAD and THYM (Fig. 3
and Table SIV). The high
expression of DNASE1L1 was associated with a favorable prognosis in
ACC and SARC and a poor prognosis in GBM, HNSC, LAML and LGG
(Fig. 3 and Table SV). The high expression of
DNASE1L2 was associated with a favorable prognosis in LGG, BLCA,
CESC, PAAD and STAD, and a poor prognosis in MESO, KIRC and COAD
(Fig. 3 and Table SVI). DNASE1L3 predicted a
favorable prognosis in ACC, LICH, KIRC, LIHC, LUAD, OV, PAAD and
SARC. DNASE1L3 predicted poor prognosis only in UVM (Fig. 3 and Table SVII). The high expression of
DNASE2 was associated with a favorable prognosis in DLBC, CESC,
SARC, STAD and SKCM, and a poor prognosis in LGG and KICH (Fig. 3 and Table SVIII). DNASE2B exhibited a
favorable prognosis in LAML, BLCA, KIRC, KIRP and LUAD. DNASE2B
predicted poor prognosis only in LGG (Fig. 3 and Table SIX). DNase family genes are
significantly differentially expressed in a variety of tumors. And
the expression of DNase family genes is closely related to the
prognosis of patients in some tumors. The above results indicate
that DNase family genes may have important potential value in the
diagnosis and treatment of various tumors.
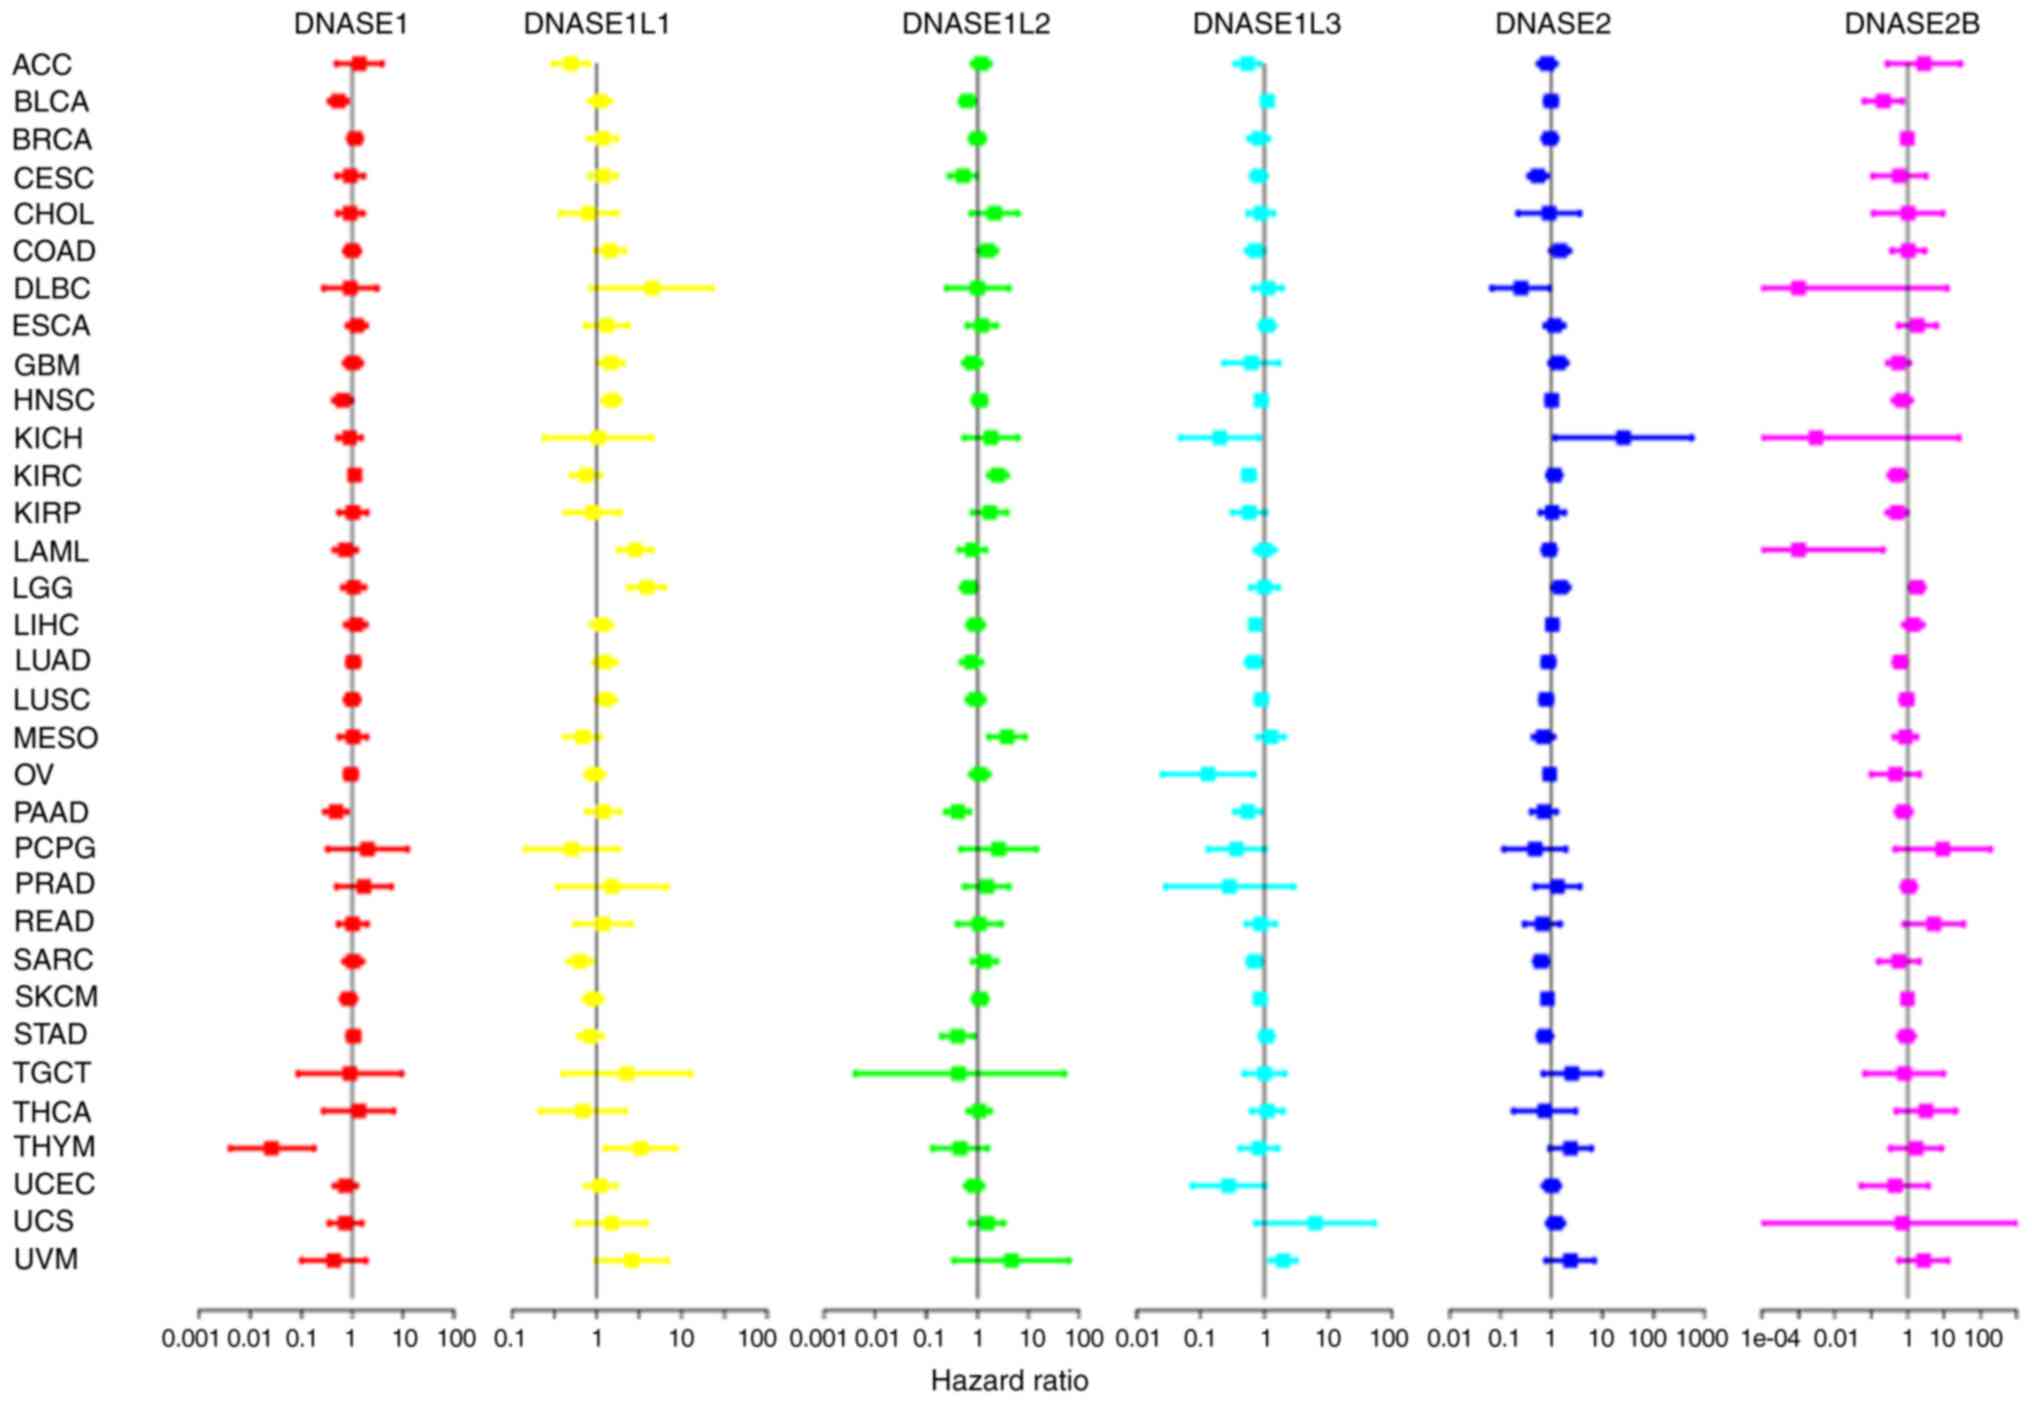 | Figure 3The relationship between the
expression of DNase genes and the overall survival rate of 33 kinds
of cancer patients by Univariate Cox expression analysis. ACC,
adrenocortical carcinoma; BLCA, bladder urothelial carcinoma; BRCA,
breast invasive carcinoma; CESC, cervical squamous cell carcinoma
and endocervical adenocarcinoma; CHOL, cholangiocarcinoma; COAD,
colon adenocarcinoma; DLBC, lymphoid neoplasm diffuse large B-cell
lymphoma; ESCA, esophageal carcinoma; GBM, glioblastoma multiforme;
HNSC, head and neck squamous cell carcinoma; KICH, kidney
chromophobe; KIRC, kidney renal clear cell carcinoma; KIRP, kidney
renal papillary cell carcinoma; LAML, acute myeloid leukemia; LGG,
brain lower grade glioma; LIHC, liver hepatocellular carcinoma;
LUAD, lung adenocarcinoma; LUSC, lung squamous cell carcinoma;
MESO, mesothelioma; OV, ovarian serous cystadenocarcinoma; PAAD,
pancreatic adenocarcinoma; PCPG, pheochromocytoma and
paraganglioma; PRAD, prostate adenocarcinoma; READ, rectum
adenocarcinoma; SARC, sarcoma; SKCM, skin cutaneous melanoma; STAD,
somach adenocarcinoma; TGCT, testicular germ cell tumors; THCA,
thyroid carcinoma; THYM, thymoma; UCEC, uterine corpus endometrial
carcinoma; UCS, uterine carcinosarcoma; UVM, uveal melanoma. |
DNase gene expression with immune
infiltration types and tumor microenvironment
To study the relationship between DNases and immune
components, the correlation between DNase family gene expression
and tumor immune infiltration was detected in TCGA dataset. There
are six types of immune infiltration in human tumors: C1 (wound
healing), C2 (INF-r dominant), C3 (inflammatory), C4 (lymphocyte
depleted), C5 (immunologically quiet) and C6 (TGF-β dominant), and
the content of cytotoxic cells increased gradually with C1 to
C6(45). Tumor development is
promoted by a low cytotoxic immunophenotype. Tumor samples from
TCGA data were classified according to the type of immune
infiltration, and the relationship between the type of immune
infiltration and DNase expression level was analyzed (Fig. 4A). In addition, the Kruskal test
showed that DNase gene expression was different in different types
of immune infiltration (P<0.001). DNase family gene expression
is associated with the content of cytotoxic cells in the tumor
microenvironment. In addition, DNase family genes are closely
associated with various autoimmune diseases and have a robust
immune regulation ability. DNase family genes may play an essential
role in the tumor microenvironment. In order to better explore the
influence of DNase genes in the microenvironment of various tumors,
the ESTIMATE algorithm was used to estimate the ratio of immune,
stromal and tumor components in the tumor microenvironment. It was
presented in the form of four scores: Immunescore, Stromalscore,
Estimatescore and Tumorpurity. They were positively correlated with
immune, stromal, the sum of tumor and immunity, and tumor
components. The higher the corresponding score, the greater the
corresponding components in the tumor microenvironment. The
relationship between DNase gene expression and the four ESTIMATE
algorithm scores for 33 types of cancers (Fig. 4B-E and Table SX, SXI, SXII, SXIII, SXIV, SXV, SXVI, SXVII and SXVII) was detected. In most types of
cancer, DNASE1 and DNASE1L2 were found to be positively correlated
with Tumorpurity and negatively correlated with Stromalscore,
Immunescore and Estimatescore. However, DNASE1L1, DNASE1L3, DNASE2
and DNASE2B in most cancer types were negatively correlated with
Tumorpurity and positively related to stromal score, Immunescore
and Estimatescore. The expression of DNASE1 and DNASE1L2 is
associated with the decrease of immune and stromal components and
the increase of tumor components in the tumor microenvironment. The
expression of DNASE1L1, DNASE1L3, DNASE2 and DNASE2B was associated
with the increase of immune and matrix components, as well as the
decrease of tumor components in the tumor microenvironment. In
summary, we found that the expression of DNase family genes is
associated with the composition of the immune microenvironment in
some tumors. This indicate that DNase family genes may have an
impact on the composition of some immune cells in the tumor immune
microenvironment.
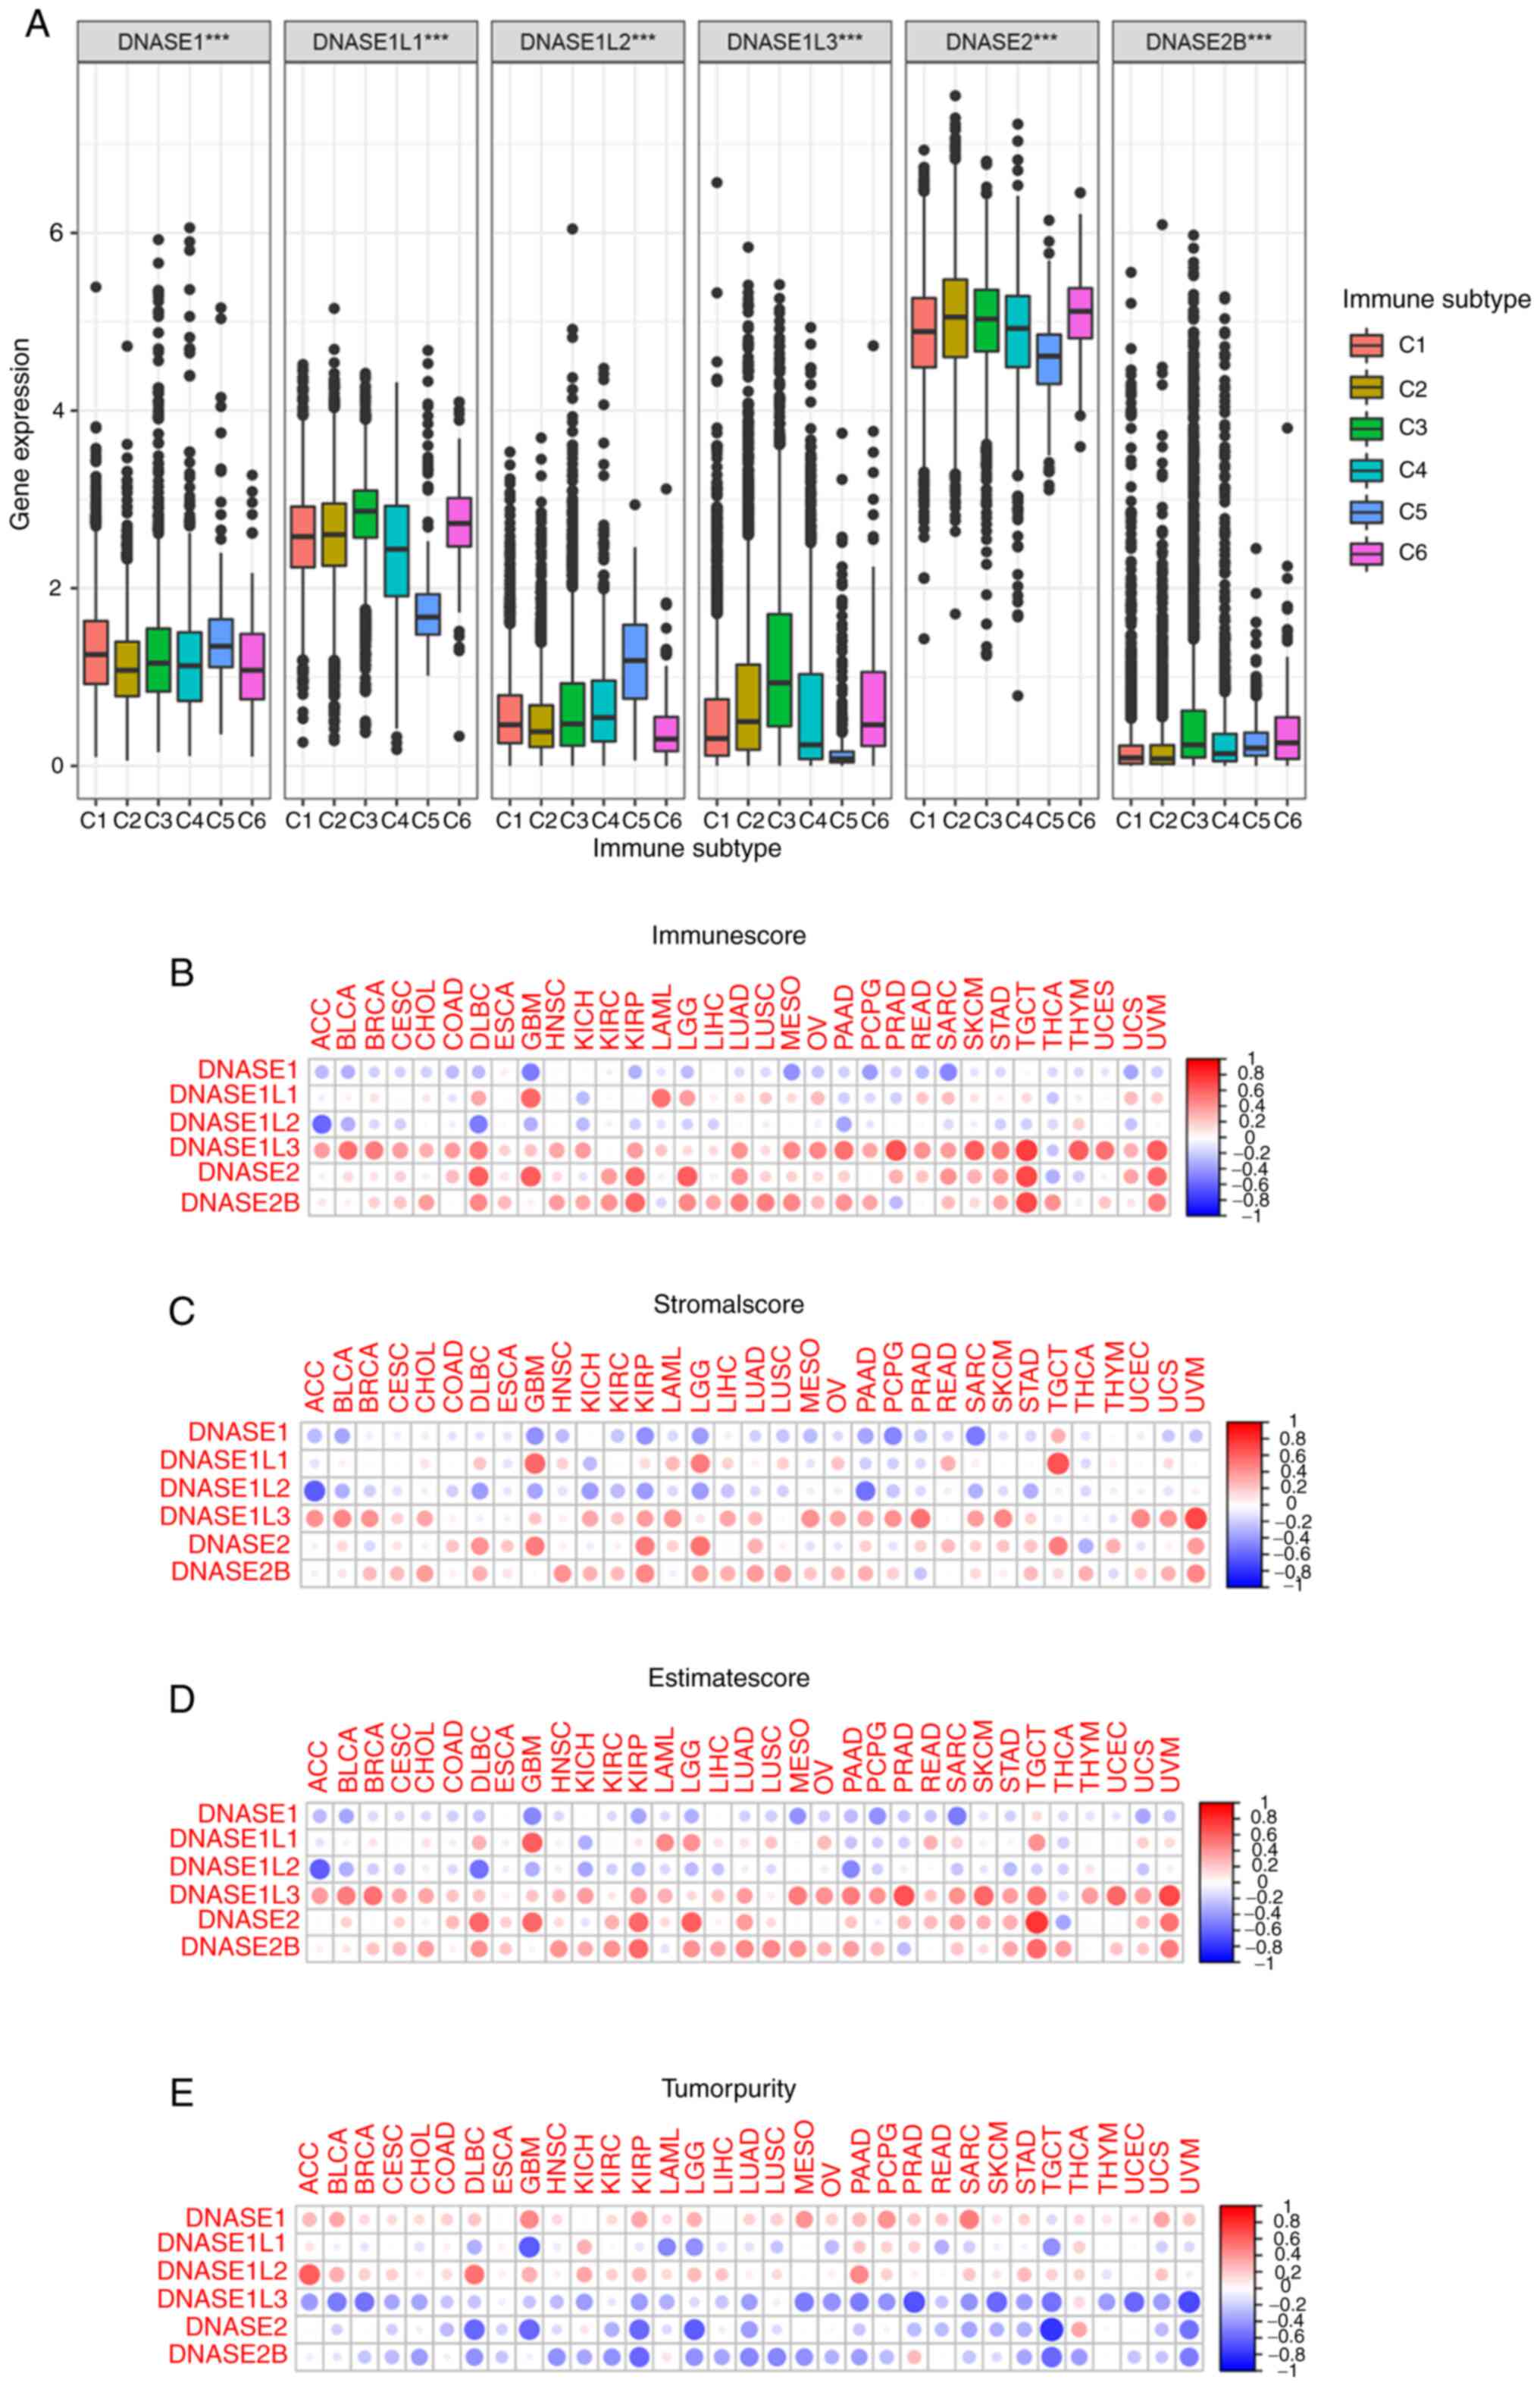 | Figure 4DNase genes expression with immune
infiltration types and the tumor microenvironment in 33 kinds of
cancer. (A) The relationship between the expression of DNase genes
and the immune infiltrate subtypes was tested with one-way ANOVA.
***P<0.001. (B) The relationship between the
expression of DNase genes and the Stromalscore. (C) The
relationship between the expression of DNase genes and the
Immunescore. (D) The relationship between the expression of DNase
genes and the Estimatescore. (E) The relationship between the
expression of DNase genes and the Tumorpurity. C1, wound healing;
C2, INF-r dominant; C3, inflammatory; C4, lymphocyte depleted; C5,
immunologically quiet; C6, TGF-β dominant; ACC, adrenocortical
carcinoma; BLCA, bladder urothelial carcinoma; BRCA, breast
invasive carcinoma; CESC, cervical squamous cell carcinoma and
endocervical adenocarcinoma; CHOL, cholangiocarcinoma; COAD, colon
adenocarcinoma; DLBC, lymphoid neoplasm diffuse large B-cell
lymphoma; ESCA, esophageal carcinoma; GBM, glioblastoma multiforme;
HNSC, head and neck squamous cell carcinoma; KICH, kidney
chromophobe; KIRC, kidney renal clear cell carcinoma; KIRP, kidney
renal papillary cell carcinoma; LAML, acute myeloid leukemia; LGG,
brain lower grade glioma; LIHC, liver hepatocellular carcinoma;
LUAD, lung adenocarcinoma; LUSC, lung squamous cell carcinoma;
MESO, mesothelioma; OV, ovarian serous cystadenocarcinoma; PAAD,
pancreatic adenocarcinoma; PCPG, pheochromocytoma and
paraganglioma; PRAD, prostate adenocarcinoma; READ, rectum
adenocarcinoma; SARC, sarcoma; SKCM, skin cutaneous melanoma; STAD,
somach adenocarcinoma; TGCT, testicular germ cell tumors; THCA,
thyroid carcinoma; THYM, thymoma; UCEC, uterine corpus endometrial
carcinoma; UCS, uterine carcinosarcoma; UVM, uveal melanoma. |
DNase gene expression with tumor
stemness
Cancer progression involves the gradual loss of a
differentiated phenotype and acquisition of progenitor and
stem-cell-like features. The tumor stemness is a measure of the
extent of oncogenic dedifferentiation (44). Tumor stemness can be measured using
an RNA stemness score based on mRNA expression (RNAss) and a DNA
stemness score (DNAss) based on DNA methylation pattern (44). The higher the RNAss and DNAss, the
greater the tumor stemness of cancer. The relationship between
DNase gene expression, and RNAss and DNAss (Fig. 5A and B, Table
SXVIII, SXIX, SXX, and SXXI) were investigated. DNASE1 showed
the strongest negative correlation with RNAss in TGCT and DNASE1L1
in TGCT, DNASE1L3 in PRAD, DNASE2 in LAML and DNASE2B in LGG.
DNASE1L2 showed the strongest positive correlation with RNAss in
DLBC and DNASE1L3 in THYM. DNASE1 showed the strongest negative
correlation with DNAss in THYM, DNASE1L2 in LAML, DNASE1L3 in DLBC,
DNASE2 in THCA and DNASE2B in DLBC. DNASE1 showed the strongest
positive correlation with DNAss in GBM, DNASE1L1 in THYM, DNASE1L2
in UCS, DNASE1L3 in TGCT, DNASE2 in THYM and DNASE2B in PCPG. We
depicted the relationship between DNase family genes and tumor
stemness in a variety of tumors.
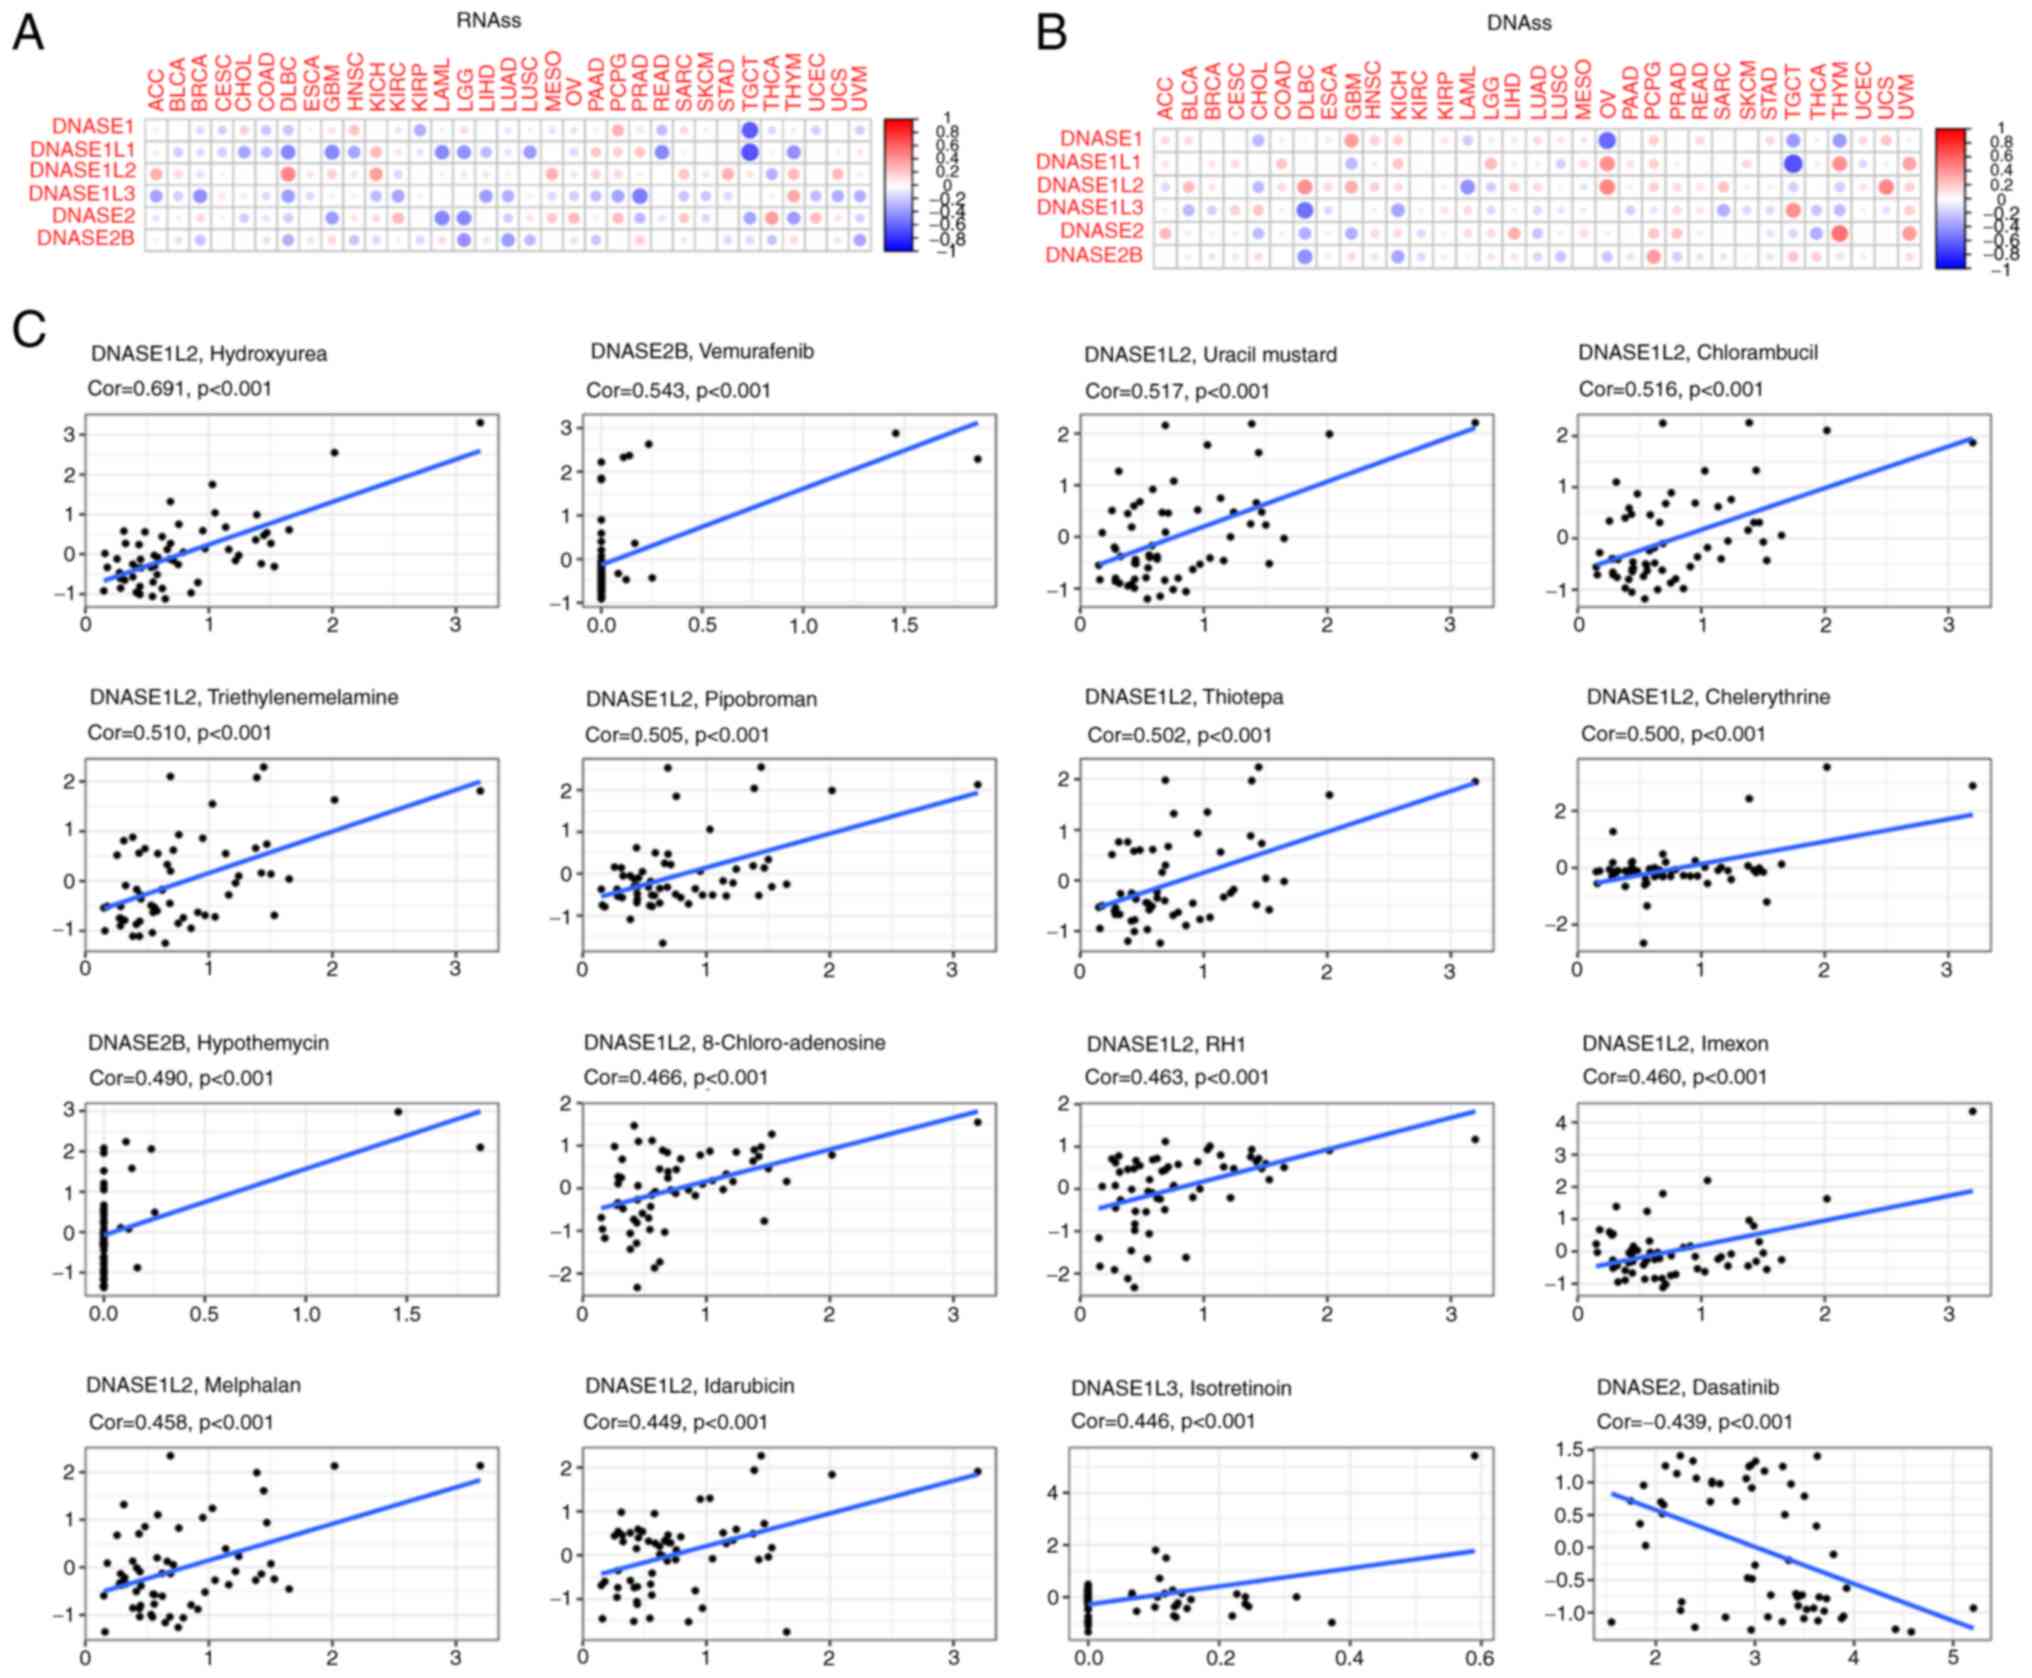 | Figure 5DNase genes expression with tumor
stemness and drug sensitivity. (A) The relationship between the
expression of DNase genes and RNAss. (B) The relationship between
the expression of DNase genes and DNAss. (C) The relationship
between the expression of DNase genes and drug sensitivity. ACC,
adrenocortical carcinoma; BLCA, bladder urothelial carcinoma; BRCA,
breast invasive carcinoma; CESC, cervical squamous cell carcinoma
and endocervical adenocarcinoma; CHOL, cholangiocarcinoma; COAD,
colon adenocarcinoma; DLBC, lymphoid neoplasm diffuse large B-cell
lymphoma; ESCA, esophageal carcinoma; GBM, glioblastoma multiforme;
HNSC, head and neck squamous cell carcinoma; KICH, kidney
chromophobe; KIRC, kidney renal clear cell carcinoma; KIRP, kidney
renal papillary cell carcinoma; LAML, acute myeloid leukemia; LGG,
brain lower grade glioma; LIHC, liver hepatocellular carcinoma;
LUAD, lung adenocarcinoma; LUSC, lung squamous cell carcinoma;
MESO, mesothelioma; OV, ovarian serous cystadenocarcinoma; PAAD,
pancreatic adenocarcinoma; PCPG, pheochromocytoma and
paraganglioma; PRAD, prostate adenocarcinoma; READ, rectum
adenocarcinoma; SARC, sarcoma; SKCM, skin cutaneous melanoma; STAD,
somach adenocarcinoma; TGCT, testicular germ cell tumors; THCA,
thyroid carcinoma; THYM, thymoma; UCEC, uterine corpus endometrial
carcinoma; UCS, uterine carcinosarcoma; UVM, uveal melanoma. |
DNase gene expression and sensitivity
to chemotherapy
The correlation between DNase gene expression levels
were also investigated in the 60 human cancer cell lines (NCI-60)
with over 200 chemotherapy drugs (Fig.
5C and Table SXXII). The
higher the score, the more sensitive the cells to the drug
treatment. For instance, DNASE1L2 promoted treatment with
hydroxyurea (treatment for sickle cell anemia and certain types of
cancer), uracil mustard (treatment for lymphatic malignancies such
as non-Hodgkin's lymphoma), chlorambucil (treatment for chronic
lymphocytic leukemia, Hodgkin's disease, non-Hodgkin's lymphoma,
breast, ovarian and testicular cancer, Waldenstrom's
macroglobulinemia, thrombocythemia and choriocarcinoma),
triethylenemelamine (treatment for lymphomas and leukemia-now used
as a research tool to produce chromosome aberrations and cancer),
pipobroman (treatment for polycythemia vera and essential
thrombocythemia), thiotepa (treatment for bladder cancer),
chelerythrine (exhibits anticancer qualities and has served as a
base for many potential novel drugs against cancer),
8-chloro-adenosine (treatment for relapsed or refractory acute
myeloid leukemia and chronic lymphocytic),
2,5-diaziridinyl-3-(hydroxymethyl)-6-methyl-1,4-benzoquinone (RH1;
treatment for advanced solid tumors and non-Hodgkin's lymphoma),
imexon (treatment for pancreatic, lung, breast and prostate cancer,
melanoma and multiple myeloma cancer), melphalan (treatment for
multiple myeloma, ovarian cancer, melanoma and amyloidosis),
idarubicin (treatment for breast cancer, lymphoma and leukemia, and
also has the potential for reduced cardiac toxicity), while DNASE1
was associated with cell resistance to dasatinib (treatment for
chronic myelogenous leukemia). We analyzed the effect of
chemotherapeutic drugs on the expression of DNase family genes in a
variety of tumors. This will be an important contribution to the
future research on chemotherapy targeting DNase family genes.
DNase gene family in HCC
It was found that DNase expression in HCC was
significantly different from that in adjacent normal tissues in the
TCGA-LIHC database. DNASE1, DNASE1L1, DNASE1L2, DNASE2 and DNASE2B
is highly expressed in HCC, while DNASE1L3 is poorly expressed in
HCC. By analyzing the clinical information in TCGA-LIHC database,
it was found that the expression of DNASE1, DNASE1L3 and DNASE2B
was associated with the stage of HCC (Fig. 6A). The relationship between DNase
gene expression and immune infiltrate subtypes was also
investigated in HCC. The results showed a significant correlation
between DNASE1, DNASE1L3, DNASE2 and DNASE2B expression, and immune
subtype, although the C5 immune infiltrate subtype was absent in
TCGA-LIHC dataset (Fig. 6B). The
prognosis of patients with a high DNASE1L3 expression in HCC was
favorable, as shown by Univariate Cox expression analysis
(P<0.001; Fig. 3 and Table SVII) and Kaplan-Meier survival
estimate (P<0.001; Fig. S4).
DNASE1L1 and DNASE1L3 exhibited a negative correlation with RNAss
in HCC, while DNASE1L2 and DNASE2 exhibited a positive correlation
with DNAss in HCC. These findings suggested that the high
expression of DNASE1L1 and DNASE1L3 and the low expression of
DNASE1L2 and DNASE2 in HCC may reduce the stemness score. A
significant negative correlation was between DNASE1L2 and stromal
score in HCC, but DNASE1L1, DNASEL13 and DNASE2B exhibited a
positive correlation with the stromal score in HCC. A negative
correlation was observed between DNASE1L2 and immune score in HCC;
however, DNASE1L1, DNASEL13 and DNASE2B exhibited a positive
correlation with the immune score in HCC. In addition, the
correlation between tumor microenvironment and DNase expression was
studied in HCC. DNASE1L3 and DNASE2B exhibited a positive
correlation with Stromalscore, Immunescore and Estimatescore in
HCC, but DNASE1L2 was negatively correlated with Stromalscore,
Immunescore and Estimatescore in HCC. In addition, DNASE1L1 was
positively correlated with Stromalscore and Estimatescore in HCC
(Fig. 6C; Table SXXII). We further analyzed the
relationship between the expression of DNase family genes and tumor
stage, immune microenvironment, and tumor stemness in HCC.
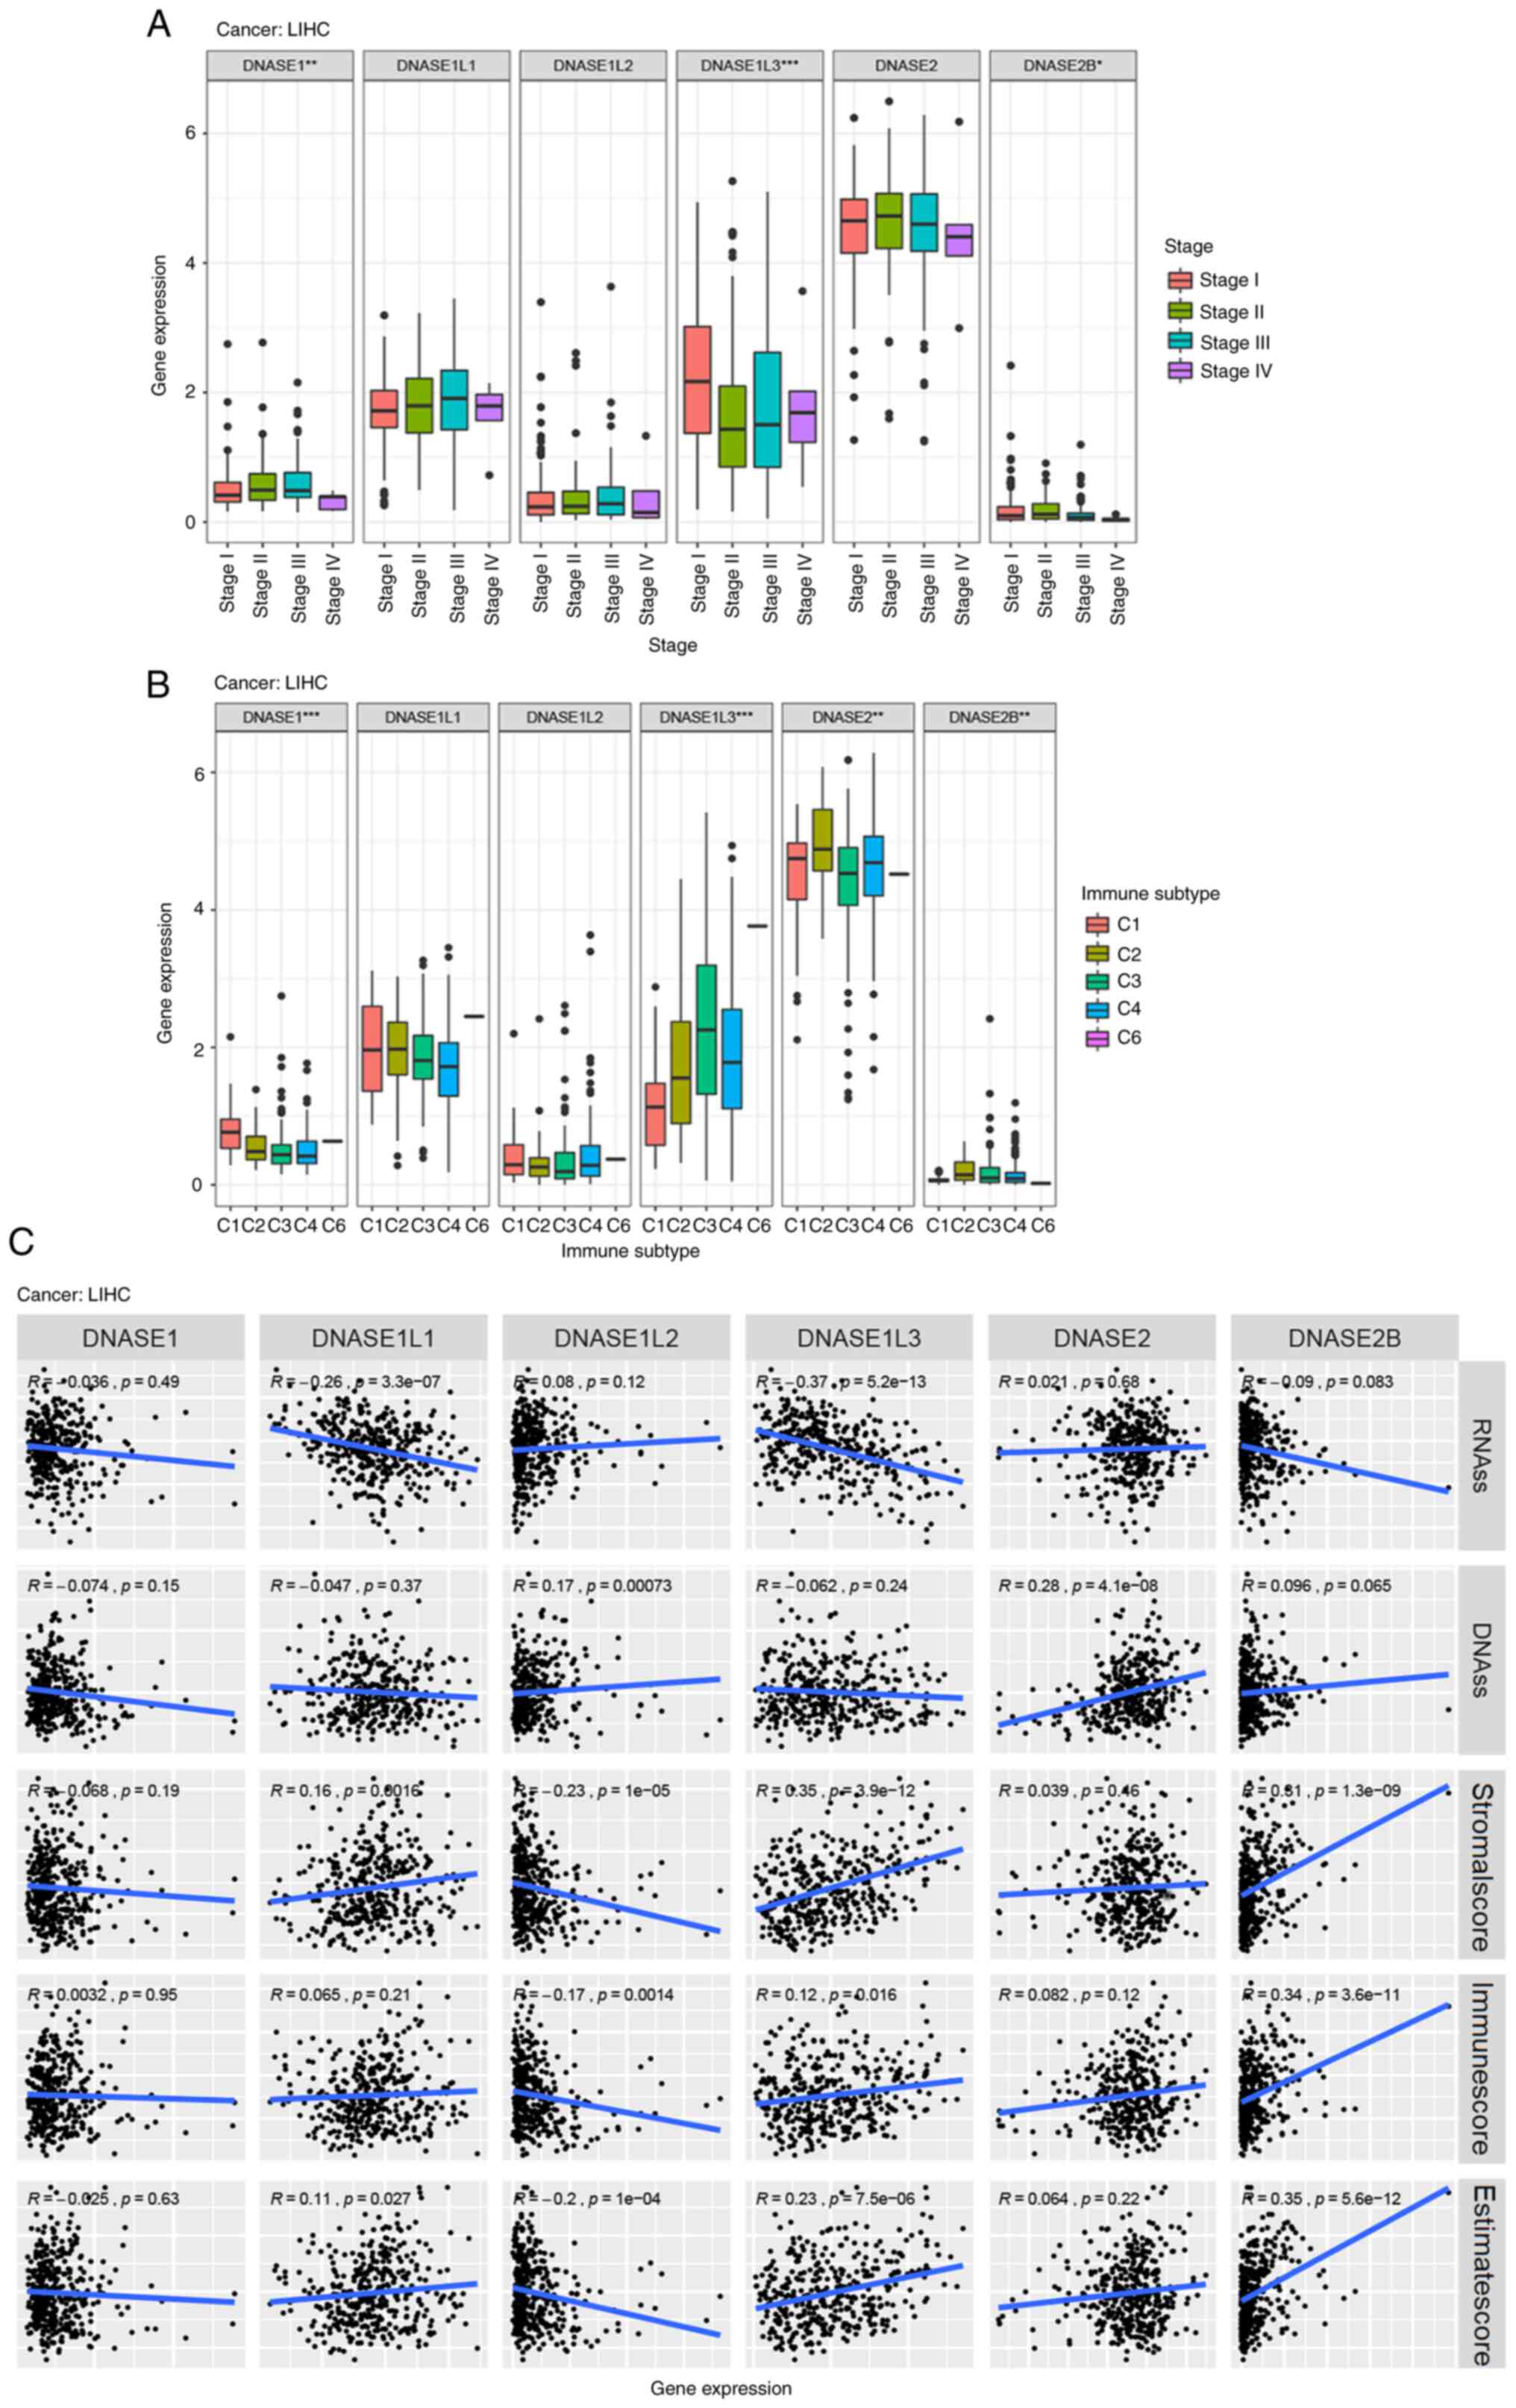 | Figure 6DNase gene expression in HCC. (A) The
relationship between the expression of DNase genes and the clinical
stage tested with ANOVA in HCC. The expression of DNASE1, DNASE1L3
and DNASE2B was associated with the stage of HCC.
*P<0.05, **P<0.01,
***P<0.001. (B) The relationship between the
expression of DNase genes and the immune infiltrate subtypes tested
with ANOVA in HCC. A significant correlation was detected between
DNASE1, DNASE1L3, DNASE2 and DNASE2B expression and immune subtype.
(C) The relationship between DNase gene expression and RNAss,
DNAss, stromal score, immune score, and Estimate Score in HCC. C1,
wound healing; C2, INF-r dominant; C3, inflammatory; C4, lymphocyte
depleted; C5, immunologically quiet; C6, TGF-β dominant; RNAss, RNA
stemness score; DNAss, DNA stemness score. |
DNASE1L3 in HCC
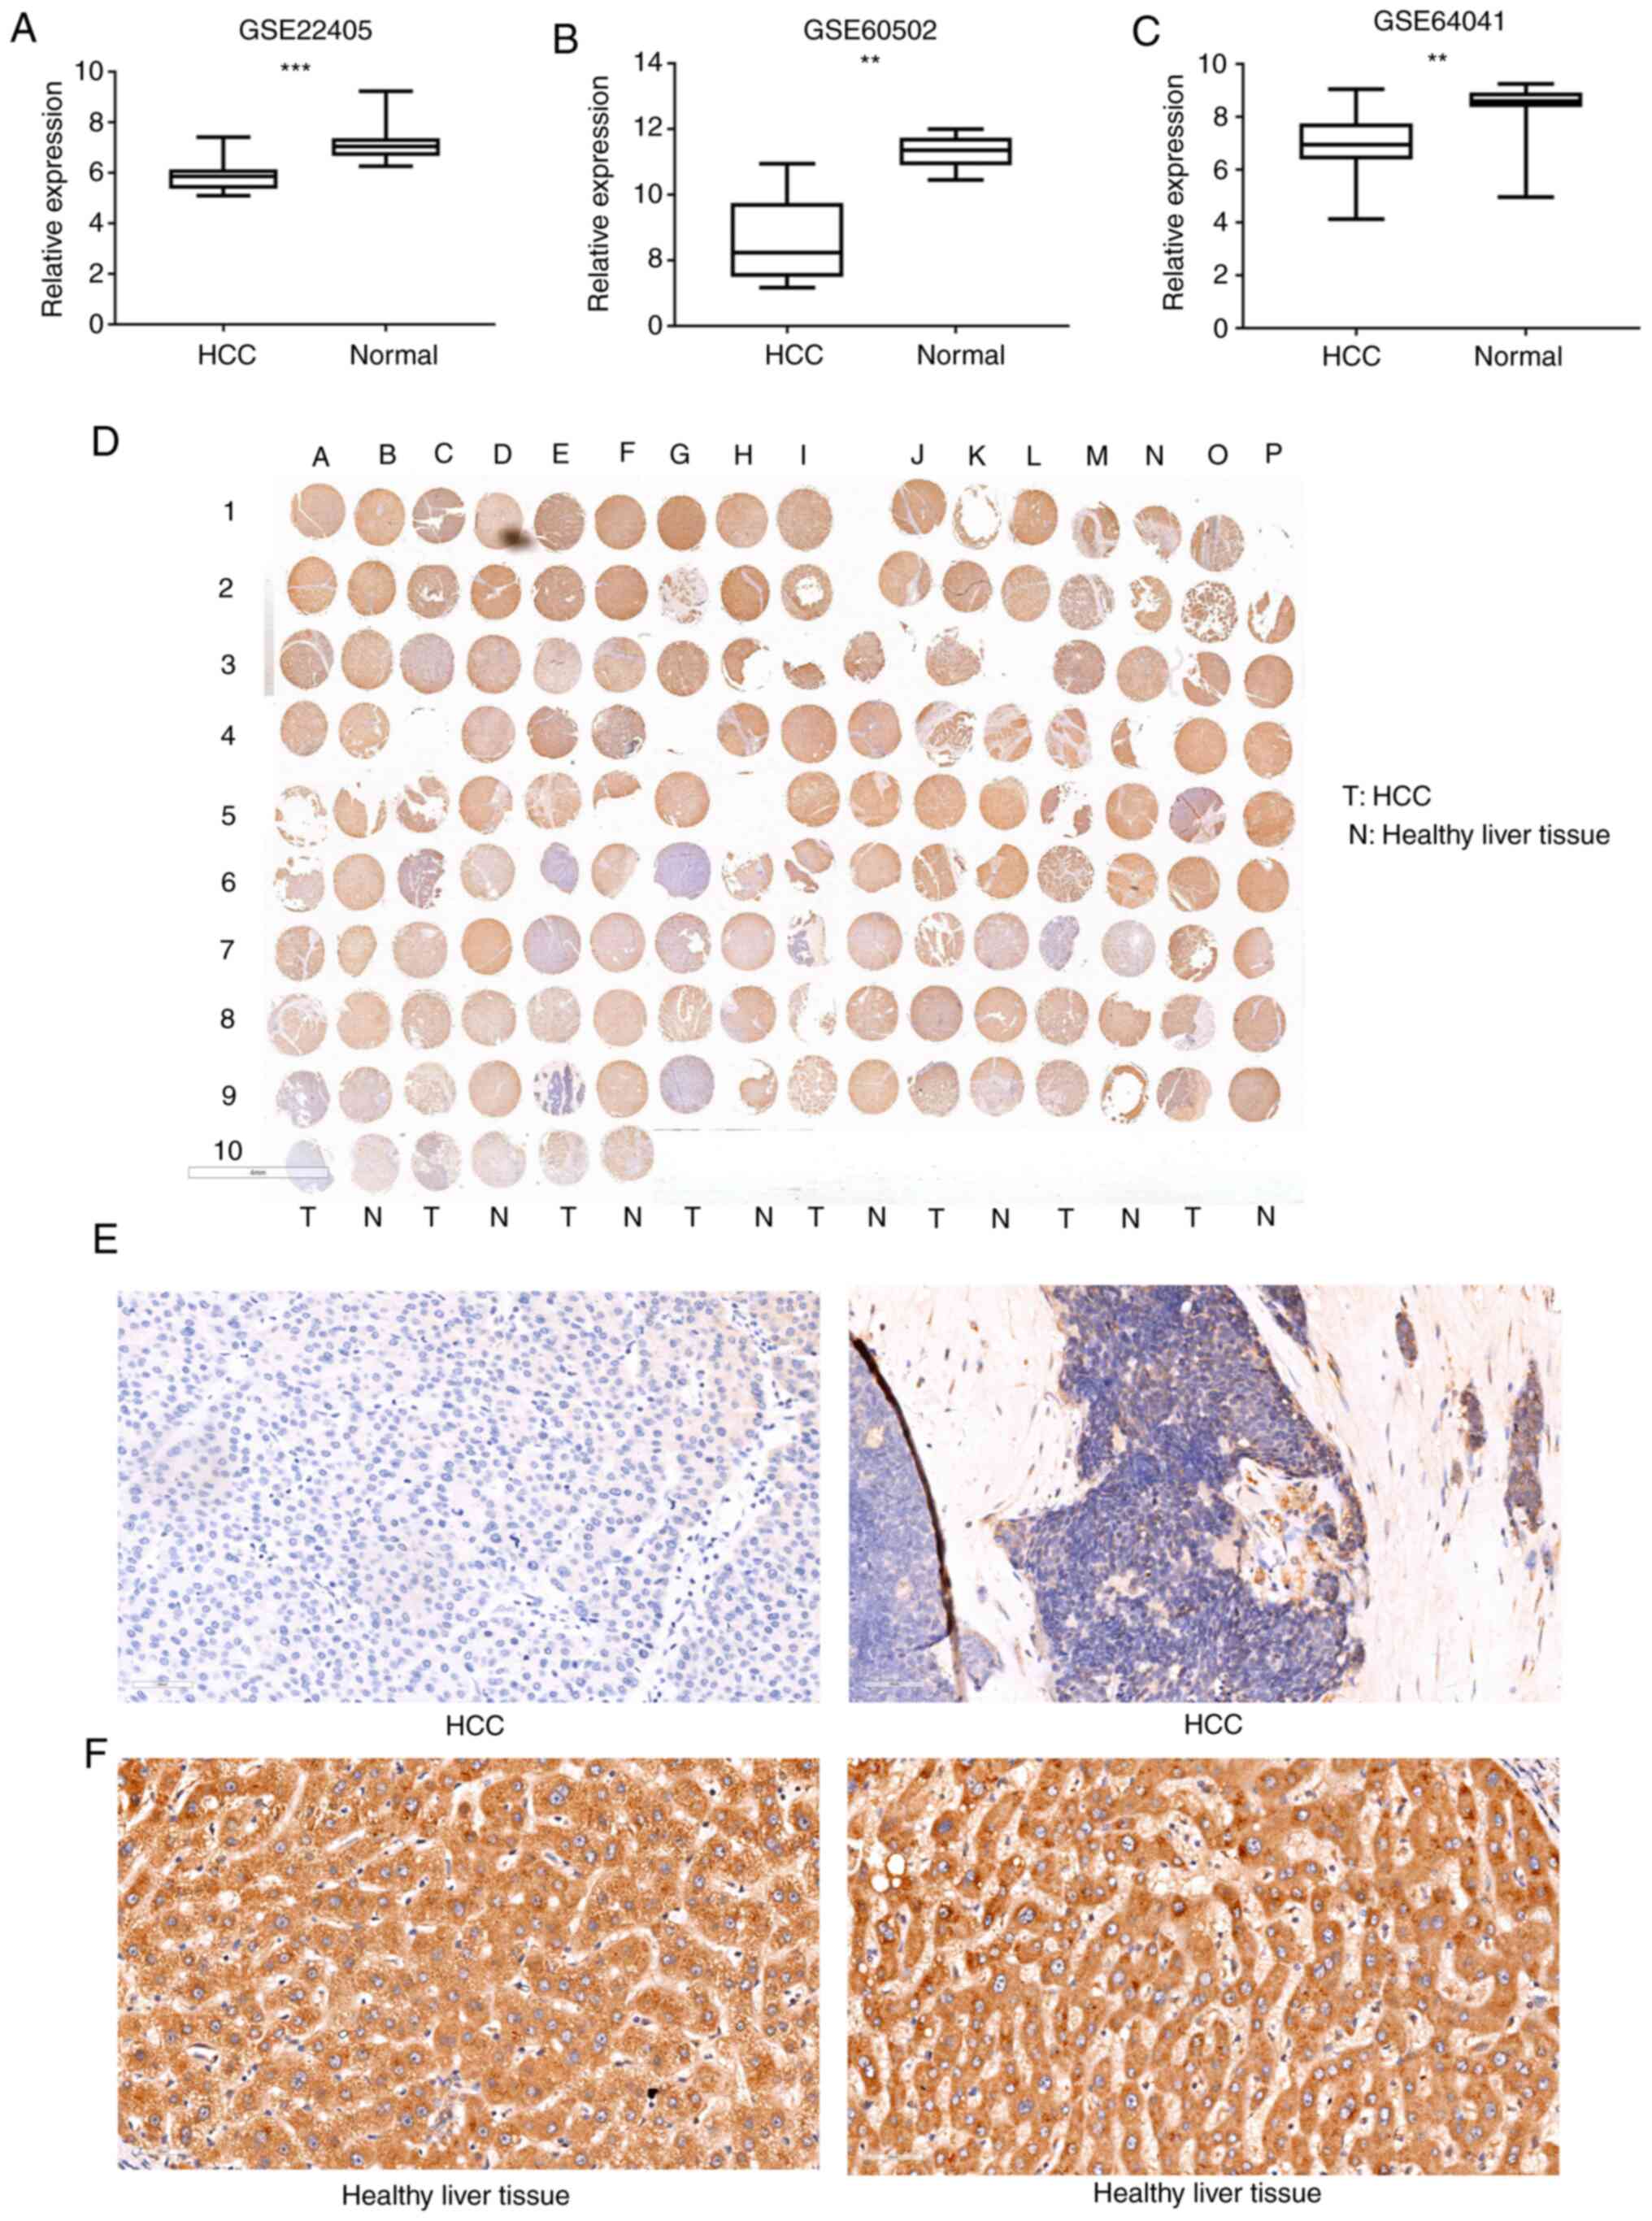
To test the expression of DNASE1L3 in HCC, GSE22405
from the GEO database was first analyzed, which included 24 paired
HCC samples and corresponding adjacent normal samples. DNASE1L3
expression was lower in the cancer tissues than in the adjacent
normal tissues (P<0.001, Fig.
7A). GSE60502 and GSE64041 exhibited a similar trend
(P<0.01; Fig. 7B and C). DNASE1L3 protein expression was
examined in a cohort of 75 HCC tissues and 75 paired adjacent
normal tissues by IHC staining (Fig.
7D; Table SXXIII). 5 cores
were completely lost during IHC staining and we did not score them
(Table SXXIII). And 5 cores
were fragmented (Table SXXIII).
The accuracy of scoring has been adversely affected. The staining
density of DNASE1L3 in the adjacent normal tissues had a more
intense coloring and broader distribution than that observed in the
HCC tissues (P<0.01). Representative images of DNASE1L3 in the
tumor and normal tissues are shown in Fig. 7E and F. It was proven that DNASE1L3 has a low
protein expression in tumors. The relationship between DNASE1L3
protein expression level and clinical information was also analyzed
(Table I). A significant
association was observed between DNASE1L3 protein expression, and
histological classification (P=0.046), T classification
(P<0.0001), and AJCC Clinical stage (P<0.0001) in HCC. We
verified the expression of DNASE1L3 in HCC and normal tissues and
the relationship between DNASE1L3 expression and clinical
information by IHC staining.
 | Table IRelationship between DNASE1L3 protein
staining in HCC composite score and clinical information. |
Table I
Relationship between DNASE1L3 protein
staining in HCC composite score and clinical information.
| HCC
clinicopathological parameter | Number of
samples | DNASE1L3 average
expression score | P-value |
|---|
| Sex | | | 0.804 |
|
Male | 60 | 3.150 | |
|
Female | 13 | 2.923 | |
| Age, years | | | 0.943 |
|
≤60 | 57 | 3.123 | |
|
>60 | 16 | 3.063 | |
| WHO histological
classification | | | 0.046a |
|
II | 38 | 3.474 | |
|
III | 10 | 1.200 | |
| T
classification | | |
<0.0001b |
|
T1 | 17 | 6.706 | |
|
T2 | 22 | 2.227 | |
|
T3 | 29 | 2.000 | |
|
T4 | 2 | 0.500 | |
| N
classification | | | 0.1349 |
|
N0 | 68 | 3.250 | |
|
N1 | 5 | 1.200 | |
| M
classification | | | 0.4431 |
|
M0 | 69 | 3.174 | |
|
M1 | 4 | 2.000 | |
| AJCC 7th edition
clinical stage | | |
<0.0001b |
|
1 | 17 | 6.706 | |
|
2 | 21 | 2.333 | |
|
3 | 26 | 1.923 | |
|
4 | 9 | 1.555 | |
Discussion
The DNase family, especially the members that target
DNA, is very important for our health, yet remains poorly
understood. The diversity of these enzymes enables the body to
regulate DNase activity in different organs according to the needs
of these organs, and the disorder of DNase members can lead to a
variety of diseases (10,46).
The present study was the first to systematically
analyze the DNase family genes in cancer. A great heterogeneity in
DNase gene expression was observed among different tumor types. In
general, the expression level of DNASE2 was the highest, while that
ofDNASE2B was the lowest. In addition, a strong expression
correlation was observed among DNASE1 and DNASE2 (r=-0.18), DNASE1
and DNASE1l2 (r=0.29), and DNASE2 and DNASE1l1 (r=0.22), but the
relationship between them requires further study. Compared with
paracancerous tissues, DNASE1L3 was mainly downregulated, while
DNASE1, DNASE1L1, DNASE1L2, DNASE2 and DNASE2B were mainly
upregulated. The relationship between the expression level of DNA
in cancer and patients was further tested by Univariate Cox
expression analysis and Kaplan-Meier survival estimate and found
that the correlation was cancer type-dependent. However, DNASE1L3
is usually associated with a favorable survival rate, while the
rest of the DNases have advantages and disadvantages.
In the tumor microenvironment, the expression of
DNase family genes was found to be associated with cytotoxic cell
content. Furthermore, tumors with a high cytotoxic cell level are
partly controlled by the immune system (45). In certain types of cancer,
increased levels of immunophenotypic cytotoxicity may increase
survival (45,47,48).
We hypothesized that DNases may affect a tumor prognosis by
affecting cytotoxic cells in the tumor microenvironment. To explore
the specific influence of DNase genes on the microenvironment of
various tumors, the correlation between DNase genes and various
components was explored in the tumor microenvironment of 33 types
of cancer. The expression of DNASE1 and DNASE1L2 was found to be
associated with the decrease of immune and stromal components and
increase of tumor components in the tumor microenvironment.
Furthermore, the expression of DNASE1L1, DNASE1L3, DNASE2 and
DNASE2B was associated with the increase of immune and matrix
components and decrease of tumor components in the tumor
microenvironment. The synergistic effect between cancer cells and
their supporting cells leads to cancer phenotypes, such as immortal
proliferation, resistance to apoptosis and evasion of immune
surveillance (49). Furthermore,
the tumor microenvironment significantly affects the response and
clinical outcomes of cancer patients (50,51).
The relationship between DNase and tumor microenvironment may
partly explain the results of DNase survival analysis. For example,
in LIHC and LUAD, the high expression of DNASE1L3 was associated
with more stromal, more immune and fewer tumor components in the
tumor microenvironment. Thus, patients with a high DNASE1L3
expression exhibited a favorable prognosis. The high expression of
DNASE1L2 was related to more tumors, and less immune and stromal
components in the tumor microenvironment in KIRC and MESO.
Moreover, patients with a high DNASE1L2 expression exhibited a poor
prognosis.
The relationship between DNase and the tumor
stemness is diverse, depending on tumor type. However, in certain
tumors, DNase is closely associated with tumor stemness. For
example, DNASE1 in KIRP, DNASE1L1 in GBM, DNASE1L3 in BRCA, DNASE2
in LAML, DNASE2B in LGG, DNASE1L2 in DLBC, DNASE1L3 in THYM, DNASE1
in THYM, DNASE1L2 in LAML, DNASE1L3 in DLBC, DNASE2 in THCA,
DNASE2B in DLBC, DNASE1 in GBM, DNASE1L1 in THYM, DNASE1L2 in UCS,
DNASE1L3 in TGCT, DNASE2 in THYM and DNASE2B in PCPG. Stemness is
the potential for self-renewal and differentiation with primitive
cells. Cancer progression includes the gradual loss of
differentiated phenotypes and the acquisition of progenitor-like
and stem cell-like features. Undifferentiated primary tumors are
more likely to cause cancer cells to spread to distant organs,
leading to disease progression and poor prognosis, especially since
metastases are usually resistant to existing treatments (52-55).
Using NCI-60 cell line data, increased DNase
expression was found to be associated with increased drug
resistance to some FDA-approved chemotherapy drugs, such as
dasatinib. Of course, the different DNase members are also
associated with an increased sensitivity to certain drugs, such as
hydroxyurea, uracil mustard, chlorambucil, triethylenemelamine,
pipobroman, thiotepa, chelerythrine, 8-chloro-adenosine, RH1,
imexon, melphalan and idarubicin. These data suggested that DNase
may play a role in the sensitivity or resistance of tumor cells to
drug therapy and can be used as a therapeutic target to overcome
drug-induced resistance or adjuvant drug sensitivity.
DNase expression in HCC was also studied, and it was
found that DNASE, DNASE1L3, DNASE2 and DNASE2B were associated with
immune subtypes in HCC. Furthermore, the expression of DNASE1,
DNASE1L3 and DNASE2B was different at different stages of the
tumor. DNASE1L3 showed a negative correlation with RNAss in HCC,
while DNASE1L2 and DNASE2 showed a positive correlation with DNAss
in HCC. DNASE1L3 and DNASE2B were positively correlated with
Stromalscore, Immunescore and Estimatescore, whereas DNASE1L2 was
negatively correlated with all three. These findings suggested that
DNASE1L3 and DNASE2B may exhibit a favorable prognosis, but
DNASEL1L2 does not. The prognosis of patients with a high DNASE1L3
expression in HCC was better than those with a low expression, as
shown by Univariate Cox expression analysis (P<0.001) and
Kaplan-Meier survival estimate (P<0.001). DNASE1L3 inhibits HCC
by inducing apoptosis and reprogramming glucose metabolism and
interacting with β-catenin to promote its ubiquitin degradation
pathway (26,28). And DNASE1L3 is a prognostic
biomarker associated in cancer (27). Three datasets from the GEO database
and IHC were used to verify the difference in DNASE1L3 expression
between HCC and normal tissues. The expression of DNASE1L3 in HCC
was significantly lower than that in adjacent normal tissues. A
significant association was observed between DNASE1L3 protein
expression and histological classification, T classification, and
AJCC Clinical stage in HCC.
In conclusion, a comprehensive and systematic study
of pan-cancer data on the expression of all six DNases was
conducted, and its relationship with patient survival,
co-expression analysis, immune infiltration subtypes, tumor
microenvironment and drug sensitivity was studied. In conclusion,
the present study confirmed the value of further laboratory
research on DNase and its prospects in clinical cancer
treatment.
Supplementary Material
The expression of DNASE1 is associated
with survival in (A) BLCA, (B) KIRC, (C) PAAD and (D) THYM. BLCA,
bladder urothelial carcinoma; KIRC, kidney renal clear cell
carcinoma; PAAD, pancreatic adenocarcinoma; THYM, thymoma.
The expression of DNASE1L1 is
associated with survival in (A) LALM, (B) LGG, (C) SARC, (D) UVM,
(E) ACC and (F) GBM. LAML, acute myeloid leukemia; LGG, brain lower
grade glioma; SARC, sarcoma; UVM, uveal melanoma; ACC,
adrenocortical carcinoma; GBM, glioblastoma multiforme.
The expression of DNASE1L2 is
associated with survival (A) CESC, (B) COAD, (C) KIRC, (D) MESO,
(E) PAAD, (F) UVM, (G) ACC and (H) BLCA. CESC, cervical squamous
cell carcinoma and endocervical adenocarcinoma; COAD, colon
adenocarcinoma; KIRC, kidney renal clear cell carcinoma; MESO,
mesothelioma; PAAD, pancreatic adenocarcinoma; UVM, uveal melanoma;
ACC, adrenocortical carcinoma; BLCA, bladder urothelial
carcinoma.
The expression of DNASE1L3 is
associated with survival (A) PCPG, (B) SARC, (C) UVM, (D) ACC, (E)
CESC, (F) KICH, (G) KIRC, (H) KIRP, (I) LIHC, (J) LUAD and (K)
PAAD. PCPG, pheochromocytoma and paraganglioma; SARC, sarcoma; UVM,
uveal melanoma; ACC, adrenocortical carcinoma; CESC, cervical
squamous cell carcinoma and endocervical adenocarcinoma; KICH,
kidney chromophobe; KIRC, kidney renal clear cell carcinoma; KIRP,
kidney renal papillary cell carcinoma; LIHC, liver hepatocellular
carcinoma; LUAD, lung adenocarcinoma; PAAD, pancreatic
adenocarcinoma.
The expression of DNASE2 is associated
with survival in some cancers. (A) SARC, (B) SKCM, (C) KICH, (D)
LGG and (E) MESO. SARC, sarcoma; SKCM, skin cutaneous melanoma;
KICH, kidney chromophobe; LGG, brain lower grade glioma; MESO,
mesothelioma.
The expression of DNASE2B is
associated with survival (A) KIRP, (B) LGG, (C) LUAD, (D) SKCM, (E)
UVM, (F) BLCA, (G) DLBC and (H) KIRC. KIRP, kidney renal papillary
cell carcinoma; LGG, brain lower grade glioma; LUAD, lung
adenocarcinoma; SKCM, skin cutaneous melanoma; UVM, uveal melanoma;
BLCA, bladder urothelial carcinoma; DLBC, lymphoid neoplasm diffuse
large B-cell lymphoma; KIRC, kidney renal clear cell
carcinoma.
Expression level of DNase family genes
in tumor and tumor-adjacent normal tissues of all 33 cancer types
in TCGA data set.
The logFC of expression of DNase
family genes in tumor and adjacent normal tissues.
The P-value of expression of DNase
family genes in tumor and adjacent normal tissues.
Univariate Cox expression analysis of
DNASE1.
Univariate Cox expression analysis of
DNASE1L1.
Univariate Cox expression analysis of
DNASE1L2.
Univariate Cox expression analysis of
DNASE1L3.
Univariate Cox expression analysis of
DNASE2.
Univariate Cox expression analysis of
DNSE2B.
The correlation of DNase expression
and the stromal score in different cancer types.
The P-value of DNase expression and
the stromal score in different cancer types.
The correlation of DNase expression
and the immune score in different cancer types.
The P-value of DNase expression and
the immune score in different cancer types.
The correlation of DNase expression
and the ESTIMATES score in different cancer types.
The P-value of DNase expression and
the ESTIMATES score in different cancer types.
The correlation of DNase expression
and the tumorpurity in different cancer types.
The P-value of DNase expression and
the tumorpurity in different cancer types.
The correlation of DNase genes
expression and RNAss.
The P-value of DNase genes expression
and RNAss.
The correlation of DNase genes
expression and DNAss.
The P-value of DNase genes expression
and DNAss.
The correlation between DNase gene
expression levels in the 60 human cancer cell lines (NCI-60) with
drug sensitivity of over 200 chemotherapy drugs.
The staining composite score for each
tissue section.
Acknowledgements
Not applicable.
Funding
Funding: No funding was received.
Availability of data and materials
The datasets analyzed during the current study are
available in the GEO and TCGA repository, https://www.cancer.gov/about-nci/organization/ccg/research/structural-genomics/tcga;
https://www.ncbi.nlm.nih.gov/gds/?term=GSE22405;
https://www.ncbi.nlm.nih.gov/gds/?term=GSE60502;
https://www.ncbi.nlm.nih.gov/gds/?term=GSE64041. The
other datasets used and/or analyzed during the current study are
available from the corresponding author on reasonable request.
Authors' contributions
QQB and THH were responsible for conceptualization
of the study, IHC and stain scoring, writing the original draft,
formal analysis and investigation, data curation, and the writing,
review and editing of the final manuscript. HX was responsible for
stain scoring and formal analysis. QQB and THH confirm the
authenticity of all the raw data. All authors read and approved the
final manuscript.
Ethics approval and consent to
participate
The acquisition of liver tissue and the production
of tissue sections were reviewed and approved by the Shanghai Outdo
Biotech Co., Ltd. ethics committee (YBM-05-01). Xiamen University
Medical Ethics Committee do not require ethics approval for
authors' commercially purchased human tissue section when the
company has the appropriate ethical approval to make tissue
chips.
Patient consent for publication
Not applicable.
Competing interests
The authors declare that they have no competing
interests.
References
|
1
|
Keyel PA: Dnases in health and disease.
Dev Biol. 429:1–11. 2017.PubMed/NCBI View Article : Google Scholar
|
|
2
|
Yasutomo K, Horiuchi T, Kagami S,
Tsukamoto H, Hashimura C, Urushihara M and Kuroda Y: Mutation of
DNASE1 in people with systemic lupus erythematosus. Nat Genet.
28:313–314. 2001.PubMed/NCBI View
Article : Google Scholar
|
|
3
|
Bodaño A, Amarelo J, González A,
Gómez-Reino JJ and Conde C: Novel DNASE I mutations related to
systemic lupus erythematosus. Arthritis Rheum. 50:4070–4071.
2004.PubMed/NCBI View Article : Google Scholar
|
|
4
|
Frost PG and Lachmann PJ: The relationship
of desoxyribonuclease inhibitor levels in human sera to the
occurrence of antinuclear antibodies. Clin Exp Immunol. 3:447–455.
1968.PubMed/NCBI
|
|
5
|
Tew MB, Johnson RW, Reveille JD and Tan
FK: A molecular analysis of the low serum deoxyribonuclease
activity in lupus patients. Arthritis Rheum. 44:2446–2447.
2001.PubMed/NCBI View Article : Google Scholar
|
|
6
|
Sallai K, Nagy E, Derfalvy B, Müzes G and
Gergely P: Antinucleosome antibodies and decreased
deoxyribonuclease activity in sera of patients with systemic lupus
erythematosus. Clin Diagn Lab Immunol. 12:56–59. 2005.PubMed/NCBI View Article : Google Scholar
|
|
7
|
Hakkim A, Fürnrohr BG, Amann K, Laube B,
Abed UA, Brinkmann V, Herrmann M, Voll RE and Zychlinsky A:
Impairment of neutrophil extracellular trap degradation is
associated with lupus nephritis. Proc Natl Acad Sci USA.
107:9813–9818. 2010.PubMed/NCBI View Article : Google Scholar
|
|
8
|
Parrish JE, Ciccodicola A, Wehhert M, Cox
GF, Chen E and Nelson DL: A muscle-specific DNase I-like gene in
human Xq28. Hum Mol Genet. 4:1557–1564. 1995.PubMed/NCBI View Article : Google Scholar
|
|
9
|
Los M, Neubüser D, Coy JF, Mozoluk M,
Poustka A and Schulze-Osthoff K: Functional characterization of
DNase X, a novel endonuclease expressed in muscle cells.
Biochemistry. 39:7365–7373. 2000.PubMed/NCBI View Article : Google Scholar
|
|
10
|
Shiokawa D and Tanuma S: Characterization
of human DNase I family endonucleases and activation of DNase gamma
during apoptosis. Biochemistry. 40:143–152. 2001.PubMed/NCBI View Article : Google Scholar
|
|
11
|
Shiokawa D, Shika Y, Saito K, Yamazaki K
and Tanuma S: Physical and biochemical properties of mammalian
DNase X proteins: Non-AUG translation initiation of porcine and
bovine mRNAs for DNase X. Biochem J. 392:511–517. 2005.PubMed/NCBI View Article : Google Scholar
|
|
12
|
Shiokawa D, Matsushita T, Shika Y, Shimizu
M, Maeda M and Tanuma S: DNase X is a
glycosylphosphatidylinositol-anchored membrane enzyme that provides
a barrier to endocytosis-mediated transfer of a foreign gene. J
Biol Chem. 282:17132–17140. 2007.PubMed/NCBI View Article : Google Scholar
|
|
13
|
Malferrari G, Mazza U, Tresoldi C, Rovida
E, Nissim M, Mirabella M, Servidei S and Biunno I: Molecular
characterization of a novel endonuclease (Xib) and possible
involvement in lysosomal glycogen storage disorders. Exp Mol
Pathol. 66:123–130. 1999.PubMed/NCBI View Article : Google Scholar
|
|
14
|
Malferrari G, Mirabella M, D'Alessandra Y,
Servidei S and Biunno I: Deletion polymorphism of DNASE1L1, an
X-linked DNase I-like gene, in acid maltase deficiency disorders.
Exp Mol Pathol. 70:173–174. 2001.PubMed/NCBI View Article : Google Scholar
|
|
15
|
Fischer H, Eckhart L, Mildner M, Jaeger K,
Buchberger M, Ghannadan M and Tschachler E: DNase1L2 degrades
nuclear DNA during corneocyte formation. J Invest Dermatol.
127:24–30. 2007.PubMed/NCBI View Article : Google Scholar
|
|
16
|
Fischer H, Szabo S, Scherz J, Jaeger K,
Rossiter H, Buchberger M, Ghannadan M, Hermann M, Theussl HC, Tobin
DJ, et al: Essential role of the keratinocyte-specific endonuclease
DNase1L2 in the removal of nuclear DNA from hair and nails. J
Invest Dermatol. 131:1208–1215. 2011.PubMed/NCBI View Article : Google Scholar
|
|
17
|
Napirei M, Ricken A, Eulitz D, Knoop H and
Mannherz HG: Expression pattern of the deoxyribonuclease 1 gene:
Lessons from the Dnase1 knockout mouse. Biochem J. 380:929–937.
2004.PubMed/NCBI View Article : Google Scholar
|
|
18
|
Peitsch MC, Irmler M, French LE and
Tschopp J: Genomic organisation and expression of mouse
deoxyribonuclease I. Biochem Biophys Res Commun. 207:62–68.
1995.PubMed/NCBI View Article : Google Scholar
|
|
19
|
Napirei M, Ludwig S, Mezrhab J, Klöckl T
and Mannherz HG: Murine serum nucleases-contrasting effects of
plasmin and heparin on the activities of DNase1 and DNase1-like 3
(DNase1l3). FEBS J. 276:1059–1073. 2009.PubMed/NCBI View Article : Google Scholar
|
|
20
|
Boulares AH, Zoltoski AJ, Contreras FJ,
Yakovlev AG, Yoshihara K and Smulson ME: Regulation of DNAS1L3
endonuclease activity by poly(ADP-ribosyl)ation during
etoposide-induced apoptosis. Role of poly(ADP-ribose) polymerase-1
cleavage in endonuclease activation. J Biol Chem. 277:372–378.
2002.PubMed/NCBI View Article : Google Scholar
|
|
21
|
Liu QY, Lei JX, LeBlanc J, Sodja C, Ly D,
Charlebois C, Walker PR, Yamada T, Hirohashi S and Sikorska M:
Regulation of DNaseY activity by actinin-alpha4 during apoptosis.
Cell Death Differ. 11:645–654. 2004.PubMed/NCBI View Article : Google Scholar
|
|
22
|
Shiokawa D, Kobayashi T and Tanuma S:
Involvement of DNase gamma in apoptosis associated with myogenic
differentiation of C2C12 cells. J Biol Chem. 277:31031–31037.
2002.PubMed/NCBI View Article : Google Scholar
|
|
23
|
Mizuta R, Araki S, Furukawa M, Furukawa Y,
Ebara S, Shiokawa D, Hayashi K, Tanuma S and Kitamura D: DNase γ is
the effector endonuclease for internucleosomal DNA fragmentation in
necrosis. PLoS One. 8(e80223)2013.PubMed/NCBI View Article : Google Scholar
|
|
24
|
Shiokawa D, Tanaka M, Kimura T, Hashizume
K, Takasawa R, Ohyama H, Fujita K, Yamada T and Tanuma S:
Characterization of two DNase gamma-specific monoclonal antibodies
and the in situ detection of DNase gamma in the nuclei of apoptotic
rat thymocytes. Biochem Biophys Res Commun. 275:343–349.
2000.PubMed/NCBI View Article : Google Scholar
|
|
25
|
Higami Y, Tsuchiya T, To K, Chiba T,
Yamaza H, Shiokawa D, Tanuma S and Shimokawa I: Expression of DNase
gamma during Fas-independent apoptotic DNA fragmentation in rodent
hepatocytes. Cell Tissue Res. 316:403–407. 2004.PubMed/NCBI View Article : Google Scholar
|
|
26
|
Xiao Y, Yang K, Liu P, Ma D, Lei P and Liu
Q: Deoxyribonuclease 1-like 3 inhibits hepatocellular carcinoma
progression by inducing apoptosis and reprogramming glucose
metabolism. Int J Biol Sci. 18:82–95. 2022.PubMed/NCBI View Article : Google Scholar
|
|
27
|
Deng Z, Xiao M, Du D, Luo N, Liu D, Liu T,
Lian D and Peng J: DNASE1L3 as a prognostic biomarker associated
with immune cell infiltration in cancer. Onco Targets Ther.
14:2003–2017. 2021.PubMed/NCBI View Article : Google Scholar
|
|
28
|
Li B, Ge Y, Yan W, Gong B, Cao K, Zhao R,
Li C, Zhang Y, Jiang Y and Zuo S: DNASE1L3 inhibits proliferation,
invasion and metastasis of hepatocellular carcinoma by interacting
with β-catenin to promote its ubiquitin degradation pathway. Cell
Prolif. 55(e13273)2022.PubMed/NCBI View Article : Google Scholar
|
|
29
|
Al-Mayouf SM, Sunker A, Abdwani R, Abrawi
SA, Almurshedi F, Alhashmi N, Al Sonbul A, Sewairi W, Qari A,
Abdallah E, et al: Loss-of-function variant in DNASE1L3 causes a
familial form of systemic lupus erythematosus. Nat Genet.
43:1186–118. 2011.PubMed/NCBI View
Article : Google Scholar
|
|
30
|
Zochling J, Newell F, Charlesworth JC, Leo
P, Stankovich J, Cortes A, Zhou Y, Stevens W, Sahhar J, Roddy J, et
al: An Immunochip-based interrogation of scleroderma susceptibility
variants identifies a novel association at DNASE1L3. Arthritis Res
Ther. 16(438)2014.PubMed/NCBI View Article : Google Scholar
|
|
31
|
Ozçakar ZB, Foster J II, Diaz-Horta O,
Kasapcopur O, Fan YS, Yalçınkaya F and Tekin M: DNASE1L3 mutations
in hypocomplementemic urticarial vasculitis syndrome. Arthritis
Rheum. 65:2183–2189. 2013.PubMed/NCBI View Article : Google Scholar
|
|
32
|
Odaka C and Mizuochi T: Role of macrophage
lysosomal enzymes in the degradation of nucleosomes of apoptotic
cells. J Immunol. 163:5346–5352. 1999.PubMed/NCBI
|
|
33
|
Fischer H, Scherz J, Szabo S, Mildner M,
Benarafa C, Torriglia A, Tschachler E and Eckhart L: DNase 2 is the
main DNA-degrading enzyme of the stratum corneum. PLoS One.
6(e17581)2011.PubMed/NCBI View Article : Google Scholar
|
|
34
|
Kawane K, Fukuyama H, Kondoh G, Takeda J,
Ohsawa Y, Uchiyama Y and Nagata S: Requirement of DNase II for
definitive erythropoiesis in the mouse fetal liver. Science.
292:1546–1549. 2001.PubMed/NCBI View Article : Google Scholar
|
|
35
|
Yoshida H, Okabe Y, Kawane K, Fukuyama H
and Nagata S: Lethal anemia caused by interferon-beta produced in
mouse embryos carrying undigested DNA. Nat Immunol. 6:49–56.
2005.PubMed/NCBI View
Article : Google Scholar
|
|
36
|
Kawane K, Ohtani M, Miwa K, Kizawa T,
Kanbara Y, Yoshioka Y, Yoshikawa H and Nagata S: Chronic
polyarthritis caused by mammalian DNA that escapes from degradation
in macrophages. Nature. 443:998–1002. 2006.PubMed/NCBI View Article : Google Scholar
|
|
37
|
Shiokawa D and Tanuma S: DLAD, a novel
mammalian divalent cation-independent endonuclease with homology to
DNase II. Nucleic Acids Res. 27:4083–4089. 1999.PubMed/NCBI View Article : Google Scholar
|
|
38
|
Krieser RJ, MacLea KS, Park JP and Eastman
A: The cloning, genomic structure, localization, and expression of
human deoxyribonuclease IIbeta. Gene. 269:205–216. 2001.PubMed/NCBI View Article : Google Scholar
|
|
39
|
Nishimoto S, Kawane K, Watanabe-Fukunaga
R, Fukuyama H, Ohsawa Y, Uchiyama Y, Hashida N, Ohguro N, Tano Y,
Morimoto T, et al: Nuclear cataract caused by a lack of DNA
degradation in the mouse eye lens. Nature. 424:1071–1074.
2003.PubMed/NCBI View Article : Google Scholar
|
|
40
|
Siddam AD, Gautier-Courteille C,
Perez-Campos L, Anand D, Kakrana A, Dang CA, Legagneux V, Méreau A,
Viet J, Gross JM, et al: The RNA-binding protein Celf1
post-transcriptionally regulates p27Kip1 and Dnase2b to control
fiber cell nuclear degradation in lens development. PLoS Genet.
14(e1007278)2018.PubMed/NCBI View Article : Google Scholar
|
|
41
|
From the American Association of
Neurological Surgeons (AANS), American Society of Neuroradiology
(ASNR), Cardiovascular and Interventional Radiology Society of
Europe (CIRSE), Canadian Interventional Radiology Association
(CIRA), Congress of Neurological Surgeons (CNS), European Society
of Minimally Invasive Neurological Therapy (ESMINT), European
Society of Neuroradiology (ESNR), European Stroke Organization
(ESO), Society for Cardiovascular Angiography and Interventions
(SCAI), Society of Interventional Radiology (SIR) et al.
Multisociety consensus quality improvement revised consensus
statement for endovascular therapy of acute ischemic stroke. Int J
Stroke. 13:612–632. 2018.PubMed/NCBI View Article : Google Scholar
|
|
42
|
Thorsson V, Gibbs DL, Brown SD, Wolf D,
Bortone DS, Ou Yang TH, Porta-Pardo E, Gao GF, Plaisier CL, Eddy
JA, et al: The immune landscape of cancer. Immunity.
48:812–830.e14. 2014.
|
|
43
|
Yoshihara K, Shahmoradgoli M, Martínez E,
Vegesna R, Kim H, Torres-Garcia W, Treviño V, Shen H, Laird PW,
Levine DA, et al: Inferring tumour purity and stromal and immune
cell admixture from expression data. Nat Commun.
4(2612)2013.PubMed/NCBI View Article : Google Scholar
|
|
44
|
Malta TM, Sokolov A, Gentles AJ,
Burzykowski T, Poisson L, Weinstein JN, Kamińska B, Huelsken J,
Omberg L, Gevaert O, et al: Machine learning identifies stemness
features associated with oncogenic dedifferentiation. Cell.
173:338–354.e15. 2018.PubMed/NCBI View Article : Google Scholar
|
|
45
|
Tamborero D, Rubio-Perez C, Muiños F,
Sabarinathan R, Piulats JM, Muntasell A, Dienstmann R, Lopez-Bigas
N and Gonzalez-Perez A: A Pan-cancer landscape of interactions
between solid tumors and infiltrating immune cell populations. Clin
Cancer Res. 24:3717–3728. 2018.PubMed/NCBI View Article : Google Scholar
|
|
46
|
Counis MF and Torriglia A: Acid DNases and
their interest among apoptotic endonucleases. Biochimie.
88:1851–1858. 2006.PubMed/NCBI View Article : Google Scholar
|
|
47
|
Charoentong P, Finotello F, Angelova M,
Mayer C, Efremova M, Rieder D, Hackl H and Trajanoski Z: Pan-cancer
immunogenomic analyses reveal genotype-immunophenotype
relationships and predictors of response to checkpoint blockade.
Cell Rep. 18:248–262. 2017.PubMed/NCBI View Article : Google Scholar
|
|
48
|
Senovilla L, Vacchelli E, Galon J,
Adjemian S, Eggermont A, Fridman WH, Sautès-Fridman C, Ma Y,
Tartour E, Zitvogel L, et al: Trial watch: Prognostic and
predictive value of the immune infiltrate in cancer.
Oncoimmunology. 1:1323–1343. 2012.PubMed/NCBI View Article : Google Scholar
|
|
49
|
Bi KW, Wei XG, Qin XX and Li B: BTK has
potential to be a prognostic factor for lung adenocarcinoma and an
indicator for tumor microenvironment remodeling: A study based on
TCGA data mining. Front Oncol. 10(424)2020.PubMed/NCBI View Article : Google Scholar
|
|
50
|
Wood SL, Pernemalm M, Crosbie PA and
Whetton AD: The role of the tumor-microenvironment in lung
cancer-metastasis and its relationship to potential therapeutic
targets. Cancer Treat Rev. 40:558–566. 2014.PubMed/NCBI View Article : Google Scholar
|
|
51
|
Quail DF and Joyce JA: Microenvironmental
regulation of tumor progression and metastasis. Nat Med.
19:1423–1437. 2013.PubMed/NCBI View Article : Google Scholar
|
|
52
|
Friedmann-Morvinski D and Verma IM:
Dedifferentiation and reprogramming: Origins of cancer stem cells.
EMBO Rep. 15:244–253. 2014.PubMed/NCBI View Article : Google Scholar
|
|
53
|
Ge Y, Gomez NC, Adam RC, Nikolova M, Yang
H, Verma A, Lu CP, Polak L, Yuan S, Elemento O and Fuchs E: Stem
cell lineage infidelity drives wound repair and cancer. Cell.
169:636–650.e14. 2017.PubMed/NCBI View Article : Google Scholar
|
|
54
|
Shibue T and Weinberg RA: EMT, CSCs, and
drug resistance: The mechanistic link and clinical implications.
Nat Rev Clin Oncol. 14:611–629. 2017.PubMed/NCBI View Article : Google Scholar
|
|
55
|
Visvader JE and Lindeman GJ: Cancer Stem
cells: Current status and evolving complexities. Cell Stem Cell.
10:717–728. 2012.PubMed/NCBI View Article : Google Scholar
|