Introduction
Chronic myeloid leukemia (CML) is a
myeloproliferative neoplasm characterized by an abnormal
proliferation of myeloid cells in bone marrow and accounts for
approximately 15% of all adult leukemias (1). CML is the first type of cancer in which
an underlying genetic mechanism was identified, and
pathogenesis-specific targeted therapy can be successfully applied.
The Philadelphia (Ph) chromosome originated from reciprocal
translocation between the Abelson murine leukemia 1 (ABL1) gene on
chromosome 9 (9q34) and the breakpoint cluster region (BCR) gene on
chromosome 22 (22q11), is responsible for the pathogenesis of CML.
The Ph chromosome is detected in 95% of cases. The product of this
translocation, the BCR-ABL1 fusion protein, is responsible for
cellular differentiation in myeloid cells with irregular and
excessive tyrosine kinase activity, leading to increased
proliferation and the inhibition of apoptosis (2).
Tyrosine kinase inhibitors (TKIs) and
resistance development
Currently, tyrosine kinase protein-specific
inhibitory drugs have been developed and are successfully used for
the treatment of CML. The first of these drugs is imatinib
mesylate. Imatinib binds to the ABL1 kinase domain of the BCR-ABL1
fusion protein and inhibits tyrosine kinase activity. After the
discovery of this drug, a significant increase in the survival
expectancy and quality of life of patients with CML was observed
(3).
Over the years, the addition of imatinib to CML
therapy has increased the 5-year survival rate of patients with CML
from 22 to 69% (4). However, ~25% of
patients do not benefit from imatinib treatment (primary
resistance) (5).
Response to TKI treatment is assessed
hematologically and molecularly. The hematological response is
defined by the normalization of the blood count and spleen size. On
the other hand, the molecular response is measured by the BCR-ABL1
transcript levels calculated on the International Scale (IS)
(6). Reverse
transcription-quantitative polymerase chain reaction (RT-qPCR)
analysis is routinely used for the calculation of transcript
levels. Patients with BCR-ABL1 transcript levels <10% after 3
months, <1% after 6 months or <0.1% after 12 months are
considered molecularly to be optimally responsive to treatment.
However, BCR-ABL1 transcript levels >10% after 3 or 6 months or
>1% after 12 months are considered as a treatment failure
(7).
Furthermore, ~20-25% of patients who benefit from
the treatment exhibit resistance to imatinib therapy after the
complete hematological or molecular response (acquired resistance)
(8). The re-increase in BCR-ABL1
activity is generally known as the cause for acquired resistance in
CML. The increase in BCR-ABL1 activity may occur due to the
amplification of the fusion gene, an increased expression, or
mutations of the ABL kinase sequence of the fusion gene. Mutations
of the ABL kinase domain are the most frequent mechanisms of TKI
resistance, particularly for the acquired type (9). However, not all mechanisms of
resistance are dependent on BCR-ABL1; for instance, the alternative
activation of mTOR has been shown to be a BCR-ABL1-independent
mechanism for resistance (10).
Another study demonstrated that Fas/FasL signaling pathway
polymorphisms also have an effect on imatinib response (11). In the literature, variations in
different regions of the genome other than the BCR-ABL1 fusion
gene, have been shown to be associated with TKI resistance
(11-14).
The detection of these genetic variations may enable the prediction
of prognosis and efficacy of TKIs beforehand. Moreover, studies
aimed at discovering these variations may pave the way for combined
therapies that target multiple pathways in addition to
BCR-ABL1(15). In one of these
studies, Lavrov et al (16)
determined several candidate single nucleotide polymorphisms (SNPs)
to predict TKI resistance in patients with CML. In that study
article, it was stated that the SNPs of the MORN repeat containing
2 (MORN2) gene (rs3099950), Pre T-cell antigen receptor alpha
(PTCRA) gene (rs9471966), ankyrin repeat domain 35 (ANKRD35) gene
(rs11579366), dynein axonemal heavy chain 9 (DNAH9) gene
(rs1990236) and the MAGE family member C1 (MAGEC1) gene (rs176037)
may have a high predictive value.
In the present study, exons 4, 5 and 6 of the ABL1
gene and SNPs in the MORN2, PTCRA, ANKRD35, DNAH9 and MAGEC1 genes
were analyzed in imatinib mesylate-sensitive and -resistant
patients with CML. By sequencing the ABL1 kinase domain, the
authors aimed to detect new variations in the ABL1 gene responsible
for BCR-ABL1-dependent resistance. In addition, by determining the
SNP frequencies of the MORN2, PTCRA, ANKRD35, DNAH9 and MAGEC1
genes to reveal the possible mechanisms related to
BCR-ABL1-independent resistance, the authors hope to contribute to
the development of novel treatment strategies for CML.
Patients and methods
The present study was conducted in the Hematology
and Medical Genetics Departments of Necmettin Erbakan University
Meram Medical School Hospital and received approval from Necmettin
Erbakan University Meram Medical School Ethics Committee and
informed written consent for participation and publication were
obtained from the patients (protocol no. 2018/1539).
Patient selection
Imatinib-sensitive and imatinib-resistant groups
were formed from the patients with CML who visited the Hematology
Outpatient Clinic of Necmettin Erbakan University Meram Medical
School Hospital. Patients with CML on imatinib therapy who were
followed-up for at least 1 year and were in remission were included
in the imatinib-sensitive group. Patients who had the following
criteria were included in the imatinib-resistant group: i) No early
molecular response at 3-6 months of imatinib therapy; ii) no major
molecular response to imatinib in the first year of treatment; and
iii) no response to imatinib and follow-up with 2nd and 3rd
generation TKIs.
Patients with any of the following criteria were
excluded from the study: i) Newly diagnosed, untreated or treated
for <1 year; ii) failure to comply with the drug therapy or
follow-ups; iii) harboring a known pathogenic variant in the ABL1
kinase domain that was previously associated with TKI
resistance.
A total of 131 patients with CML followed-by
Hematology and Medical Genetics departments of Necmettin Erbakan
University Meram Medical School Hospital for at least 1 year were
evaluated. In total, 74 of these patients were imatinib-sensitive
and 57 of them were imatinib-resistant. Of the imatinib-sensitive
patients, 50 were selected according to their demographic
characteristics to form the imatinib-sensitive group. In addition,
9 patients out of the 57 imatinib-resistant patients were excluded
as they did not meet the inclusion criteria. Of these patients, 1
patient was excluded due to non-compliance at follow-up, 3 patients
due to intolerable side-effects of imatinib, and 5 patients due to
a known pathogenic variant in the ABL1 kinase domain. Of the 5
patients with a pathogenic variant in the ABL1 kinase domain, 3
were positive for T315I, 1 patient was positive for F317L, and 1
patient was positive for Y253H. After excluding the patients who
did not meet the inclusion criteria, the imatinib-resistant group
had 48 patients. All patients in both groups were Caucasian.
A total of 20 of the imatinib-resistant patients
were under nilotinib therapy, 22 of them were being treated with
dasatinib, 4 patients were being treated with ponatinib, and 2
patients with bosutinib. The female/male ratios for the
imatinib-resistant and imatinib-sensitive groups were 1.4 (28
females and 20 males) and 2.3 (35 females and 15 males),
respectively.
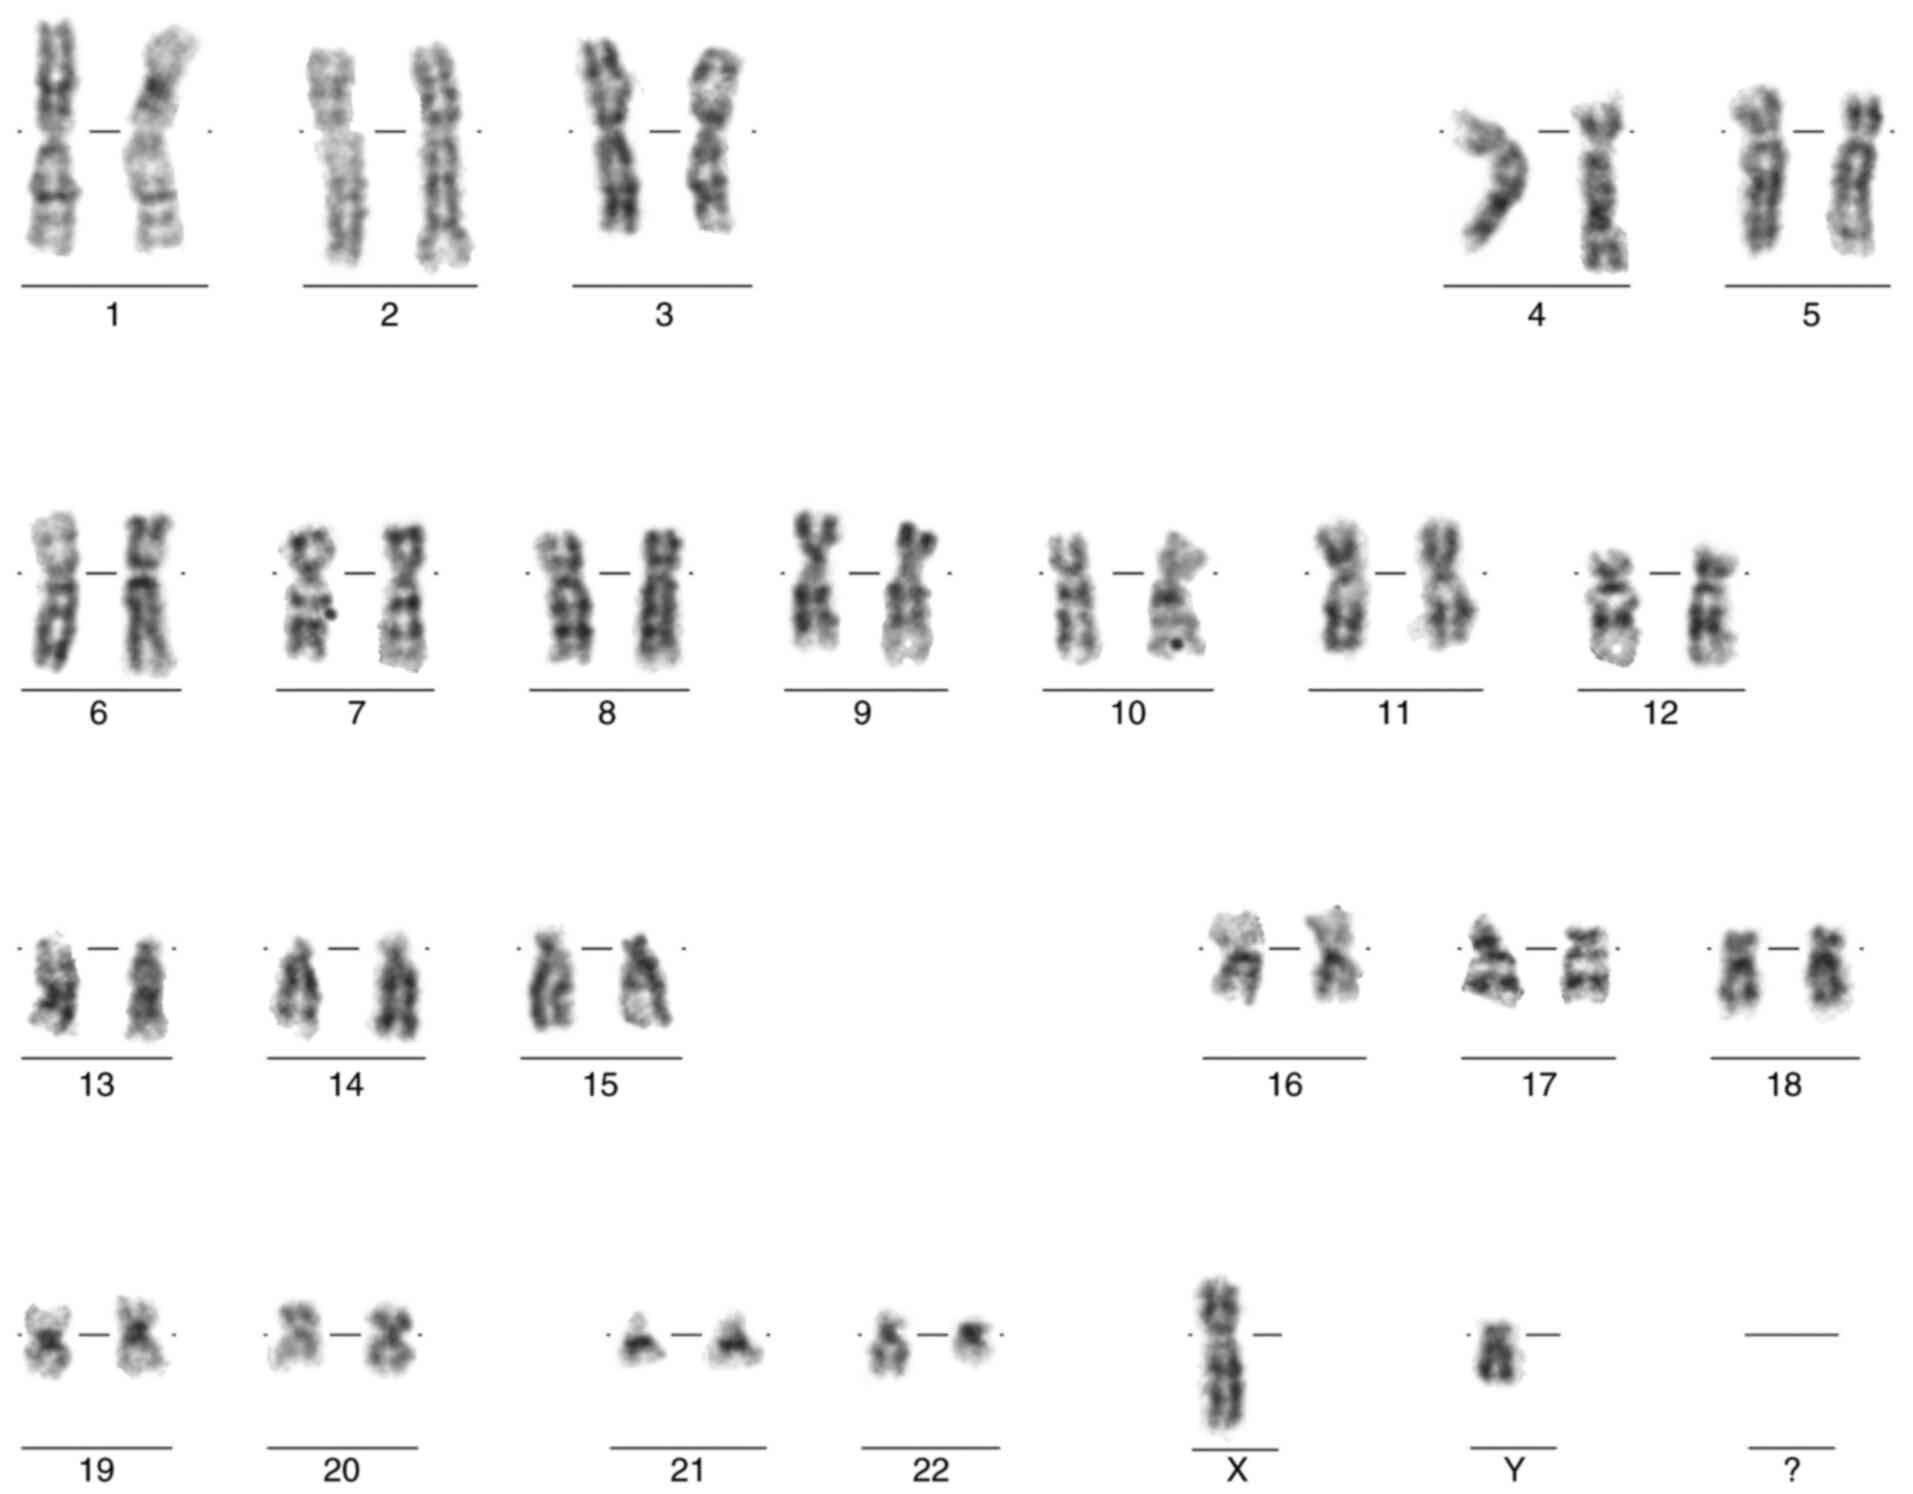
Karyotyping and fluorescence in situ
hybridization (FISH)
Upon admission, for each patient, karyotyping and
FISH analyses were performed on the bone marrow aspirates.
Metaphases, obtained from bone marrow cell culture, were banded
using G-banding and imaged (Lucia Cytogenetics 1.5.6 software,
Lucia Cytogenetics-Karyo) and analyzed using standards asserted by
the International System for Human Cytogenetic Nomenclature (ISCN
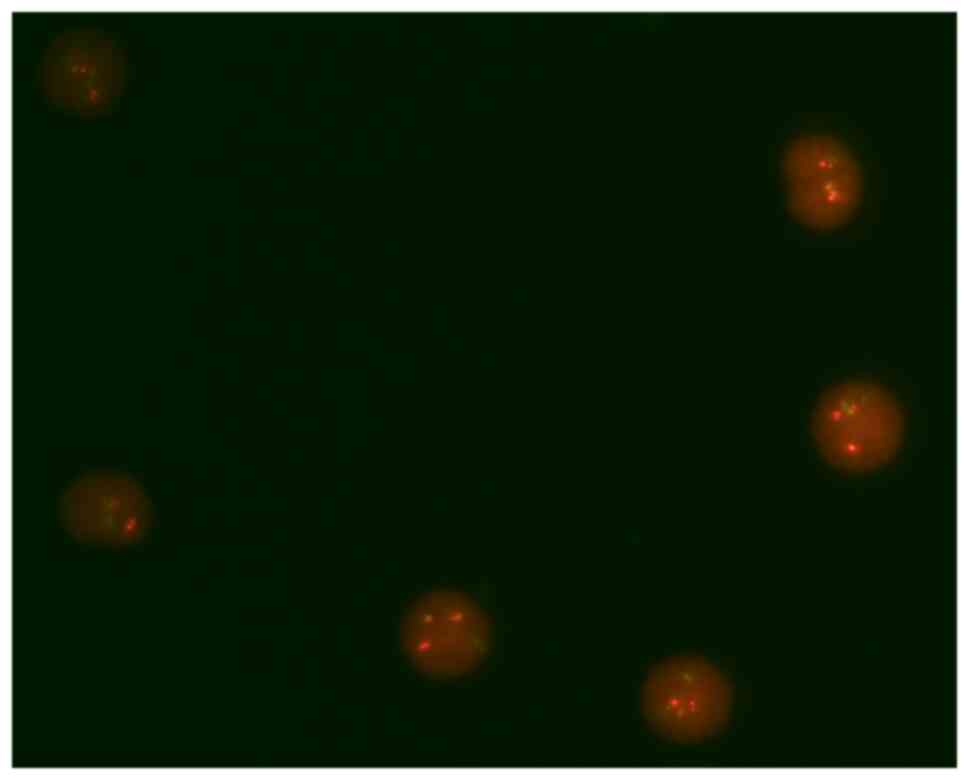
2016) (17). FISH using BCR-ABL1
dual color fusion probe (LPH 007, Cytocell) was applied to the
interphases obtained from bone marrow aspirates of the patients.
Bone marrow aspirate (~1 ml) was added to a solution containing 5
ml RPMI-1640 medium (cat. no. 11875101, Thermo Fisher Scientific,
Inc.) and 0.05 ml penicillin-streptomycin (5,000 IU penicillin,
5,000 µg/ml streptomycin; 450-200-EL, Wisent Bioproducts).
Subsequently, 0.5 ml Colcemid solution (10 µg/ml
N-deacetyl-N-methyl colchicine in Dulbecco's phosphate-buffered
saline; 12-004-1D, Biological Industries) was added to the sample
and incubated at 37˚C for 30 min. Following incubation, the sample
was centrifuged at 400 x g for 6 min. The supernatant was then
discarded and the remaining sample was vortexed. A total of 10 ml
hypotonic solution (5.7 g potassium chloride dissolved in 1 liter
distilled water) warmed to 37˚C and added to the sample.
Subsequently, the sample was incubated at 37˚C for 30 min and was
then centrifuged at 400 x g for 6 min. Following centrifugation,
the supernatant was discarded and the remaining sample vortexed and
10 ml fixative solution (Carnoy's solution: 3:1 methanol/acetic
acid; Supelco, Merck KGaA) at -18˚C was added to the sample. The
last three steps were repeated twice with 5 and 3 ml fixative
solutions, respectively. The sample was then placed onto a glass
microscope slide and allowed to dry. The slide was then immersed in
2X saline-sodium citrate (SSC; 17.5 g NaCl and 8.8 g sodium citrate
dissolved in 1 liter distilled water) for 2 min at room
temperature. Subsequently, the slide was placed in an ethanol
series (70, 85 and 100%), each for 2 min at room temperature and
then allowed to dry. After this step, 10 µl hybridization buffer
(LPH 007, Cytocell) containing probes pre-mixed in hybridization
solution (formamide; dextran sulphate; (SSC), added onto the sample
slide at 37˚C. For denaturation, the slide was placed on a hotplate
at 75˚C for 2 min.
For the hybridization step, the slide incubated in a
humid, lightproof container at 37˚C for 16 h. Following
hybridization, the slide was placed in 0.4X SSC (5-fold diluted 2X
SSC) at 72˚C for 2 min. Subsequently, the slide was immersed in 2X
SSC, 0.05% Tween-20 (polysorbate 20) at room temperature for 30 sec
and 10 µl 4',6-diamidino-2-phenylindole (DAPI) antifade (0.125
µg/ml DAPI; DES 500L, Cytocell) was added onto the slide. After
this step, the slide was covered with a coverslip, and incubated in
the dark at room temperature for 10 min. Afterwards, each slide was
analyzed under a fluorescent microscope (Eclipse 80i, Nikon). A
minimum of 100 interphases were analyzed for each patient.
RT-qPCR
RNA isolation was conducted using the Hybrid-R™
Blood RNA kit (Geneall Biotechnology Co. Ltd.) from the venous
blood of patients. Subsequently, quantitative PCR (qPCR) was
performed using the isolated RNA with the geneMAP™ BCR-ABL1 P210
(GenMark Diagnostics) on the LightCycler® 480 system
(Roche Diagnostics). The PCR cycling conditions are presented in
Table I. The BCR-ABL1/ABL1 ratio was
calculated according to the IS (6).
 | Table IProtocol for BCR-ABL1 RT-qPCR. |
Table I
Protocol for BCR-ABL1 RT-qPCR.
| Step | Temperature
(˚C) | Duration | No. of cycles |
|---|
| Contamination
prevention | 50 | 30 min | 1 |
| Polymerase
activation | 95 | 15 min | 1 |
| Denaturation | 95 | 15 sec | 45 |
|
Annealing/extension | 62 | 1 min | |
DNA isolation
Subsequently, the venous blood was collected from
the patients into EDTA tubes, barcoded and stored immediately at
-20˚C. DNA extraction was performed from these samples using the
Roche High Pure PCR Template kit (Roche Diagnostics). The purity of
the DNA was measured using a Thermo Scientific Nanodrop
Spectrophotometer (Thermo Fisher Scientific, Inc.). The 260/280 and
260/230 nm nucleic acid purity ratios were in the normal range
(1.7-2.0 and 2.0-2.2, respectively) for all samples.
SNP genotyping
qPCR was performed to determine genotype of the
patients for the SNPs. The extracted DNA was mixed with WizPure™
qPCR Master UDG (probe) solution (Wizbiosolutions, Inc.) and
Applied Biosystems™ TaqMan™ SNP Genotyping Assay (cat. no. 4351379;
Applied Biosystems; Thermo Fisher Scientific, Inc.) containing the
primers for MORN2 rs3099950, PTCRA rs9471966, ANKRD35 rs11579366,
DNAH9 rs1990236 and MAGEC1 rs176037 SNPs. This mix was then loaded
onto the Applied Biosystems™ 7500 fast system (Applied Biosystems;
Thermo Fisher Scientific, Inc.) and the PCR protocol presented in
Table II was used. Genotypes of
each SNP were determined by analyzing signals derived from VIC™ and
FAM™ labeled alleles using TaqMan® Genotyper Software
(Applied Biosystems; Thermo Fisher Scientific, Inc.).
| Table IIPCR protocol for SNP genotyping. |
Table II
PCR protocol for SNP genotyping.
| Step | Temperature
(˚C) | Duration | No. of cycles |
|---|
| Polymerase
activation | 95 | 10 min | 1 |
| Denaturation | 95 | 15 sec | 40 |
|
Annealing/extension | 60 | 1 min | |
Sanger sequencing
For sequencing of the ABL kinase domain, primers for
exons 4, 5 and 6 of the ABL1 gene were designed using the NCBI
Primer Designing Tool (https://www.ncbi.nlm.nih.gov/tools/primer-blast/).
The sequences of the primers are presented in Table III. Sanger sequencing was conducted
to isolated DNAs of all patients with an Applied Biosystems 3500
Genetic Analyzer (Applied Biosystems; Thermo Fisher Scientific,
Inc.).
| Table IIISequences of primers for the ABL1
gene. |
Table III
Sequences of primers for the ABL1
gene.
| Location and
direction of primer | Sequence of
primer |
|---|
| Exon 4 forward |
AGCTCTTTGAGCTTGCCTGT |
| Exon 4 reverse |
GATGCATCGCCTAATGCCAG |
| Exon 5 forward |
GTATGCGCTGAAGCTCCATTT |
| Exon 5 reverse |
TCCAACGAGGTTTTGTGCAG |
| Exon 6 forward |
TGCTTGGGACCATGTTGGAA |
| Exon 6 reverse |
CCTAGGCTGGGGCTTTTTGT |
Bioinformatic analysis
SPSS Statistics 26.0 software (IBM Corp.) and the
SNPStats web tool for SNP analysis (18) were used for statistical analyses.
Statistical analysis
The exact test for Hardy-Weinberg equilibrium in the
SNPStats tool (18) was used for the
calculation of deviation from Hardy-Weinberg equilibrium separately
for each SNP in both groups (n=98). Univariate logistic regression
analysis was used for association analysis between five SNPs (MORN2
rs3099950, PTCRA rs9471966, ANKRD35 rs11579366, DNAH9 rs1990236 and
MAGEC1 rs176037) and imatinib resistance with different genetic
models (n=98). These models were codominant, dominant, recessive,
over-dominant and log-additive. In addition, the frequency of each
SNP was compared between the imatinib-sensitive and
imatinib-resistant groups using Fisher's exact test (n=98).
Moreover, odds ratios (ORs) and 95% confidence intervals (95% CIs)
for the analyses of the SNPs were also calculated. A P-value
<0.05 was considered to indicate a statistically significant
difference for all of the analyses mentioned above (α=0.05).
The Sanger sequencing results of the ABL1 kinase
domain were also analyzed. Since there was no variant compared to
the reference sequence in both groups, no statistical analysis was
performed.
Results
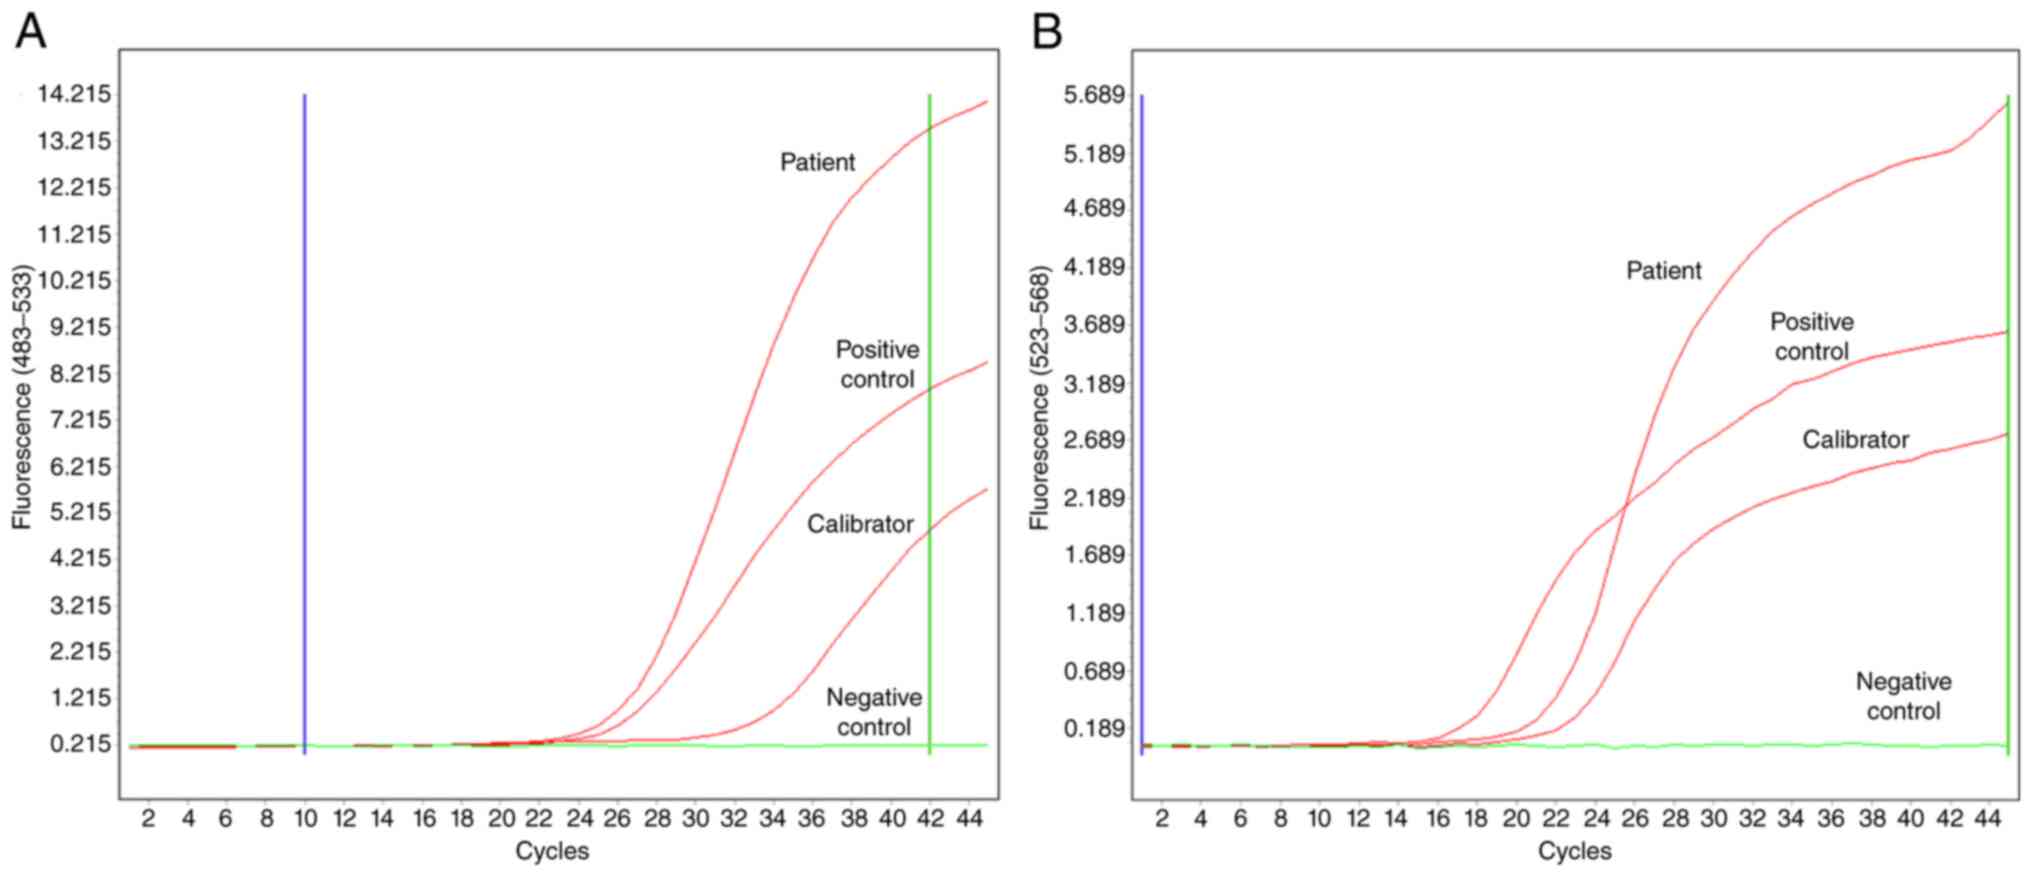
Upon patient diagnosis, karyotyping, FISH and
RT-qPCR were conducted for all patients. The Ph chromosome in
karyotype analysis (Fig. 1), and
BCR-ABL1 fusion in FISH (Fig. 2)
were detected in all patients. In addition, >10% BCR-ABL1 (IS)
levels in RT-qPCR (Fig. 3) were also
detected in all patients within both groups.
Sanger sequencing was performed on exons 4, 5 and 6
of the ABL1 gene and revealed no differences between the
imatinib-sensitive and imatinib-resistant groups. There was no
variation in the sequenced regions compared to the reference
sequence.
The majority of the SNPs exhibited Hardy-Weinberg
equilibrium within both groups. However, PTCRA rs9471966 and MAGEC1
rs176037 were in disequilibrium in the imatinib-resistant and
imatinib-sensitive groups, respectively (Table IV). However, the allelic frequencies
of both SNPs were similar between the sensitive and resistant
groups (P-values: 0.562 and 0.253 respectively) (Table V).
| Table IVDeviation analysis for Hardy-Weinberg
equilibriuma. |
Table IV
Deviation analysis for Hardy-Weinberg
equilibriuma.
| SNP | Group | Homozygous
wild-type | Heterozygous
wild-type | Homozygous
variant | Wild-type allele
frequency | Variant allele
frequency | P-value |
|---|
| MORN2
(rs3099950) | IS | 38 | 12 | 0 | 88 | 12 | 0.98 |
| G>A | IR | 39 | 8 | 1 | 86 | 10 | 0.41 |
| PTCRA
(rs9471966) | IS | 28 | 18 | 4 | 74 | 26 | 0.71 |
| G>A | IR | 30 | 11 | 7 | 71 | 25 | 0.0071 |
| ANKRD35 | IS | 14 | 27 | 9 | 55 | 45 | 0.77 |
| (rs11579366)
G>C | IR | 11 | 26 | 11 | 48 | 48 | 0.77 |
| DNAH9
(rs1990236) | IS | 38 | 10 | 2 | 86 | 14 | 0.22 |
| G>A | IR | 25 | 16 | 7 | 66 | 30 | 0.17 |
| MAGEC1
(rs176037) | IS | 22 | 16 | 12 | 60 | 40 | 0.02 |
| C>T | IR | 21 | 21 | 6 | 63 | 33 | 0.99 |
| Table VFrequencies of the five SNPs in the
imatinib-resistant and imatinib-sensitive groups. |
Table V
Frequencies of the five SNPs in the
imatinib-resistant and imatinib-sensitive groups.
| Gene/SNP | Genotype |
Imatinib-sensitive |
Imatinib-resistant | OR | 95% CI | P-value |
|---|
| MORN2
(rs3099950) | | | | | | |
|
Allelesa | | | | | | |
| | G | 88 (88%) | 86 (89.6%) | Ref | | |
| | A | 12 (12%) | 10 (10.4%) | 0.853 | 0.350-2.077 | 0.451 |
| Genetic
modelsb | | | | | | |
| Codominant | G/G | 38 (76%) | 39 (81.2%) | Ref | | 0.34 |
| | G/A | 12 (24%) | 8 (16.7%) | 0.65 | (0.24-1.77) | |
| | A/A | 0 (0%) | 1 (2.1%) | NA | (0.00-NA) | |
| Dominant | G/G | 38 (76%) | 39 (81.2%) | Ref | | 0.53 |
| | G/A-A/A | 12 (24%) | 9 (18.8%) | 0.73 | (0.28-1.93) | |
| Recessive | G/G-G/A | 50 (100%) | 47 (97.9%) | Ref | | 0.23 |
| | A/A | 0 (0%) | 1 (2.1%) | NA | (0.00-NA) | |
| Over-dominant | G/G-A/A | 38 (76%) | 40 (83.3%) | 1.00 | | 0.37 |
| | G/A | 12 (24%) | 8 (16.7%) | 0.63 | (0.23-1.72) | |
| Log-additive | - | - | - | 0.85 | (0.34-2.09) | 0.72 |
| PTCRA
(rs9471966) | | | | | | |
|
Allelesa | | | | | | |
| | G | 74 (74%) | 71 (73.9%) | Ref | | |
| | A | 26 (26%) | 25 (26%) | 1.002 | 0.529-1.897 | 0.562 |
| Genetic
modelsb | | | | | | |
| Codominant | G/G | 28 (56%) | 30 (62.5%) | Ref | | 0.28 |
| | G/A | 18 (36%) | 11 (22.9%) | 0.57 | (0.23-1.42) | |
| | A/A | 4 (8%) | 7 (14.6%) | 1.63 | (0.43-6.19) | |
| Dominant | G/G | 28 (56%) | 30 (62.5%) | Ref | | 0.51 |
| | G/A-A/A | 22 (44%) | 18 (37.5%) | 0.76 | (0.34-1.71) | |
| Recessive | G/G-G/A | 46 (92%) | 41 (85.4%) | Ref | | 0.3 |
| | A/A | 4 (8%) | 7 (14.6%) | 1.96 | (0.54-7.19) | |
| Over-dominant | G/G-A/A | 32 (64%) | 37 (77.1%) | Ref | | 0.15 |
| | G/A | 18 (36%) | 11 (22.9%) | 0.53 | (0.22-1.28) | |
| Log-additive | - | - | - | 1.00 | (0.56-1.78) | 0.99 |
| ANKRD35
(rs11579366) | | | | | | |
|
Allelesa | | | | | | |
| | G | 45 (45%) | 48 (50%) | Ref | | |
| | C | 55 (55%) | 48 (50%) | 0.818 | 0.467-1.435 | 0.289 |
| Genetic
modelsb | | | | | | |
| Codominant | G/G | 9 (18%) | 11 (22.9%) | Ref | | 0.76 |
| | G/C | 27 (54%) | 26 (54.2%) | 0.79 | (0.28-2.21) | |
| | C/C | 14 (28%) | 11 (22.9%) | 0.64 | (0.20-2.10) | |
| Dominant | G/G | 9 (18%) | 11 (22.9%) | Ref | | 0.55 |
| | G/C-C/C | 41 (82%) | 37 (77.1%) | 0.74 | (0.28-1.98) | |
| Recessive | G/G-G/C | 36 (72%) | 37 (77.1%) | Ref | | 0.56 |
| | C/C | 14 (28%) | 11 (22.9%) | 0.76 | (0.31-1.91) | |
| Over-dominant | G/G-C/C | 23 (46%) | 22 (45.8%) | Ref | | 0.99 |
| | G/C | 27 (54%) | 26 (54.2%) | 1.01 | (0.45-2.23) | |
| Log-additive | - | - | - | 0.80 | (0.45-1.45) | 0.46 |
| DNAH9
(rs1990236) | | | | | | |
|
Allelesa | | | | | | |
| | G | 86 (86.0%) | 66 (68.8%) | Ref | | |
| | A | 14 (14.0%) | 30 (31.2%) | 2.792 | 1.372-5.684 | 0.003 |
| Genetic
modelsb | | | | | | |
| Codominant | GG | 38 (76.0%) | 25 (52.1%) | Ref | | 0.03 |
| | GA | 10 (20.0%) | 16 (33.3%) | 2.43 | (0.95-6.21) | |
| | AA | 2 (4.0) | 7 (14.6) | 5.32 | (1.02-27.72) | |
| Dominant | G/G | 38 (76%) | 25 (52.1%) | Ref | | 0.013 |
| | G/A-A/A | 12 (24%) | 23 (47.9%) | 2.91 | (1.23-6.89) | |
| Recessive | G/G-G/A | 48 (96%) | 41 (85.4%) | Ref | | 0.063 |
| | A/A | 2 (4%) | 7 (14.6%) | 4.10 | (0.81-0.83) | |
| Over-dominant | G/G-A/A | 40 (80%) | 32 (66.7%) | Ref | | 0.13 |
| | G/A | 10 (20%) | 16 (33.3%) | 2.00 | (0.80-5.00) | |
| Log-additive | - | - | - | 2.36 | (1.21-4.62) | 0.0082 |
| MAGEC1
(rs176037) | | | | | | |
|
Allelesa | | | | | | |
| | C | 60 (60%) | 63 (65.6%) | Ref | | |
| | T | 40 (40%) | 33 (34.4%) | 0.786 | 0.440-1.405 | 0.253 |
| Genetic
modelsb | | | | | | |
| Codominant | C/C | 22 (44%) | 21 (43.8%) | Ref | | 0.26 |
| | C/T | 16 (32%) | 21 (43.8%) | 1.37 | (0.57-3.33) | |
| | T/T | 12 (24%) | 6 (12.5%) | 0.52 | (0.17-1.65) | |
| Dominant | C/C | 22 (44%) | 21 (43.8%) | Ref | | 0.98 |
| | C/T-T/T | 28 (56%) | 27 (56.2%) | 1.01 | (0.45-2.24) | |
| Recessive | C/C-C/T | 38 (76%) | 42 (87.5%) | Ref | | 0.14 |
| | T/T | 12 (24%) | 6 (12.5%) | 0.45 | (0.15-1.32) | |
| Over-dominant | C/C-T/T | 34 (68%) | 27 (56.2%) | Ref | | 0.23 |
| | C/T | 16 (32%) | 21 (43.8%) | 1.65 | (0.73-3.77) | |
| Log-additive | - | - | - | 0.82 | (0.48-1.39) | 0.46 |
For DNAH9 rs1990236 (c.13122G>A), 25 of the 48
patients in the imatinib-resistant group (52.1%) were homozygous
wild-type (GG), 16 patients (33.3%) were heterozygous (GA) and 7
patients (14.6%) were homozygous (AA) for this SNP. However, in the
imatinib-sensitive group, 38 of the 50 patients (76.0%) were
homozygous wild-type (GG), 10 (20.0%) were heterozygous (GA) and 2
of them (4.0%) were homozygous (AA) for DNAH9 rs1990236. The
frequency of DNAH9 rs1990236 (c.13122G>A) was significantly
higher in the imatinib-resistant group with an OR of 2.792
(P=0.003; Table V).
For MORN2 rs3099950 (c.142G>A), 39 of the 48
(81.2%) patients in the imatinib-resistant group were homozygous
wild-type (GG), 8 patients (16.7%) were heterozygous (GA) and 1
patient (2.0%) was homozygous (AA). On the other hand, in the
imatinib-sensitive group, 38 of the 50 patients (76.0%) were
homozygous wild-type (GG), 12 (24.0%) were heterozygous (GA) and
there was no homozygous (AA) patient for this variant. The
frequencies of MORN2 rs3099950 (c.142G>A) between the
imatinib-resistant and imatinib-sensitive groups exhibited no
statistically significant difference (OR, 0.853; P=0.451; Table V).
For PTCRA rs9471966 (c.316G>A), 30 of the 48
(62.5%) patients in the imatinib-resistant group were homozygous
wild-type (GG), 11 patients (22.9%) were heterozygous (GA) and 7
patients (14.6%) were homozygous (AA) for this SNP. On the other
hand, 28 of the 50 patients (56.0%) in the imatinib-sensitive group
were homozygous wild-type (GG), 18 (36.0%) were heterozygous (GA)
and 4 patients (8.0%) were homozygous (AA). Between the
imatinib-resistant and imatinib-sensitive groups, the frequencies
of PTCRA rs9471966 (c.316G>A) exhibited no statistically
significant difference (OR, 1.002; P=0.562; Table V).
For ANKRD35 rs11579366 (c.1981G>C), 11 of the 48
(22.9%) patients in the imatinib-resistant group were homozygous
wild-type (GG), 26 patients (54.2%) were heterozygous (GC) and 11
patients (22.9%) were homozygous (CC) for this SNP. However, in the
imatinib-sensitive group, 9 of the 50 patients (18.0%) were
homozygous wild-type (GG), 27 (54.0%) were heterozygous (GC) and 14
(28.0%) were homozygous (CC) for this variant. The frequencies of
ANKRD35 rs11579366 (c.1981G>C) between the imatinib-resistant
and imatinib-sensitive groups did not exhibit any statistically
significant difference (OR, 0.818; P=0.289; Table V).
Furthermore, 21 of the 48 (43.7%) imatinib-resistant
patients were homozygous wild-type (CC) for MAGEC1 rs176037
(c.452C>T), 21 of them (43.7%) were heterozygous (CT) and 6 of
them (12.5%) were homozygous (TT) for this SNP. On the other hand,
in the imatinib-sensitive group, 22 of the 50 patients (44.0%) were
homozygous wild-type (CC), 16 (32.0%) were heterozygous (CT) and 12
(24.0%) were homozygous (TT) for this SNP. The frequencies of
MAGEC1 rs176037 (c.452C>T) between the imatinib-resistant and
imatinib-sensitive groups did not exhibit any statistically
significant difference (OR, 0.786; P=0.253; Table V).
The detailed frequencies of MORN2 rs3099950, PTCRA
rs9471966, ANKRD35 rs11579366, DNAH9 rs1990236 and MAGEC1 rs176037
SNPs among the imatinib-sensitive and imatinib-resistant groups are
presented in Table V.
Discussion
Imatinib is a good early example of targeted cancer
therapy and has markedly improved the survival of patients with CML
over the years (4). However,
resistance to imatinib and other TKIs is a major issue for CML
therapy, rendering the detection and prediction of resistance more
crucial. Depending on the development mechanisms, resistance to
TKIs can be divided into two categories, BCR-ABL1-dependent and
-independent resistance (19). The
overexpression of BCR-ABL1 and mutations in the ABL1 kinase domain
are main BCR-ABL1-dependent resistance mechanisms. On the other
hand, BCR-ABL1-independent resistance can be caused by a number of
mechanisms, such as pharmacokinetic factors, clonal evolution, or
disruption of signaling pathways (10,11,15,19).
Despite these known contributing mechanisms, BCR-ABL1-independent
resistance remains ‘terra incognita’, encompassing promising areas
of research. The present study investigated five SNPs and three
exons of the ABL1 kinase domain of the BCR-ABL1 gene. It was found
that the frequency of the DNAH9 rs1990236 allele was significantly
higher in the resistant group than in the sensitive group.
The DNAH9 gene is chromosomally located in the 17p12
region. It encodes the heavy chain of the axonemal dynein protein.
Dyneins are multimeric microtubule-associated motor proteins and
provide cells or intracellular components with motility. The
product of the DNAH9 gene joins type two outer dynein arms, which
are essential for cilia and flagella movement (20). According to the Genotype-Tissue
Expression (GTEx) database (https://gtexportal.org/home/), tissues in which DNAH9
is extensively expressed are the testes, fallopian tubes, brain and
lungs (21).
Homozygous germline pathogenic variations of DNAH9
are associated with primary ciliary dyskinesia. Pathogenic
variations of DNAH9 are also detected in esophageal squamous cell
carcinoma, triple-negative breast cancer and invasive
micropapillary carcinomas of the breast (22-24).
Moreover, a somatic DNAH9 variant (c.10242+5G>A) has been
reported in a patient with atypical CML (25). Another study demonstrated the
abnormal methylation of DNAH9 in non-small cell lung cancer
(26). In addition, a study on
circulating tumor DNA of patients with hepatocellular carcinoma
using next-generation sequencing revealed DNAH9 variations in 32%
of patients (27). Next-generation
sequencing technologies can provide massive amounts of data on
thousands of genes simultaneously. The use of these technologies on
genes of unknown actionability, such as DNAH9, may reveal novel
diagnostic, prognostic and therapeutic biomarkers for cancer
patients in the future.
The variant DNAH9 c.13122G>A [p.Met4374Ile
(NP_001363.2)/p.Met686Ile (NP_004653.2)] investigated herein is a
missense variant that causes the conversion of amino acid 4374 of
the encoded protein from methionine to isoleucine. The frequency of
this variant in the gnomAD genome database (https://gnomad.broadinstitute.org/) is 0.175(28). In silico analyses to estimate
pathogenicity revealed a DANN score of 0.9685 and a SIFT score of
0.021, which were considered disruptive to protein function
(29,30).
Although the frequency of the DNAH9 rs1990236 allele
in the present study was higher in the imatinib-resistant group,
the frequency of this SNP was higher in the TKI-sensitive group in
the study by Lavrov et al (16). In another study on 62 patients, there
was no significant difference observed in DNAH9 rs1990236 between
optimal and non-optimal TKI responsive groups (31).
The discrepancy between these results may be
attributed to the different group designs. In the studies by Lavrov
et al (16,31), responses to all TKIs were taken into
account in the process of forming groups. In the present study, the
response to a specific TKI (imatinib) was selected as the variable
for group classification.
There is no known direct association between DNAH9
and imatinib resistance in CML demonstrated in the literature;
however, the possible mechanisms can be hypothesized. For instance,
the Sonic hedgehog pathway is involved in the survival of leukemic
stem cells in CML, and the primary cilium plays a central role in
the Sonic hedgehog pathway (32,33).
Although it is known that axonemal dyneins, such as DNAH9 do not
participate in the primary cilium structure, the non-axonemal
functions of DNAH9 may play a role in this regard. For example,
GAS11, a dynein regulatory protein that has functions primarily in
motile cilia, has been shown to have additional non-axonemal
functions. In addition, GAS11 is localized at the primary cilium
base of kidney cells (34). Thus,
DNAH9 may play a role in the survival of leukemic stem cells
through the primary cilium. For an example of non-axonemal
functions of DNAH9, it has been reported in the literature that
DNAH9 interacts with BCL6, an important gene in the development of
lymphoma (35). Since there is no
comprehensive literature available on the non-axonemal functions of
DNAH9, at least to the best of our knowledge, studies focusing on
this area may provide promising results.
Considering all these findings, it appears that the
DNAH9 gene may play a role in neoplastic cells, albeit a regulatory
rather than a driver role. Without any doubt, further studies
focused on DNAH9 and functionally-related genes are warranted for a
clearer interpretation. In this manner, the potential of this SNP
and other variations of the DNAH9 gene for clinical applications
can be fully elucidated.
In the present study, apart from the findings
regarding DNAH9, the frequencies of MORN2 rs3099950, PTCRA
rs9471966, ANKRD35 rs11579366 and MAGEC1 rs176037 did not exhibit
any statistically significant difference between the two
groups.
The MORN2 gene is located on the long arm of
chromosome 20 (20q13.12) and encodes a protein that integrates into
Junctophilin 2(36). Junctophilins
are junctional membrane complexes that regulate signaling between
the cell surface and intracellular ion channels (37). Pathogenic variations in Junctophilin
2 have been shown to be associated with hypertrophic cardiomyopathy
(MIM: 613873) (38).
PTCRA resides on 6p21.1 and encodes the alpha-chain
precursor of the pre-t-cell receptor (pre-TCR). PTCRA contributes
to the formation of pre-TCR and T-cell development (39).
ANKRD35 is located on chromosome 1 (1q21.1). The
somatic variations of ANKRD35 have been found in melanoma, urinary
tract malignancies and hematopoietic neoplasias (40).
MAGEC1 resides on Xq27.2 and encodes melanoma
antigen family C1. MAGEC1 is a member of the MAGE family that
expresses antigens in tumor cells (41).
The absence of any significant difference for the
MORN2 rs3099950, PTCRA rs9471966, ANKRD35 rs11579366 and MAGEC1
rs176037 SNPs between the two patient groups in the present study,
is contradictory to the findings of the study by Lavrov et
al (16). In their study, Lavrov
et al (16) selected a small
sample of 8 patients, four of whom were optimal and four were
non-optimal TKI-responsive. In this prospect, this discrepancy may
be attributed to the low number of patients in the earlier study by
Lavrov et al (16). In
addition, although the differences between the study designs have
been discussed above, these findings are consistent with the later
study by Lavrov et al (31).
Mutations in ABL1 kinase domain are a known
mechanism of TKI resistance. The importance of detecting additional
variants of this domain is evident. For this reason, the present
study sequenced exons 4, 5 and 6 of the ABL1 gene. At the end of
the analysis, no novel variant was found in the ABL1 kinase domain.
This result may be due to the high conservation of the ABL1 kinase
domain. Additionally, the exclusion of patients with known
pathogenic variations may have also contributed to this result.
In conclusion, the importance of predicting TKI
resistance in patients with CML is evident. The results of the
present study have provided further evidence of the importance of
the DNAH9 rs1990236 SNP in imatinib resistance. It is clear that
further clinical studies on DNAH9 rs1990236, as well as other
variants that may alter the function of DNAH9 are required. In
addition, other genes with similar biological effects need to be
investigated in terms of TKI resistance. There is also a need for
further studies with larger sample sizes on the MORN2, PTCRA,
ANKRD35 and MAGEC1 variants, as well as their effects on TKI
resistance. Given the rapid advances in next-generation sequencing
technologies, it may be possible in the future to use larger
genetic panels that provide information on millions of variants.
This may greatly change patient management.
Further clinical, in vitro and in
silico studies in this area may lead to the further elucidation
of the pathophysiology of CML and may aid in the development of
novel methods for the treatment of patients.
Acknowledgements
Not applicable.
Funding
Funding: The present study was supported by the Research Fund of
the Necmettin Erbakan University (project no. 171218022).
Availability of data and materials
The datasets used and/or analyzed during the current
study are available from the corresponding author on reasonable
request.
Authors' contributions
MSY, LŞ, AGZ, ÖÇ and SD were involved in the design
and coordination of the study, and the acquisition of data. MSY, LŞ
and AGZ analyzed and interpreted the data. MSY and LŞ conducted
statistical analyses and wrote the manuscript. MSY, LŞ and AGZ
confirm the authenticity of all the raw data. All authors have read
and approved the final manuscript.
Ethics approval and consent to
participate
The present study received approval from Necmettin
Erbakan University Meram Medical School Ethics Committee and
informed written consent for participation and publication were
obtained from the patients (protocol no. 2018/1539).
Patient consent for publication
Not applicable.
Competing interests
The authors declare that they have no competing
interests.
References
|
1
|
Siegel RL, Miller KD and Jemal A: Cancer
statistics, 2019. CA Cancer J Clin. 69:7–34. 2019.PubMed/NCBI View Article : Google Scholar
|
|
2
|
Faderl S, Talpaz M, Estrov Z, O'Brien S,
Kurzrock R and Kantarjian HM: The biology of chronic myeloid
leukemia. N Engl J Med. 341:164–172. 1999.PubMed/NCBI View Article : Google Scholar
|
|
3
|
Druker BJ, Guilhot F, O'Brien SG, Gathmann
I, Kantarjian H, Gattermann N, Deininger MW, Silver RT, Goldman JM,
Stone RM, et al: Five-year follow-up of patients receiving imatinib
for chronic myeloid leukemia. N Engl J Med. 355:2408–2417.
2006.PubMed/NCBI View Article : Google Scholar
|
|
4
|
Noone AM, Howlader N, Krapcho M, Miller D,
Brest A, Yu M, Ruhl J, Tatalovich Z, Mariotto A, Lewis DR (eds), et
al: SEER Cancer Statistics Review, 1975-2015, National Cancer
Institute. Bethesda, MD, 2018. https://seer.cancer.gov/csr/1975_2015/.
|
|
5
|
O'Brien SG, Guilhot F, Larson RA, Gathmann
I, Baccarani M, Cervantes F, Cornelissen JJ, Fischer T, Hochhaus A,
Hughes T, et al: Imatinib compared with interferon and low-dose
cytarabine for newly diagnosed chronic-phase chronic myeloid
leukemia. N Engl J Med. 348:994–1004. 2003.PubMed/NCBI View Article : Google Scholar
|
|
6
|
Branford S, Fletcher L, Cross NC, Müller
MC, Hochhaus A, Kim DW, Radich JP, Saglio G, Pane F, Kamel-Reid S,
et al: Desirable performance characteristics for BCR-ABL
measurement on an international reporting scale to allow consistent
interpretation of individual patient response and comparison of
response rates between clinical trials. Blood. 112:3330–3338.
2008.PubMed/NCBI View Article : Google Scholar
|
|
7
|
Hochhaus A, Baccarani M, Silver RT,
Schiffer C, Apperley JF, Cervantes F, Clark RE, Cortes JE,
Deininger MW, Guilhot F, et al: European LeukemiaNet 2020
recommendations for treating chronic myeloid leukemia. Leukemia.
34:966–984. 2020.PubMed/NCBI View Article : Google Scholar
|
|
8
|
Apperley JF: Part I: Mechanisms of
resistance to imatinib in chronic myeloid leukaemia. Lancet Oncol.
8:1018–1029. 2007.PubMed/NCBI View Article : Google Scholar
|
|
9
|
Volpe G, Panuzzo C, Ulisciani S and
Cilloni D: Imatinib resistance in CML. Cancer Lett. 274:1–9.
2009.PubMed/NCBI View Article : Google Scholar
|
|
10
|
Mitchell R, Hopcroft LEM, Baquero P, Allan
EK, Hewit K, James D, Hamilton G, Mukhopadhyay A, O'Prey J, Hair A,
et al: Targeting BCR-ABL-independent TKI resistance in chronic
myeloid leukemia by mTOR and autophagy inhibition. J Natl Cancer
Inst. 110:467–478. 2018.PubMed/NCBI View Article : Google Scholar
|
|
11
|
Zheng Q, Cao J, Hamad N, Kim HJ, Moon JH,
Sohn SK, Jung CW, Lipton JH and Kim DD: Single nucleotide
polymorphisms in apoptosis pathway are associated with response to
imatinib therapy in chronic myeloid leukemia. J Transl Med.
14(82)2016.PubMed/NCBI View Article : Google Scholar
|
|
12
|
Ng KP, Hillmer AM, Chuah CT, Juan WC, Ko
TK, Teo AS, Ariyaratne PN, Takahashi N, Sawada K, Fei Y, et al: A
common BIM deletion polymorphism mediates intrinsic resistance and
inferior responses to tyrosine kinase inhibitors in cancer. Nat
Med. 18:521–528. 2012.PubMed/NCBI View
Article : Google Scholar
|
|
13
|
Ko TK, Chin HS, Chuah CT, Huang JW, Ng KP,
Khaw SL, Huang DC and Ong ST: The BIM deletion polymorphism: A
paradigm of a permissive interaction between germline and acquired
TKI resistance factors in chronic myeloid leukemia. Oncotarget.
7:2721–2733. 2016.PubMed/NCBI View Article : Google Scholar
|
|
14
|
Kim T, Tyndel MS, Zhang Z, Ahn J, Choi S,
Szardenings M, Lipton JH, Kim HJ and Kim Dong Hwan D: Exome
sequencing reveals DNMT3A and ASXL1 variants associate with
progression of chronic myeloid leukemia after tyrosine kinase
inhibitor therapy. Leuk Res. 59:142–148. 2017.PubMed/NCBI View Article : Google Scholar
|
|
15
|
Loscocco F, Visani G, Galimberti S, Curti
A and Isidori A: BCR-ABL independent mechanisms of resistance in
chronic myeloid leukemia. Front Oncol. 9(939)2019.PubMed/NCBI View Article : Google Scholar
|
|
16
|
Lavrov AV, Chelysheva EY, Smirnikhina SA,
Shukhov OA, Turkina AG, Adilgereeva EP and Kutsev SI: Frequent
variations in cancer-related genes may play prognostic role in
treatment of patients with chronic myeloid leukemia. BMC Genet. 17
(Suppl 1)(S14)2016.PubMed/NCBI View Article : Google Scholar
|
|
17
|
McGowan-Jordan J, Simons A and Schmid M
(eds): An International System for Human Cytogenomic Nomenclature
(2016). Karger, 2016. https://www.karger.com/Book/Home/271658.
|
|
18
|
Solé X, Guinó E, Valls J, Iniesta R and
Moreno V: SNPStats: A web tool for the analysis of association
studies. Bioinformatics. 22:1928–1929. 2006.PubMed/NCBI View Article : Google Scholar
|
|
19
|
Quintás-Cardama A, Kantarjian HM and
Cortes JE: Mechanisms of primary and secondary resistance to
imatinib in chronic myeloid leukemia. Cancer Control. 16:122–131.
2009.PubMed/NCBI View Article : Google Scholar
|
|
20
|
Fassad MR, Shoemark A, Legendre M, Hirst
RA, Koll F, le Borgne P, Louis B, Daudvohra F, Patel MP, Thomas L,
et al: Mutations in outer dynein arm heavy chain DNAH9 cause motile
cilia defects and situs inversus. Am J Hum Genet. 103:984–994.
2018.PubMed/NCBI View Article : Google Scholar
|
|
21
|
Carithers LJ, Ardlie A, Kristin A, Branton
PA, Britton A, Buia SA, Compton CC, DeLuca DS, Peter-Demchok J,
Gelfand ET, et al: A novel approach to high-quality postmortem
tissue procurement: The GTEx Project. Biopreserv Biobank.
13:311–319. 2015.PubMed/NCBI View Article : Google Scholar
|
|
22
|
Donner I, Katainen R, Tanskanen T,
Kaasinen E, Aavikko M, Ovaska K, Artama M, Pukkala E and Aaltonen
LA: Candidate susceptibility variants for esophageal squamous cell
carcinoma. Genes Chromosomes Cancer. 56:453–459. 2017.PubMed/NCBI View Article : Google Scholar
|
|
23
|
Shah SP, Roth A, Goya R, Oloumi A, Ha G,
Zhao Y, Turashvili G, Ding J, Tse K, Haffari G, et al: The clonal
and mutational evolution spectrum of primary triple-negative breast
cancers. Nature. 486:395–399. 2012.PubMed/NCBI View Article : Google Scholar
|
|
24
|
Gruel N, Benhamo V, Bhalshankar J, Popova
T, Fréneaux P, Arnould L, Mariani O, Stern MH, Raynal V,
Sastre-Garau X, et al: Polarity gene alterations in pure invasive
micropapillary carcinomas of the breast. Breast Cancer Res.
16(R46)2014.PubMed/NCBI View
Article : Google Scholar
|
|
25
|
Spinelli R, Pirola A, Redaelli S, Sharma
N, Raman H, Valletta S, Magistroni V, Piazza R and
Gambacorti-Passerini C: Identification of novel point mutations in
splicing sites integrating whole-exome and RNA-seq data in
myeloproliferative diseases. Mol Genet Genomic Med. 1:246–259.
2013.PubMed/NCBI View
Article : Google Scholar
|
|
26
|
Kusakabe M, Kutomi T, Watanabe K, Emoto N,
Aki N, Kage H, Hamano E, Kitagawa H, Nagase T, Sano A, et al:
Identification of G0S2 as a gene frequently methylated in squamous
lung cancer by combination of in silico and experimental
approaches. Int J Cancer. 126:1895–1902. 2010.PubMed/NCBI View Article : Google Scholar
|
|
27
|
Gao J, Xi L, Yu R, Xu H, Wu M and Huang H:
Differential mutation detection capability through capture-based
targeted sequencing in plasma samples in hepatocellular carcinoma.
Front Oncol. 11(596789)2021.PubMed/NCBI View Article : Google Scholar
|
|
28
|
Karczewski KJ, Francioli LC, Tiao G,
Cummings BB, Alföldi J, Wang Q, Collins RL, Laricchia KM, Ganna A,
Birnbaum DP, et al: The mutational constraint spectrum quantified
from variation in 141,456 humans. Nature. 581:434–443.
2020.PubMed/NCBI View Article : Google Scholar
|
|
29
|
Sim NL, Kumar P, Hu J, Henikoff S,
Schneider G and Ng PC: SIFT web server: Predicting effects of amino
acid substitutions on proteins. Nucleic Acids Res. 40 (Web Server
Issue):W452–W457. 2012.PubMed/NCBI View Article : Google Scholar
|
|
30
|
Quang D, Chen Y and Xie X: DANN: A deep
learning approach for annotating the pathogenicity of genetic
variants. Bioinformatics. 31:761–763. 2015.PubMed/NCBI View Article : Google Scholar
|
|
31
|
Lavrov AV, Chelysheva EY, Adilgereeva EP,
Shukhov OA, Smirnikhina SA, Kochergin-Nikitsky KS, Yakushina VD,
Tsaur GA, Mordanov SV, Turkina AG and Kutsev SI: Exome,
transcriptome and miRNA analysis don't reveal any molecular markers
of TKI efficacy in primary CML patients. BMC Med Genomics. 12
(Suppl 2)(S37)2019.PubMed/NCBI View Article : Google Scholar
|
|
32
|
Campbell V and Copland M: Hedgehog
signaling in cancer stem cells: A focus on hematological cancers.
Stem Cells Cloning. 8:27–38. 2015.PubMed/NCBI View Article : Google Scholar
|
|
33
|
Singh M, Chaudhry P and Merchant AA:
Primary cilia are present on human blood and bone marrow cells and
mediate Hedgehog signaling. Exp Hematol. 44:1181–1187.e2.
2016.PubMed/NCBI View Article : Google Scholar
|
|
34
|
Colantonio JR, Bekker JM, Kim SJ,
Morrissey KM, Crosbie RH and Hill KL: Expanding the role of the
dynein regulatory complex to non-axonemal functions: association of
GAS11 with the Golgi apparatus. Traffic. 7:538–548. 2006.PubMed/NCBI View Article : Google Scholar
|
|
35
|
Miles RR, Crockett DK, Lim MS and
Elenitoba-Johnson KSJ: Analysis of BCL6-interacting proteins by
tandem mass spectrometry. Mol Cell Proteomics. 4:1898–1909.
2005.PubMed/NCBI View Article : Google Scholar
|
|
36
|
Matsushita Y, Furukawa T, Kasanuki H,
Nishibatake M, Kurihara Y, Ikeda A, Kamatani N, Takeshima H and
Matsuoka R: Mutation of junctophilin type 2 associated with
hypertrophic cardiomyopathy. J HumGenet. 52:543–548.
2007.PubMed/NCBI View Article : Google Scholar
|
|
37
|
Takeshima H, Komazaki S, Nishi M, Iino M
and Kangawa K: Junctophilins: A novel family of junctional membrane
complex proteins. Mol Cell. 6:11–22. 2000.PubMed/NCBI View Article : Google Scholar
|
|
38
|
Landstrom AP, Weisleder N, Batalden KB,
Bos JM, Tester DJ, Ommen SR, Wehrens XH, Claycomb WC, Ko JK, Hwang
M, et al: Mutations in JPH2-encoded junctophilin-2 associated with
hypertrophic cardiomyopathy in humans. J Mol Cell Cardiol.
42:1026–1035. 2007.PubMed/NCBI View Article : Google Scholar
|
|
39
|
Aifantis I, Borowski C, Gounari F,
Lacorazza HD, Nikolich-Zugich J and von Boehmer H: A critical role
for the cytoplasmic tail of pT-alpha in T lymphocyte development.
Nat Immunol. 3:483–488. 2002.PubMed/NCBI View
Article : Google Scholar
|
|
40
|
Tate JG, Bamford S, Jubb HC, Sondka Z,
Beare DM, Bindal N, Boutselakis H, Cole CG, Creatore C, Dawson E,
et al: COSMIC: The catalogue of somatic mutations in cancer.
Nucleic Acids Res. 47(D1):D941–D947. 2019.PubMed/NCBI View Article : Google Scholar
|
|
41
|
Lucas S, De Smet C, Arden KC, Viars CS,
Lethé B, Lurquin C and Boon T: Identification of a new MAGE gene
with tumor-specific expression by representational difference
analysis. Cancer Res. 58:743–752. 1998.PubMed/NCBI
|