Introduction
Regarded as a primary cause of mortality in
cirrhosis, liver cancer ranks fourth globally in terms of
cancer-related mortality. With fatalities roughly matching global
incidence rates, the prognosis for hepatocellular carcinoma (HCC)
is poor (1). HCC is the fifth most
common liver cancer among men and the seventh most common type of
cancer among women, accounting for 9.2% of global cancer cases
(2). The major risk factor
associated with HCC is chronic liver injury resulting from any
etiology that progresses to cirrhosis. Globally, hepatitis B virus
and hepatitis C virus infection are the main causal agents of
cirrhosis, and the incidence rate of HCC development in patients
with established cirrhosis is ~2 to 4% per year (1,2).
Anatomic stage, biologic grade and severity of cirrhosis, determine
the survival of patients with HCC (3).
One characteristic that sets HCC apart is the
survival advantage of the cancer cells. The liver is constantly
adapting to changes in the external environment caused by viruses,
dietary xenobiotics and microbiota agents (4). The unbounded lifespan, stable
phenotype, great availability and the ease of handling of hepatoma
cell lines set them apart. Their primary drawback, in contrast to
hepatocytes, is the reduced expression of certain metabolic
activities. As human liver cancer cells derived from a patient,
HepG2, are the most frequently used cell line in hepatotoxicity and
drug metabolism studies. These cells have a chromosomal count of
55, an epithelial display appearance, and carry out a variety of
distinct liver activities (5).
Monolayer cell culture, which is a more prevalent
culture method where cells typically grow in a flat plane on a
glass or polystyrene petri dish, has become a traditional approach.
However, the increasingly expansive field of 3D cell culture
involves cells growing in a third dimension, often in spherical or
spheroid structures. This allows cells to grow in a more natural
environment and enables a more realistic mimicry of cellular
interactions (6).
Spheroid formation is of critical interest,
particularly in cancer research, as spheroids can better mimic the
behavior and characteristics of cancer cells within tumor tissue.
These structures can provide features, such as self-renewal at the
single-cell level, differentiation ability, and the modeling of
cellular interactions within the tumor microenvironment (7).
Sucrose, a disaccharide composed of simple sugars,
is a naturally occurring sweetener. Recent studies suggest that
sucrose may be associated with cancer development and can promote
the growth of cancer cells (8). Of
note, cell culture studies have provided crucial information in
this regard. In the study by Goncalves et al (9), it was found that high fructose
increased intestinal tumor growth and cell proliferation in mice,
and it increased the risk of metastasis. Similarly, other studies
have also indicated that sucrose may have similar effects in breast
cancer, prostate cancer and a number of other types of cancer
(10-13)
. It is reported that sucrose can regulate the activity of enzymes
within the cell and promote spheroid formation. Although there have
been studies on the effects of sucrose on spheroid formation,
further research is required to provide a clear answer on whether
sucrose supports spheroid formation (14-16).
Alpha-fetoprotein (AFP) is a protein produced in the
liver and yolk sac of a developing fetus (17). AFP is used as a biomarker for the
early detection and diagnosis of HCC, particularly in patients with
chronic hepatitis B or C infection, and cirrhosis. Elevated AFP
levels can indicate HCC; however, it is not specific to HCC and can
also rise in other conditions, such as liver regeneration or
certain gastrointestinal tumors (18,19). AFP
levels can also provide information about the prognosis of HCC.
High AFP levels are generally associated with more advanced disease
and a poor prognosis (17). Albumin,
synthesized by the liver, is the main protein found in the blood
(21). In liver diseases, including
HCC, the ability of the liver to produce albumin is often impaired
(22). Low albumin levels are
associated with a poor prognosis in HCC and can reflect the
severity of underlying liver dysfunction. Albumin levels can also
provide information about the nutritional status of the patient,
which is crucial for the management of HCC, as malnutrition can
affect the ability of the patient to tolerate treatment and recover
(23).
While AFP is used for the detection, monitoring and
prognosis of HCC, albumin levels provide information about the
functional status of the liver, as well as the overall prognosis
and nutritional status of the patient in the context of HCC. Both
markers are crucial for the management of patients with liver
cancer.
Therefore, the present study investigated the
effects of sucrose on spheroid formation, AFP levels and albumin
secretion, as well as on the morphology of living cancer cells. The
term ‘living cancer cells’ refers to the HepG2 cell line (ATCC
HB-8065), not primary tumor-derived cells.
Materials and methods
Cells and cell culture
The human liver cancer cell line, HepG2, (American
Type Culture Collection®, cat. no. HB-8065) was
incubated at 37˚C in a 5% CO2 environment in Dulbecco's
modified Eagle's medium (DMEM, LM-T1720/100, Biosera) supplemented
with 10% (v/v) heat-inactivated fetal bovine serum and 1%
antibiotics (10 mg/ml streptomycin and 10,000 U/ml penicillin,
PAN-Biotech® GmbH). Sucrose (Thermo Fisher Scientific,
Inc.) was dissolved in distilled water at a concentration of 10
mmol/l. The experiment was conducted in two different cell culture
environments. The first environment was a conventional
two-dimensional (2D) cell culture, while the second was a
three-dimensional (3D) cell culture environment created using
Geltrex (Gibco™; Thermo Fisher Scientific, Inc.), a hydrogel
composed primarily of extracellular matrix proteins such as
laminin, collagen type IV and heparan sulfate proteoglycans. On the
day of the experiment, sucrose was prepared at the required
concentrations. The groups treated with sucrose included HepG2
cells grown in the 2D culture and HepG2 cells grown on Geltrex.
Sucrose was not applied to the control groups. For spheroid
generation from HepG2 cells, the method developed by Tok et
al (24) was used. A 10 mM
sucrose stock solution was prepared in sterile distilled water and
stored at 4˚C. For all the experiments, cells were treated with
sucrose at a final working concentration of 10 mM by the direct
addition of the stock solution to the culture medium. All
experiments were performed with n=3 independent biological
replicates, unless otherwise stated.
Live cell imaging
HepG2 cells were cultured under 2D and 3D
conditions. For 3D culture, spheroids were generated using
Geltrex-coated plates as described above. Sucrose was prepared as a
10 mM stock solution and applied to the experimental groups at a
final concentration of 10 mM, while the control groups received no
sucrose treatment. Live cell membrane and nuclear staining were
performed using the Image-iT™ LIVE Plasma Membrane and Nuclear
Labeling kit (cat. no. I34406, Invitrogen; Thermo Fisher
Scientific, Inc.) according to the manufacturer's instructions to
assess cell viability and membrane integrity. Images were acquired
using a Zeiss LSM 700 confocal microscope (Carl Zeiss AG)
fluorescence/confocal microscope under identical imaging settings
for all experimental groups.
Histochemistry
Both the 2D and 3D cell culture environments were
evaluated using periodic acid-Schiff (PAS; MilliporeSigma)
staining. For this purpose, the 2D and 3D cell cultures were
incubated for 7 days at 37˚C in a 5% CO2 environment.
Following fixation with formaldehyde (Merck KGaA) at room
temperature for 15 min, the histological staining temperature and
duration have been specified as room temperature for 30 min. was
performed. PAS is a staining technique used to detect
water-insoluble polysaccharides in tissues. The reaction between
periodic acid and adjacent diols in sugars forms a pair of
aldehydes. These aldehydes then react with Schiff's reagent,
producing a purple-magenta color. The presence of glycogen deposits
within the cells growing 2D or forming spheroids was examined using
high-resolution light microscopy as Zeiss Primovert (Carl Zeiss
AG).
PAS staining was performed on all experimental
groups. The changes in glycogen deposits due to the effect of
sucrose were thus examined. Additionally, ImageJ software (version
1.53k, National Institutes of Health) was used to clearly identify
the regions stained with magenta by the PAS stain.
Morphological analysis of the membrane
integrity of living cancer cells
Cells from each group were labeled using plasma
membrane labeling kit for live cells (Image-IT™ LIVE Plasma
Membrane and Nuclear Labeling Kit; Invitrogen; Thermo Fisher
Scientific, Inc.). All experimental groups were labeled with a live
membrane marker using the Image-iT™ LIVE Plasma Membrane and
Nuclear Labeling kit (cat. no. I34406, Invitrogen; Thermo Fisher
Scientific, Inc.) at room temperature according to the
manufacturer's instructions. and imaged with a confocal microscope
as Zeiss LSM 700 confocal microscope (Carl Zeiss, Germany). The
changes in the cell membrane in groups treated with sucrose were
statistically compared to the control groups.
Immunofluorescence staining
For the immunofluorescent labeling of spheroids in
3D cell culture and the cells growing in 2D culture, whole-mount
immunofluorescence staining was performed as previously described
by Tok et al (24). Both
spheroids and 2D cells were first fixed with 4% formaldehyde at
room temperature for 37˚C and 30-15 min, respectively, then washed
three times with CellO™-IF (Cellorama). wash buffer. Primary
antibodies against AFP (cat. no. MA5-29006, Thermo Fisher
Scientific, Inc.; 1:200 dilution) and albumin (cat. no. A3293,
MilliporeSigma). (1:50 dilution) were incubated at 37˚C with the
cells for 1 h. Following incubation, the cells were washed three
times with CellO™-IF wash buffer. Subsequently, AlexaFluor 488
(cat. no. A-11008, Thermo Fisher Scientific, Inc.) and AlexaFluor
550 (cat. no. 84541, Thermo Fisher Scientific, Inc.) conjugated
secondary antibodies (dilution 1:500) were added and incubated at
room temperature for 1 h in the dark to prevent photobleaching.
This step was followed by three additional washes with
phosphate-buffered saline (PBS; cat. no. P4417, MilliporeSigma) to
remove any excess secondary antibodies. All steps were performed
for 1 h at 37˚C. Following staining, spheroids and 2D growing cells
were mounted with a mounting medium consisting of glycerol (cat.
no. G6279, MilliporeSigma), PBS and DAPI (cat. no. D1306, Thermo
Fisher Scientific, Inc.) (1 µg/ml) to stain the nuclei. The samples
were then imaged using a Zeiss LSM 700 laser scanning confocal
microscope (Carl Zeiss AG) at appropriate excitation/emission
wavelengths for AlexaFluor dyes and DAPI. Image analysis, including
the localization of AFP and albumin, was performed using ZEN Black
software (version 2012, Zeiss AG). and ImageJ software (version
1.53t; National Institutes of Health). Images were acquired using a
Zeiss LSM 700 confocal microscope (Carl Zeiss AG) with
excitation/emission wavelengths of 488/525 nm for FITC and 561/595
nm for Texas Red [this refers to a fluorescence detection channel
(filter) of the Zeiss LSM 700 confocal microscope] under identical
imaging settings for all experimental groups. Plasma membrane
integrity and cell viability were compared between the different
experimental groups. The localization of AFP and albumin, as well
as the live cells and their plasma membrane were comparatively
analyzed using Zen image analysis software and Image J
software.
Proliferative changes in liver cancer
cells growing 2D- and 3D cultures
DAPI-stained nuclei were quantified using ImageJ
software (version 1.53t; National Institutes of Health). Cell
counting was performed in five randomly selected, non-overlapping
fields per sample at x20 magnification, each representing a defined
and constant field area. All images were acquired under identical
exposure and imaging conditions, and the mean cell number per field
was used for statistical analysis.
Statistical analysis
All experiments were performed using three
independent biological replicates (n=3). Quantitative data are
presented as the mean ± standard deviation (SD). Statistical
analyses were conducted using GraphPad Prism version 8.01
(Dotmatics). The experimental design included two independent
factors: culture condition (2D vs. 3D) and treatment (control vs.
sucrose). Accordingly, data were analyzed using two-way analysis of
variance (ANOVA) to evaluate the main effects of culture condition
and treatment, as well as their interactions. When significant main
effects or interactions were detected, Tukey's multiple comparisons
test was applied for post hoc analysis. A P-value <0.001 was
considered to indicate a statistically significant difference.
Results
Sucrose enhances the proliferation and
spheroid formation of HepG2 cells
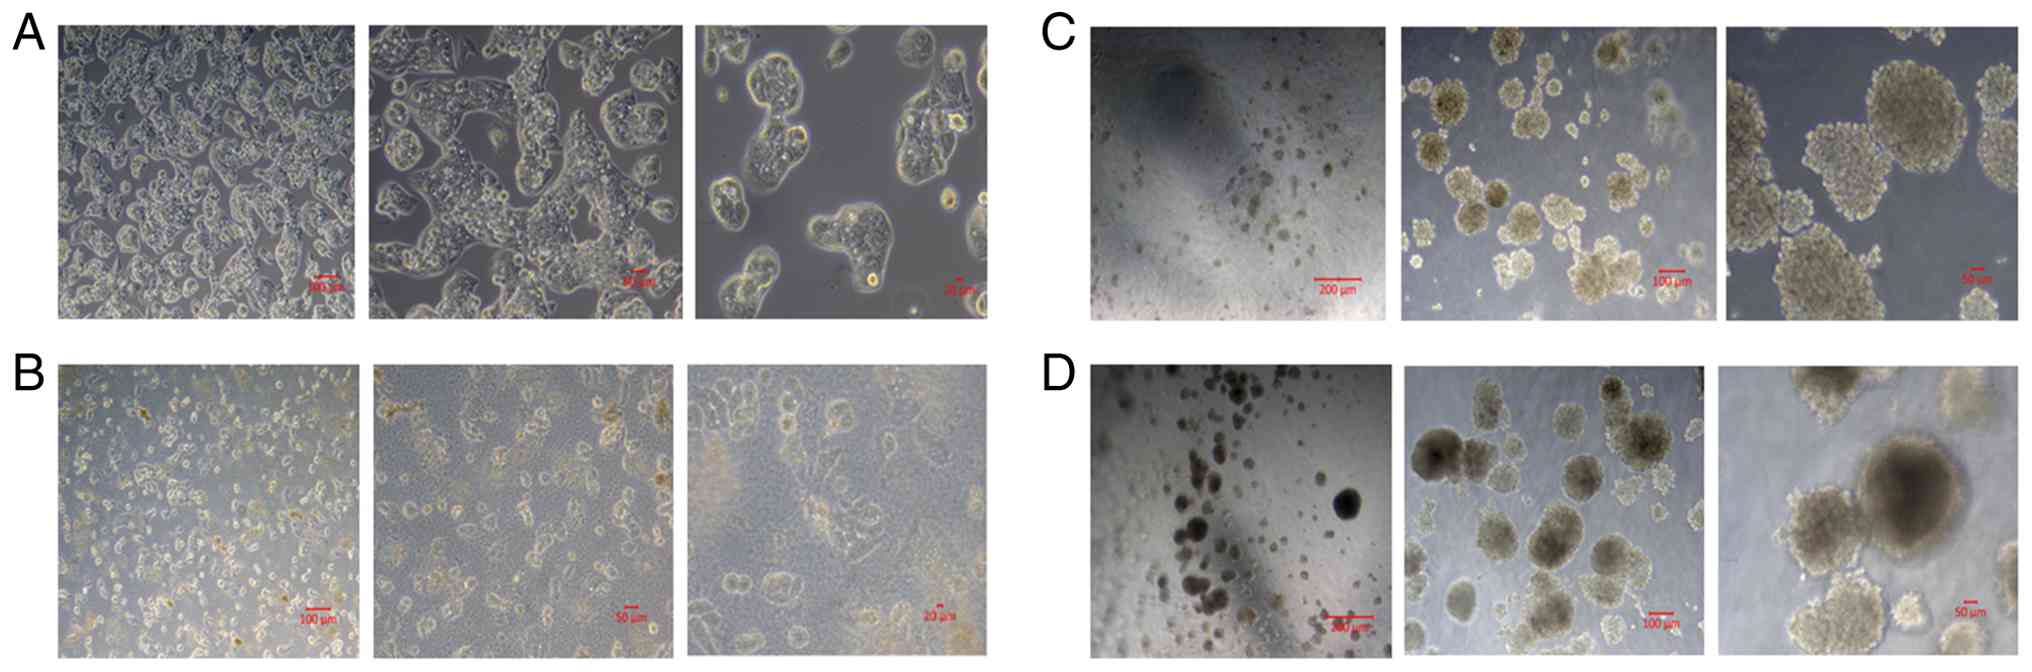
The HepG2 cells were examined and imaged every other
day under a phase contrast microscope. This allowed for a visual
representation of the changes at the morphology of living cancer
cells in addition to proliferation rate. In the 2D growing
experimental group, the cell number increased significantly
following sucrose exposure, as evidenced by the images. In the 3D
cell culture environments created with Geltrex, spheroid formation
was evident in both groups, treated and untreated spheroids with
sucrose. However, the numbers and size of the spheroids were
notably higher following treatment with sucrose. Live-cell imaging
was performed at day 7 as the experimental endpoint to compare
morphological differences between the experimental groups (Fig. 1).
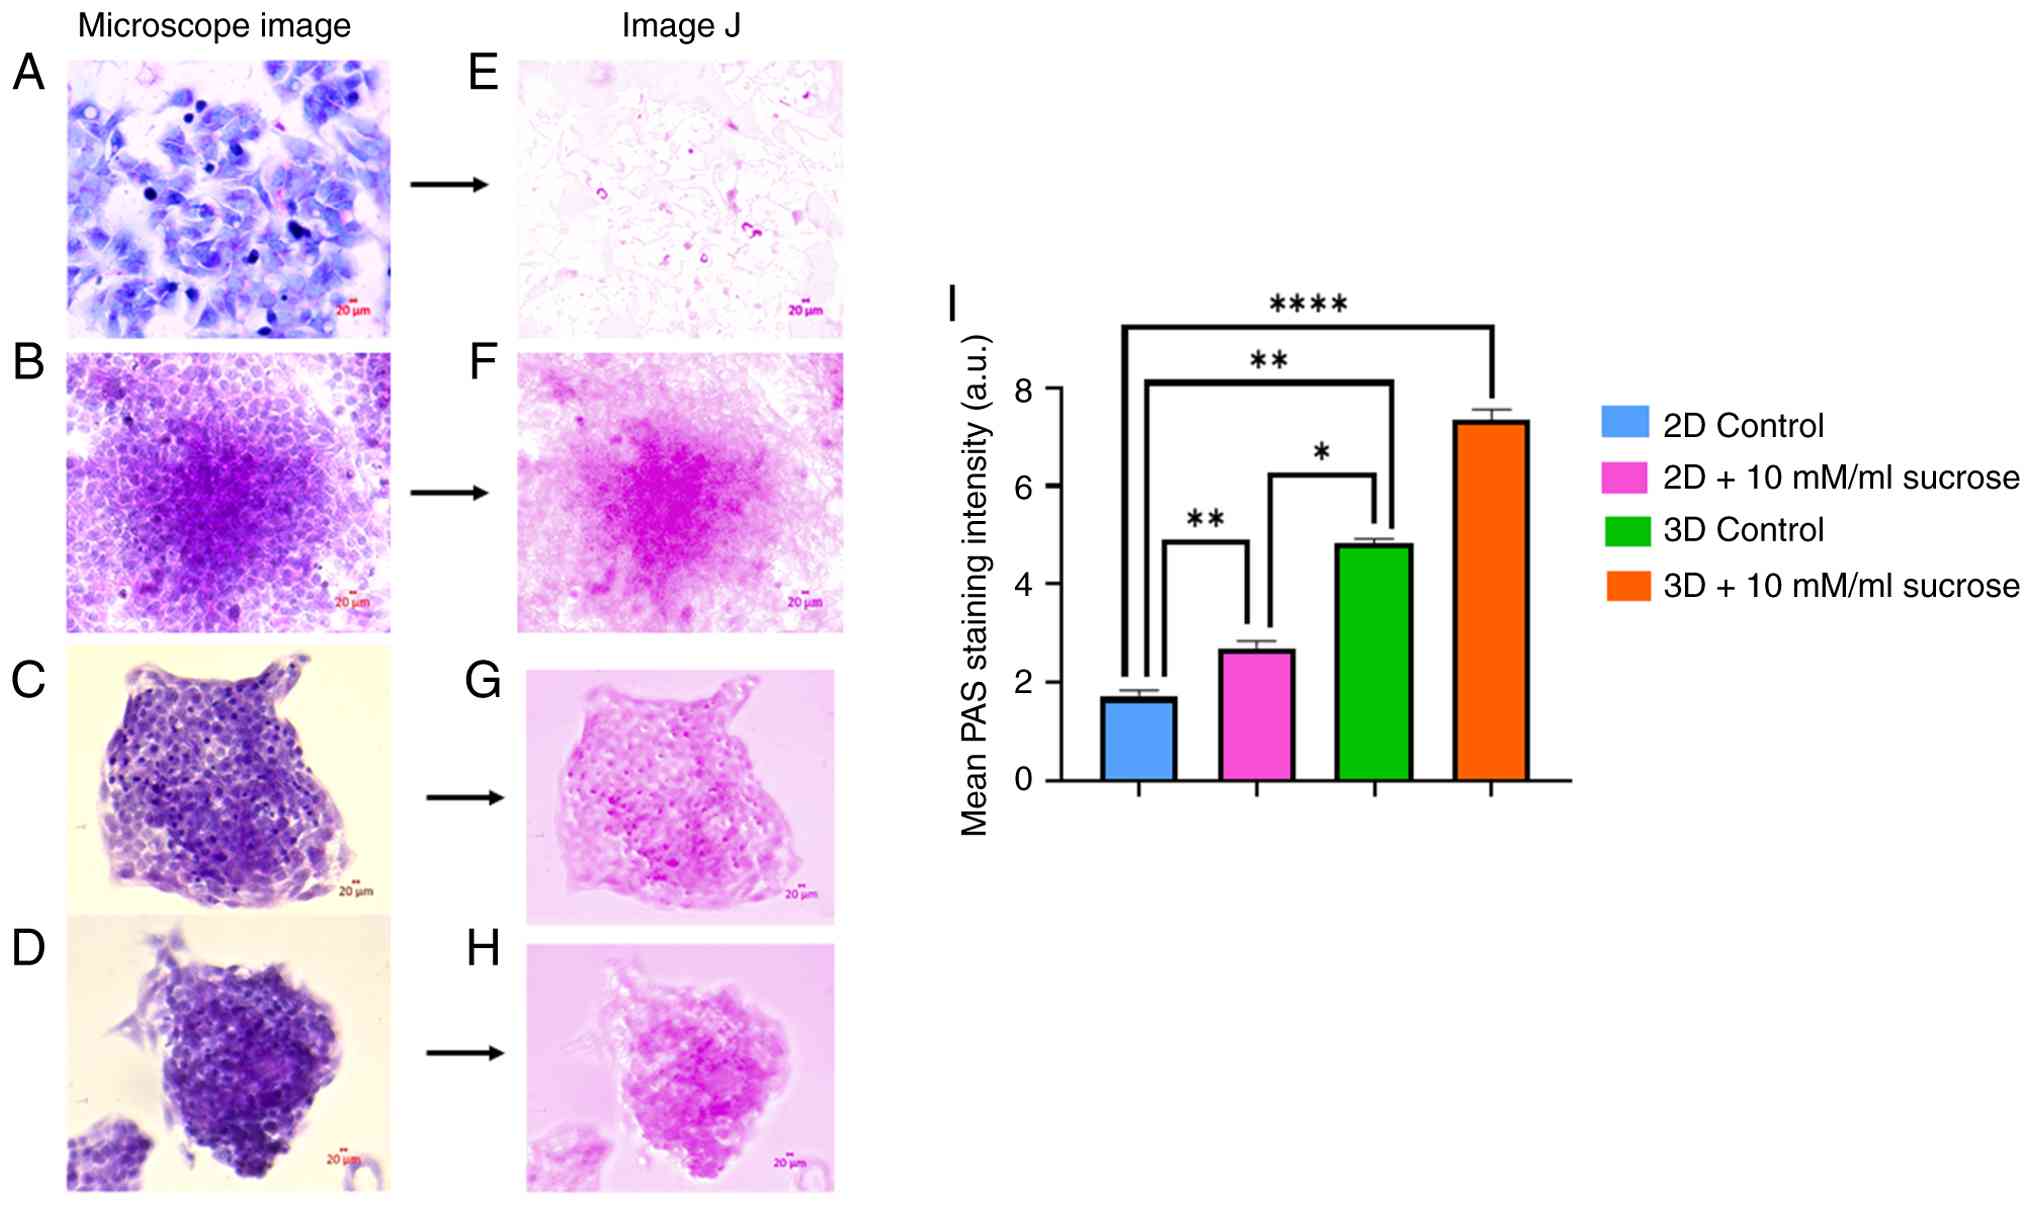
Sucrose affects PAS-positive
carbohydrate accumulation in 2D- and 3D-growing HepG2 cells
PAS staining revealed an increase in PAS-positive
intracellular material, which is commonly associated with
glycogen-rich content. However, as amylase digestion control was
not performed, these results should be interpreted as indicative of
PAS-positive carbohydrate accumulation rather than definitive
glycogen identification (Fig. 2A-H);
the quantitative analysis of PAS-positive areas, performed using
GraphPad Prism software, demonstrated a significant increase in
sucrose-treated groups compared to the controls (Fig. 2I).
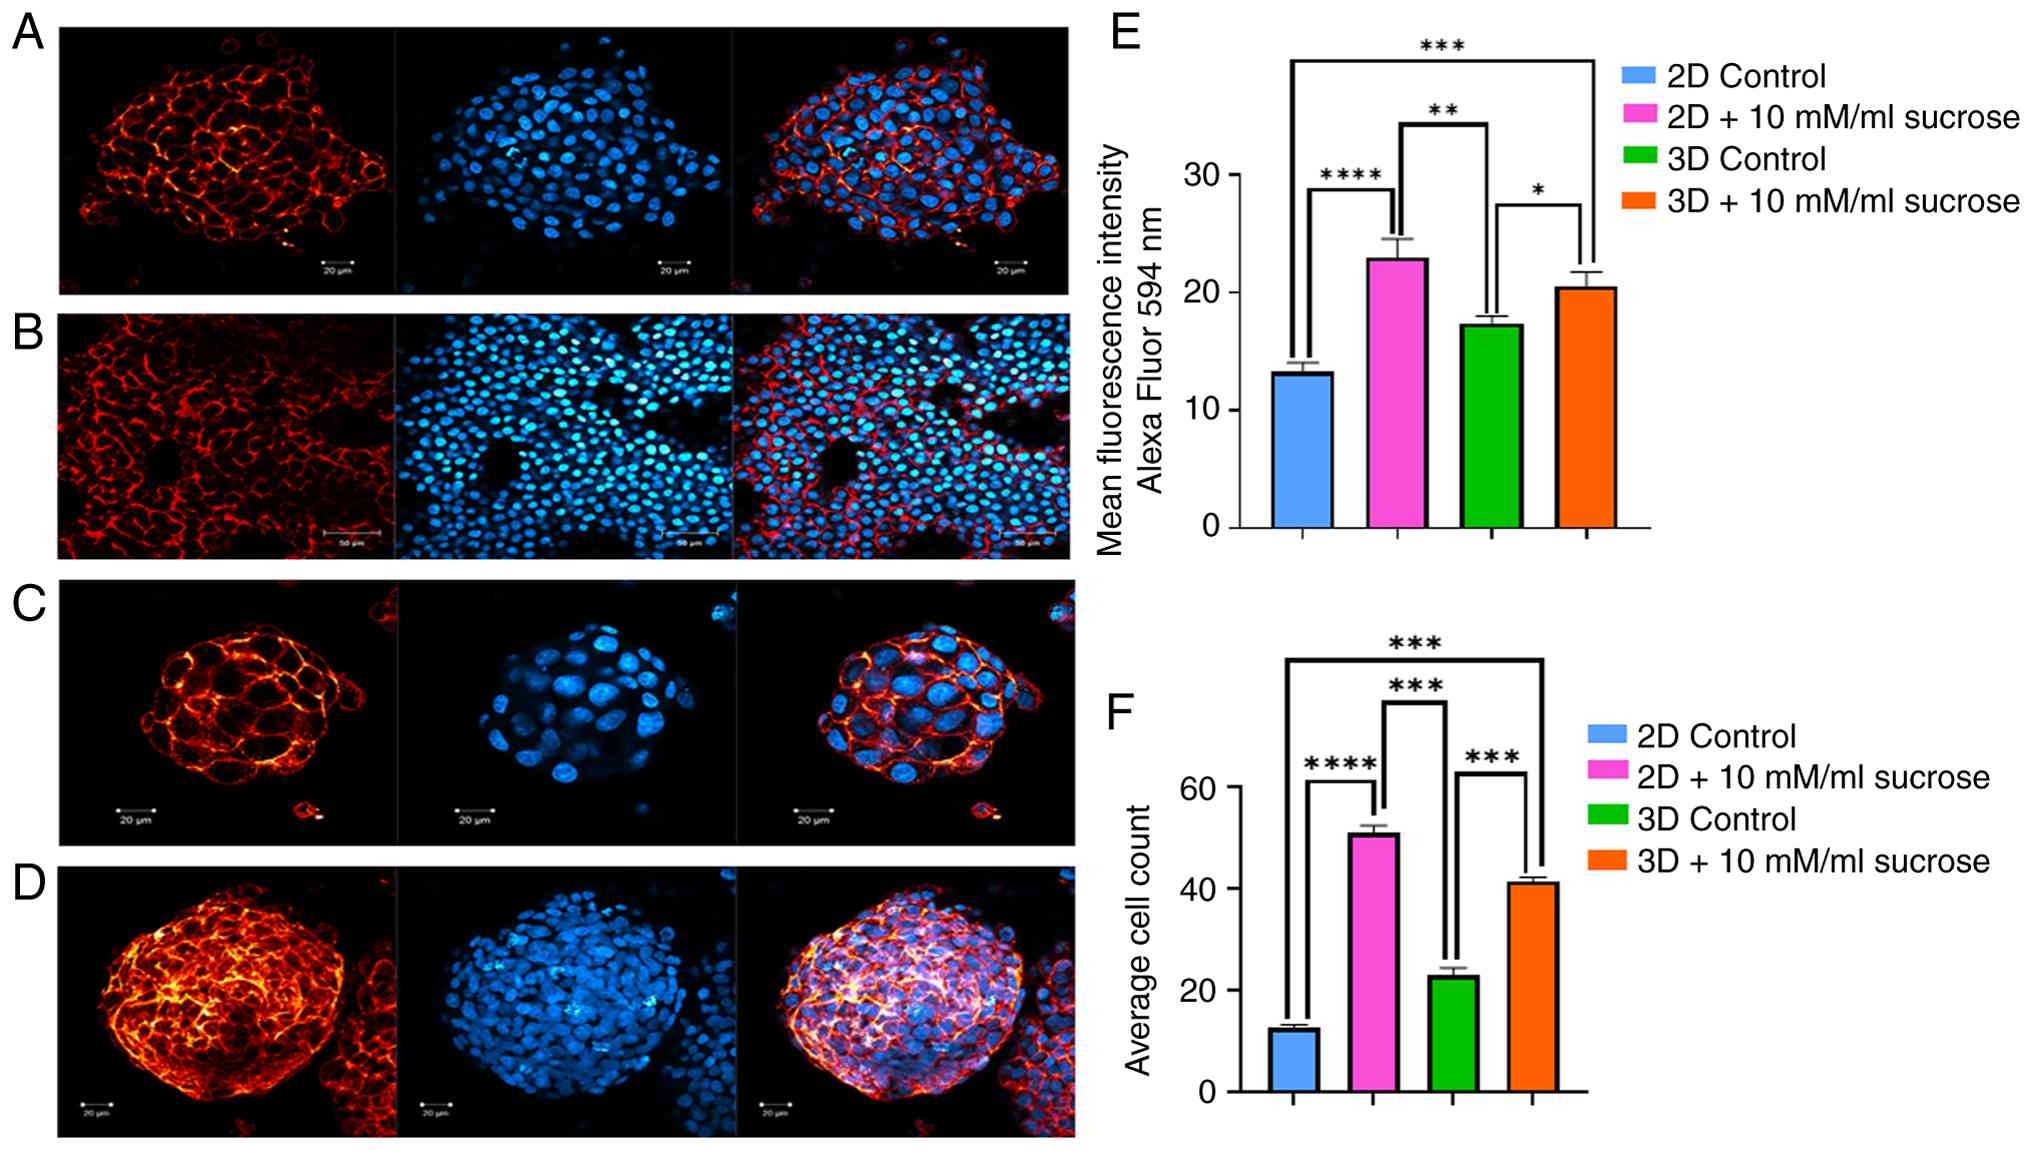
Measurement of proliferative changes
in liver cancer cells growing in 2D and 3D culture
For each group, changes in cell proliferation in
response to sucrose treatment were investigated by counting the
nuclei of cells stained with DAPI using ImageJ software.
Representative confocal images of DAPI-stained cells from 2D
cultures are presented in Fig. 3A
and B, while images from 3D cultures
are presented in Fig. 3C and
D. In these images, cell nuclei
appear as blue fluorescent structures located in the central
regions of the images due to DAPI staining. An increase in cell
proliferation was observed under sucrose treatment. The
quantitative analysis of nuclei counts is presented in Fig. 3F. Overall, an increase in
proliferation was detected under the influence of sucrose.
Sucrose alters HepG2 cell behavior
without affecting membrane integrity
HepG2 cells were labeled with live cell membrane
stain. There was no significant difference in the staining of cell
membranes in the experimental groups. However, the results of this
experiment also confirmed the considerable effect of sucrose on the
proliferation and spheroid formation of HepG2 cells. The
sucrose-treated groups exhibited increased cell numbers and bigger,
more spheroids, further validating the impact of sucrose.
Morphology of liver cancer cells does
not significantly change over time under the effects of
sucrose
As illustrated in Fig.
3, live cell membrane staining confirmed the presence of
healthy living cancer cells with precisely labeled cell membranes
and nuclei in all experimental groups. Notably, sucrose treatment
did not markedly alter membrane integrity.
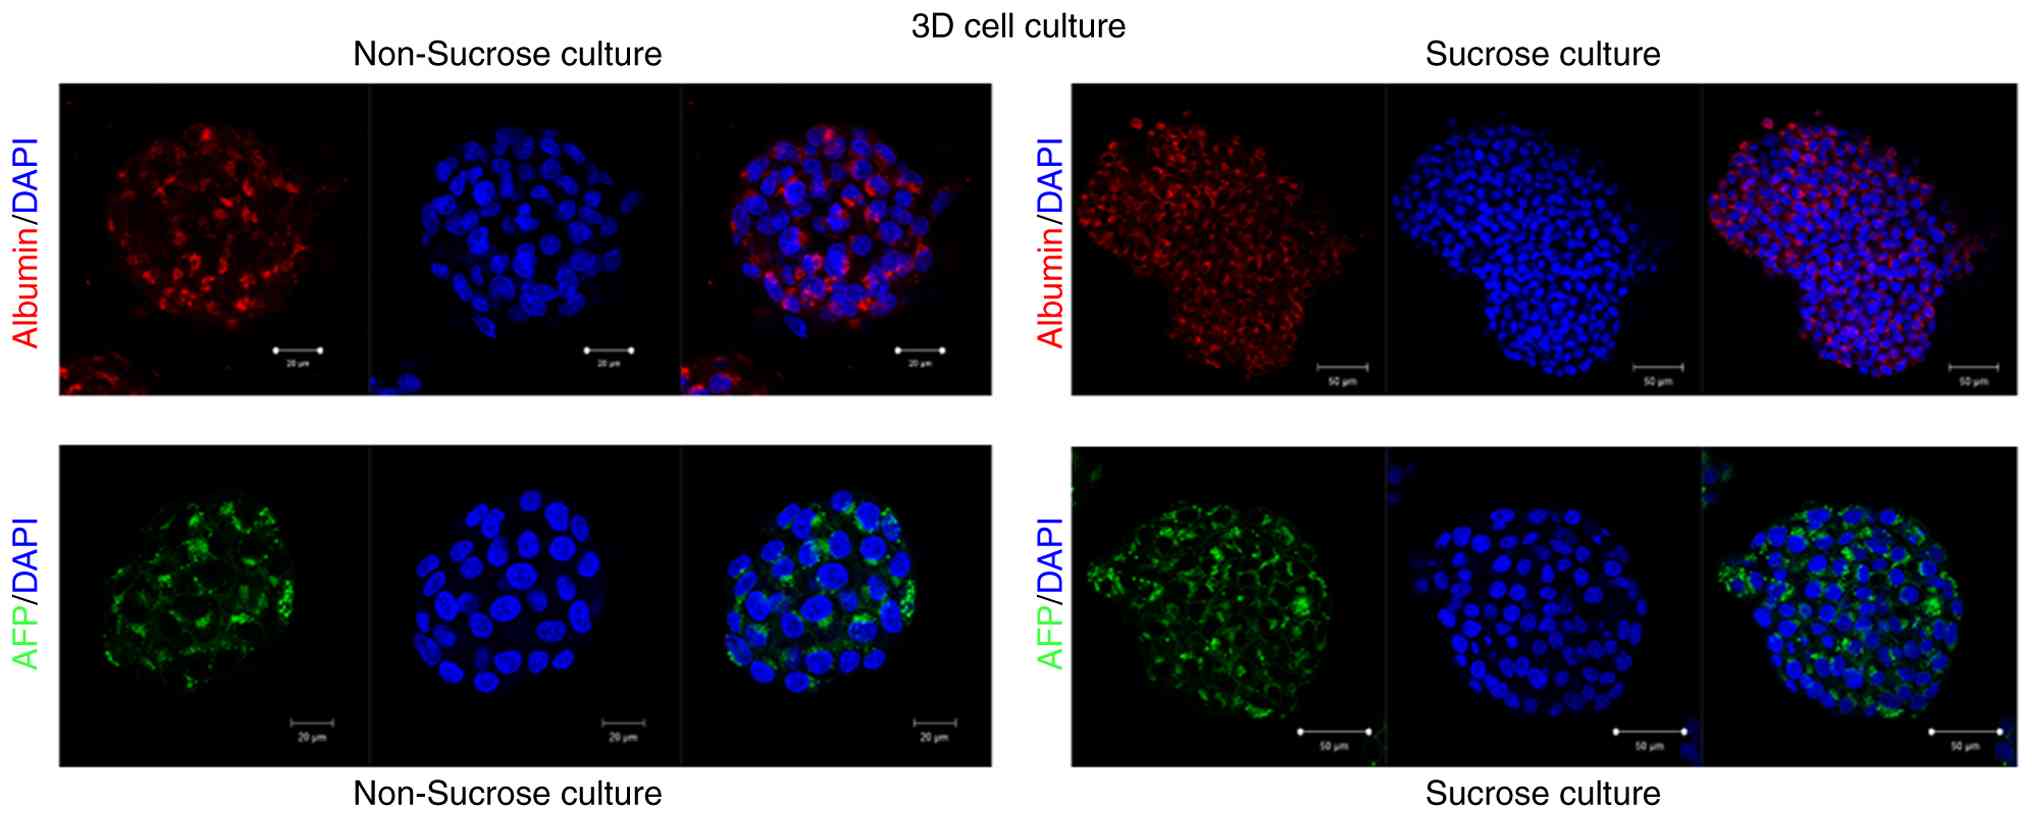
AFP and albumin expression
The localization of AFP and albumin in the
experimental groups labeled with monoclonal antibodies, as well as
the changes in these antibodies due to the effect of sucrose, are
demonstrated in Fig. 4. Fig. 4 presents representative confocal
microscopy images illustrating AFP and albumin expression patterns
under control and sucrose-treated conditions. Confocal imaging
revealed that sucrose exposure led to significant changes in the
secretion dynamics of both markers. Analyses using confocal
microscopy at the secretion of AFP and albumin confirmed markedly
meaningful changes under the effect of sucrose. The expression of
AFP in the cytosol of liver cancer cells increased following
sucrose exposure, whereas no marked change was observed in albumin
expression.
Discussion
The present study investigated how sucrose affects
liver cancer cells (HepG2) in both 2D and 3D environments. Sucrose
significantly increased the growth rate of HepG2 cells in 2D
cultures and promoted their ability to form spheroids in 3D
culture, potentially enhancing tumor aggressiveness. Live-cell
imaging in the present study was performed at the experimental
endpoint (day 7). Therefore, the temporal dynamics of
sucrose-induced effects during the early stages of spheroid
formation were not addressed in the present study. Future studies
incorporating multiple time points would allow for a more
comprehensive evaluation of these effects. Sucrose treatment has
been shown to be associated with an increased PAS-positive
intracellular carbohydrate accumulation in both 2D and 3D cancer
cell models (22,23). Herein, live cell imaging revealed
healthy cell membranes and nuclei even following sucrose treatment,
suggesting internal metabolic changes may be driving cancer cell
growth. When the expression profiles of AFP and albumin were
considered together, the findings suggested that sucrose may be
associated with changes related to a malignant phenotype. The
observed increase in AFP expression, a commonly used cancer marker,
supports this possibility. However, the observed albumin expression
in the cells suggests that they may not have fully lost their
differentiation characteristics, indicating that the effects could
reflect an early or partial malignant response rather than a fully
established malignant transformation (24,25).
While the present study focused on liver cancer
cells in vitro, existing literature suggests an association
between high dietary sugar intake and cancer-related outcomes
across various experimental and epidemiological models. Previous
preclinical studies have reported that high-sucrose or
high-fructose diets are accompanied by alterations in cellular
metabolic and inflammatory processes; however, these observations
are derived from systemic models and were not directly assessed in
the present study. In humans and primates, additional sugar
consumption has been extensively investigated in relation to
metabolic syndrome, a known risk factor for cancer, despite the
limited number of prospective studies directly linking sugar intake
to cancer incidence (25). Notably,
a higher sugar consumption following a breast cancer diagnosis has
been shown to be associated with increased all-cause and
cancer-specific mortality (25).
It should be noted that the observed effects of
sucrose treatment may, at least in part, be influenced by changes
in medium osmolarity. Previous research has demonstrated that
alterations in extracellular osmolarity can modulate cancer cell
behavior, including proliferation, metabolism and spheroid
formation, independent of the specific solute used (26). In the present study, an
osmolarity-matched inert control, such as mannitol, was not
included. Therefore, it cannot be fully excluded that some of the
observed cellular responses may be attributable to osmotic stress
rather than sucrose-specific metabolic effects (27,28).
This limitation should be considered when interpreting the results,
and future studies incorporating appropriate osmolarity controls
will be necessary to distinguish sucrose-specific effects from
general osmotic responses.
In comparison to starch-based control diets, data
from three breast carcinoma models demonstrated that
sucrose-enriched diets not only accelerated the growth and
initiation of mammary gland tumors, but also significantly
increased the lung metastasis potential of mammary carcinoma
(29). In total, 30% of 6-month-old
MMTV/neu mice fed a starch control diet had detectable tumors;
however, in animals fed a sucrose-enriched diet (125, 250, and 500
g/kg, respectively), 50% of the mice developed mammary tumors. The
average tumor weight of the mice fed a 250 g/kg sucrose diet was 50
mg greater than that of the starch control group, suggesting that
sucrose both accelerated the growth of mammary cancer cells and
delayed the start of breast tumors (29).
In addition, in a previous study, a positive
association has been found between the consumption of soft drinks
and the risk of developing HCC, which was present in continuous
analyses and for the highest categories of intake in the cohort,
but also in the nested case-control subset after adjustment for
hepatitis status and liver function score (13). In comparison to the control group
(13.1±1.6), there were considerably more tumors located in the
proximal intestine (21.9±1.4) among those who consumed high-sucrose
diets (13). The mean weight of
primary tumors and the total number of lung metastases in the 4T1
cell-bearing animals were statistically substantially greater in
the 250 g/kg sucrose diet group compared to the starch control diet
group (29). As shown in several
clinical or preclinical studies, sucrose or sucrose supplemented
nutriments could cause foodborne precancerous reactions at the
molecular level (13,29).
The present study aimed to demonstrate the effects
of sucrose on liver cancer cells in in vitro 2D- and 3D-cell
culture models. These findings, together with existing research,
suggest that dietary sugar may influence liver cancer-related
cellular behaviors under in vitro conditions. The analysis
of protein markers revealed a concerning trend as reported in the
previous clinical and preclinical studies: Sucrose increased AFP (a
cancer marker) levels, while the levels of albumin (a marker for
healthy liver function) remained unaltered, potentially indicating
a shift towards a more malignant state. A key limitation of the
present study is the absence of pathway-level or molecular analyses
to explain the observed changes in cell growth and AFP expression
following sucrose exposure. No metabolic, signaling, or
transcriptional pathway-specific experiments were performed.
Therefore, the findings of the present study should be interpreted
as phenotypic observations rather than evidence of a defined
molecular mechanism. Future studies incorporating targeted pathway
analyses will be necessary to elucidate the underlying biological
processes.
In conclusion, the present study represents an
initial investigation into the effects of sucrose exposure on liver
cancer cells cultured in both two-dimensional and three-dimensional
in vitro models. By analyzing whole samples within their
native 2D or 3D microenvironments, this approach provides an
integrated view of cellular growth and spheroid organization under
controlled conditions. Our results show that sucrose exposure at 10
mM is associated with increased cell proliferation and enhanced
spheroid formation compared to untreated controls. While sucrose
has traditionally been used as a supportive component in cell
culture systems, these findings indicate that it may modulate
specific cancer cell-related behaviors, particularly growth rate
and three-dimensional organization, rather than directly promoting
cancer aggressiveness. Notably, the observed effects are limited to
in vitro models and do not address invasive, metastatic, or
in vivo tumor behavior. From a methodological perspective,
controlled enhancement of spheroid formation may contribute to the
development of more reproducible 3D liver cancer models for drug
screening applications. At the same time, these findings highlight
the need for careful optimization of cell culture conditions to
avoid unintended alterations in cellular phenotypes. Further
studies incorporating osmolarity-matched controls and direct
metabolic analyses will be necessary to clarify the biological
mechanisms underlying these observations.
Acknowledgements
Not applicable.
Funding
Funding: The present study was partially supported by the
Scientific and Technological Research Council of Türkiye.
Availability of data and materials
The data generated in the present study may be
requested from the corresponding author.
Authors' contributions
GD and RGA conceived and created the experimental
design. GD contributed reagents/materials/analysis tools. GD and CK
carried out the experiments. GD analyzed and interpreted the
results. GD and CK drafted the initial manuscript. GD and RGA
revised the manuscript. All authors have read and approved the
final submitted manuscript. GD, CK and RGA confirm the authenticity
of all raw data.
Ethics approval and consent to
participate
Not applicable.
Patient consent for publication
Not applicable.
Competing interests
The authors declare that they have no competing
interests
References
|
1
|
Ganesan P and Kulik LM: Hepatocellular
carcinoma: New developments. Clin Liver Dis. 27:85–102.
2023.PubMed/NCBI View Article : Google Scholar
|
|
2
|
Kishore SA, Bajwa R and Madoff DC:
Embolotherapeutic strategies for hepatocellular carcinoma: 2020
update. Cancers (Basel). 12(791)2020.PubMed/NCBI View Article : Google Scholar
|
|
3
|
Gilles HC, Garbutt T and Landrum J:
Hepatocellular carcinoma. Crit Care Nurs Clin North Am. 34:289–301.
2022.PubMed/NCBI View Article : Google Scholar
|
|
4
|
Herceg Z and Paliwal A: Epigenetic
mechanisms in hepatocellular carcinoma: How environmental factors
influence the epigenome. Mutat Res Rev Mutat Res. 727:55–61.
2011.PubMed/NCBI View Article : Google Scholar
|
|
5
|
Donato MT, Tolosa L and Gómez-Lechón MJ:
Culture and functional characterization of human hepatoma HepG2
cells. Methods Mol Biol. 1250:77–93. 2015.PubMed/NCBI View Article : Google Scholar
|
|
6
|
Duval K, Grover H, Han LH, Mou Y, Pegoraro
AF, Fredberg J and Chen Z: Modeling physiological events in 2D vs.
3D cell culture. Physiology (Bethesda). 32:266–277. 2017.PubMed/NCBI View Article : Google Scholar
|
|
7
|
Luckert C, Schulz C, Lehmann N, Thomas M,
Hofmann U, Hammad S, Hengstler JG, Braeuning A, Lampen A and Hessel
S: Comparative analysis of 3D culture methods on human HepG2 cells.
Arch Toxicol. 91:393–406. 2017.PubMed/NCBI View Article : Google Scholar
|
|
8
|
Malik VS, Pan A, Willett WC and Hu FB:
Sugar-sweetened beverages and weight gain in children and adults: A
systematic review and meta-analysis. Am J Clin Nutr. 98:1084–1102.
2013.PubMed/NCBI View Article : Google Scholar
|
|
9
|
Goncalves MD, Lu C, Tutnauer J, Hartman
TE, Hwang SK, Murphy CJ, Pauli C, Morris R, Taylor S, Bosch K, et
al: High-fructose corn syrup enhances intestinal tumor growth in
mice. Science. 363(1345)2019.PubMed/NCBI View Article : Google Scholar
|
|
10
|
Laguna JC, Alegret M and Roglans N: Simple
sugar intake and hepatocellular carcinoma: Epidemiological and
mechanistic insight. Nutrients. 6:5933–5954. 2014.PubMed/NCBI View Article : Google Scholar
|
|
11
|
Larsson SC, Bergkvist L and Wolk A:
Consumption of sugar and sugar-sweetened foods and the risk of
pancreatic cancer in a prospective study. Am J Clin Nutr.
84:1171–1176. 2006.PubMed/NCBI View Article : Google Scholar
|
|
12
|
Potischman N, Coates RJ, Swanson CA,
Carroll RJ, Daling JR, Brogan DR, Gammon MD, Midthune D, Curtin J
and Brinton LA: Increased risk of early-stage breast cancer related
to consumption of sweet foods among women less than age 45 in the
United States. Cancer Causes Control. 13:937–946. 2002.PubMed/NCBI View Article : Google Scholar
|
|
13
|
Stepien M, Duarte-Salles T, Fedirko V,
Trichopoulou A, Lagiou P, Bamia C, Overvad K, Tjønneland A, Hansen
L, Boutron-Ruault MC, et al: Consumption of soft drinks and juices
and risk of liver and biliary tract cancers in a European cohort.
Eur J Nutr. 55:7–20. 2016.PubMed/NCBI View Article : Google Scholar
|
|
14
|
Seo R, de Guzman ACV, Park S, Lee JY and
Kang SJ: Cancer-intrinsic Cxcl5 orchestrates a global metabolic
reprogramming for resistance to oxidative cell death in 3D. Cell
Death Differ. 32:1200–1213. 2025.PubMed/NCBI View Article : Google Scholar
|
|
15
|
Tidwell TR, Røsland GV, Tronstad KJ,
Søreide K and Hagland HR: Metabolic flux analysis of 3D spheroids
reveals significant differences in glucose metabolism from matched
2D cultures of colorectal cancer and pancreatic ductal
adenocarcinoma cell lines. Cancer Metab. 10(9)2022.PubMed/NCBI View Article : Google Scholar
|
|
16
|
Guerrero-López P, Drobac G, Silva EA,
Hagland HR and García-Aznar JM: Matrix composition and glucose
availability cooperatively determine cancer spheroid bioenergetics
in 3D hydrogels. Cancer Metab. 13(45)2025.PubMed/NCBI View Article : Google Scholar
|
|
17
|
Chen T, Dai X, Dai J, Ding C, Zhang Z, Lin
Z, Hu J, Lu M, Wang Z, Qi Y, et al: AFP promotes HCC progression by
suppressing the HuR-mediated Fas/FADD apoptotic pathway. Cell Death
Dis. 11:1–15. 2020.PubMed/NCBI View Article : Google Scholar
|
|
18
|
Gillespie JR and Uversky VN: Structure and
function of α-fetoprotein: A biophysical overview. Biochim Biophys
Acta. 1480:41–56. 2000.PubMed/NCBI View Article : Google Scholar
|
|
19
|
Sauzay C, Petit AM, Bourgeois AM, Barbare
JC, Chauffert B, Galmiche A and Houessinon A: Alpha-foetoprotein
(AFP): A multi-purpose marker in hepatocellular carcinoma. Clin
Chim Acta. 463:39–44. 2016.PubMed/NCBI View Article : Google Scholar
|
|
20
|
Goyal L, Zheng H, Abrams TA, Miksad R,
Bullock AJ, Allen JN, Yurgelun MB, Clark JW, Kambadakone A,
Muzikansky A, et al: A phase II and biomarker study of sorafenib
combined with modified FOLFOX in patients with advanced
hepatocellular carcinoma. Clin Cancer Res. 25:80–89.
2019.PubMed/NCBI View Article : Google Scholar
|
|
21
|
Fu X, Yang Y and Zhang D: Molecular
mechanism of albumin in suppressing invasion and metastasis of
hepatocellular carcinoma. Liver Int. 42:696–709. 2022.PubMed/NCBI View Article : Google Scholar
|
|
22
|
Carr BI and Guerra V: Serum albumin levels
in relation to tumor parameters in hepatocellular carcinoma
patients. Int J Biol Markers. 32:e391–e396. 2017.PubMed/NCBI View Article : Google Scholar
|
|
23
|
Baǧırsakçı E, Şahin E, Atabey N, Erdal E,
Guerra V and Carr BI: Role of albumin in growth inhibition in
hepatocellular carcinoma. Oncol. 93:136–142. 2017.PubMed/NCBI View Article : Google Scholar
|
|
24
|
Tok OE, Demirel G, Saatci Y, Akbulut Z,
Kayalar O and Aktas RG: Culturing, freezing, processing, and
imaging of entire organoids and spheroids while still in a
hydrogel. J Vis Exp. 190(e64563)2022.PubMed/NCBI View
Article : Google Scholar
|
|
25
|
Epner M, Yang P, Wagner RW and Cohen L:
Understanding the link between sugar and cancer: An examination of
the preclinical and clinical evidence. Cancers (Basel).
14(6042)2022.PubMed/NCBI View Article : Google Scholar
|
|
26
|
Taïeb HM, Garske DS, Contzen J, Gossen M,
Bertinetti L, Robinson T and Cipitria A: Osmotic pressure modulates
single cell cycle dynamics inducing reversible growth arrest and
reactivation of human metastatic cells. Sci Rep.
11(13455)2021.PubMed/NCBI View Article : Google Scholar
|
|
27
|
Miermont A, Lee SWL, Adriani G and Kamm
RD: Quantitative screening of the effects of hyper-osmotic stress
on cancer cells cultured in 2- or 3-dimensional settings. Sci Rep.
9(13782)2019.PubMed/NCBI View Article : Google Scholar
|
|
28
|
Mohammed D, Park CY, Fredberg JJ and Weitz
DA: Tumorigenic mesenchymal clusters are less sensitive to moderate
osmotic stresses due to low amounts of junctional E-cadherin. Sci
Rep. 11(16279)2021.PubMed/NCBI View Article : Google Scholar
|
|
29
|
Jiang Y, Pan Y, Rhea PR, Tan L, Gagea M,
Cohen L, Fischer SM and Yang P: A sucrose-enriched diet promotes
tumorigenesis in mammary gland in part through the 12-lipoxygenase
pathway. Cancer Res. 76:24–29. 2016.PubMed/NCBI View Article : Google Scholar
|