Introduction
Histamine (HA) is involved in a variety of
physiological processes, including inflammation, allergic
responses, neurotransmission and gastric acid secretion (1,2). HA
is synthesized by a pyridoxal phosphate-dependent enzyme, histidine
decarboxylase (HDC, EC 4.1.1.22), with L-histidine as a substrate.
The genetic expression of HDC has been widely detected throughout
the human body (3,4). HDC is reportedly induced by various
stimuli, not only in mast cells and basophils, but also in T
lymphocytes and macrophages (5,6). In
particular, this non-mast cell- and/or non-basophil-derived HA has
been shown to be involved in the regulation of angiogenesis,
inflammatory granulation and cell proliferation (6,7). It
has been demonstrated that cultured T lymphocytes overexpressed the
HDC gene in response to concanavalin A or various cytokines and
secreted HA into a culture medium (5,8).
In Jurkat cells, a model human cell line for T cells
used in numerous studies, HDC gene transcription was markedly
enhanced by treatments with phorbol 12-myristate 13-acetate (TPA)
or phytohemagglutinin (PHA) (9).
However, no studies assessing HA production in TPA-stimulated
Jurkat cells are currently available. In the current study, a rapid
and high-sensitivity derivatization technique was introduced, used
with 6-aminoquinoline carbamic acid (AQC) as a fluorescent reagent
(10,11), for detecting the trace amounts of
intracellular HA. The cellular level of HA in Jurkat cells treated
with TPA was then determined by developing an accurate and reliable
method quantified by ultra-high performance liquid chromatography
(UPLC) in combination with matrix-assisted laser
desorption/ionization quadrupole ion trap time-of-flight tandem
mass spectrometry (MALDI-QIT-TOF/MS) for the molecular
identification of HA.
Materials and methods
Chemicals and reagents
HA, 3-methylhistamine (3-methylHA) dihydrochloride,
(R)(−)-α-methylHA dihydrochloride and TPA were purchased from
Sigma-Aldrich (St. Louis, MO, USA). HPLC-grade methanol and
acetonitrile were obtained from Wako (Tokyo, Japan). An AccQ-Tag
Ultra-Fluor™ derivatization kit (borate buffer and reagent) was
purchased from Waters (Milford, MA, USA). Bradykinin fragment 1–7,
the calibration standard for MALDI-QIT-TOF/MS, was purchased from
Sigma-Aldrich. 2,5-Dihydroxybenzoic acid (DHBA) matrix of MALDI-MS
grade was purchased from Shimadzu GLC (Kyoto, Japan).
Cell culture
Jurkat cells, a human leukemic T-cell line, were
maintained in RPMI 1640 complete medium (Wako) with 10%
heat-inactivated fetal bovine serum (FBS, Invitrogen, Carlsbad, CA,
USA), 2% (w/v) L-glutamine, 100 U/ml penicillin and 100 mg/ml
streptomycin (Invitrogen). HeLa S3 cells, a human epithelial
carcinoma, were maintained in RPMI 1640 supplemented with 5% FBS.
The two cell lines were cultured in a humidified atmosphere
containing 5% CO2 at 37°C.
RNA preparation and RT-PCR
Total RNA was extracted from cultured Jurkat cells
(5×10⁶ cells/dish) and HeLa S3 cells (3×10⁶
cells/dish) treated with TPA (10 ng/ml) or dimethyl sulfoxide
(DMSO) for 16 h. The synthesis of cDNA and RT-qPCR was performed as
previously described (12). The
primers used for amplification were hdc forward,
5′-CAAGCACATGTCAGAGATGG-3′; hdc reverse,
5′-TGAACAGGAAGGAGGACAG-3′; glyceraldehyde 3-phosphate dehydrogenase
(GAPDH) forward, 5′-GTC TTCACCACCATGGAGAAGGC-3′;
GAPDH reverse, 5′-GCAGTGATGGCATGGACTGTGGT-3′. The number of
PCR cycles of amplification for each primer set was determined by
carrying out preliminary experiments to avoid the saturation of PCR
products. The sizes of the PCR products of hdc and
GAPDH were 589 and 248 bp, respectively.
Sample preparation and derivatization for
chromatographic analysis
Jurkat cells were plated at 1.25×10⁷
cells/well and harvested following stimulation with DMSO or TPA (10
ng/ml) for 16 h. Cells were homogenized in 0.6-ml Milli-Q™ water
using an ultrasonic cell disruptor on ice. Cell debris and
insoluble matter were removed by centrifugation at 14,000 rpm for
10 min at 4°C. The protein concentrations of the lysates were
determined by Bio-Rad Protein Assay reagent (Bio-Rad, Hercules, CA,
USA) with aliquots of lysate. HA extraction was performed as
previously described by Shore et al (13), with minor modifications. After
adding 2 nmol of α-methylHA into each sample, samples were
acidified with 60% perchloric acid and vortexed. The acid extract
was maintained on ice for 10 min to precipitate proteins and was
then centrifuged at 14,000 rpm for 20 min to remove the denatured
proteins.
Supernatant (in 500-μl aliquots) was transferred to
a 2-ml tube containing 0.5 ml of 5 N NaOH, 200 mg of solid NaCl and
1 ml of n-butanol. The tube was agitated for 5 min by shaker to
extract the HA into the butanol. After centrifugation at 14,000 rpm
for 10 min, the organic phase was transferred to the fresh tube and
agitated for ~1 min with 500 μl of salt-saturated 0.1 N NaOH. The
tube was then centrifuged at 14,000 rpm for 10 min and a 1-ml
aliquot of organic phase was transferred to a 2-ml tube containing
375 μl of 0.1 N HCl and 700 μl of n-heptane. Subsequent to 5-min
agitation, the tube was centrifuged at 14,000 rpm for 10 min and
the HA in the aqueous phase was collected and dried with a rotary
concentrator. HA derivatization with AccQ-Tag reagents was
conducted as previously described (11). Briefly, the dried cell extract was
dissolved with 10 μl of Milli-Q water combined with 10 μl of
AccQ-Tag Ultra borate buffer. AccQ-Tag reagent (20 μl) previously
dissolved in 1.0 ml of AccQ-Tag Ultra reagent diluent was added.
After a 1-min incubation at room temperature, the reaction mixture
was concentrated with a centrifugal evaporator.
Chromatographic conditions
UPLC was performed on an Acquity™ UPLC system
(Waters), equipped with an FLR fluorescent detection system.
Fluorescent derivatives were separated on an AccQ-Tag™ amino acid
analysis C18 (Waters; 1.7 μm, 2.1×100 mm) column with a VanGuard™
cartridge (Waters) at 40°C with an acetonitrile gradient in
ammonium acetate buffer (pH 6.0) at a flow rate of 0.25 ml/min.
Mobile phase solutions A and B were 4 and 60% acetonitrile in 0.1 M
ammonium acetate, pH 6.0, respectively. The gradient conditions
were: 0% B for 25 min, 0–3.5% B for 20 min, 3.5–6% B for 0.5 min,
6% B for 10 min, 6–7% B for 0.5 min, 7% B for 10 min, 7–8% B for
0.5 min and 8% B for 10 min. Following gradient elution, the column
was rinsed with 100% B for 5 min, then returned to the initial
conditions (0% B) in 0.5 min to allow the column to re-equilibrate
for 10 min. The injection volume was 7.5 μl. Target peaks were
fractioned and subsequently samples were dried completely using an
evaporator.
MALDI-QIT-TOF/MS
DHBA matrix (5 mg) was dissolved in 0.5 ml of 16%
acetonitrile and 0.06% trifluoroacetic acid. Matrix solution (0.5
μl) and 0.5 μl of sample dissolved in Milli-Q water were deposited
on a MALDI plate and left to dry at room temperature to prepare
sample spots. External calibrations were achieved using the
standard reagents of DHBA matrix (monoisotopic mass of
[(M+H)+ = 155.03] and bradykinin fragment 1–7
(monoisotopic mass of [(M+H)+ = 757.4]). MS experiments
with MALDI-QIT-TOF/MSn (n=1, 2) were performed using
argon as the collision gas on an AXIMA Resonance mass spectrometer
(Shimadzu-Biotech, Kyoto, Japan) equipped with a nitrogen laser
(337 nm), with the collision-induced dissociation (CID) control
value set at 230.
Standard curves
Calibration standards for HA (0, 0.25, 0.5, 1.0, 2.0
and 4.0 nmol) were prepared from the stock solution (25 μg/ml)
diluted in Milli-Q water and stored at −20°C. For the preparation
of the calibration curves, standards for HA and internal standards
(2 nmol of α-methylHA) were added to cell lysates and subjected to
extraction and chromatography as described above. Calibration
curves were calculated by plotting the ratio of the peak area of
analytes to the area of the internal standard (α-methylHA) vs.
analyte quantity.
Results
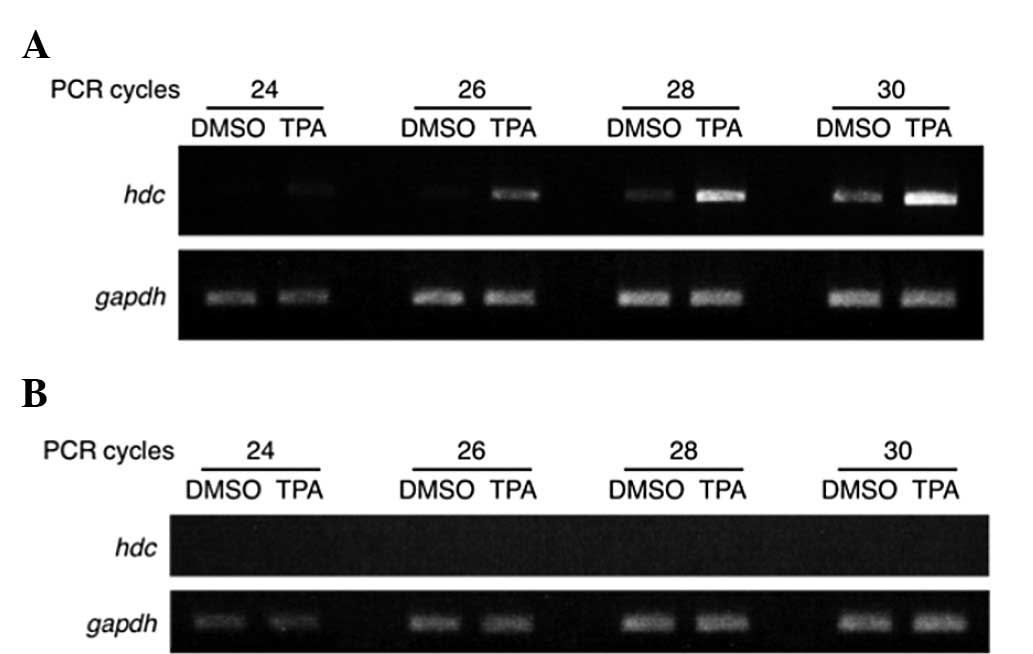
Induction of HDC mRNA in Jurkat
cells
To confirm a previous result (9), total RNA was extracted from Jurkat
and HeLa S3 cells to be used as a negative control and the level of
hdc mRNA was examined by an RT-PCR experiment using
gene-specific primers for human hdc. As shown in Fig. 1A, the level of hdc mRNA was
significantly increased when stimulated with TPA in Jurkat cells.
Conversely, it was not detected in HeLa S3 cells with or without
TPA (Fig. 1B).
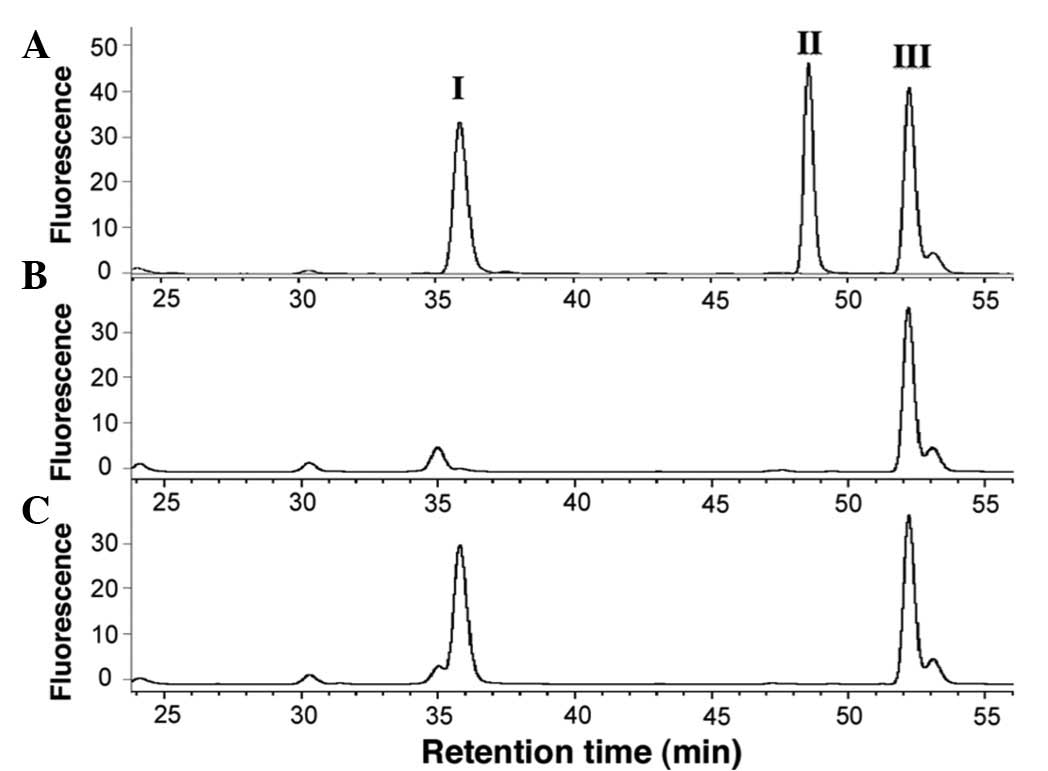
Development of methods
HA, 3-methylHA and α-methylHA were fluorescently
derivatized with AQC as described in Materials and methods. Typical
UPLC (equipped with ODS column) chromatograms were obtained
following the injection of standard samples containing AQC-labeled
HA-derivatives (Fig. 2A).
Retention times of AQC-HA (peak I), AQC-3-methylHA (peak II) and
AQC-α-methylHA (peak III) were 35.9, 48.6 and 52.3 min,
respectively. Representative chromatograms of samples from non- and
TPA-stimulated Jurkat cells are shown in Fig. 2B and C, respectively.
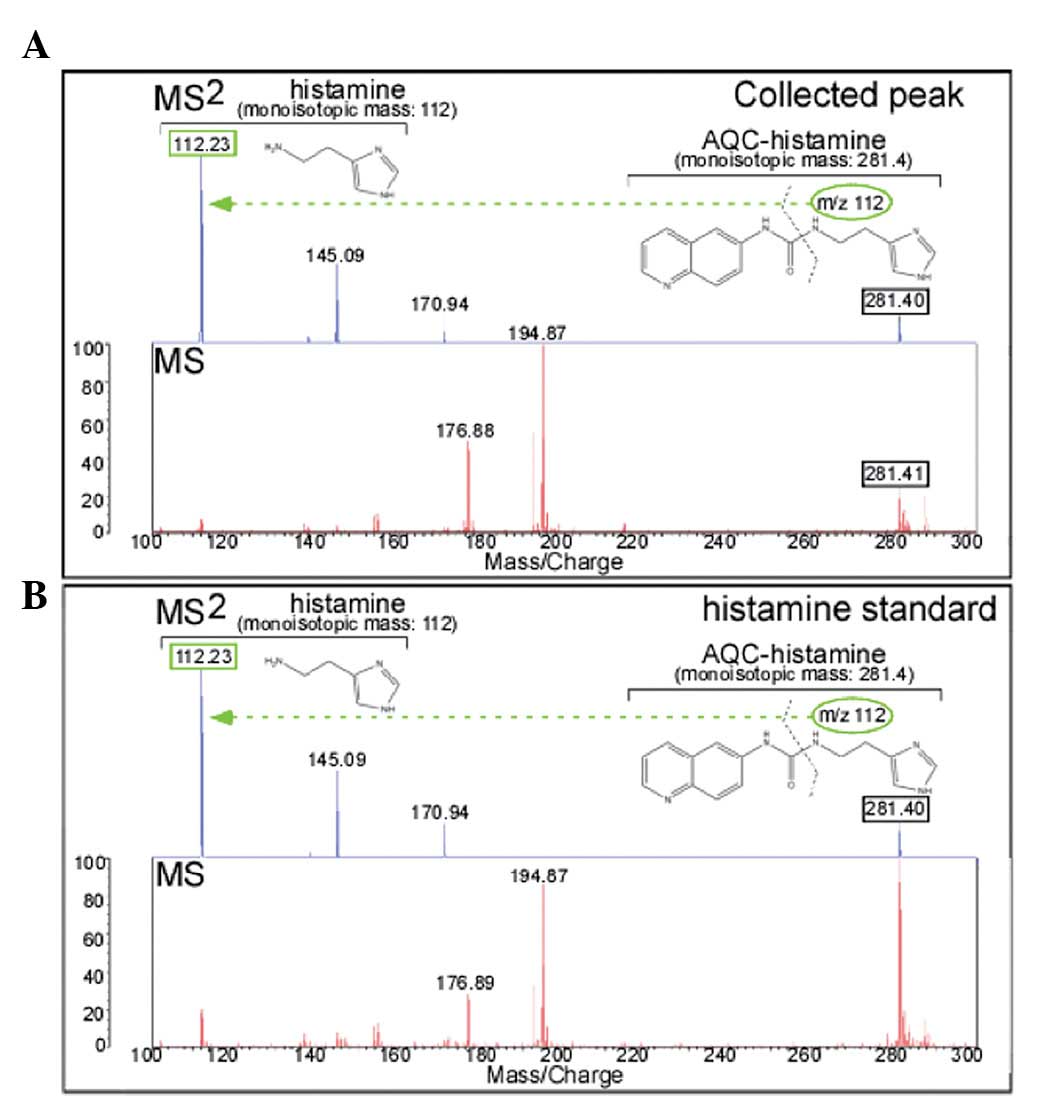
MS and MS/MS
To assess the identity of the peak derived from
Jurkat cells, the peak was fractioned with the retention time
corresponding to that of the AQC-derivatized standard HA and mass
analysis with MALDI-QIT-TOF/MS was carried out. Representative MS
and MS/MS spectra of the putative AQC-HA [(M+H)+ =
281.4] derived from Jurkat cells were observed (Fig. 3A). Following CID, the parental ion
produced the fragment ion 170.94 (the eliminated AQC-group).
Specific daughter transition for AQC-HA≥HA was revealed to be of
112.23 molecular mass (m/z). Identical fragmentation patterns were
observed in the MS and MS/MS spectra of AQC-standard HA (Fig. 3B), indicating that the peak in the
lysate of TPA-treated Jurkat cells (Fig. 2C) was AQC-HA.
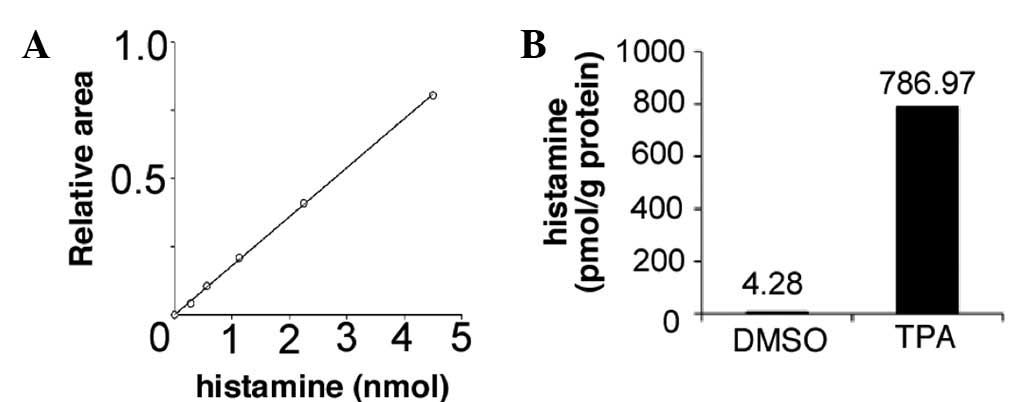
Calibration and quantitative
analyses
A calibration curve was calculated using the peak
area vs. concentrations of the standard analyte. The linearity was
verified over the assay range (0–4.0 nmol on-column). The typical
linear regression equation from the standard curve for HA was
y=5.013×10⁵x where y was the peak
area ratio of analyte to internal standard and x the analyte
amount (nmol). The correlation coefficient for the standard in cell
lysates was 0.999 (Fig. 4A). Under
this condition, the intracellular HA was measured and the increase
in its content from 4.28 (untreated) to 786.97 pmol/mg protein
(treated with TPA) was identified (Fig. 4B) through the induction of the HDC
gene expression (Fig. 1A).
Discussion
The transcriptional activation of HDC has been
proven to be controlled by the gastrin-responsive element located
in the 5′-region of its genome (14). Moreover, treatment with TPA and/or
PHA enhances this promoter activity in Jurkat cells (9). However, little is known about the
induced production of HA in cultured cells. The present study
demonstrates that the production of HA was upregulated in
association with HDC induction stimulated by TPA in Jurkat
cells.
Quantitative analyses of HA by HPLC have been
previously reported using fluorescence derivatization with dansyl
chloride (15) or
o-phthalaldehyde (13).
However, these conventional methods are too time-consuming to
complete the reaction (15) or
require the acidification of the reaction mixture to stabilize the
fluorophore (13). The current
study adopted a sensitive and accurate method for quantifying HA by
UPLC combined with an AQC-labeling technique (16–18),
which is a more rapid and stable method than those used previously;
the derivatization is completed in under 1 min and AQC-derivatives
are immediately applied to the UPLC system. By using the elution
program described in Materials and methods, standard AQC-HA (peak
I) was observed as the single sharp peak and AQC-α-methylHA (peak
III) was also detected to allow accurate integration for
quantification as an internal standard (Fig. 2A).
A significantly increased peak was identified at an
identical position to the AQC-standard HA in the lysates of the
Jurkat cells treated under conditions described in Fig. 1A (Fig.
2C), with this peak being collected for MS analysis. Since the
MS ≥ MS/MS sequential analysis with MALDI-QIT-TOF/MS revealed that
the CID patterns of the UPLC-fractioned peak (Fig. 3A) were identical to those of the
AQC-derivatized standard HA (Fig.
3B), we concluded that the substance increased by the
TPA-stimulation in Jurkat cells was HA. Since the linear regression
analysis demonstrated significant linearity of the calibration
curve from 0 to 4.0 nmol (Fig.
4A), the intracellular HA was measured with this calibration
curve and revealed that the amount of HA had increased to
approximately 180-fold by TPA, compared with the non-stimulated
cells (Fig. 4B).
HA is metabolized in two ways: one is the oxidative
deamination by diamine oxidase (DAO, EC 1.4.3.22) and the other is
imidazole ring-methylation by histamine-N-methyltransferase
(HNMT, EC 2.1.1.8) that converts HA to 3-methylHA only in the
cytoplasm (19–21). No peaks were detected in Fig. 2 corresponding to the standard
3-methylHA derivatized with AQC in TPA-stimulated cells and/or
control cells, although the HNMT gene was expressed in the Jurkat
cells treated with or without TPA (data not shown). The reason for
3-methylHA not being detected in the HDC-induced cells may be as
follows: i) low contents of 3-methylHA below measurable limits; ii)
ineffective translational rates of HNMT; iii) inactivation or
degradation of HNMT; or iv) rapid secretion of 3-methylHA into
culture media.
Results of a previous study have demonstrated that
the overproduced HA in T lymphocytes stimulated by concanavalin-A
was secreted to the extracellular space (8). However, the mechanisms of secretion
and/or metabolism remain to be determined. Therefore, additional
investigation of the culture medium is required for the estimation
of the total cellular production of HA in T lymphocytes.
In conclusion, the method described in this study is
useful for elucidating the physiological significance of HA
production, not only in T lymphocytes, but also in other cell
types.
Acknowledgements
This study was supported by a Grant-in-Aid for
Scientific Research (C) from the Ministry of Education, Culture,
Sports, Science, Sports and Technology of Japan and the TARA
Project from the University of Tsukuba.
References
|
1
|
Dale HH and Laidlaw PP: The physiological
action of β-imidazolylethylamine. J Physiol. 41:318–344. 1911.
|
|
2
|
Ohtsu H and Watanabe T: New functions of
histamine found in histidine decarboxylase gene knockout mice.
Biochem Biophys Res Commun. 305:443–447. 2002. View Article : Google Scholar : PubMed/NCBI
|
|
3
|
Mamune-Sato R, Yamauchi K, Tanno Y,
Ohkawara Y, Ohtsu H, Katayose D, Maeyama K, Watanabe T, Shibahara S
and Takishima T: Functional analysis of alternatively spliced
transcripts of the human histidine decarboxylase gene and its
expression in human tissues and basophilic leukemia cells. Eur J
Biochem. 209:533–539. 1992. View Article : Google Scholar
|
|
4
|
Moya-Garcia AA, Medina MA and
Sánchez-Jiménez F: Mammalian histidine decarboxylase: from
structure to function. Bioessays. 27:57–63. 2005. View Article : Google Scholar : PubMed/NCBI
|
|
5
|
Aoi R, Nakashima I, Kitamura Y, Asai H and
Nakano K: Histamine synthesis by mouse T lymphocytes through
induced histidine decarboxylase. Immunology. 66:219–223.
1989.PubMed/NCBI
|
|
6
|
Sasaguri Y and Tanimoto A: Role of
macrophage-derived histamine in atherosclerosis - chronic
participation in the inflammatory response. J Atheroscler Thromb.
11:122–130. 2004. View Article : Google Scholar : PubMed/NCBI
|
|
7
|
Ghosh AK, Hirasawa N, Ohtsu H, Watanabe T
and Ohuchi K: Defective angiogenesis in the inflammatory
granulation tissue in histidine decarboxylase-deficient mice but
not in mast cell-deficient mice. J Exp Med. 195:973–982. 2002.
View Article : Google Scholar : PubMed/NCBI
|
|
8
|
Kubo Y and Nakano K: Regulation of
histamine synthesis in mouse CD4+ and CD8+ T
lymphocytes. Inflamm Res. 48:149–153. 1999. View Article : Google Scholar : PubMed/NCBI
|
|
9
|
Higuchi S, Tanimoto A, Arima N, Xu H,
Murata Y, Hamada T, Makishima K and Sasaguri Y: Effects of
histamine and interleukin-4 synthesized in arterial intima on
phagocytosis by monocytes/macrophages in relation to
atherosclerosis. FEBS Lett. 505:217–222. 2001. View Article : Google Scholar : PubMed/NCBI
|
|
10
|
Cohen SA and Michaud DP: Synthesis of a
fluorescent derivatizing reagent,
6-aminoquinolyl-N-hydroxysuccinimidyl carbamate and its
application for the analysis of hydrolysate amino acids via
high-performance liquid chromatography. Anal Biochem. 211:279–287.
1993.PubMed/NCBI
|
|
11
|
Shirakawa T, Kako K, Shimada T, Nagashima
Y, Nakamura A, Ishida J and Fukamizu A: Production of free
methylarginines via the proteasome and autophagy pathways in
cultured cells. Mol Med Rep. 4:615–620. 2011.PubMed/NCBI
|
|
12
|
Yamagata K, Daitoku H, Takahashi Y, Namiki
K, Hisatake K, Kako K, Mukai H, Kasuya Y and Fukamizu A: Arginine
methylation of FOXO transcription factors inhibits their
phosphorylation by Akt. Mol Cell. 32:221–231. 2008. View Article : Google Scholar : PubMed/NCBI
|
|
13
|
Shore PA, Burkhalter A and Cohn VH Jr: A
method for the fluorometric assay of histamine in tissues. J
Pharmacol Exp Ther. 127:182–186. 1959.PubMed/NCBI
|
|
14
|
Zhang Z, Höcker M, Koh TJ and Wang TC: The
human histidine decarboxylase promoter is regulated by gastrin and
phorbol 12-myristate 13-acetate through a downstream cis-acting
element. J Biol Chem. 271:14188–14197. 1996. View Article : Google Scholar
|
|
15
|
Fajardo I, Urdiales JL, Medina MA and
Sanchez-Jimenez F: Effects of phorbol ester and dexamethasone
treatment on histidine decarboxylase and ornithine decarboxylase in
basophilic cells. Biochem Pharmacol. 61:1101–1106. 2001. View Article : Google Scholar : PubMed/NCBI
|
|
16
|
Busto O, Guasch J and Borrull F:
Determination of biogenic amines in wine after precolumn
derivatization with 6-aminoquinolyl-N-hydroxysuccinimidyl
carbamate. J Chromatogr A. 737:205–213. 1996. View Article : Google Scholar
|
|
17
|
Hernández-Orte P, Peña-Gallego A, Ibarz
MJ, Cacho J and Ferreira V: Determination of the biogenic amines in
musts and wines before and after malolactic fermentation using
6-aminoquinolyl-N-hydroxysuccinimidyl carbamate as the
derivatizing agent. J Chromatogr A. 1129:160–164. 2006.PubMed/NCBI
|
|
18
|
Fiechter G and Mayer HK: UPLC analysis of
free amino acids in wines: profiling of on-lees aged wines.
J Chromatogr B Analyt Technol Biomed Life Sci. 879:1361–1366. 2011.
View Article : Google Scholar : PubMed/NCBI
|
|
19
|
Stifel FB and Herman RH: Histidine
metabolism. Am J Clin Nutr. 24:207–217. 1971.
|
|
20
|
Klocker J, Mätzler SA, Huetz GN, Drasche
A, Kolbitsch C and Schwelberger HG: Expression of histamine
degrading enzymes in porcine tissues. Inflamm Res. 54(Suppl 1):
S54–S57. 2005.PubMed/NCBI
|
|
21
|
Küfner MA, Ulrich P, Raithel M and
Schwelberger HG: Determination of histamine degradation capacity in
extremely small human colon samples. Inflamm Res. 50(Suppl 2):
S96–S97. 2001.PubMed/NCBI
|