Introduction
An increasing number of studies are reporting that
tumors often originate from the transformation of normal stem
cells. It has been hypothesized that similar signaling pathways
regulate self-renewal in stem and cancer cells and cancer cell
populations may themselves include cancer stem cells, rare cells
with indefinite potential for self-renewal that drive tumorigenesis
(1–5). Goodell et al(6) identified a group of Hoechst
33342-stained bone marrow cells exhibiting cancer stem cell
characteristics, these cells were termed side population (SP)
cells. Despite the development of surgical and chemical therapies
for the treatment of osteosarcoma, the long-term survival rate
associated with this disease remains at 65% (7). Multidrug resistance is a major
determinant of clinical outcome in osteosarcoma (8–12).
Gibbs et al(13) isolated
osteosarcoma stem cells from an osteosarcoma cell population and
found that these stem cells overexpressed key regulatory genes
present in embryonic stem cells, including octamer-binding
transcription factor 4 (Oct4), sex determining region Y-box 2
(Sox2) and Nanog. The authors hypothesized that expression of these
genes may be a main feature of cancer stem cells. Cluster of
differentiation 133 (CD133) is recognized as a stem cell marker for
normal and cancerous tissues. At present, CD133 alone or in a
combination with additional markers is used for the isolation of
stem cells from numerous tissues, including bone marrow (14), brain (15), kidney (16), prostate (17), liver (18), pancreas (19) and skin (20). Furthermore, in a number of previous
studies, monoclonal antibodies against CD133 have been used for the
identification and isolation of putative cancer stem cell
populations from malignant tumors of the brain, prostate (21), liver (22), pancreas (23) and lung (24). Currently, surface markers on cancer
stem cells of osteosarcoma have yet to be defined. The present
study investigated CD133 expression in osteosarcoma and Saos-2 cell
lines to explore the underlying mechanisms of tumorigenesis and
drug resistance in osteosarcoma.
Materials and methods
Immunohistochemistry and cell count
analysis in osteosarcoma
All procedures were performed in accordance with
institutional guidelines from the Fourth People’s Hospital of Jinan
(Shandong, China) and the Department of Pathology in Qilu Hospital
(Shandong, China). A total of 55 patients diagnosed with
osteosarcoma, including 4, 13, 12 and 26 cases of parosteal,
fibroblastic, chondroblastic and osteoblastic osteosarcomas,
respectively, from the Department of Pathology (Qilu Hospital) were
selected for the study. Osteosarcoma types were termed groups 1–4,
respectively. Tumor tissues were removed and sent for paraffin
embedding. Informed consent was obtained from all patients.
Paraffin-embedded tissue samples were routinely
prepared, producing 3-μm tissue sections mounted on slides.
Sections were fixed with paraformaldehyde, slides were washed 3
times for 3 min in PBS and then endogenous peroxidase activity was
blocked using 1% H2O2. Citrate Antigen
Retrieval Buffer (Beijing Zhongshan Goldenbridge Biotechnology,
Beijing, China) was used to retrieve antigens and then CD133 mouse
anti-human antibody (Beijing Biosynthesis Biotechnology, China) was
added to sections and incubated at 37°C for 60 and 15 min,
respectively, according to the manufacturer’s instructions for the
SP9000 immunohistochemical kit (Beijing Zhongshan Goldenbridge
Biotechnology). DAB (Fuzhou Maixin Biotechnology Development Co.,
Ltd., Fuzhou, China) was added to develop staining and slides were
observed under a microscope. Hematoxylin staining (Beijing
Zhongshan Goldenbridge Biotechnology) was performed and slides were
observed under a light microscope.
Positive cell count analysis
Each section was analyzed by two observers and
judged by a double-blind method. Twelve high-power fields were
randomly selected under microscope for immunohistochemical
staining. Sections were scored according to the following criteria:
i) no color in cytoplasm, 0; ii) cytoplasm presented light yellow
cloudiness, (+); iii) cytoplasm presented yellow granular state,
(++); iv) cytoplasm presented uniform deep yellow, (+++). (++) and
(+++) were considered positive cells and the percentage of positive
cells in each section was calculated.
Saos-2 cell culture and
immunohistochemitry
The Saos-2 osteosarcoma cell line was purchased from
the American Type Culture Collection (Manassas, VA, USA). Cells
were cultured in low-glucose DMEM (Hyclone, Logan, UT, USA)
containing 10% fetal bovine serum (FBS; Hangzhou Sijiqing
Biological Engineering Materials Co., Ltd., Hangzhou, China) and
incubated in a 37°C, 5% CO2 incubator. Cells were
digested with trypsin and passaged every 3 days.
Saos-2 cells in logarithmic growth phase were
inoculated to prepare cell-attached coverslips and slides were
prepared as described for osteosarcoma tissue samples.
CD133 flow cytometry and isolation
Saos-2 cells in logarithmic growth phase were
digested with trypsin (Sino-American Biotechnology, Guangzhou,
China), centrifuged, collected and washed twice with PBS. Samples
were then centrifuged and the supernatant was removed. Pellets were
resuspended in 5 ml PBE buffer from a magnetic bead kit (Miltenyi
Biotec Ltd., Surrey, UK), filtered using a 100 mesh screen to
obtain a single cell suspension and then centrifuged at 1,000 rpm
for 5 min. The supernatant was removed and 100 μl antibody-coated
magnetic beads/l×107 cells was added and incubated for
15 min at room temperature under dark conditions, followed by 2
washes in combining buffer. Cells were resuspended in 500 μl
combining buffer and separated on a magnetic separation column
(Miltenyi Biotec Ltd.). Fractions were collected from the column
and dead cells in the original cell suspension were filtered by the
column and removed.
Cells were collected, washed twice with PBS at 4°C
and the cell concentration was adjusted to 1×10⁶/ml.
Cell suspension (100 μl) was put into 5 ml flow tubes and then 20
μl CD133-PE monoclonal fluorescent antibody was added and incubated
for 30 min at 4°C under dark conditions. Tubes were washed twice
with 5 ml PBS, centrifuged, the supernatant was removed and the
precipitate was resuspended in 0.5 ml PBS. Samples were analyzed
using a FACSCalibur flow cytometer (BD Biosciences, San Jose, CA,
USA). CD133-PE flow fluorescence detection antibody was purchased
from Miltenyi Biotec Ltd.
Population magnetic bead separation of
the Saos-2 cell line
Cell suspension was collected as described and
centrifuged for 5 min at 1,000 rpm. The supernatant was removed,
100 μl CD133 monoclonal antibody was added to directly label the
magnetic beads and 400 μl PBE was added, mixed and incubated for 30
min at 4°C under dark conditions. Uncombined magnetic beads were
removed by two PBS washes and the pellet was resuspended in 500 μl
PBE and separated on a magnetic separation column (Miltenyi Biotec
Ltd.). Column flow-through contained CD133 cells. Cells retained by
the column were washed with PBE and collected, these cells were
CD133+ cells. CD133+ subpopulation cells were
labeled using CD133-PE fluorescent antibody and purity was
determined by flow cytometry.
CD133+/− cluster cell cycle
analysis
Saos-2 cells in logarithmic growth phase were
selected and separated into CD133+ and CD133−
subpopulation cells by the method described, fixed with 70%
ice-cold ethanol for 24 h and treated with Triton X-100
(Sigma-Aldrich, St. Louis, MO, USA). Following PBS washing and
centrifugation, 1 mg/ml RNase A (AppliChem Inc., St. Louis, MO,
USA) was added to the cells and incubated for 15 min. Then, 50
μg/ml PI (Shanghai Jingmei Biotech, Shanghai, China) was added and
cells were stained for 15 min. Cells were collected and analyzed
using the FACSCalibur flow cytometer and Modfit software (Bio-Rad,
Hercules, CA, USA) was used to analyze cell cycle stage.
Real-time polymerase chain reaction
(PCR)
TRIzol (1 ml) was added to the collected cell
suspension (5–10×106 cells). Following homogenization,
samples were incubated for 5 min at 15–30°C to completely separate
nucleic acid-protein complexes. CHCl3 (0.2 ml; Shanghai
Chemical Reagent, Shanghai, China) was added and the tubes were
agitated by hand for 15 sec. Tubes were incubated for 2–3 min at
15–30°C and then centrifuged at 12,000 × g for 15 min at 4°C.
Following centrifugation, the mixed solution was separated into 3
phases in which RNA was in the clear water phase. The water phase
was transferred into a new centrifuge tube and mixed with 0.5 ml
isopropanol (Shanghai Chemical Reagent) to completely precipitate
RNA. The amount of added isopropanol was determined as follows: if
1 ml TRIzol was added to each sample to develop the homogenate,
then the amount of isopropanol was 0.5 ml. The samples were
incubated for 10 min at 15–30°C and then centrifuged at 12,000 × g
for 10 min at 4°C. Before centrifugation, the invisible RNA
precipitate formed gelatinous precipitate at the bottom and side
wall of tube. The supernatant was removed and the precipitate was
washed in 1 ml 75% ethanol (prepared with DEPC-treated water),
agitated and centrifuged at 7,500 × g for 5 min at 4°C. Ethanol was
removed and the RNA precipitate was dried for 5–10 min in air. The
RNA precipitate was not dried completely, to avoid reducing the
solubility. The A260/280 ratio of partly dissolved RNA
samples was <1.6. RNA was dissolved in RNase-free water,
incubated for 10 min at 55–60°C and preserved at −70°C. For
extraction of low concentrations of RNA, 5–10 μg RNase-free
glycogen (<4 mg/ml; Invitrogen Life Technolgies, USA) was added
as water phase vector prior to the addition of isopropanol. To
decrease the solution viscosity, the samples were passed through a
26-gauge syringe needle twice to slice genomic DNA prior to the
addition of CHCl3. After separating the two phases,
glycogen remained in the water phase and coprecipitated with
RNA.
Real-time (RT) reaction solution (10 μl) was added
to 10 μl annealing mixture, incubated for 60 min in a 37°C water
bath, heated to 95°C for 5 min and then placed in an ice bath. cDNA
templates confirmed to express target and house-keeping genes were
selected. PCR conditions were as follows: 95°C for 3 min, 40 PCR
cycles (94°C for 20 sec, 59°C for 20 sec and 72°C for 30 sec) and
72°C for 5 min. Products were run on a 2% agarose gel with a 100-bp
DNA ladder and visualized with ethidium bromide to determine
whether the correct gene was amplified. The PCR product (set as 1)
was diluted to a series of concentrations. DNA templates of these
gradient concentrations and all cDNA samples were respectively
applied to prepare the real-time PCR system. Primer sequences and
reaction conditions are presented in Table I.
 | Table IPrimer sequences for real-time
PCR. |
Table I
Primer sequences for real-time
PCR.
| Gene | Primer
sequence | Product length
(bp) |
|---|
| GAPDH | F:
5′AAGAAGGTGGTGAAGCAGGC3′
R: 5′TCCACCACCCTGTTGCTGTA3′ | 203 |
| MDR1 | F:
5′CGGTTTGGAGCCTACTTGGT3′
R: 5′GGTCGGGTGGGATAGTTGAATA3′ | 272 |
| Sox2 | F:
5′ATCACCCACAGCAAATGACA3′
R: 5′CAAAGCTCCTACCGTACCACTA3′ | 245 |
The real-time PCR conditions were as follows: GAPDH,
95°C for 5 min, 45 PCR cycles (95°C for 10 sec, 59°C for 15 sec,
72°C for 20 sec and 83.8°C for 5 sec); multidrug resistance protein
1 (MDR1), 95°C for 5 min, 40 PCR cycles (95°C for 10 sec, 59°C for
15 sec, 72°C for 20 sec and 81°C for 5 sec); Oct4, 95°C for 5 min,
45 PCR cycles (95°C for 10 sec, 59°C for 15 sec, 72°C for 20 sec
and 84°C for 5 sec); Sox2, 95°C for 5 min, 40 PCR cycles (95°C for
10 sec, 59°C for 15 sec, 72°C for 20 sec, 81°C for 5 sec); and
Nanog, 95°C for 5 min, 40 PCR cycles (95°C for 10 sec, 59°C for 15
sec, 72°C for 20 sec, 81°C for 5 sec). In order to establish the
melting curve of the PCR products, the products were heated slowly
from 72 to 99°C (temperature increased by 1°C every 5 sec) after
the amplification reaction. Target and house-keeping genes of each
sample were analyzed by real-time PCR to calculate gene
concentrations by standard curve. The corrected relative content of
the gene in the sample was calculated by dividing the house-keeping
gene concentration by the target gene concentration in the
sample.
CD133+ cell colony-forming
efficiency detection
Separated CD133+/− subpopulation cells
were suspended in DMEM containing 20% FBS. The cell suspension was
diluted and the cells were inoculated into culture dishes
(diameter, 60 mm) containing 10 ml prewarmed medium (37°C) at
densities of 50, 100 and 200 cells/dish and cultured for 3 weeks at
37°C, 5% CO2 in a saturated humidity incubator.
Following incubation, the cells were observed and counted to
calculate the colony-forming efficiency using the following
formula: Colony-forming efficiency (%) = no. of clones/no. of
inoculated cells.
Cell cycle analysis following
proliferation and differentiation of CD133+ cells
CD133+ subpopulation cells were
inoculated into two culture flasks in DMEM containing 20% FBS and
cultured at 37°C, 5% CO2 in a saturated humidity
incubator. On day 3 and 7, the proportion of CD133+
cells in the CD133 cell population was determined by flow
cytometry. On day 7, the cells were collected to determine the cell
cycle phase, with Saos-2 cells used as a control. All experiments
were repeated three times.
Statistical analysis
All tests were repeated three times. Statistical
analysis was carried out using the Student’s t-test with SPSS
software. P<0.05 was considered statistically significant.
Results
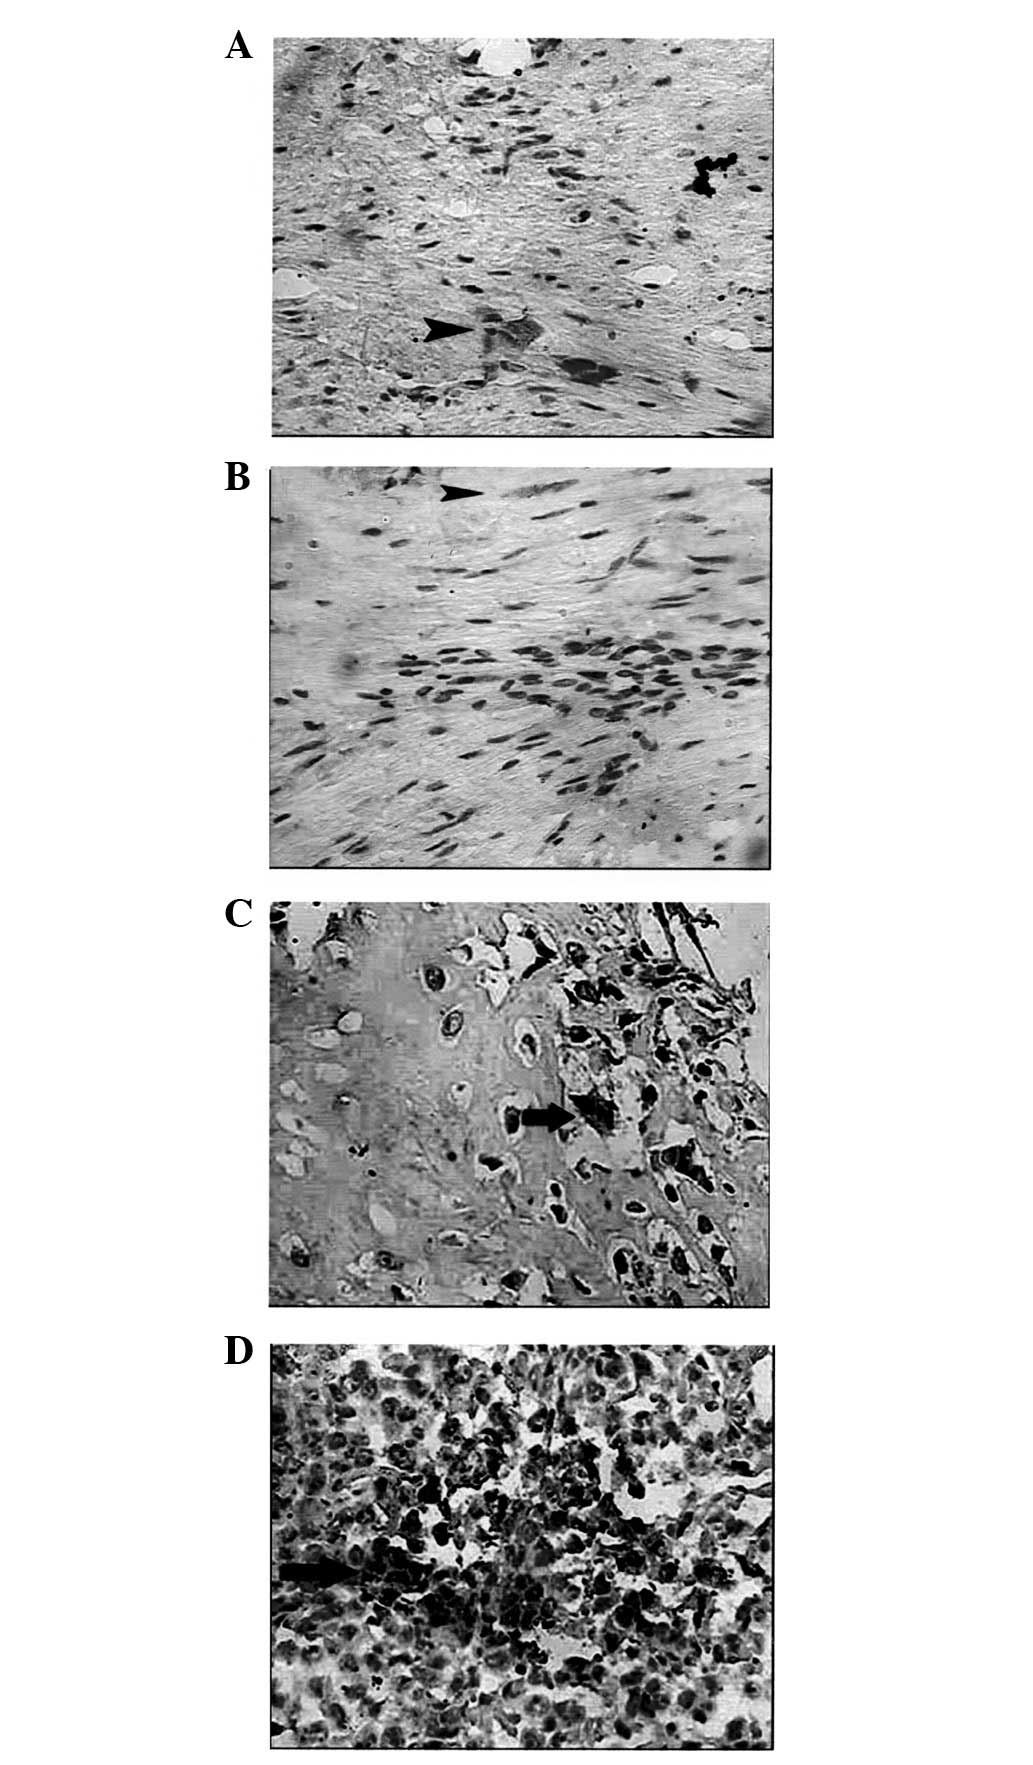
CD133 expression in osteosarcoma
In the present study, CD133+ cells were
identified in various types of osteosarcoma (Fig. 1). Cell count analysis indicated
that the CD133+ ratio in parosteal, fibroblastic,
chondroblastic and osteoblastic osteosarcoma was 5.63±1.96,
6.54±1.65, 8.54±1.25 and 13.84±3.81, respectively. Q-analysis
identified no significant difference between CD133+
ratios in parosteal, fibroblastic and chondroblastic
osteocarcinomas (P>0.05). However, the ratio obtained in
osteoblastic osteosarcomas was found to be significantly different
compared with the other osteosarcoma groups (P<0.01; Tables II and III).
| Table IIPercentage of CD133+ in
the total cell population in various human osteosarcoma tissue
specimens (mean ± SD). |
Table II
Percentage of CD133+ in
the total cell population in various human osteosarcoma tissue
specimens (mean ± SD).
| Group | n | %
CD133+ |
|---|
| 1 | 4 | 5.63±1.96 |
| 2 | 13 | 6.54±1.65 |
| 3 | 12 | 8.54±1.25 |
| 4 | 26 | 13.84±3.81 |
| Table IIIQ-test comparison between
osteosarcoma groups. |
Table III
Q-test comparison between
osteosarcoma groups.
| Group | Q-value | P-value |
|---|
| 1 vs. 2 | 0.7858 | >0.05 |
| 1 vs. 3 | 2.4756 | >0.05 |
| 2 vs. 3 | 2.4481 | >0.05 |
| 1 vs. 4 | 7.5055 | <0.01a |
| 2 vs. 4 | 10.5446 | <0.01a |
| 3 vs. 4 | 7.4552 | <0.01a |
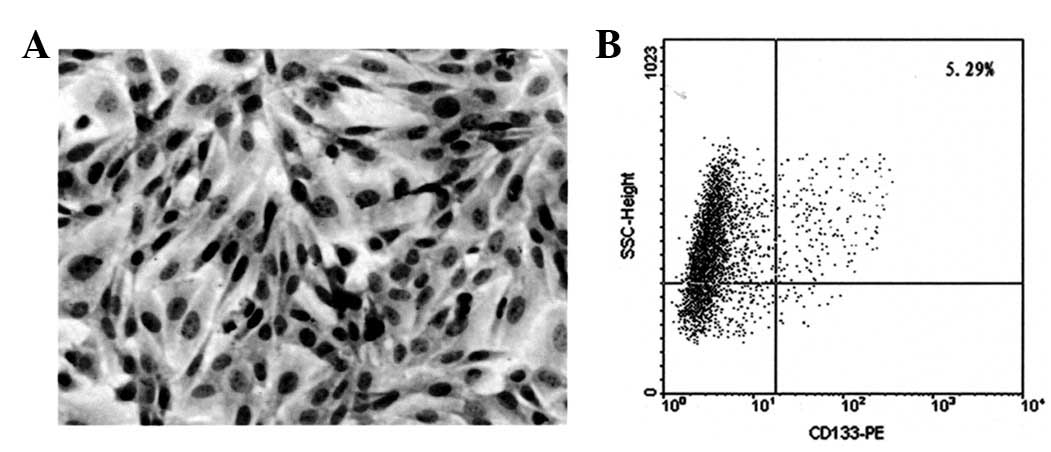
CD133 expression in Saos-2 cell
lines
The results of the immunostaining performed in the
Saos-2 cell line are presented in Fig.
2A. Analysis by flow cytometry revealed that a mean of
5.73±0.93% of cells were CD133+ (Fig. 2B).
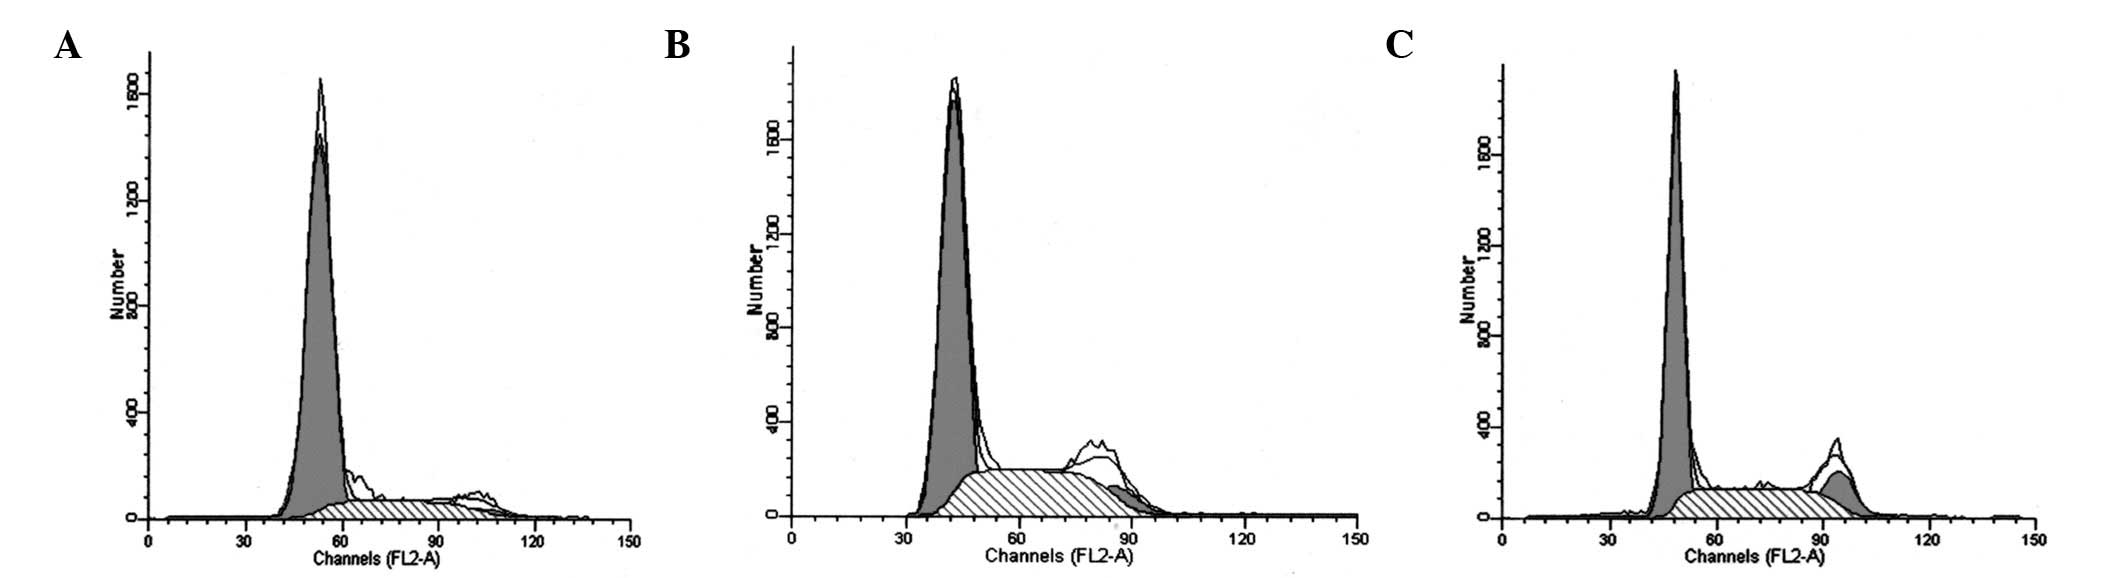
Cell cycle analysis of CD133+
cells
Compared with Saos-2 cells, CD133+
subgroup cells were identified in the G0/G1
stages of the cell cycle and exhibited a lower G2 peak
(Fig. 3). The percentage of Saos-2
cells in G0/G1, G2/M and S stages
was 48.86±1.09, 16.99±1.34 and 34.15±2.31, respectively, while
CD133+ subgroup cells were identified as significantly
different at 79.09±1.61, 3.66±0.32 and 17.25±1.29, respectively
(P<0.01; Table IV). The number
of CD133+ subpopulation cells was increased in
G0/G1 and decreased in G2/M and S
stages compared with Saos-2 cells, indicating that
CD133+ subgroup cells were quiescent, while Saos-2 cells
were proliferating.
| Table IVCell cycle analysis of Saos-2 and
CD133+ Saos-2 cells (mean ± SD). |
Table IV
Cell cycle analysis of Saos-2 and
CD133+ Saos-2 cells (mean ± SD).
| Group |
G0/G1 (%) | G2/M
(%) | S (%) |
|---|
| Saos-2 | 48.86±1.09 | 16.99±1.34 | 34.15±2.31 |
|
CD133+ | 79.09±1.61 | 3.66±0.32 | 17.25±1.29 |
| P-value | 0.001132157a | 0.001801684a | 0.005575029a |
After 10 days of culture in complete medium,
CD133+ subpopulation cell proliferation and cell cycle
analyses indicated that cell percentages at
G0/G1, G2/M and S stages were
50.24±1.35, 16.09±3.78 and 33.67±4.81, respectively, and were
observed to be significantly different compared with the
percentages on day 0 (P<0.05). No significant difference in the
mean cell percentages at G0/G1, G2/M and S stages compared with
Saos-2 cells was noted (P>0.05; Table V). Following complete
CD133+ subgroup cell culture, the percentages of cells
in the G2/M and S stage increased significantly and the
cell cycle shifted from proliferative to the quiescent
G0/G1 stage (P<0.05). These results indicate the
differentiation abilities of CD133+.
| Table VCell cycle comparative study prior to
and following CD133+ Saos-2 cell culture in complete
medium (mean ± SD). |
Table V
Cell cycle comparative study prior to
and following CD133+ Saos-2 cell culture in complete
medium (mean ± SD).
| Group |
G0/G1 (%) | G2/M
(%) | S (%) |
|---|
| Day | 0
79.09±1.61a |
3.66±0.32a |
17.25±1.29a |
| Day | 10
50.24±1.35a,b |
16.09±3.78a,b |
33.67±4.81a,b |
| Saos-2 cells |
48.86±1.09b |
16.99±1.34b |
34.15±2.31b |
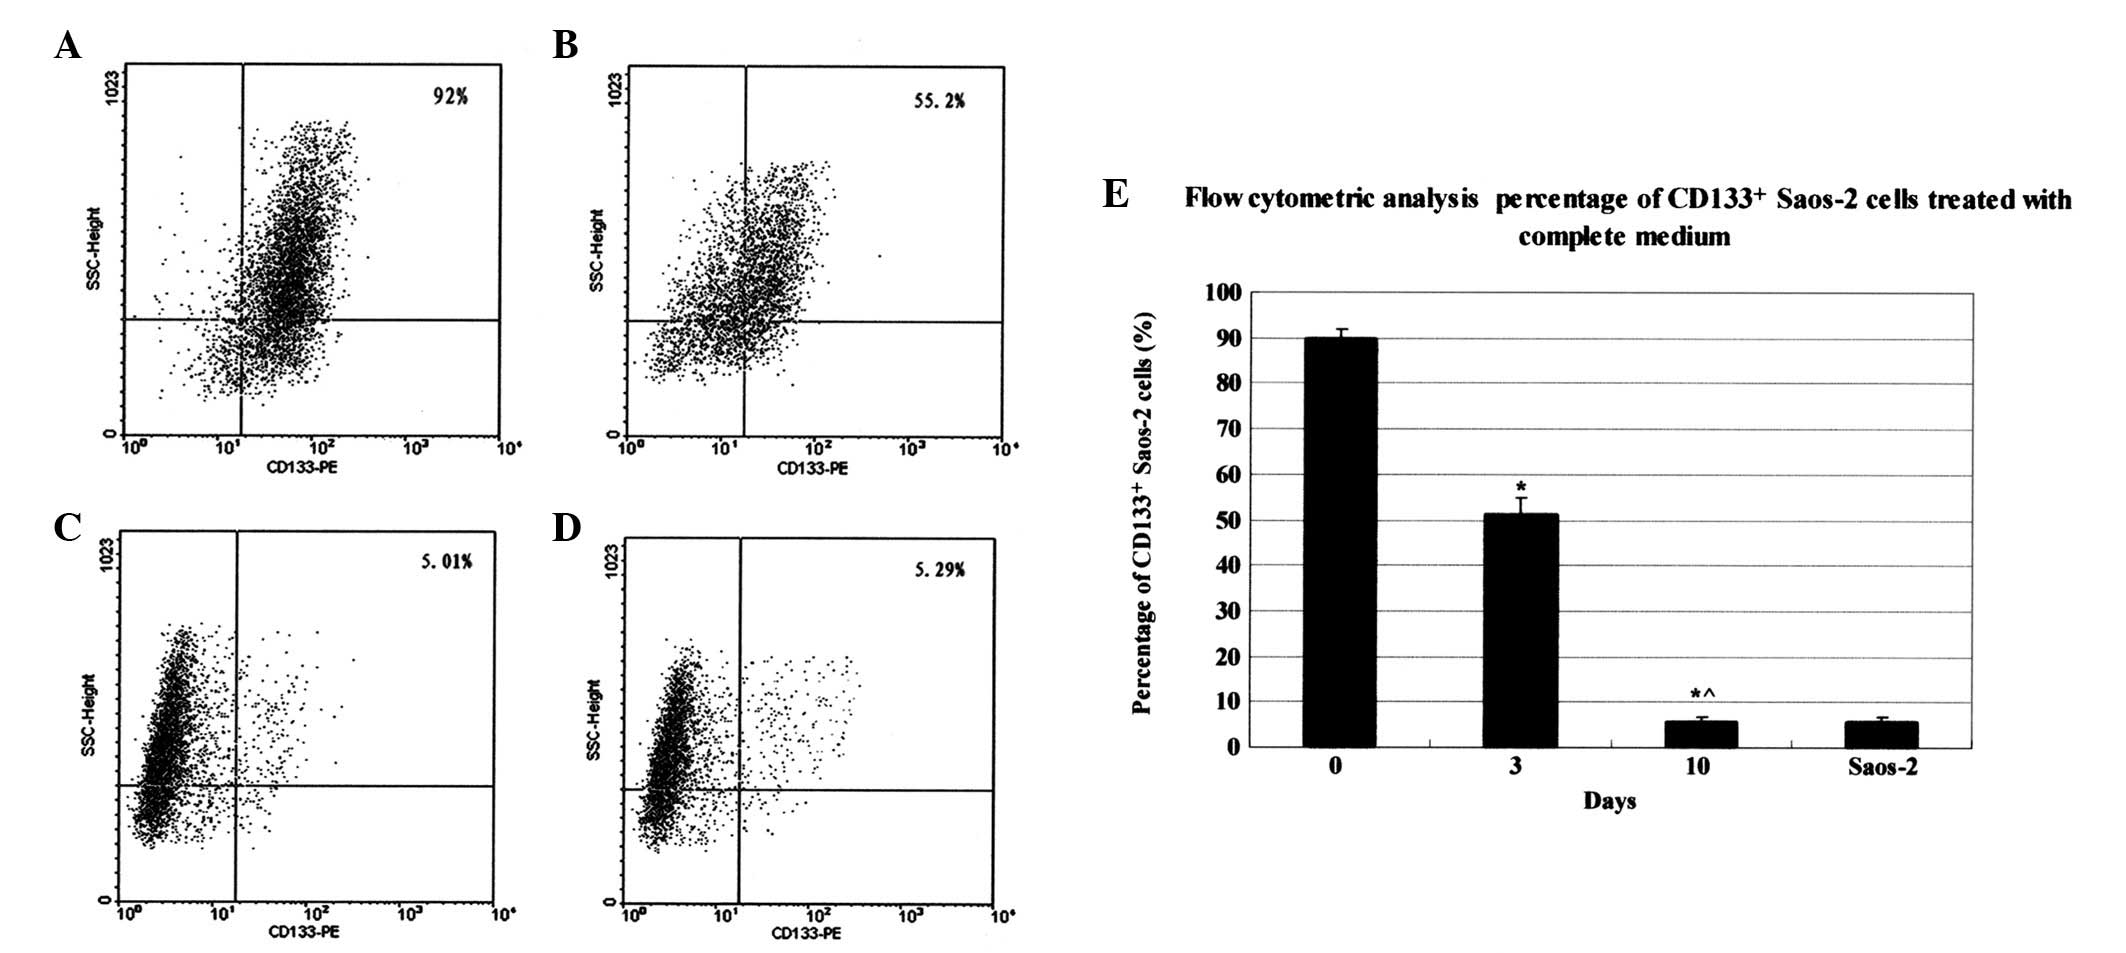
Cell proportion alterations following
CD133+ subgroup proliferation
Following isolation using magnetic beads, the
percentage of CD133+ subgroup cells at day 0, 3 and 10
following cell culture was detected using flow cytometry as
90.02±1.75, 51.31±3.47 and 5.57±1.01, respectively. Statistical
analysis indicated that the CD133+ cell percentage
decreased significantly at days 3 and 10 compared with day 0 (90 to
5%), similar to that observed in the Saos-2 cells (Fig. 4). Results indicate the potential
differentiation ability of VD133+ cells in complete
culture medium.
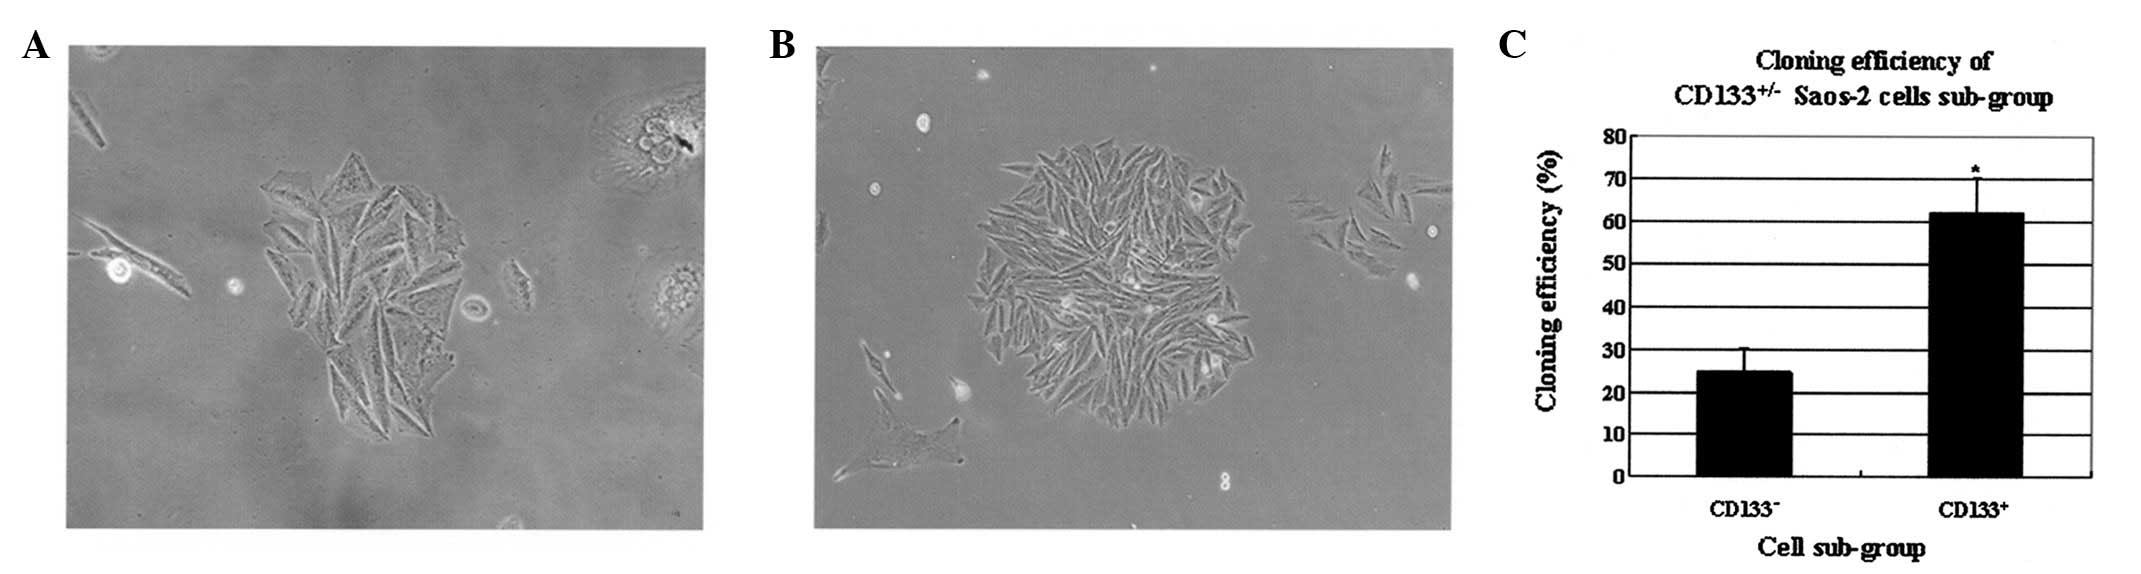
Colony forming efficiency in
CD133+/− subgroups
CD133+ cell colonies were larger compared
with CD133− cells following 5-week culture. The mean
efficiencies of CD133+ and CD133− subgroups,
calculated from three repetitions, were 61.84±8.39 and 24.77±5.53,
respectively, and were significantly different (P<0.05; Fig. 5).
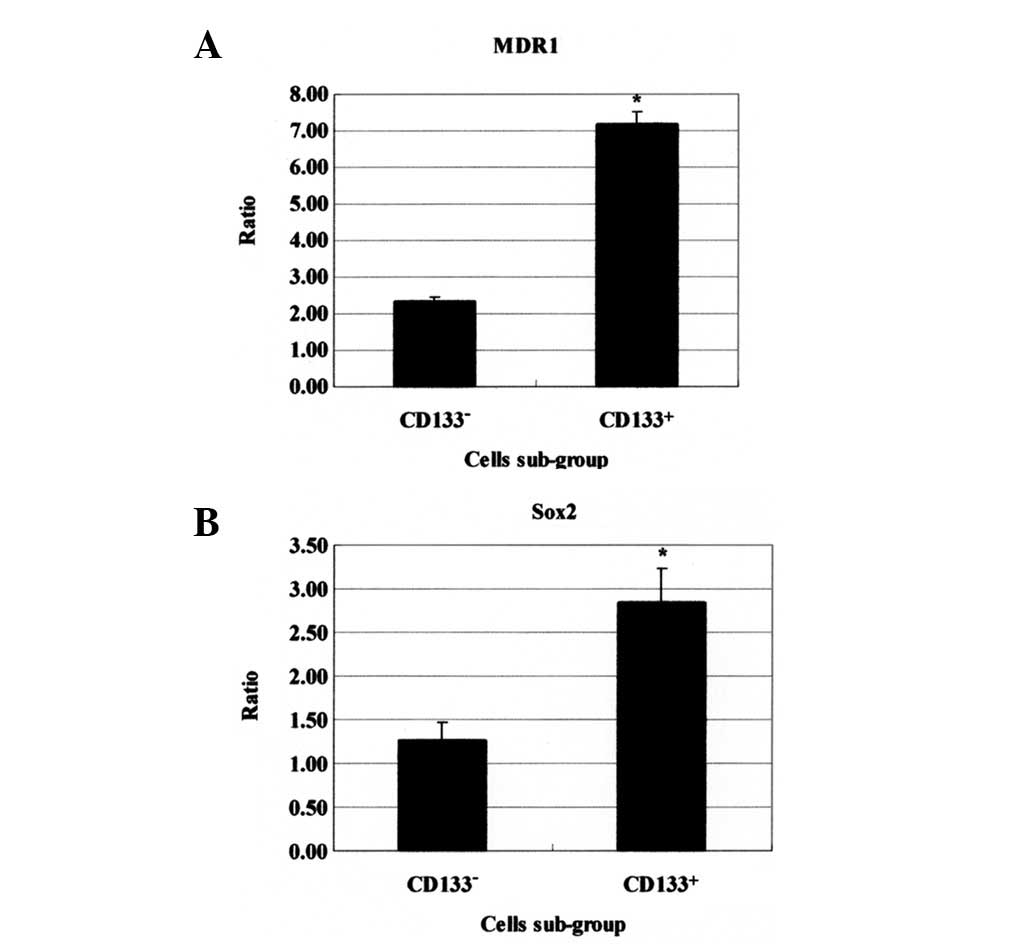
Real-time PCR analysis of MDR1 and Sox2
gene expression
In CD133+ Saos-2 cells, Sox2 and MDR1
gene expression was identified to be significantly increased
compared with CD133− cells (P<0.05; Fig. 6).
Discussion
Cancer stem cells are defined as cancer cells with
the ability to self-renew and divide into new tumorigenic cancer
cells. Therefore, a single cancer stem cell has the ability to
facilitate tumor metastasis and generate new tumors following
transplantation. Current cancer stem cell hypotheses (1) classify tumors as a type of stem cell
disease, an abnormal tissue generated by the proliferation of
cancer stem cells with tumorigenic ability. The majority of tumor
cells in tumor tissues have no or limited proliferative abilities,
dying shortly following differentiation. However, a minority of
cancer stem cells proliferate indefinitely, self-renew and have
multiple differentiation potentials. Cancer stem cells may be
critical for the formation, growth, infiltration, metastasis and
recurrence of tumors (1,3). At present, a number of studies have
demonstrated successful separation and identification of cancer
stem cells in cancer tissues, including breast, lung, pancreatic,
liver, prostate and colon cancers, malignant melanoma,
retinoblastoma, brain tumors and head and neck squamous cell
carcinoma, using specific markers whose functions were correlated
with immunity on the surface of cells and associated techniques
(21,25–28).
Self-renewal and differentiation potential are two
key properties of cancer stem cells. Division during these
processes has been identified as dissymmetric, whereby one daughter
cells has the same undifferentiated state as the mother cell and
cell cycle is at G0 stage and the other develops
oriented differentiation, with a cell cycle at G2 and S
stages. The daughter cells exhibit differentiation characteristics
and associated markers. The majority of cancer stem cells are found
at the G0 stage (4,29,30).
The tumorigenicity of cancer stem cells varies
significantly between various types of tumor, which is principally
evaluated by two observations: i) the clonogenic ability of cancer
stem cells in vitro i.e., the number and size of cancer stem
cells clones derived from primary cancer tissues or tumor cell
lines formed in soft agar or matrigel; and ii) the tumorigenic
ability of cancer stem cells in immunodeficient animals by
inoculating the same number of separated cancer and non-cancer stem
cells into immunodeficient animals and analyzing tumor formation,
i.e., by counting the number of animals forming tumors and
comparing the size of the formed tumors. The strongest
tumorigenicity reported to date is brain cancer stem cells, whereby
NOD/SCID mice inoculated with 100 CD133+ cancer stem
cells developed tumors 6 months following inoculation. No tumors
formed in mice inoculated with 1×10⁵ CD133−
non-cancer stem cells (5).
Drug resistance is one of the key properties of
cancer stem cells and a number of studies have hypothesized that
cancer stem cells are the principal cause of failure of tumor
chemotherapy. Under normal conditions, the majority of
drug-resistant molecules, including P-glycoprotein, multidrug
resistance protein (MRP) 1, MRP2 and ATP-binding cassette
transporter G2 (ABCG2), are expressed at various levels in
epithelial cells of tissues of nutritional absorption (i.e., lung
and digestive tract) and metabolic and emunctory organs (i.e.,
liver and kidney). These transport molecules are important for
sustaining physiological barriers (blood-brain, blood-cerebrospinal
fluid, blood-testis and mother-infant barriers and the placenta).
ABC transporters are associated with regulation of absorption,
nutrition distribution, metabolism, secretion and exogenous toxic
substances (31,32). A previous study (30) in ABCG2 gene knockout mice noted
bone marrow and skeletal muscle SP cells were significantly
decreased and extremely low levels of
Lin−/c-Kit+/Sca-1+ SP cells were
observed in bone marrow. Transplantation results of remaining SP
cells revealed exhausted regeneration abilities and enhanced
sensitivity of Bcrp1−/− hematopoietic cells to the
anticancer drug mitoxantrone, indicating that ABCG2 expression is
essential for SP phenotype of normal bone marrow stem cells. The
majority of ABC transporter family membrane proteins are expressed
on the membrane of almost all cancer stem cells and transport and
excrete multiple substances, including metabolites, drugs, toxic
substances, endogenous lipids, polypeptides, nucleotides and
sterols (33), leading to a
considerable decrease in the efficacy of a number of
chemotherapies. Currently, studies on ABCG2 are important for
understanding drug resistance in cancer stem cells and may lead to
the development of new therapeutic strategies (9).
As CD133 is the most extensive marker in tumor
progenitor cells, expression of CD133 in osteosarcoma cell lines
was determined in the present study. CD133+ Saos-2 cells
were isolated using magnetic beads and the cell cycle,
differentiation potential, cloning efficiency and MDR1 and Sox2
gene expression were analyzed. Percentage of CD133+ in
the total cell population in parosteal, fibroblast and chondroblast
osteosarcomas was 5–8%, while in osteoblast osteosarcoma the
CD133+ subpopulation was ~13%, indicating that all types
of osteosarcoma comprise small numbers of CD133+ cells.
Q-analysis indicated that the percentage of CD133+ in
the osteoblast type was higher than the other types. In the current
study, percentage of CD133+ cells in the total cell
population in human osteosarcoma Saos-2 cells was 5%, 80% of which
were at G0/G1 phase, while only 48% of total
Saos-2 cells were in this phase and 50% were in G2/M and
S phases, indicating that Saos-2 cells were proliferating, however,
CD133+ Saos-2 cells were quiescent.
CD133+ cells were separated and analyzed
by flow cytometry. CD133+ cells accounted for
90.02±1.75% in the separated population and this percentage rapidly
declined to 51.31±3.47% and 5.57±1.01% following culture in
complete medium for 3 and 10 days, respectively. Cell cycle
analysis on day 10 found significant differences in cell
distribution within phases compared with day 0 following separation
and was similar to Saos-2 cells. These observations indicate that
following culture in complete medium, CD133+ cells
differentiated and began proliferating, entering G2/M
and S stages. Analysis of cell colony formation observed that the
colonies formed by the CD133+ subpopulation were larger
compared with CD133− and colony-forming efficiency, an
important marker of tumorigenicity, was markedly increased,
indicating that tumorigenicity of CD133+ cells was
higher than that of CD133− cells.
In the present study, CD133+ Saos-2 cells
were observed to make up a small percentage of the total Saos-2
cell population. In addition, CD133+ cells exhibited a
number of cancer stem cell characteristics, including quiescence
and a marked differentiation potential, as well as expression of
key stem cell regulatory and drug resistance genes, which may cause
osteocarcinoma and high drug resistance.
Acknowledgements
The present study was supported by a grant from the
National Natural Science Foundation of China (no. 30973018).
References
|
1
|
Reya T, Morrison SJ, Clarke MF and
Weissman IL: Stem cells, cancer and cancer stem cells. Nature.
414:105–111. 2001. View
Article : Google Scholar : PubMed/NCBI
|
|
2
|
Huntly BJ and Gilliland DG: Leukaemia stem
cells and the evolution of cancer-stem-cell research. Nat Rev
Cancer. 5:311–321. 2005. View
Article : Google Scholar : PubMed/NCBI
|
|
3
|
Marx J: Cancer research. Mutant stem cells
may seed cancer. Science. 301:1308–1310. 2003. View Article : Google Scholar : PubMed/NCBI
|
|
4
|
Al-Hajj M, Wicha MS, Benito-Hernandez A,
et al: Prospective identification of tumorigenic breast cancer
cells. Proc Natl Acad Sci USA. 100:3983–3988. 2003. View Article : Google Scholar : PubMed/NCBI
|
|
5
|
Singh SK, Hawkins C, Clarke ID, et al:
Identification of human brain tumour initiating cells. Nature.
432:396–401. 2004. View Article : Google Scholar : PubMed/NCBI
|
|
6
|
Goodell MA, Brose K, Paradis G, et al:
Isolation and functional properties of murine hematopoietic stem
cells that are replicating in vivo. J Exp Med. 183:1797–1806. 1996.
View Article : Google Scholar : PubMed/NCBI
|
|
7
|
Meyers PA, Schwartz CL, Krailo M, et al:
Osteosarcoma: a randomized, prospective trial of the addition of
ifosfamide and/or muramyl tripeptide to cisplatin, doxorubicin and
high-dose methotrexate. J Clin Oncol. 23:2004–2011. 2005.
View Article : Google Scholar : PubMed/NCBI
|
|
8
|
Budak-Alpdogan T, Banerjee D and Bertino
JR: Hematopoietic stem cell gene therapy with drug resistance
genes: an update. Cancer Gene Ther. 12:849–863. 2005. View Article : Google Scholar : PubMed/NCBI
|
|
9
|
Dean M, Fojo T and Bates S: Tumour stem
cells and drug resistance. Nat Rev Cancer. 5:275–284. 2005.
View Article : Google Scholar
|
|
10
|
Donnenberg VS and Donnenberg AD: Multiple
drug resistance in cancer revisited: the cancer stem cell
hypothesis. J Clin Pharmacol. 45:872–877. 2005. View Article : Google Scholar : PubMed/NCBI
|
|
11
|
Gerson SL: Drug resistance gene transfer:
Stem cell protection and therapeutic efficacy. Exp Hematol.
28:1315–1324. 2000. View Article : Google Scholar : PubMed/NCBI
|
|
12
|
Richardson C and Bank A: Preselection of
transduced murine hematopoietic stem cell populations leads to
increased long-term stability and expression of the human multiple
drug resistance gene. Blood. 86:2579–2589. 1995.PubMed/NCBI
|
|
13
|
Gibbs CP, Kukekov VG, Reith JD, et al:
Stem-like cells in bone sarcomas: implications for tumorigenesis.
Neoplasia. 7:967–976. 2005. View Article : Google Scholar : PubMed/NCBI
|
|
14
|
Yin AH, Miraglia S, Zanjani ED, et al:
AC133, a novel marker for human hematopoietic stem and progenitor
cells. Blood. 90:5002–5012. 1997.PubMed/NCBI
|
|
15
|
Lee A, Kessler JD, Read TA, et al:
Isolation of neural stem cells from the postnatal cerebellum. Nat
Neurosci. 8:723–729. 2005. View
Article : Google Scholar : PubMed/NCBI
|
|
16
|
Sagrinati C, Netti GS, Mazzinghi B, et al:
Isolation and characterization of multipotent progenitor cells from
the Bowman’s capsule of adult human kidneys. J Am Soc Nephrol.
17:2443–2456. 2006.PubMed/NCBI
|
|
17
|
Richardson GD, Robson CN, Lang SH, et al:
CD133, a novel marker for human prostatic epithelial stem cells. J
Cell Sci. 117:3539–3545. 2004. View Article : Google Scholar : PubMed/NCBI
|
|
18
|
Kordes C, Sawitza I, Müller-Marbach A, et
al: CD133+ hepatic stellate cells are progenitor cells.
Biochem Biophys Res Commun. 352:410–417. 2007.
|
|
19
|
Sugiyama T, Rodriguez RT, McLean GW and
Kim SK: Conserved markers of fetal pancreatic epithelium permit
prospective isolation of islet progenitor cells by FACS. Proc Natl
Acad Sci USA. 104:175–180. 2007. View Article : Google Scholar : PubMed/NCBI
|
|
20
|
Ito Y, Hamazaki TS, Ohnuma K, et al:
Isolation of murine hair-inducing cells using the cell surface
marker prominin-1/CD133. J Invest Dermatol. 127:1052–1060. 2007.
View Article : Google Scholar : PubMed/NCBI
|
|
21
|
Collins AT, Berry PA, Hyde C, et al:
Prospective identification of tumorigenic prostate cancer stem
cells. Cancer Res. 65:10946–10951. 2005. View Article : Google Scholar : PubMed/NCBI
|
|
22
|
Yin S, Li J, Hu C, et al: CD133 positive
hepatocellular carcinoma cells possess high capacity for
tumorigenicity. Int J Cancer. 120:1444–1450. 2007. View Article : Google Scholar : PubMed/NCBI
|
|
23
|
Hermann PC, Huber SL, Herrler T, et al:
Distinct populations of cancer stem cells determine tumor growth
and metastatic activity in human pancreatic cancer. Cell Stem Cell.
1:313–323. 2007. View Article : Google Scholar : PubMed/NCBI
|
|
24
|
Eramo A, Lotti F, Sette G, et al:
Identification and expansion of the tumorigenic lung cancer stem
cell population. Cell Death Differ. 15:504–514. 2008. View Article : Google Scholar : PubMed/NCBI
|
|
25
|
Kim CF, Jackson EL, Woolfenden AE, et al:
Identification of bronchioalveolar stem cells in normal lung and
lung cancer. Cell. 121:823–835. 2005. View Article : Google Scholar : PubMed/NCBI
|
|
26
|
Fang D, Nguyen TK, Leishear K, et al: A
tumorigenic subpopulation with stem cell properties in melanomas.
Cancer Res. 65:9328–9337. 2005. View Article : Google Scholar : PubMed/NCBI
|
|
27
|
Ricci-Vitiani L, Lombardi DG, Pilozzi E,
et al: Identification and expansion of human colon cancer
initiating cells. Nature. 445:111–115. 2007. View Article : Google Scholar : PubMed/NCBI
|
|
28
|
Prince ME, Sivanandan R, Kaczorowski A, et
al: Identification of a subpopulation of cells with cancer stem
cell properties in head and neck squamous cell carcinoma. Proc Natl
Acad Sci USA. 104:973–978. 2007. View Article : Google Scholar : PubMed/NCBI
|
|
29
|
Chambers I and Smith A: Self-renewal of
teratocarcinoma and embryonic stem cells. Oncogene. 23:7150–7160.
2004. View Article : Google Scholar : PubMed/NCBI
|
|
30
|
Pan CX, Zhu W and Cheng L: Implications of
cancer stem cells in the treatment of cancer. Future Oncol.
2:723–731. 2006. View Article : Google Scholar : PubMed/NCBI
|
|
31
|
Leslie EM, Deeley RG and Cole SP:
Multidrug resistance proteins: role of P-glycoprotein, MRP1, MRP2
and BCRP (ABCG2) in tissue defense. Toxicol Appl Pharmacol.
204:216–237. 2005. View Article : Google Scholar : PubMed/NCBI
|
|
32
|
Dietrich CG, Geier A and Oude Elferink RP:
ABC of oral bioavailability: transporters as gatekeepers in the
gut. Gut. 52:1788–1795. 2003. View Article : Google Scholar : PubMed/NCBI
|
|
33
|
Staud F and Pavek P: Breast cancer
resistance protein (BCRP/ABCG2). Int J Biochem Cell Biol.
37:720–725. 2005. View Article : Google Scholar : PubMed/NCBI
|