Introduction
Gene expression analysis (GEA) is well-suited for
identifying genetic effects on complex disorders. Post-traumatic
stress disorder (PTSD) is a complex illness with highly variable
phenotypic and endophenotypic traits that arise from
gene-environment interactions (1).
The heterogeneous clinical symptoms parallel broad biological
dysfunction in the hypothalamic-pituitary axis (HPA) (2–10)
and autonomic (ANS) (4,11–13)
and central nervous system (CNS) functions (14–17).
Previous studies have provided evidence for a low level
pro-inflammatory state in PTSD (18–22).
The CNS areas involved are central regulators of the HPA axis and
the ANS, and this coordinated dysfunction in PTSD is compatible
with inflammatory disinhibition.
Differentially expressed genes identified in
previous GEA studies of PTSD (23–26),
consistent with case-control candidate gene association studies,
have a role in regulating the HPA axis, the ANS and CNS, and more
specifically in immune activation, inflammation, signal
transduction and apoptosis, similar to biological systems
implicated by non-gene biological studies of PTSD (27). The present study reports
preliminary data that shows the importance of quality control
methods in GEA studies and the possible differential expression of
genes regulating pathways between the HPA, ANS and inflammation in
PTSD.
Materials and methods
Study design and participants
Subjects for this case-control study were recruited
from military personnel aged 18–65 years in Albuquerque (NM, USA)
using flyers, word of mouth and snowball sampling. All the subjects
had significant combat exposure in Iraq or Afghanistan. Exclusions
included substance dependence (six months), psychosis, uncontrolled
medical illness, current medications for PTSD, opioid use,
benzodiazepine use equivalent to >10 mg diazepam, known exposure
to neurotoxic chemicals, pregnancy and suicide risk. Study
procedures were in accordance with the latest version of the
Declaration of Helsinki and were approved by the IRB at the Pacific
Institute for Research and Evaluation (PIRE; Calverton, MD,
USA).
Phone screening was conducted by a research
assistant (RA). Qualifying subjects were clinically assessed by the
RA and a co-investigator after providing written informed consent.
Thirty-two subjects were contacted. Eleven declined or were
excluded during screening, and two were excluded at clinical
assessment. Nineteen were enrolled and 17 completed the study.
Table I shows demographic, trauma
and clinical status by group (PTSD and no PTSD). Following the
recruitment of 12 subjects (6 PTSD, 6 no PTSD), five with no PTSD
symptoms were oversampled to include a broad range of phenotypes,
since five of the initial six controls had mild or moderate,
non-diagnostic level symptoms.
 | Table IDemographic and clinical
characteristics by post-traumatic stress disorder (PTSD) status
[mean (SD)]. |
Table I
Demographic and clinical
characteristics by post-traumatic stress disorder (PTSD) status
[mean (SD)].
| Characteristics | PTSD (n=6) | No PTSD (n=11) | F | P-value |
|---|
| Age (years) | 31 (4.9) | 33.4 (10.1) | 0.29 | 0.60 |
| Education
(years) | 13.7 (2.1) | 15.0 (1.1) | 3.1 | 0.10 |
| Household size
(n) | 2.8 (1.8) | 2.4 (1.2) | 0.41 | 0.52 |
| Incomea | 3.3 (1.5) | 3.4 (1.5) | 0.00 | 0.97 |
| Work (h/week) | 20.0 (21.9) | 36.2 (16.1) | 3.06 | 0.10 |
| CES | 23.0 (4.4) | 18.5 (6.4) | 2.37 | 0.14 |
| Anx | 2.2 (0.6) | 1.3 (.40) | 11.41 | <0.01 |
| Dep | 22.7 (5.0) | 7.7 (6.5) | 24.00 | <0.01 |
| PTSD | 75.3 (11.6) | 17.4 (15.2) | 65.67 | <0.01 |
Clinical assessments
A history form, an abridged version of the
Structured Clinical Interview for Diagnosis (28) and the Clinician-Administered PTSD
Scale (CAPS) (29) were used to
determine study qualification and PTSD symptoms and diagnosis.
The Combat Exposure Scale (30) assessed combat exposure severity.
The Beck Depression Inventory-II (BDI-II) (31) and the Hopkins Symptom Checklist-25
anxiety scale (HSCLA) (32)
assessed the symptoms and severity of depression and anxiety,
respectively. Both continuous and dichotomous scoring was utilized
for analyses.
Candidate gene selection
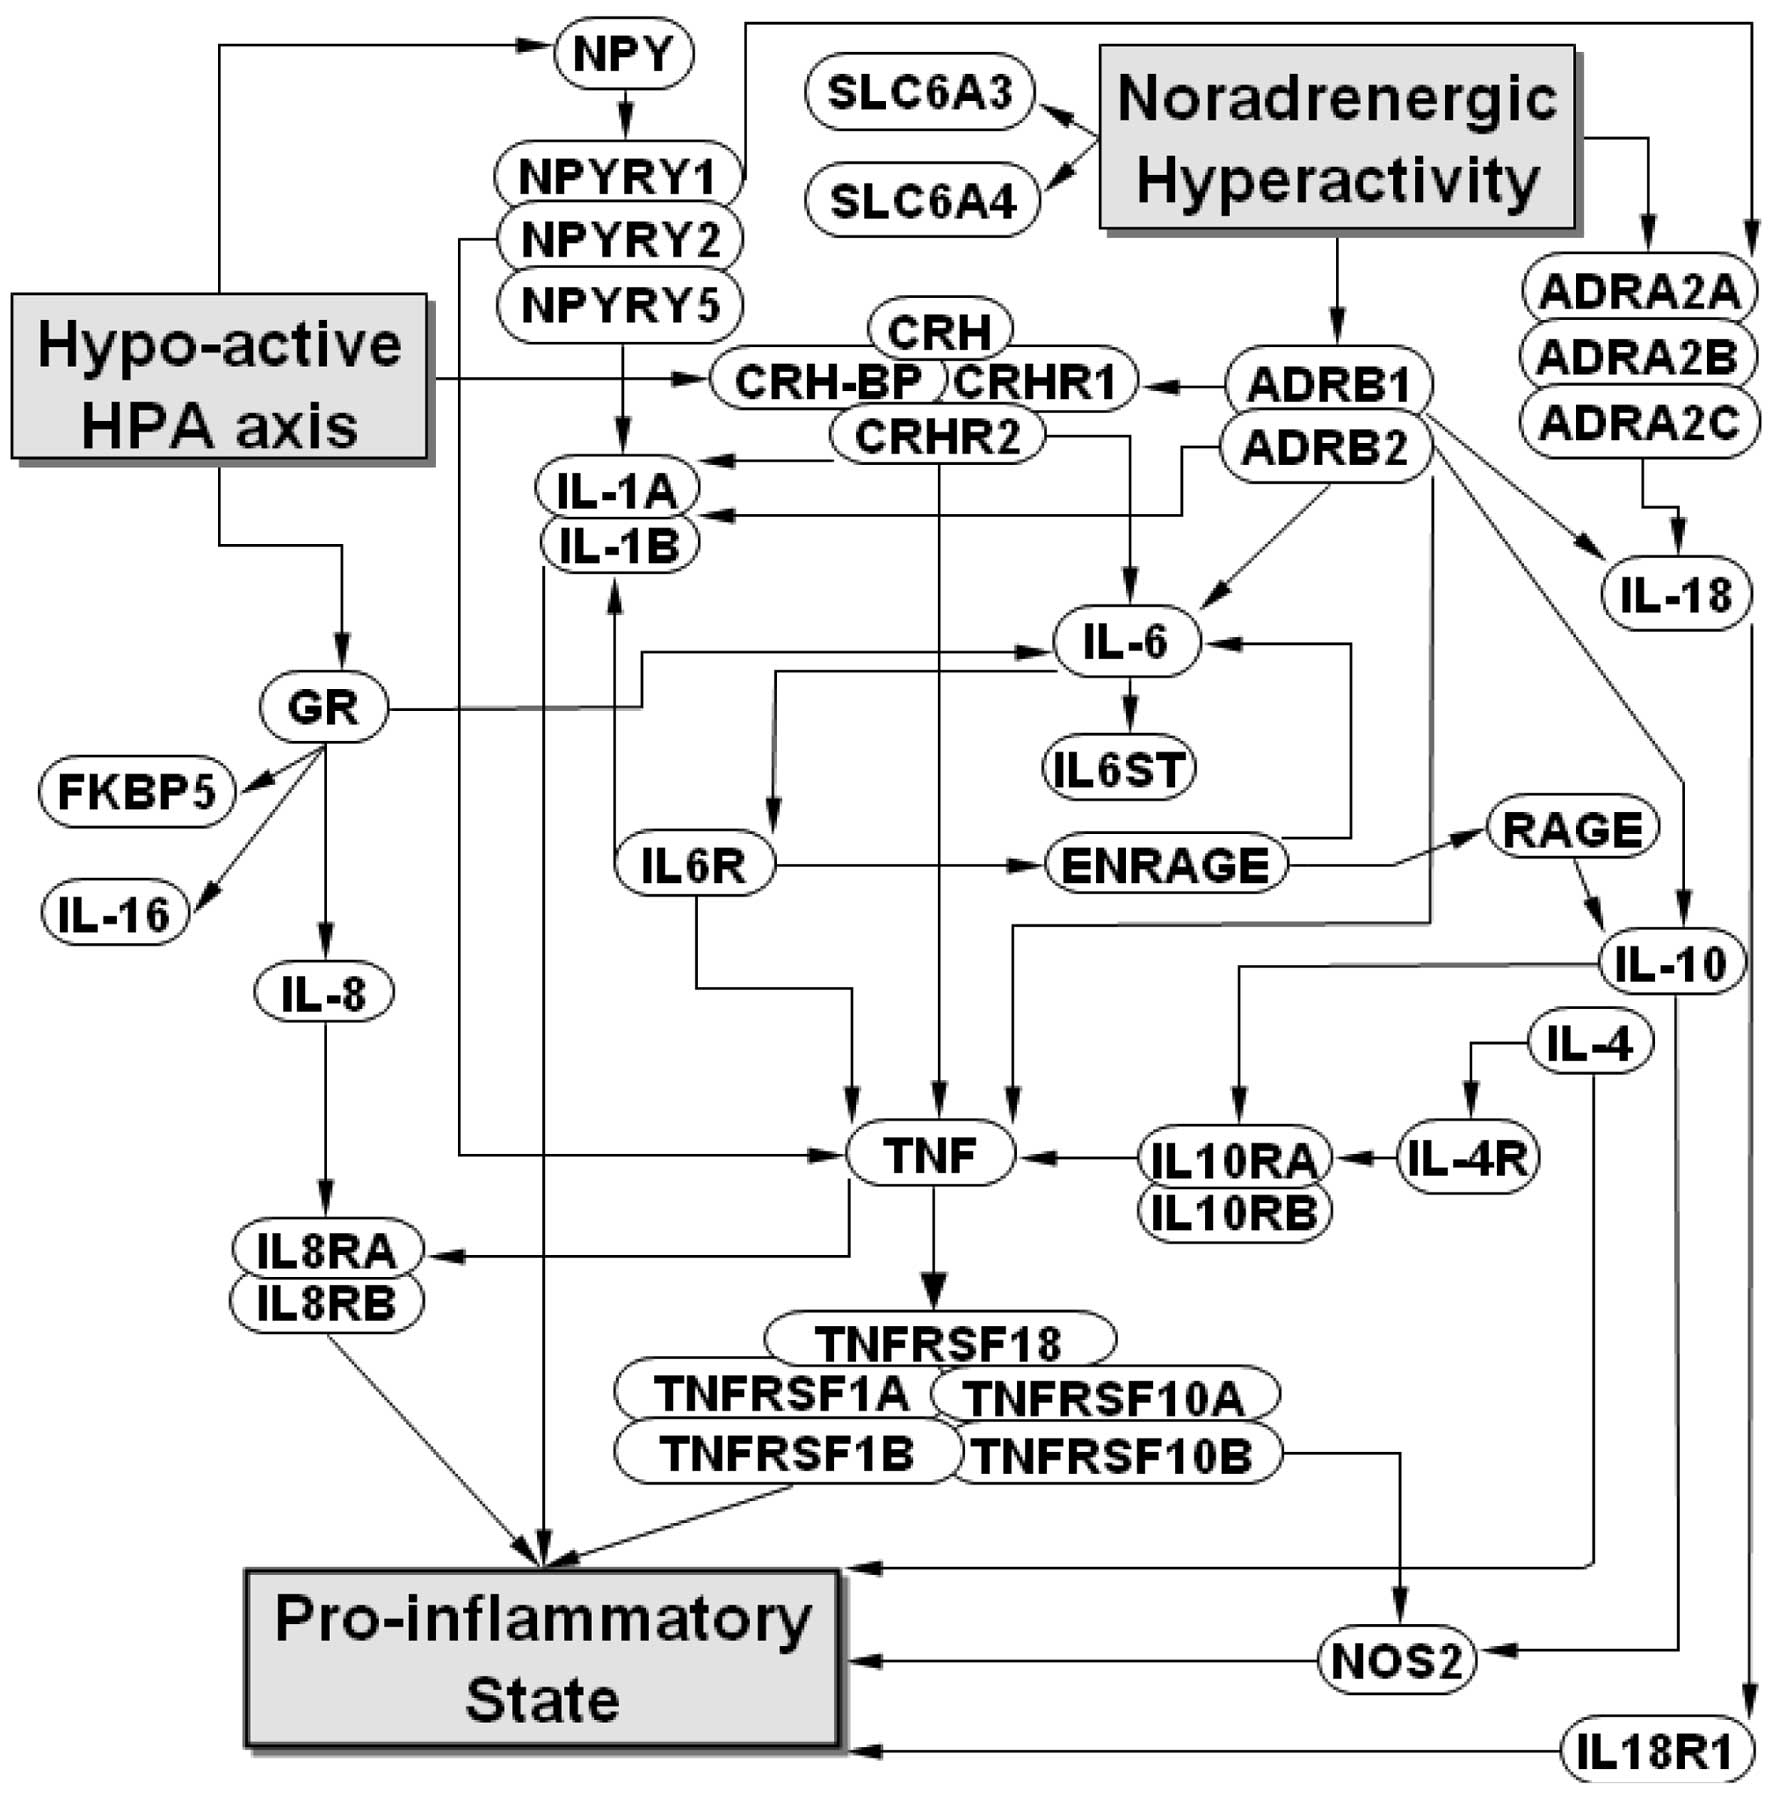
Genes of interest were selected due to extant data
with regard to the potential regulatory link between the HPA, ANS
and inflammatory systems in PTSD (Fig.
1). Inclusion on a 42-gene panel required that their products
are regulated under conditions pertinent to PTSD and activation of
systemic inflammation, or that they encode receptors or
transporters for these key regulators. Additionally, inclusion
required published evidence that the genes are expressed in
peripheral blood cells.
Laboratory protocol
Subjects were provided with written instructions and
a telephone review the day before the study with regard to the
protocol as follows: no food, smoking or caffeine use after
midnight, and arrival at the laboratory at 8:00 am to stay for up
to 1 h.
Fasting blood samples were processed using the
PAXgene RNA stabilization system (PreAnalytix, Doncaster, VIC,
Australia). Two blood samples were obtained for each subject, one
week apart. Blind to clinical status, messenger RNA (mRNA) was
converted into PCR templates (cDNA) using the RT2 First Strand kit
(SABiosciences, Frederick, MD, USA). SYBR Green-based qRT-PCR was
performed for each gene sequence in duplicate and for each sample
using the 96-well plate format of the RT2 Profiler PCR Array System
(SABiosciences). Thus, four gene expression values were obtained
for each gene of interest for each subject (duplicate PCR reactions
from two samples). Control reactions were included to test for
genomic DNA contamination and efficiency of the reverse
transcription of the PCR itself. The samples were processed using a
real-time qRT-PCR system (Applied Biosystems 7500; Life
Technologies, Carlsbad, CA, USA) and expression values were
calculated using the delta-delta Ct method (33) after the values were normalized
according to the β2 microglobulin housekeeping gene.
Data analysis
The first quality control applied to the data was to
set a maximum for the threshold cycle value (Ct) at 31 cycles,
based on values identified for control wells containing a genomic
DNA primer set that specifically detected non-transcribed genomic
DNA contamination. All four expression values for each gene of
interest for each subject were required to be under the maximum Ct
for the gene to be included in further analyses.
The second quality control was to assess the
replicability of Ct values for each gene. A threshold for variance
in values from duplicate PCR reactions was set at ≤2 cycles. When
the Ct values for the same gene on the same plate varied by >2
cycles, only the Ct value that was consistent with the average Ct
values from the replicate sample (within two cycles) was used and
the outlier value was considered to be a test error and eliminated
from further analysis.
The third quality control for the remaining genes
was to examine reliability for each gene. The between-person
variability had to be significantly larger than pooled
within-person variability (by an F-test from a one-way analysis of
variance; P<0.05) for a gene to be retained.
Genes passing all three quality controls were
analyzed for potential differential expression by phenotypes. The
expression value used for each gene for each subject was an average
of all the 4 samples. General linear models were applied to
dichotomous and continuous data. Since this pilot study was not
powered to detect small but significant between-group differences,
Cohen’s d effect size was calculated for genes showing a
pattern of possible differential expression, defined by having all
10 expression values (10 phenotypes), the same valence and at least
three expression-phenotype correlations >0.30, which is at least
a medium effect size as defined by Cohen (34). Ten a priori defined
phenotypes were as follows: i) Continuous phenotypes were defined
by total CAPS scores (PTSD), item-average scores on HSCLA and total
scores on the BDI-II; and ii) dichotomous phenotypes were defined
by a PTSD diagnosis on CAPS, low vs. high PTSD subscale scores
(re-experiencing, avoidance/numbing, hypervigilance), clinically
significant vs. non-significant anxiety on HSCLA and two depression
phenotypes on BDI-II (no depression vs. mild or greater depression;
no or mild depression vs. moderate or greater depression).
Results
Quality control
Threshold cycle value (Ct)
Genes of interest (20/42) eliminated from analysis
by this quality control were: interleukin 1A (IL1A), IL4, IL6,
IL10, inducible nitric oxide synthase 2 (NOS2), sodium-dependent
dopamine transporter (SLC6A3), 5-hydroxytryptamine transporter
(SLC6A4), α2A adrenoreceptor (ADRA2A), ADRA2B, ADRA2C,
β1-adrenergic receptor (ADRB1), tumor necrosis factor (TNF)
receptor superfamily member 18 (TNFRSF18), neuropeptide Y (NPY),
NPY receptor Y1 (NPY1R), NPY2R, NPY5R, corticotropin releasing
hormone (CRH), CRH receptor 1 (CRHR1), CRHR2 and CRH binding
protein (CRHBP). None of these eliminated genes had significant
inter-assay variance.
Replicability
Only eight outlier values were identified from a
total of 1,344 assessments on the second quality control (0.6% test
error rate).
Reliability
This quality control eliminated 5 candidate genes;
IL6 receptor (IL6R), IL18R1, TNF, nuclear receptor subfamily 3,
group C, member 1 glucocorticoid receptor (GR) and receptor for
advanced glycosylation end products (RAGE). For the 17 remaining
genes, one-week re-test reliability showed a 9% coefficient of
variability for within-person values, which is consistent with
high-quality data from biological systems (typically 5–10%).
Differential expression by phenotype
Descriptive
Table I shows no
differences between PTSD and no PTSD groups in demographic
variables or combat exposure. As expected, PTSD subjects had more
symptoms of depression and anxiety. Relevant data for each subject
are provided in Table II.
| Table IIDemographic, trauma and major clinical
phenotype scores by subject. |
Table II
Demographic, trauma and major clinical
phenotype scores by subject.
| Patient no. | PTSD diagnosis | Age | Gender | Edu | CES | Anx | Dep | PTSD |
|---|
| 1 | No | 25 | M | 16 | 15 | NA | 6 | 17 |
| 2 | No | 31 | F | 14 | 24 | 1.2 | 7 | 34 |
| 4 | Yes | 31 | M | 12 | 28 | 1.7 | 16 | 63 |
| 5 | No | 47 | M | 15 | 13 | 2.3 | 18 | 26 |
| 6 | Yes | 33 | M | 16 | 18 | 3.3 | 21 | 81 |
| 7 | Yes | 22 | M | 11 | 28 | 2.0 | 25 | 88 |
| 8 | No | 24 | M | 13 | 24 | 1.3 | 11 | 32 |
| 9 | Yes | 35 | M | 16 | 24 | 1.6 | 19 | 59 |
| 10 | Yes | 30 | M | 14 | 19 | 2.2 | 30 | 82 |
| 11 | No | 43 | M | 15 | 25 | 1.2 | 18 | 47 |
| 12 | Yes | 35 | M | 13 | 21 | 2.1 | 25 | 79 |
| 13 | No | 26 | M | 14 | 28 | 1.0 | 3 | 6 |
| 15 | No | 27 | F | 16 | 17 | 1.2 | 5 | 6 |
| 16 | No | 54 | M | 16 | 22 | 1.0 | 0 | 2 |
| 17 | No | 27 | M | 16 | 14 | 1.2 | 0 | 2 |
| 18 | No | 31 | F | 16 | 8 | 1.2 | 4 | 12 |
| 21 | No | 32 | F | 14 | 13 | 1.6 | 13 | 7 |
Mean comparisons
Three gene-by-phenotype tests were statistically
significant for between-group gene expression; IL10RB on
depression, and BDI12 and IL4R on anxiety (Table III). However, with 100
comparisons, 5 may be significant by chance alone.
| Table IIICorrelation of gene expression with
clinical phenotypes. |
Table III
Correlation of gene expression with
clinical phenotypes.
| Continuous
variables | Dichotomous
variables |
|---|
|
|
|
|---|
| Gene | PTSD | Anx | Dep | PTSDX | Reexp | Avoid | Hyper | Anx1.7 | BDI12 | BDI16 |
|---|
| IL6ST | −0.10 | −0.04 | −0.13 | −0.09 | −0.21 | −0.13 | −0.07 | 0.17 | −0.04 | 0.03 |
| IL1B | 0.15 | −0.01 | 0.28 | 0.15 | 0.16 | 0.05 | 0.17 | 0.09 | 0.27 | 0.25 |
| TNFRSF10A | 0.20 | 0.08 | 0.15 | 0.23 | 0.14 | 0.06 | 0.14 | 0.33 | 0.10 | 0.15 |
| TNFRSF10B | 0.36 | 0.23 | 0.39 | 0.36 | 0.33 | 0.10 | 0.26 | 0.44 | 0.28 | 0.32 |
| TNFRSF1A | 0.13 | 0.09 | 0.27 | 0.07 | 0.18 | 0.06 | 0.12 | 0.01 | 0.27 | 0.29 |
| TNFRSF1B | 0.26 | 0.03 | 0.21 | 0.27 | 0.22 | 0.07 | 0.20 | 0.30 | 0.10 | 0.13 |
| IL8 | 0.17 | 0.25 | 0.13 | 0.22 | 0.20 | 0.06 | 0.18 | 0.06 | 0.15 | 0.24 |
| IL8RA | 0.19 | 0.12 | 0.28 | 0.13 | 0.17 | 0.04 | 0.16 | 0.16 | 0.31 | 0.35 |
| IL8RB | 0.01 | −0.08 | 0.12 | 0.02 | 0.10 | −0.05 | 0.02 | −0.16 | 0.24 | 0.10 |
| IL16 | 0.30 | 0.08 | 0.24 | 0.32 | 0.23 | 0.15 | 0.24 | 0.34 | 0.12 | 0.19 |
| ADRB2 | 0.20 | 0.28 | 0.14 | 0.12 | 0.20 | 0.04 | 0.05 | 0.19 | 0.09 | 0.12 |
| IL18 | 0.15 | 0.19 | 0.32 | −0.01 | 0.09 | −0.03 | 0.04 | 0.18 | 0.26 | 0.22 |
| FKBP5 | 0.23 | 0.07 | 0.17 | 0.16 | 0.05 | 0.09 | 0.10 | 0.37 | 0.01 | 0.14 |
| S100A12 | −0.06 | 0.03 | 0.18 | −0.01 | −0.15 | −0.02 | −0.03 | 0.02 | 0.16 | 0.08 |
| IL10RA | −0.05 | 0.21 | 0.05 | −0.19 | −0.27 | −0.09 | −0.14 | 0.05 | −0.05 | −0.07 |
| IL10RB | 0.35 | 0.26 | 0.56a | 0.33 | 0.27 | 0.28 | 0.30 | 0.28 | 0.58a | 0.47 |
| IL4R | 0.18 | 0.33 | 0.23 | 0.28 | 0.13 | 0.06 | 0.23 | 0.52a | 0.28 | 0.35 |
Effect size
Four genes met the criteria for having a pattern of
possible differential expression; TNFRSF10B, IL16, IL10RB and IL4R.
Table IV shows the effect size by
phenotype for each gene and these effects are summarized in
Table V.
| Table IVEffect size of genes with pattern of
differential expression on dichotomous phenotypes. |
Table IV
Effect size of genes with pattern of
differential expression on dichotomous phenotypes.
| A. PTSDX |
|---|
|
|---|
| Gene by
phenotype | Effect size (mean ±
SE) | Cohen’s
d |
|---|
|
|---|
| PTSD (n=6) | No PTSD (n=11) |
|---|
| TNFRSF10B | 8.2±0.32 | 7.7±0.18 | 0.75 |
| IL16 | 6.53±0.74 | 5.74±0.22 | 0.66 |
| IL10RB | 6.91±0.13 | 6.64±0.13 | 0.68 |
| IL4R | 5.97±0.11 | 5.71±0.16 | 0.56 |
|
| B. Reexp |
|
| Gene by
phenotype | Effect size (mean ±
SE) | Cohen’s
d |
|
| High (n=7) | Low (n=10) |
|
| TNFRSF10B | 8.14±0.28 | 7.69±0.19 | 0.68 |
| IL16 | 6.34±0.65 | 5.79±0.24 | 0.44 |
| IL10RB | 6.86±0.12 | 6.65±0.14 | 0.53 |
| IL4R | 5.87±0.14 | 5.75±0.17 | 0.25 |
|
| C. Avoid |
|
| Gene by
phenotype | Effect size (mean ±
SE) | Cohen’s
d |
|
| High (n=8) | Low (n=9) |
|
| TNFRSF10B | 7.95±0.29 | 7.81±0.19 | 0.20 |
| IL16 | 6.21±0.58 | 5.85±0.26 | 0.29 |
| IL10RB | 6.85±0.1 | 6.63±0.16 | 0.55 |
| IL4R | 5.83±0.13 | 5.77±0.18 | 0.13 |
|
| D. Hyper |
|
| Gene by
phenotype | Effect size (mean ±
SE) | Cohen’s
d |
|
| High (n=7) | Low (n=10) |
|
| TNFRSF10B | 8.09±0.29 | 7.73±0.19 | 0.54 |
| IL16 | 6.36±0.65 | 5.78±0.24 | 0.47 |
| IL10RB | 6.87±0.12 | 6.64±0.14 | 0.58 |
| IL4R | 5.92±0.1 | 5.71±0.18 | 0.45 |
|
| E. Anx1.7
(Anxiety) |
|
| Gene by
phenotype | Effect size (mean ±
SE) | Cohen’s
d |
|
| Clinically
significant (n=6) | Clinically
insignificant (n=10) |
|
| TNFRSF10B | 8.28±0.31 | 7.67±0.19 | 0.92 |
| IL16 | 6.59±0.72 | 5.73±0.25 | 0.70 |
| IL10RB | 6.91±0.13 | 6.7±0.13 | 0.55 |
| IL4R | 6.09±0.07 | 5.6±0.16 | 1.17 |
|
| F. BDI12
(depression) |
|
| Gene by
phenotype | Effect size (mean ±
SE) | Cohen’s
d |
|
| ≥Mild (n=9) | Insignificant
(n=8) |
|
| TNFRSF10B | 8.05±0.23 | 7.68±0.23 | 0.55 |
| IL16 | 6.16±0.51 | 5.86±0.3 | 0.24 |
| IL10RB | 6.95±0.1 | 6.5±0.13 | 1.35 |
| IL4R | 5.92±0.1 | 5.67±0.21 | 0.54 |
|
| G. BDI16
(depression) |
|
| Gene by
phenotype | Effect size (mean ±
SE) | Cohen’s
d |
|
| ≥Moderate
(n=8) | <Moderate
(n=9) |
|
| TNFRSF10B | 8.1±0.26 | 7.67±0.21 | 0.63 |
| IL16 | 6.26±0.57 | 5.81±0.27 | 0.36 |
| IL10RB | 6.93±0.11 | 6.56±0.14 | 0.99 |
| IL4R | 5.96±0.1 | 5.65±0.19 | 0.68 |
| Table VSummary of effect size of gene
expression on phenotype. |
Table V
Summary of effect size of gene
expression on phenotype.
| Phenotype | TNFRSF10B | IL16 | IL10RB | IL4R |
|---|
| PTSDX | Moderate | Moderate | Moderate | Moderate |
| Reexp | Moderate | Small | Moderate | None |
| Avoid | None | None | Moderate | None |
| Hyper | Moderate | Small | Moderate | Small |
| Anx1.7 | Large | Moderate | Moderate | Large |
| BDI12 | Moderate | None | Large | Moderate |
| BDI16 | Moderate | Small | Large | Moderate |
Discussion
This pilot study highlights the importance of
methods utilizing GEA on the interpretation of results, and
identifies possible differential expression patterns between PTSD
and control subjects using a theoretically driven approach.
Conclusions with regard to differential expression patterns are
preliminary due to the chosen GEA technology, target genes, sample
size and selection of phenotypes. Twenty genes eliminated due to
low expression (high Ct) may or may not be significant contributors
to PTSD and require further investigation by adding a
pre-amplification step between mRNA isolation and the qRT-PCR
analysis (35–37). Furthermore, three of the five genes
excluded from analysis at the reliability control step (IL6R,
IL18R1 and RAGE) showed a pattern of possible increased
differential expression on phenotypes. Had strict quality control
measures not been applied in the present study, RAGE in particular
would have been reported to exhibit the strongest overall signal of
possible differential expression by phenotypes. Notably,
interactions between RAGE and its ligands have been suggested to
result in pro-inflammatory gene activation (38), which may render RAGE an important
regulatory gene in the proposed model for PTSD (Fig. 1). Similarly, effect size analyses
were applied to these data conservatively; these were conducted as
the study was preliminary and underpowered. Had the third quality
control step been ignored and we were to report genes that
demonstrated a GEA-by-phenotype correlation of >0.27 and a
moderate or greater effect size (rather than define ‘possible
differential expression’ using a higher standard), more
between-group possible differential expressions would have been
reported, as shown in Table VI,
for only two of the phenotypes. Thus, strict quality control
methods may enhance specificity at the expense of sensitivity. At
the current stage of this research, it is critical to obtain
specific markers at the expense of sensitive markers within a
theoretical framework. Thus, there are numerous genes which are not
in this proposed model that may be markers for PTSD. Finally, the
phenotypes chosen may or may not be the most appropriate to
discover between-group expression effects. There is a fair debate
with regard to the relevance of clinical category to biology, where
endophenotypes may provide more information on the range of
psychiatric illnesses and allow for more powerful assessment of
genetic linkage (39).
| Table VIBetween group effect size of gene
expression by dichotomous phenotype (two shown, PTSD diagnosis and
high vs. low anxiety) for genes with correlation >0.27 to
phenotype. |
Table VI
Between group effect size of gene
expression by dichotomous phenotype (two shown, PTSD diagnosis and
high vs. low anxiety) for genes with correlation >0.27 to
phenotype.
| A. PTSDX |
|---|
|
|---|
| Gene by
phenotype | Effect size
(mean±SE) | Cohen’s
d |
|---|
|
|---|
| PTSD (n=6) | No PTSD (n=11) |
|---|
| RAGE | 10.67±0.28 | 10.04±0.22 | 0.88 |
| TNFRSF10B | 8.2±0.32 | 7.7±0.18 | 0.75 |
| IL10RB | 6.91±0.13 | 6.64±0.13 | 0.68 |
| IL16 | 6.53±0.74 | 5.74±0.22 | 0.66 |
| IL 6R | 5.04±0.33 | 4.67±0.16 | 0.58 |
| IL4R | 5.97±0.11 | 5.71±0.16 | 0.56 |
| IL18R | 9.07±0.17 | 8.87±0.10 | 0.55 |
|
| B. Anx1.7
(anxiety) |
|
| Gene by
phenotype | Effect size
(mean±SE) | Cohen’s
d |
|
| Clinically
significant (n=6) | Clinically
insignificant (n=10) |
|
| IL4R | 6.09±0.07 | 5.6±0.16 | 1.17 |
| RAGE | 10.72±0.26 | 10.03±0.24 | 0.96 |
| TNFRSF10B | 8.28±0.31 | 7.67±0.19 | 0.92 |
| FKBP5 | 5.63±0.32 | 5.23±0.10 | 0.75 |
| IL16 | 6.59±0.72 | 5.73±0.25 | 0.70 |
| IL6R | 5.08±0.33 | 4.64±0.16 | 0.70 |
| TNF10A | 9.95±0.43 | 9.41±0.18 | 0.69 |
| TNF1B | 6.92±0.59 | 6.30±0.23 | 0.59 |
| IL10RB | 6.91±0.13 | 6.7±0.13 | 0.55 |
Three of the four genes exhibiting a pattern of
possible increased differential expression on PTSD and associated
phenotypes, TNFRSF10B, IL10RB and IL4R, are involved in the
regulation pathway of pro-inflammation from noradrenergic
hyperactivity. The fourth gene, IL16, is known to be regulated by
GR, the receptor to which cortisol and other glucocorticoids bind.
Notably, GR expression valence, while non-significant, was negative
for all the phenotypes and had a significant negative correlation
with combat trauma exposure (r=−0.59). These results are consistent
with our theoretical model and the results of a recent study
(40). Future studies are required
to understand the association between the relative degree of
differential expression in mRNA and clinical phenotypes with
clinical bioactivity, potentially as assessed by corresponding
peripheral markers.
Conclusions with regard to differential expression
patterns are preliminary due to the GEA technology utilized in the
present study. Furthermore, the sample size was small. Twenty genes
eliminated due to low expression may or may not be significant
contributors to PTSD. This may be further investigated by adding a
pre-amplification step between mRNA isolation and qRT-PCR
analysis.
Acknowledgements
Funding was provided by PIRE Corporate Development
(grant no. 9239). The authors would like to thank and honor the
members of our military, and appreciate the technical assistance
provided by Everett Lowry, Tri Luu, Umang Dave, Jonathon Vigil,
Valerie Wada, Liz Wozniak and Linda Nguyen.
References
|
1
|
Koenen KC: Nature-nurture interplay:
genetically informative designs contribute to understanding the
effects of trauma and interpersonal violence. J Interpers Violence.
20:507–512. 2005. View Article : Google Scholar : PubMed/NCBI
|
|
2
|
Baker DG, Ekhator NN, Kasckow JW, et al:
Higher levels of basal serial CSF cortisol in combat veterans with
posttraumatic stress disorder. Am J Psychiatry. 162:992–994. 2005.
View Article : Google Scholar : PubMed/NCBI
|
|
3
|
Bremner D, Vermetten E and Kelley ME:
Cortisol, dehydroepiandrosterone, and estradiol measured over 24
hours in women with childhood sexual abuse-related posttraumatic
stress disorder. J Nerv Ment Dis. 195:919–927. 2007. View Article : Google Scholar
|
|
4
|
Glover DA and Poland RE: Urinary cortisol
and catecholamines in mothers of child cancer survivors with and
without PTSD. Psychoneuroendocrinology. 27:805–819. 2002.
View Article : Google Scholar : PubMed/NCBI
|
|
5
|
Mason JW, Giller EL, Kosten TR, Ostroff RB
and Podd L: Urinary free-cortisol levels in posttraumatic stress
disorder patients. J Nerv Ment Dis. 174:145–149. 1986. View Article : Google Scholar : PubMed/NCBI
|
|
6
|
Rohleder N and Karl A: Role of endocrine
and inflammatory alterations in comorbid somatic diseases of
post-traumatic stress disorder. Minerva Endocrinol. 31:273–288.
2006.PubMed/NCBI
|
|
7
|
Thaller V, Vrkljan M, Hotujac L and
Thakore J: The potential role of hypocortisolism in the
pathophysiology of PTSD and psoriasis. Coll Antropol. 23:611–619.
1999.PubMed/NCBI
|
|
8
|
Yehuda R, Southwick SM, Nussbaum G, Wahby
V, Giller EL Jr and Mason JW: Low urinary cortisol excretion in
patients with posttraumatic stress disorder. J Nerv Ment Dis.
178:366–369. 1990. View Article : Google Scholar : PubMed/NCBI
|
|
9
|
Yehuda R, Giller EL Jr and Mason JW:
Psychoneuroendocrine assessment of posttraumatic stress disorder:
current progress and new directions. Prog Neuropsychopharmacol Biol
Psychiatry. 17:541–550. 1993. View Article : Google Scholar : PubMed/NCBI
|
|
10
|
Yehuda R, Boisoneau D, Lowy MT and Giller
EL Jr: Dose-response changes in plasma cortisol and lymphocyte
glucocorticoid receptors following dexamethasone administration in
combat veterans with and without posttraumatic stress disorder.
Arch Gen Psychiatry. 52:583–593. 1995. View Article : Google Scholar
|
|
11
|
Rohleder D, Kiefer W and Petrich W:
Quantitative analysis of serum and serum ultrafiltrate by means of
Raman spectroscopy. Analyst. 129:906–911. 2004. View Article : Google Scholar : PubMed/NCBI
|
|
12
|
Blanchard EB, Hickling EJ, Buckley TC,
Taylor AE, Vollmer A and Loos WR: Psychophysiology of posttraumatic
stress disorder related to motor vehicle accidents: replication and
extension. J Consult Clin Psychol. 64:742–751. 1996. View Article : Google Scholar : PubMed/NCBI
|
|
13
|
Yehuda R, Siever LJ, Teicher MH, et al:
Plasma norepinephrine and 3-methoxy-4-hydroxyphenylglycol
concentrations and severity of depression in combat posttraumatic
stress disorder and major depressive disorder. Biol Psychiatry.
44:56–63. 1998. View Article : Google Scholar
|
|
14
|
Bremner JD, Elzinga B, Schmahl C and
Vermetten E: Structural and functional plasticity of the human
brain in posttraumatic stress disorder. Prog Brain Res.
167:171–186. 2008. View Article : Google Scholar : PubMed/NCBI
|
|
15
|
Lanius RA, Bluhm R, Lanius U and Pain C: A
review of neuroimaging studies in PTSD: heterogeneity of response
to symptom provocation. J Psychiatr Res. 40:709–729. 2006.
View Article : Google Scholar : PubMed/NCBI
|
|
16
|
Shin LM, Wright CI, Cannistraro PA, Wedig
MM, et al: A functional magnetic resonance imaging study of
amygdala and medial prefrontal cortex responses to overtly
presented fearful faces in posttraumatic stress disorder. Arch Gen
Psychiatry. 62:273–281. 2005. View Article : Google Scholar
|
|
17
|
Kolassa IT, Wienbruch C, Neuner F, et al:
Altered oscillatory brain dynamics after repeated traumatic stress.
BMC Psychiatry. 7:562007. View Article : Google Scholar : PubMed/NCBI
|
|
18
|
Baker DG, Ekhator NN, Kasckow JW, et al:
Plasma and cerebrospinal fluid interleukin-6 concentrations in
posttraumatic stress disorder. Neuroimmunomodulation. 9:209–217.
2001. View Article : Google Scholar : PubMed/NCBI
|
|
19
|
Maes M, Lin AH, Delmeire L, et al:
Elevated serum interleukin-6 (IL-6) and IL-6 receptor
concentrations in posttraumatic stress disorder following
accidental man-made traumatic events. Biol Psychiatry. 45:833–839.
1999. View Article : Google Scholar
|
|
20
|
Spivak B, Shohat B, Mester R, et al:
Elevated levels of serum interleukin-1 beta in combat-related
posttraumatic stress disorder. Biol Psychiatry. 42:345–348. 1997.
View Article : Google Scholar : PubMed/NCBI
|
|
21
|
Tucker P, Masters B and Nawar O:
Topiramate in the treatment of comorbid night eating syndrome and
PTSD: a case study. Eat Disord. 12:75–78. 2004. View Article : Google Scholar : PubMed/NCBI
|
|
22
|
von Känel R, Hepp U, Kraemer B, et al:
Evidence for low-grade systemic proinflammatory activity in
patients with posttraumatic stress disorder. J Psychiatr Res.
41:744–752. 2007.PubMed/NCBI
|
|
23
|
Segman RH, Shefi N, Goltser-Dubner T,
Friedman N, Kaminski N and Shalev AY: Peripheral blood mononuclear
cell gene expression profiles identify emergent post-traumatic
stress disorder among trauma survivors. Mol Psychiatry. 10:500–513.
2005. View Article : Google Scholar
|
|
24
|
Su TP, Zhang L, Chung MY, et al: Levels of
the potential biomarker p11 in peripheral blood cells distinguish
patients with PTSD from those with other major psychiatric
disorders. J Psychiatr Res. 43:1078–1085. 2009. View Article : Google Scholar
|
|
25
|
Yehuda R, Cai G, Golier JA, et al: Gene
expression patterns associated with posttraumatic stress disorder
following exposure to the World Trade Center attacks. Biol
Psychiatry. 66:708–711. 2009. View Article : Google Scholar : PubMed/NCBI
|
|
26
|
Zieker J, Zieker D, Jatzko A, et al:
Differential gene expression in peripheral blood of patients
suffering from post-traumatic stress disorder. Mol Psychiatry.
12:116–118. 2007. View Article : Google Scholar : PubMed/NCBI
|
|
27
|
Koenen KC, De Vivo I, Rich-Edwards J,
Smoller JW, Wright RJ and Purcell SM: Protocol for investigating
genetic determinants of posttraumatic stress disorder in women from
the Nurses’ Health Study II. BMC Psychiatry. 9:292009.PubMed/NCBI
|
|
28
|
First MB, Spitzer RL, Gibbon M and
Williams JBW: Structured Clinical Interview for DSM-IV Axis I
Disorders. American Psychiatric Press, Inc; Washington, DC:
2001
|
|
29
|
Blake DD, Weathers FW, Nagy LM, et al: The
development of a Clinician-Administered PTSD Scale. J Trauma
Stress. 8:75–90. 1995. View Article : Google Scholar : PubMed/NCBI
|
|
30
|
Keane TM, Fairbank JA, Caddell JM,
Zimering RT, Taylor KL and Mora CA: Clinical evaluation of a
measure to assess combat exposure. Psychol Assess. 1:53–55. 1989.
View Article : Google Scholar
|
|
31
|
Beck AT, Steer RA and Brown GK: Manual for
Beck Depression Inventory-II. Psychological Corporation; San
Antonio, TX: 1996
|
|
32
|
Derogatis LR, Lipman RS, Rickels K,
Uhlenhuth EH and Covi L: The Hopkins Symptom Checklist (HSCL): a
self-report symptom inventory. Behav Sci. 19:1–15. 1974. View Article : Google Scholar : PubMed/NCBI
|
|
33
|
Calcagno AM, Chewning KJ, Wu CP and
Ambudkar SV: Plasma membrane calcium ATPase (PMCA4): a housekeeper
for RT-PCR relative quantification of polytopic membrane proteins.
BMC Mol Biol. 7:292006. View Article : Google Scholar : PubMed/NCBI
|
|
34
|
Cohen J: A power primer. Psychol Bull.
112:155–159. 1992. View Article : Google Scholar
|
|
35
|
Laurell C, Wirta V, Nilsson P and
Lundeberg J: Comparative analysis of a 3′ end tag PCR and a linear
RNA amplification approach for microarray analysis. J Biotechnol.
127:638–646. 2007.
|
|
36
|
Kurimoto K, Yabuta Y, Ohinata Y and Saitou
M: Global single-cell cDNA amplification to provide a template for
representative high-density oligonucleotide microarray analysis.
Nat Protoc. 2:739–752. 2007. View Article : Google Scholar : PubMed/NCBI
|
|
37
|
Kube DM, Savci-Heijink CD, Lamblin AF, et
al: Optimization of laser capture microdissection and RNA
amplification for gene expression profiling of prostate cancer. BMC
Mol Biol. 8:252007. View Article : Google Scholar : PubMed/NCBI
|
|
38
|
Bierhaus A, Schiekofer S, Schwaninger M,
et al: Diabetes-associated sustained activation of the
transcription factor nuclear factor-kappaB. Diabetes. 50:2792–2808.
2001. View Article : Google Scholar : PubMed/NCBI
|
|
39
|
Almasy L, Gur RC, Haack K, Cole SA,
Calkins ME, Peralta JM, Hare E, Prasad K, Pogue-Geile MF,
Nimgaonkar V and Gur RE: A genome screen for quantitative trait
loci influencing schizophrenia and neurocognitive phenotypes. Am J
Psychiatry. 165:1185–1192. 2008. View Article : Google Scholar : PubMed/NCBI
|
|
40
|
O’Donovan A, Sun B, Cole S, et al:
Transcriptional control of monocyte gene expression in
post-traumatic stress disorder. Dis Markers. 30:123–132.
2011.PubMed/NCBI
|