Introduction
Papillary thyroid carcinoma (PTC) is the most common
type of well-differentiated cancer of the thyroid. It represents
~80–85% of well-differentiated thyroid cancers (1). However, certain cases show relatively
early recurrence, severe invasion, multiple lymph node metastasis
or distant metastasis (2).
Therefore, it is important to identify the characteristics of PTC
with a high risk of invasion and metastasis.
microRNAs (miRNAs) are endogenous single- stranded
non-coding RNAs that bind to the 3′ non-coding region of the target
mRNAs, resulting in their selective degradation or inhibition of
translation. Therefore, by regulating their target genes, miRNAs
are known to be involved in a wide range of biological functions,
such as invasion, metastasis, proliferation and differentiation
(3,4). Deregulation of miRNA expression has
been demonstrated in thyroid carcinoma (5). In PTC, it has been suggested that
miRNA expression provides an indication of the aggressiveness of
the cancer (6).
mRNA expression profiling has determined that
transcriptional abnormalities of numerous genes are responsible for
the invasion of PTC (7). In a
previous study, it was shown that amyloid precursor protein
expression was correlated with large tumor size, extracapsular
invasion and lymph node metastasis in PTC (8).
In the present study, microarrays were used to
measure the expression levels of miRNAs and mRNAs simultaneously in
non-aggressive and aggressive PTCs, to investigate the potential
involvement of miRNAs in invasion and metastasis. The analyses were
integrated and extensive in the search for possible candidate
miRNAs and their mRNA targets for use in further investigations and
clinical applications.
Materials and methods
Clinical sample collection
The aggressive and non-aggressive PTC tissues used
in this study were obtained from the Sixth People’s Hospital
Affiliated to Shanghai Jiao Tong University (Shanghai, China). The
aggressive tumors were identified based on the presence of
extrathyroidal extension and/or lymph node and distant metastases.
In the non-aggressive group, samples were selected with no
extrathyroidal dissemination or regional lymphatic and distant
metastases. Specimens were snap-frozen in liquid nitrogen.
Histopathology of the tissues was diagnosed by one pathologist. The
collection and use of the patient samples was reviewed and approved
by the ethics committee of the Sixth People’s Hospital Affiliated
to Shanghai Jiao Tong University, and written informed consent was
obtained from the patients.
Total RNA isolation
Total RNA was isolated from the aggressive and
non-aggressive PTC tissues using TRIzol reagent (Invitrogen Life
Technologies, Carlsbad, CA, USA), according to the manufacturer’s
instructions. Total RNA quantification was performed using the
ND-1000 spectrophotometer (Nanodrop; Thermo Scientific Wilmington,
DE, USA). RNA integrity and the content of miRNAs was analyzed by
capillary electrophoresis using the Agilent Bioanalyzer 2100
(Agilent Technologies, Santa Clara, CA, USA).
miRNA and gene expression arrays
miRNA expression profiles were conducted in the
aggressive and non-aggressive PTC tissues. Analyses were performed
using the Affymetrix® GeneChip miRNA 2.0 array
(Affymetrix, Santa Clara, CA, USA), that allows the detection of
1105 known human miRNAs (miRBase v.15; Affymetrix). Total RNA (200
ng) was labeled with FlashTag Biotin HSR, according to the
Affymetrix instructions. The miRNA Array library file package was
downloaded and installed into Affymetrix GeneChip Command Console
software. Labeled samples were hybridized with the arrays and then
washed with PBS, stained and scanned according to the Affymetrix
instructions. The miRNA QC Tool software (Affymetrix) was used for
data summarization, normalization and quality control.
Gene expression profiling was conducted in the
aggressive and non-aggressive PTC tissues, previously analyzed for
miRNA profiling. The GeneChip® Human Gene 1.0 ST Array
(Affymetrix), consisting of 764,885 oligonucleotide probes that
span conserved exons across the transcripts of the targeted
full-length genes, was used. Total RNA (800 ng) was labeled using
the Affymetrix GeneChip WT terminal labeling kit according to the
manufacturer’s instructions. A total of 1.65 mg labeled cRNA was
used to prepare the hybridization samples and the hybridization was
conducted at 65°C for 17 h in a Hybridization Oven Rotator
(Affymetrix). The arrays were washed and Stabilization and Drying
solution (Affymetrix) was used according to the manufacturer’s
instructions. Slides were scanned on an Affymetrix microarray
scanner and Affymetrix GeneChip analysis software was used for
imaging analysis.
Identification of miRNA target genes
The conventional online programs, including miRanda
(http://www.microrna.org), Targetscan (http://www.targetscan.org) and Findtar (http://bio.sz.tsinghua.edu.cn), were used to predict
the targets of the miRNAs. The targets predicted by the three
programs were further analyzed. To identify the most likely
targets, the mRNA and miRNA expression data obtained on the same
biological samples using Microsoft Excel tool were integrated.
Two-fold upregulated miRNA and corresponding 2-fold downregulated
mRNA target were selected for further investigation.
Validation of miRNA and mRNA expression
levels with qPCR
Total RNA was prepared from tissues using the RNeasy
extraction kit (GE Healthcare, Pittsburgh, PA, USA) and reverse
transcribed using High-capacity cDNA Reverse Transcription kits
(Applied Biosystems, Victoria, Australia) according to the
manufacturer’s instructions. qPCR was performed on a 7300 Fast
Real-Time PCR system (Applied Biosystems, Foster City, CA, USA)
using SYBR-Green PCR Master mix (Applied Biosystems).
miRNA expression analysis was validated using the
MicroRNA Assay kit (Applied Biosystems, Foster City, CA, USA),
which incorporates a target-specific stem-loop reverse
transcription primer to provide specificity for the mature miRNA
target. Small nucleolar RNA RNU44 served as an endogenous control
for the normalization of RNA input. Specific primers of mRNA
expression analysis and the endogenous control were provided by
Invitrogen Life Technologies (Shanghai, China). The specificity of
the PCR products was tested by dissociation curves. Relative values
of transcripts were calculated using the equation,
2−ΔΔCt, where ΔCt is equal to the difference in
threshold cycles for target and reference genes. Each experiment
was performed in triplicate.
Luciferase reporter assays
Luciferase reporter vectors containing the 3′-UTR of
target TIMP3, ZNFR3, FN1 and ITGA2,
were generated following PCR amplification of human cDNA and cloned
into the pmirGLO Dual-Luciferase miRNA target expression vector
(Promega, Madison, WI, USA), immediately downstream from the stop
codon of the luciferase gene. The sequence of each insert was
confirmed by sequencing. A549 cells were plated in 24-well plates
and 24 h later cotransfected with 50 ng pmirGLO dual-luciferase
constructs, containing the indicated 3′-UTRs of target genes, and
with 32 mM pre-miR™ miRNA Precursor Molecules- Negative Control or
pre-miR miRNA using Lipofectamine 2000 (Life Technologies,
Carlsbad, CA, USA). Lysates were collected 24 h following
transfection and Firefly and Renilla luciferase activities
were consecutively measured by the Dual-Luciferase Reporter assay
(Promega) according to the manufacturer’s instructions. Relative
luciferase activity was calculated by normalizing the ratio of
Firefly/Renilla luciferase to that of negative
control-transfected cells. Transfections were performed in
triplicate.
Statistical analysis
Differences in miRNA and mRNA expression levels
between groups were analyzed with a t-test. Data are presented as
means ± SE. Statistical analyses were performed using SPSS software
(version 10.0; SPSS, Inc., Chicago, IL, USA). P<0.05 was
considered to indicate a statistically significant difference.
Agglomerative hierarchical clustering analysis was performed using
Cluster software and Treeview software (Eisen Lab, Berkeley, CA,
USA).
Results
miRNA expression assessed with miRNA
array
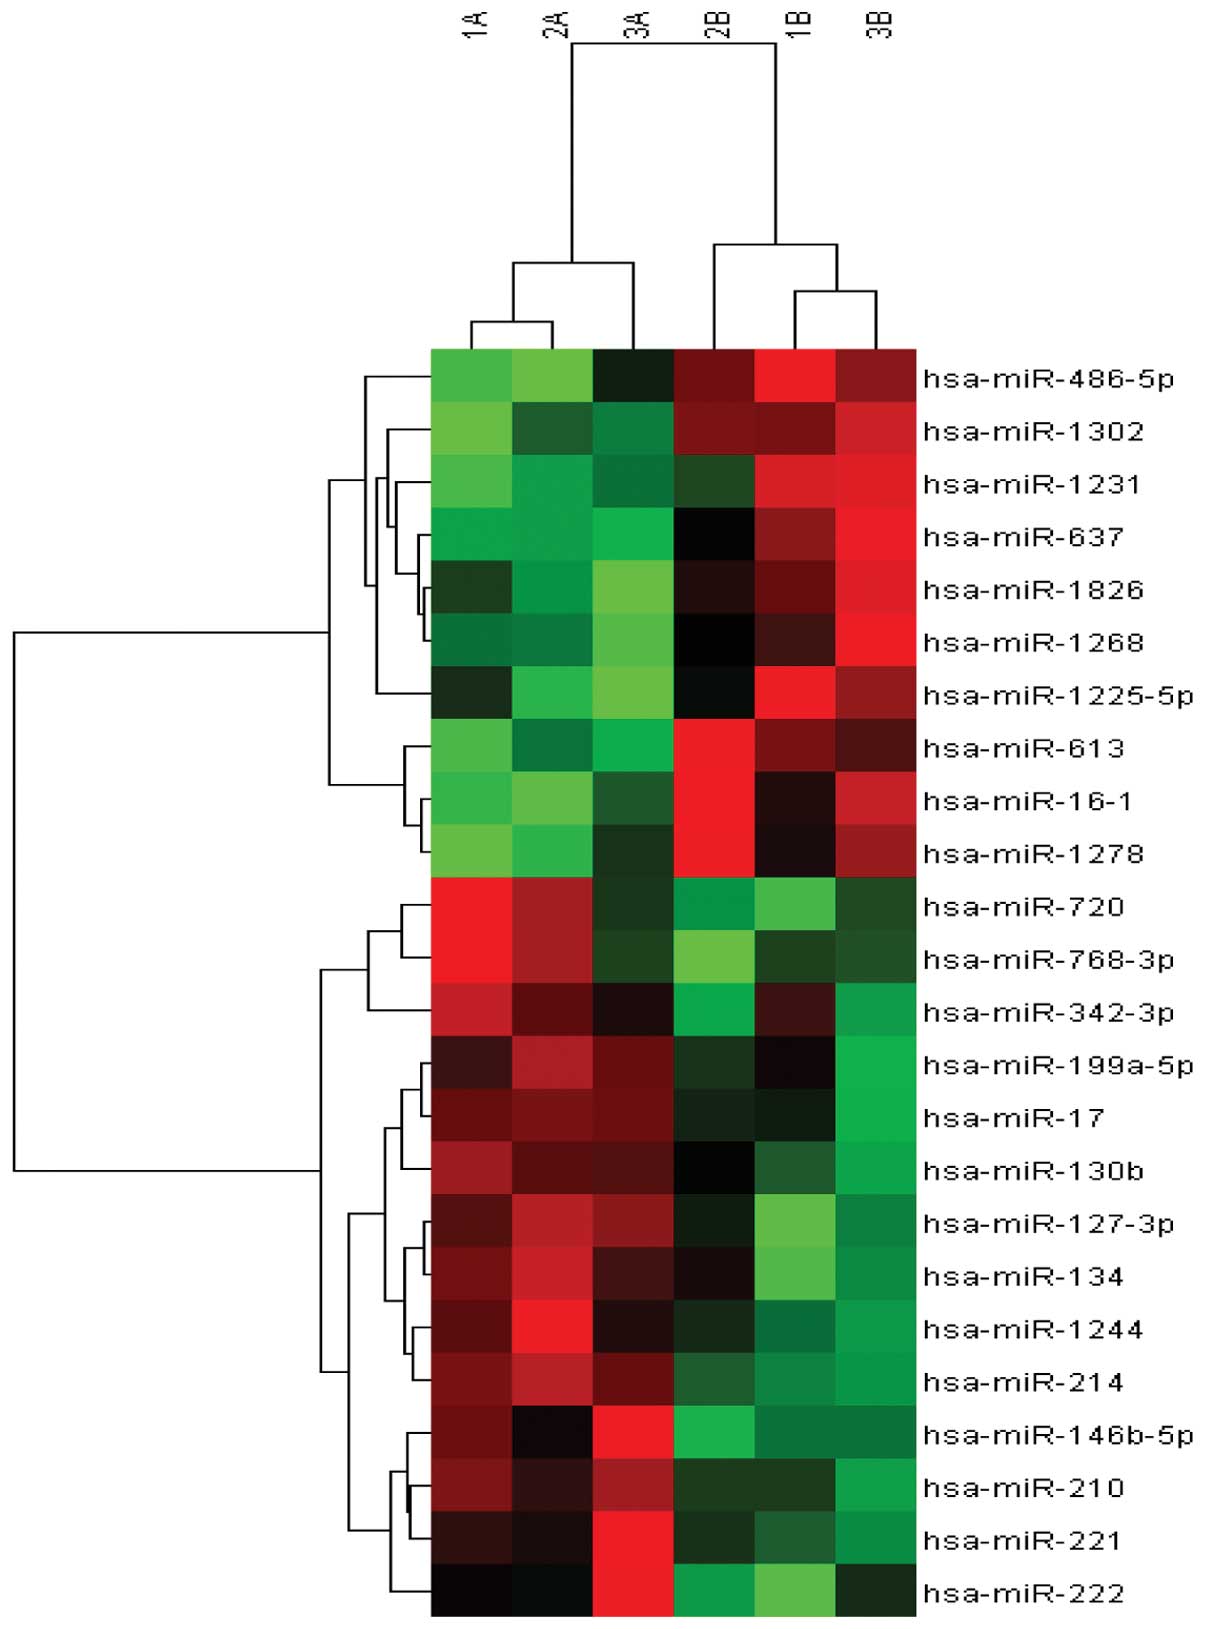
miRNA expression was initially assessed with miRNA
array in 6 snap-frozen PTC tissues obtained from 3 aggressive
tumors and 3 non-aggressive tumors. The aggressive tumors were
identified based on the presence of extrathyroidal extension and/or
lymph node metastases. miRNA array analysis for the expression of
1105 miRNAs demonstrated a subset of upregulated miRNAs
(miR-146b-5p, miR-221, miR-222, miR-210, miR-214, miR-1244,
miR-134, miR-127-3p, miR-130b, miR-17, miR-199a-5p, miR-342-3p,
miR-768-3p and miR-720) and downregulated miRNAs (miR-1278,
miR-16-1, miR-613, miR-1225-5p, miR-1268, miR-1826, miR-637,
miR-1231, miR-1302 and miR-486-5p) observed in 3 aggressive tumors
compared with non-aggressive PTC tissues (Fig. 1).
Validation expression of the miRNAs
identified by miRNA array
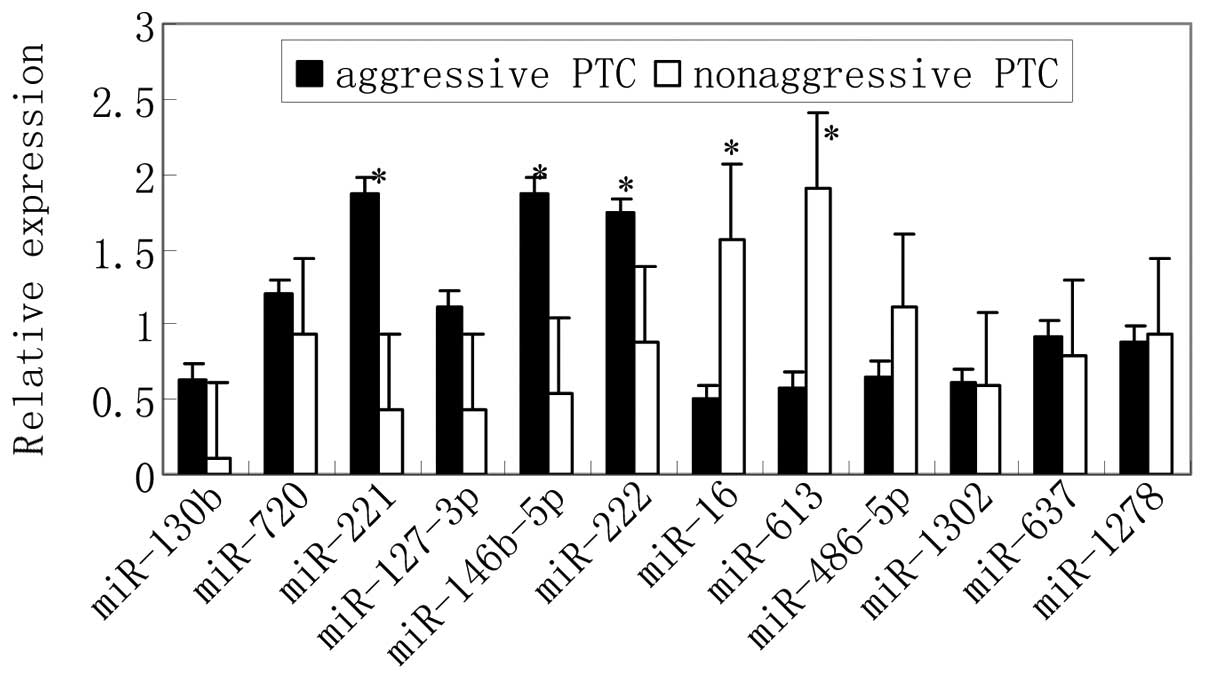
The microarray data from miRNA expression profiling
were validated by qPCR analysis for 12 miRNAs in a cohort of 20 PTC
samples with extrathyroidal dissemination and/or regional lymphatic
and distant metastases; and 20 PTC samples with no extrathyroidal
dissemination, regional lymphatic or distant metastases (Table I). A significantly altered
expression level of 5 miRNAs between aggressive and non-aggressive
PTC was observed (Fig. 2).
miR-222, miR-221 and miR-146b-5p were upregulated in aggressive
PTC, and miR-16 and miR-613 were downregulated in aggressive
PTC.
 | Table IClinicopathogenetical features of PTC
samples. |
Table I
Clinicopathogenetical features of PTC
samples.
| Clinicopathogenetic
features | Aggressive PTC
tissues (n=20) | Non-aggressive PTC
tissues (n=20) |
|---|
| Age (years) | 40.5±12.7 | 37.6±15.2 |
| Gender
(male:female) | 5:15 | 3:17 |
| Tumor size (cm) | 2.5±0.8 | 2.0±0.3 |
| Distant
metastasis | 3 | 0 |
| Tumor location |
| Unilateral | 4 | 6 |
| Bilateral | 16 | 14 |
| TNM staging
(AJCC) |
| I | 0 | 11 |
| II | 1 | 9 |
| III | 17 | 0 |
| IV | 2 | 0 |
|
Multicentricity | 16 | 12 |
| Extrathyroidal
extension | 17 | 0 |
Gene ontology (GO) analysis of mRNA
expression assessed by gene expression array
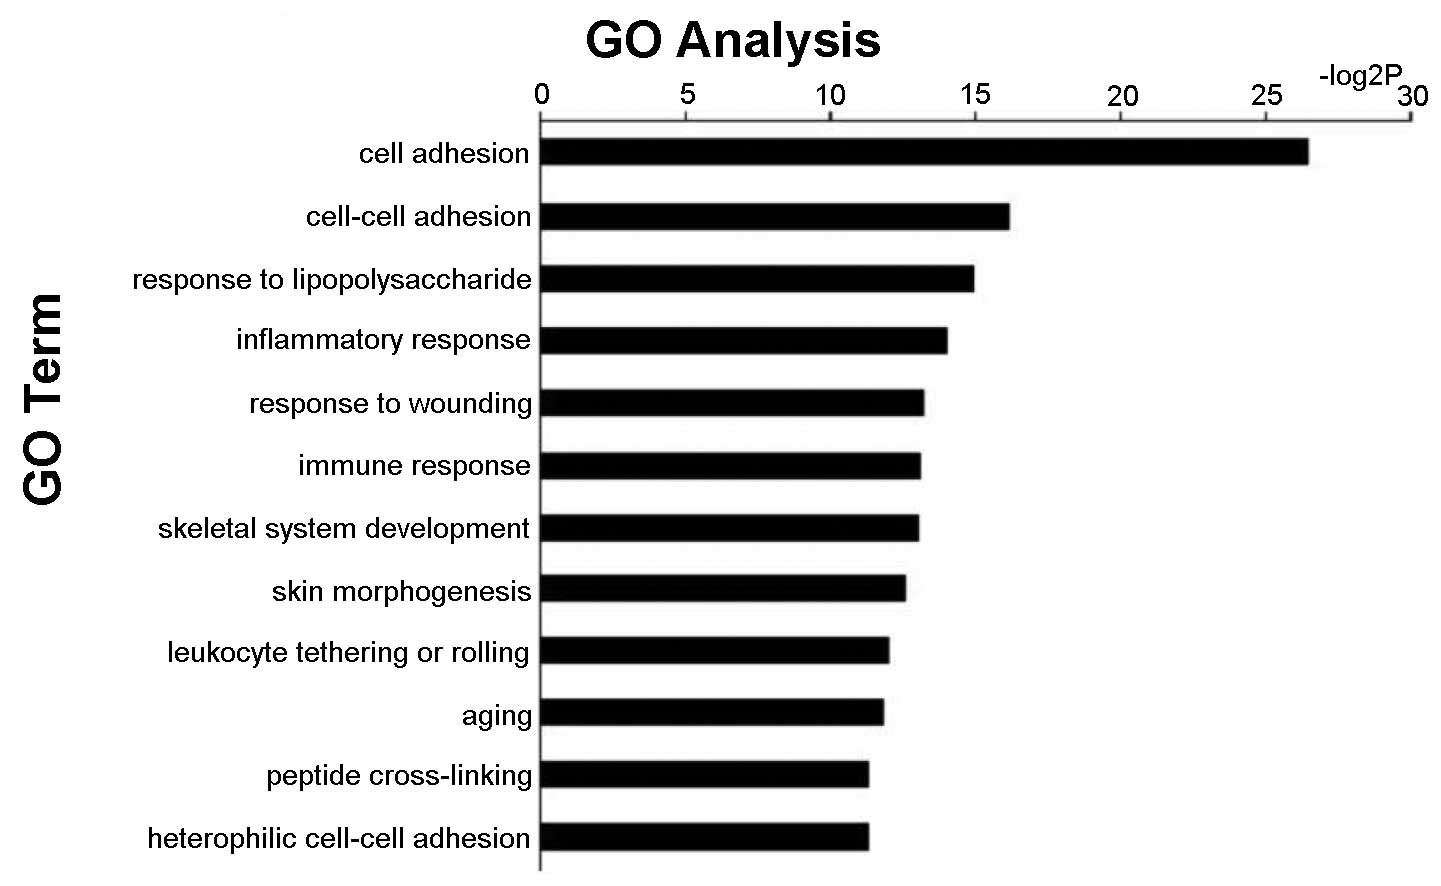
Gene expression profiling was conducted. There was
significantly different expression of 2000 genes between aggressive
and non-aggressive PTC samples. GO analyses of the differentially
expressed genes demonstrated that the expression of cell adhesion
genes involved in invasion and metastasis was significantly
different in aggressive PTC compared with non-aggressive PTC
(Fig. 3).
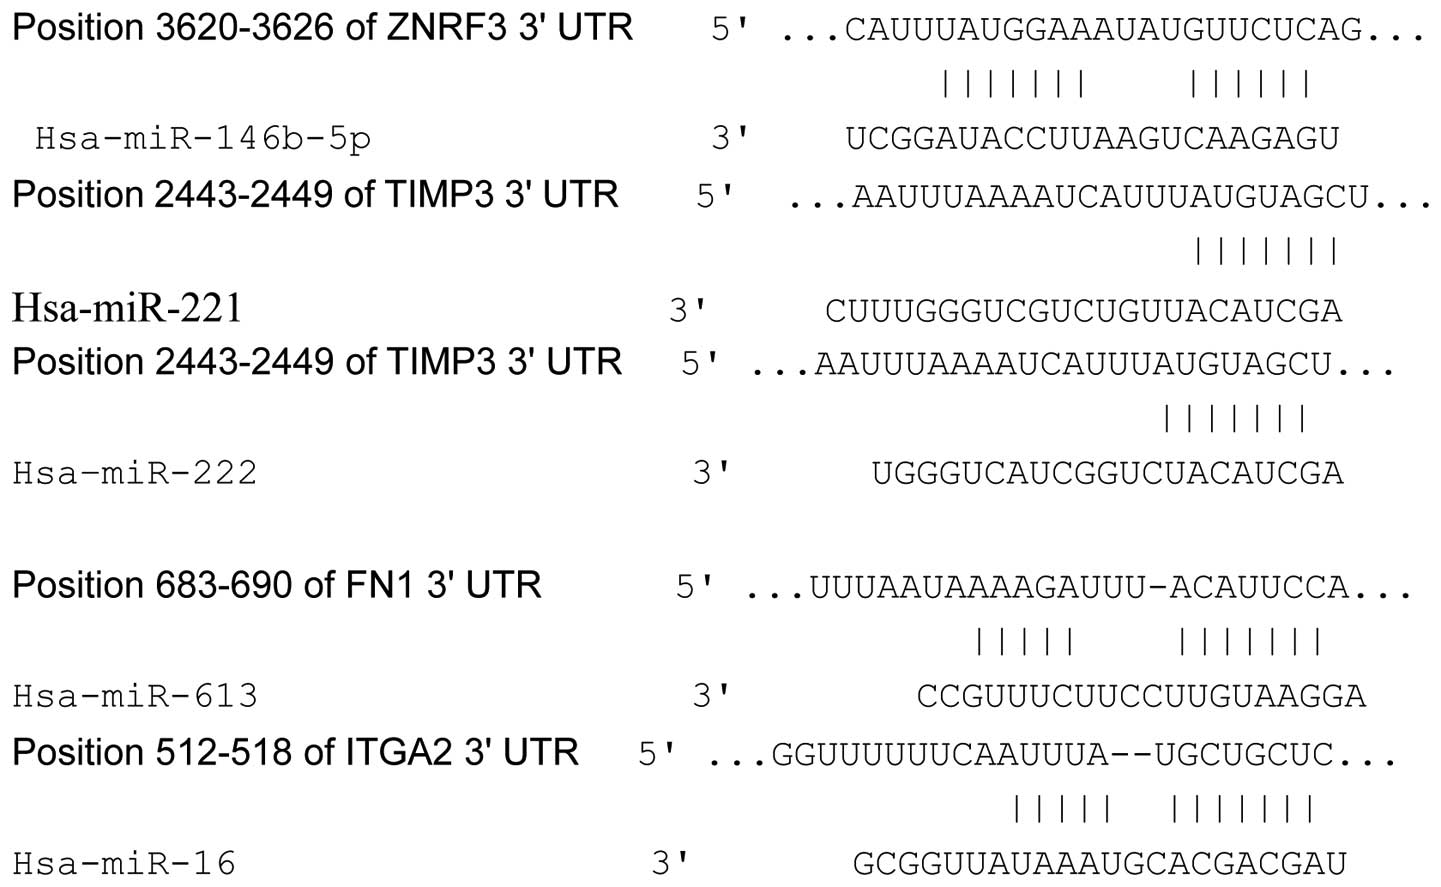
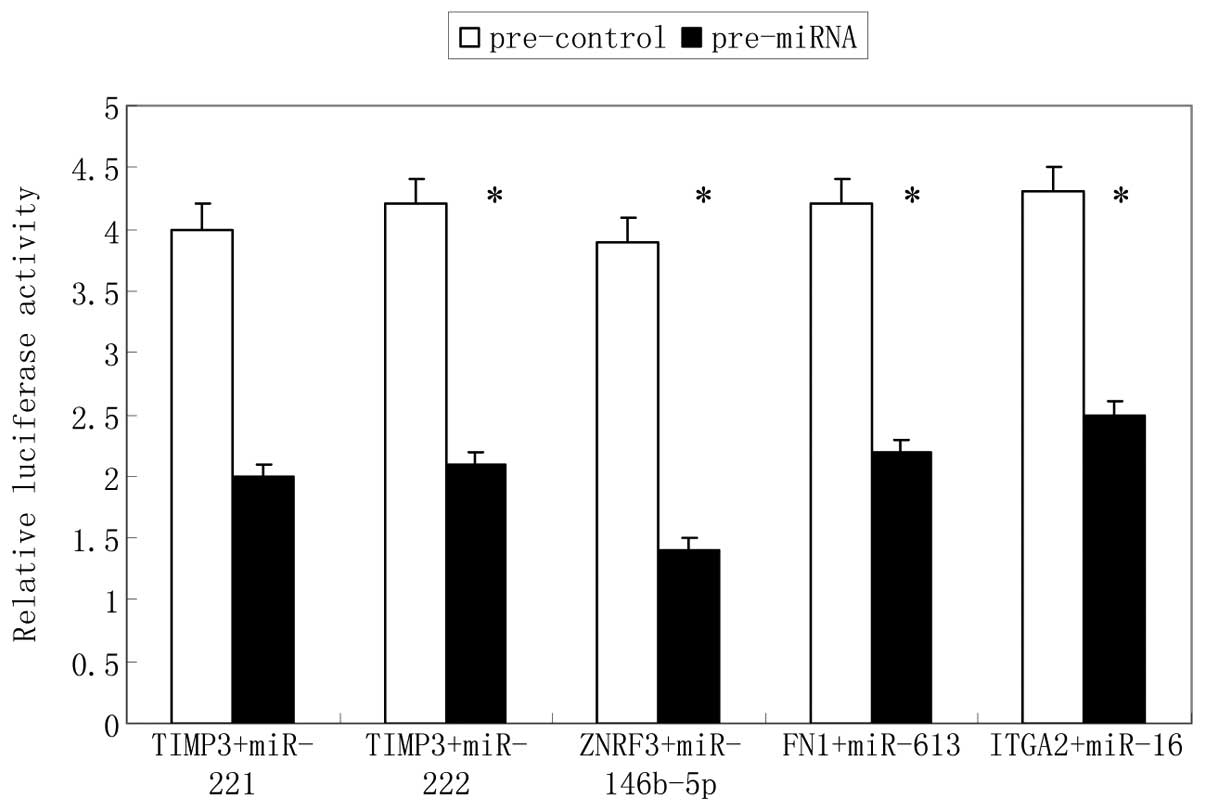
Identification of target genes for
validated miRNAs
To identify the validated miRNA targets, a
bioinformatics search (Targetscan, Findtar, miRanda) for putative
mRNA targets of the miRNAs was conducted. Among the candidate
targets, human TIMP3, ZNFR3, FN1 and
ITGA2 contained regions that matched the seed sequences of
hsa-miR-221, miR-222, miR-146b-5p, miR-613 and
miR-16, respectively (Fig.
4). Furthermore, human TIMP3, ZNFR3, FN1
and ITGA2 in gene array were inversely correlated with
hsa-miR-221, miR-222, miR-146b-5p, miR-613 and
miR-16 expression in miRNA array between aggressive and
non-aggressive PTC. To verify that TIMP3, ZNFR3,
FN1 and ITGA2 are direct targets of
miR-221/222, miR-146b-5p, miR-613 and
miR-16, respectively, a luciferase reporter assay was
conducted. The results showed that transfection of the individual
miRNAs significantly affected the upstream luciferase expression of
the related gene 3′-UTR (Fig.
5).
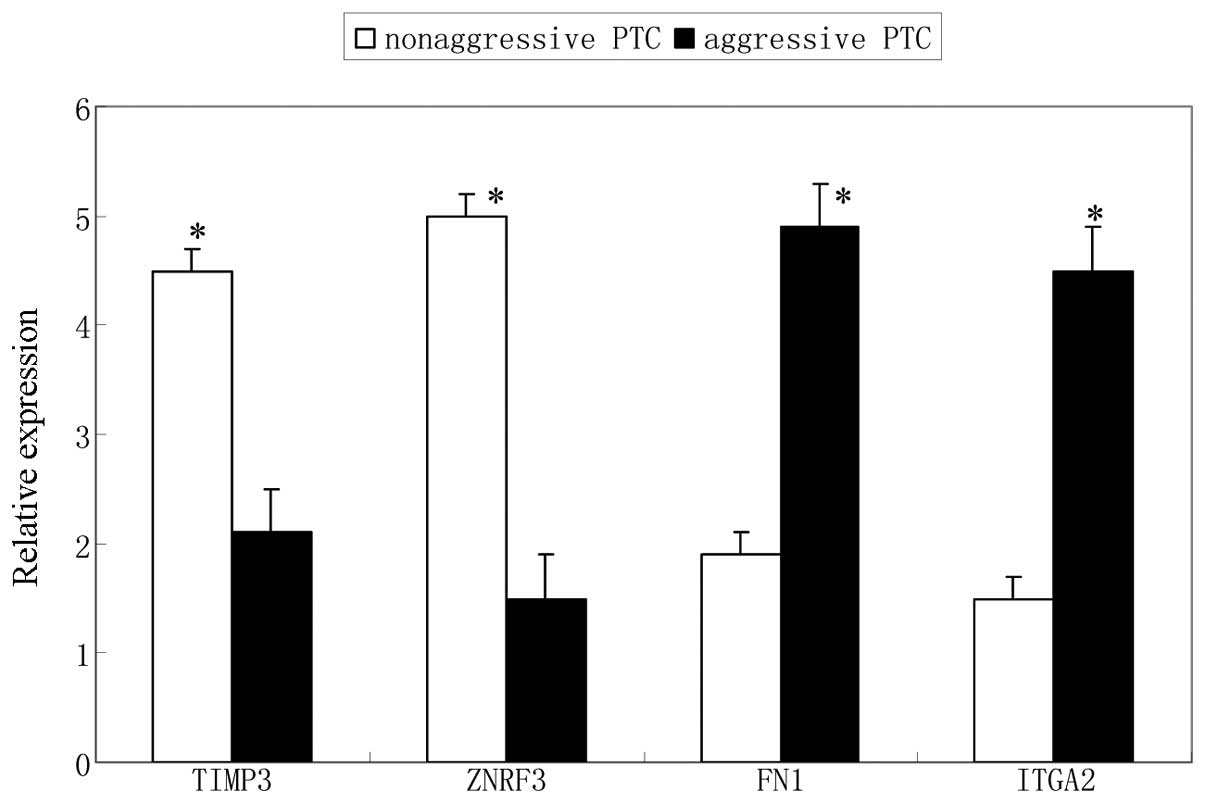
Validation expression of the target
genes
TIMP3, ZNFR3, FN1 and ITGA2 gene expression
validated by qPCR analysis in the same aggressive and
non-aggressive PTC tissues as miRNA validation. A significantly
altered expression levels of these genes between aggressive and
non-aggressive PTC was observed (Fig.
6). The expression of TIMP3 and ZNFR3 genes was downregulated,
and the expression of FN1 and ITGA2 genes was upregulated in
aggressive PTC, which were negatively correlated with the
associated miRNA expression.
Discussion
In the present study, using the miRNA expression
assay as an initial screen, it was demonstrated that a number of
miRNAs are differentially expressed in aggressive PTC,
characterized by extrathyroidal dissemination and/or regional
lymphatic and distant metastases, compared with non-aggressive PTC.
When expression levels were quantified and validated in a separate
comparison cohort, it was observed that aggressive PTCs were
characterized by the differential upregulation of miR-221/222 and
miR-146b-5p in addition to the downregulation of miR-16 and
miR-613. These results suggested a correlation between miR-221/222
and miR-146b-5p upregulation and thyroid carcinoma cell invasion
and metastasis. The results also demonstrated that miR-613 and
miR-16 may be tumor invasion suppressors in PTC. The observations
of miR-221/222 are consistent with numerous previous studies in
breast cancer (9), PTC (10), prostate carcinoma (11) and glioma (12). Although studies concerning
miR-146b-5p are scarce, Geraldo et al(13) demonstrated in their investigation
of a PTC cell line that the overexpression of miR146b-5p rendered
cells resistant to TGF-β-mediated cell-cycle arrest and
significantly increased cell proliferation. In the majority of
studies concerning the miR-146 subtype is bound to miR-146b. Yip
et al(10) and Chou et
al(14) demonstrated that
miR-146b is highly expressed in PTCs with high-risk features,
including extrathyroidal invasion and the
BRAFV600E mutation. In the most recent
study by Chou et al(15) it
was demonstrated that overexpression of miR-146b significantly
increased cell migration and invasiveness. Furthermore, miR-146b
expression was an independent risk factor for poor prognosis in PTC
as the BRAF mutation was not associated with poor prognosis. mir-16
is involved in the tumor stem cell apoptosis process (16) and was downregulated in the invasive
subpopulations compared with the control subpopulations in a study
by Gao et al(17) in human
PTC cell lines. To the best of our knowledge, the present study is
the first to demonstrate that miR-613 is involved in aggressive PTC
and may be tumor suppressive in PTC.
To determine how the deregulated miRNAs affect the
aggressive ability of PTC, GO analysis of mRNA expression was
assessed with a gene expression array. It was demonstrated that
cell adhesion genes involved in invasion and metastasis were
differentially expressed in aggressive PTC compared with
non-aggressive PTC. To identify the validated miRNA targets, a
bioinformatics search (Targetscan, Findtar, MiRanda) for putative
mRNA targets of the miRNAs was conducted. It was also shown that
TIMP3, ZNFR3, FN1 and ITGA2 are direct
targets of miR-221/222, miR-146b-5p, miR-613 and miR-16,
respectively, using the luciferase reporter assay. Furthermore, the
expression levels of the target genes were quantified and validated
by qPCR in a separate comparison cohort. It was observed that
TIMP3 and ZNFR3 gene expression was downregulated
with the upregulation of miR-221/222 and miR-146b-5p, while
FN1 and ITGA2 gene expression was upregulated with
the downregulation of miR-613 and miR-16 in aggressive PTC.
The TIMP3 gene, encoding a metalloproteinase
inhibitor was capable of inhibiting growth, angiogenesis, invasion
and metastasis of several cancers, and was identified to be
silenced by promoter methylation in a consistent fraction of PTCs,
in association with tumor aggressiveness and
BRAFV600E mutation, thus suggesting an
oncosuppressive role (18). The
cell-surface transmembrane E3 ubiquitin ligase zinc and ring finger
3 was demonstrated to be a negative feedback regulator of
Wnt/β-catenin signaling (19).
Aberrant activation of Wnt/β-catenin signaling is involved in the
development of several epithelial tumors, including PTCs (20). In addition, it is also identified
to be a critical factor in the aggressive phenotype of breast
cancer (21,22), colorectal cancer (23,24)
and PTCs (25), characterized by
malignant features, such as increased cell motility, invasiveness
and metastasis (26). Fibronectin
is a protein of the extracellular matrix (ECM), whose remodeling
and degradation may influence changes in tumor growth and
dissemination capacity (27). It
is directly involved in cell proliferation and migration, and
participates in the ECM changes that occur during physiological and
pathological processes via integrin transmembrane receptors,
particularly the integrin α5β1 and
αv subtypes (28,29).
Integrins are a family of surface receptors that mediate
cell-matrix and cell-cell interactions. These receptors consist of
α and β subunits and each subunit has several isoforms that form at
least 25 different integrins (30,31).
Integrin α2β1, also termed platelet
glycoproteinIa-IIa, is expressed by epithelial cells, and its level
of expression in tumor cells is associated with motility,
invasiveness and cell differentiation (31).
In the present study, the target genes observed are
relative to the extracellular matrix or signal transduction
pathways concerning tumorigenesis or aggressiveness of tumors. The
migration and metastasis of cancer cells occurs in three stages,
adherence, degradation and movement (17). Thus, the changes in ECM are pivotal
in the aggressive nature of cancer cells. The results of the
present study demonstrated that when miR-221/222 and miR-146b-5p
were upregulated, the expression of TIMP3 and ZNFR3 were
downregulated and when miR-613 and miR-16 downregulated, the
expression of FN1 and ITGA2 were upregulated, representing a
negative correlation. Thus, the expression levels of the target
genes in the present study may lead to the aggressiveness of PTCs,
including effects on invasion and migration.
The results of the present study emphasize the
importance of miR-221/222, miR-146b-5p, miR-613 and miR-16 in
determining the aggressive properties of PTCs and they may exert
this function through the TIMP3, ZNFR3, FN1
and ITGA2 genes, respectively. Although further studies are
required to analyse the correlation, data from the present study
provides an insight into the involvement of these miRNAs and their
target genes may contribute to the identification of the potential
pathway in aggressive PTC.
Acknowledgements
This study was supported by the National Natural
Science Foundation of China (grant no. 81272935).
References
|
1
|
Davies L and Welch HG: Increasing
incidence of thyroid cancer in the United States, 1973–2002. JAMA.
295:2164–2167. 2006.
|
|
2
|
Hay ID, Thompson GB, Grant CS, et al:
Papillary thyroid carcinoma managed at the Mayo Clinic during six
decades (1940–1999): temporal trends in initial therapy and
long-term outcome in 2444 consecutively treated patients. World J
Surg. 26:879–885. 2002.PubMed/NCBI
|
|
3
|
Bartel DP: MicroRNAs: target recognition
and regulatory functions. Cell. 136:215–233. 2009. View Article : Google Scholar : PubMed/NCBI
|
|
4
|
White NM, Fatoohi E, Metias M, Jung K,
Stephan C and Yousef GM: Metastamirs: a stepping stone towards
improved cancer management. Nat Rev Clin Onco. 8:75–84. 2011.
View Article : Google Scholar : PubMed/NCBI
|
|
5
|
Pallante P, Visone R, Croce CM and Fusco
A: Deregulation of microRNA expression in follicular-cell-derived
human thyroid carcinomas. Endocr Relat Cancer. 17:F91–F104. 2010.
View Article : Google Scholar : PubMed/NCBI
|
|
6
|
Wilson C: Cancer: MicroRNA expression
provides clues about the aggressiveness of papillary thyroid
carcinoma. Nat Rev Endocrinol. 6:4162010. View Article : Google Scholar : PubMed/NCBI
|
|
7
|
Vasko V, Espinosa AV, Scouten W, et al:
Gene expression and functional evidence of
epithelial-to-mesenchymal transition in papillary thyroid carcinoma
invasion. Proc Natl Acad Sci USA. 104:2803–2808. 2007. View Article : Google Scholar : PubMed/NCBI
|
|
8
|
Yang Z, Fan Y, Deng Z, Wu B and Zheng Q:
Amyloid precursor protein as a potential marker of malignancy and
prognosis in papillary thyroid carcinoma. Oncol Lett. 3:1227–1230.
2012.PubMed/NCBI
|
|
9
|
Stinson S, Lackner MR, Adai AT, et al:
miR-221/222 targeting of trichorhinophalangeal 1 (TRPS1) promotes
epithelial-to-mesenchymal transition in breast cancer. Sci Signal.
4:20022582011.PubMed/NCBI
|
|
10
|
Yip L, Kelly L, Shuai Y, et al: MicroRNA
signature distinguishes the degree of aggressiveness of papillary
thyroid carcinoma. Ann Surg Oncol. 18:2035–2041. 2011. View Article : Google Scholar : PubMed/NCBI
|
|
11
|
Zheng C, Yinghao S and Li J: MiR-221
expression affects invasion potential of human prostate carcinoma
cell lines by targeting DVL2. Med Oncol. 29:815–822. 2012.
View Article : Google Scholar : PubMed/NCBI
|
|
12
|
Zhang C, Zhang J, Hao J, et al: High level
of miR-221/222 confers increased cell invasion and poor prognosis
in glioma. J Transl Med. 10:1192012. View Article : Google Scholar : PubMed/NCBI
|
|
13
|
Geraldo MV, Yamashita AS and Kimura ET:
MicroRNA miR-146b-5p regulates signal transduction of TGF-β by
repressing SMAD4 in thyroid cancer. Oncogene. 31:1910–1922.
2012.PubMed/NCBI
|
|
14
|
Chou CK, Chen RF, Chou FF, et al: miR-146b
is highly expressed in adult papillary thyroid carcinomas with high
risk features including extrathyroidal invasion and the
BRAFV600E mutation. Thyroid. 20:489–494. 2010.
View Article : Google Scholar : PubMed/NCBI
|
|
15
|
Chou CK, Yang KD, Chou FF, et al:
Prognostic implications of miR-146b expression and its functional
role in papillary thyroid carcinoma. J Clin Endocrinol Metab.
98:E196–E205. 2013. View Article : Google Scholar : PubMed/NCBI
|
|
16
|
Guo CJ, Pan Q, Li DG, Sun H and Liu BW:
miR-15b and miR-16 are implicated in activation of the rat hepatic
stellate cell: An essential role for apoptosis. J Hepatol.
50:766–778. 2009. View Article : Google Scholar : PubMed/NCBI
|
|
17
|
Gao Y, Wang C, Shan Z, et al: MiRNA
expression in a human papillary thyroid carcinoma cell line varies
with invasiveness. Endocr J. 57:81–86. 2010. View Article : Google Scholar : PubMed/NCBI
|
|
18
|
Anania MC, Sensi M, Radaelli E, et al:
TIMP3 regulates migration, invasion and in vivo tumorigenicity of
thyroid tumor cells. Oncogene. 30:3011–3023. 2011. View Article : Google Scholar : PubMed/NCBI
|
|
19
|
Hao HX, Xie Y, Zhang Y, et al: ZNRF3
promotes Wnt receptor turnover in an R-spondin-sensitive manner.
Nature. 485:195–200. 2012. View Article : Google Scholar : PubMed/NCBI
|
|
20
|
Sastre-Perona A and Santisteban P: Role of
the Wnt pathway in thyroid cancer. Front Endocrinol (Lausanne).
3:312012.PubMed/NCBI
|
|
21
|
Ponzo MG, Lesurf R, Petkiewicz S, et al:
Met induces mammary tumors with diverse histologies and is
associated with poor outcome and human basal breast cancer. Proc
Natl Acad Sci USA. 106:12903–12908. 2009. View Article : Google Scholar : PubMed/NCBI
|
|
22
|
Previdi S, Maroni P, Matteucci E, Broggini
M, Bendinelli P and Desiderio MA: Interaction between human-breast
cancer metastasis and bone microenvironment through activated
hepatocyte growth factor/Met and beta-catenin/Wnt pathways. Eur J
Cancer. 46:1679–1691. 2010. View Article : Google Scholar
|
|
23
|
Strillacci A, Valerii MC, Sansone P, et
al: Loss of miR-101 expression promotes Wnt/β-catenin signaling
pathway activation and malignancy in colon cancer cells. J Pathol.
229:379–389. 2013.PubMed/NCBI
|
|
24
|
Bandapalli OR, Dihlmann S, Helwa R, et al:
Transcriptional activation of the β-catenin gene at the invasion
front of colorectal liver metastases. J Pathol. 218:370–379.
2009.
|
|
25
|
Cho SW, Lee EJ, Kim H, et al: Dickkopf-1
inhibits thyroid cancer cell survival and migration through
regulation of β-catenin/E-cadherin signaling. Mol Cell Endocrinol.
366:90–98. 2013.PubMed/NCBI
|
|
26
|
Kalluri R and Weinberg RA: The basics of
epithelial - mesenchymal transition. J Clin Invest. 119:1420–1428.
2009. View
Article : Google Scholar : PubMed/NCBI
|
|
27
|
de Viana LS, Affonso RJ Jr, Silva SR, et
al: Relationship between the expression of the extracellular matrix
genes SPARC, SPP1, FN1, ITGA5 and ITGAV and clinicopathological
parameters of tumor progression and colorectal cancer
dissemination. Oncology. 84:81–91. 2013.
|
|
28
|
Alexi X, Berditchevski F and Odintsova E:
The effect of cell-ECM adhesion on signalling via the ErbB family
of growth factor receptors. Biochem Soc Trans. 39:568–573. 2011.
View Article : Google Scholar : PubMed/NCBI
|
|
29
|
Foubert P and Varner JA: Integrins in
tumor angiogenesis and lymphangiogenesis. Methods Mol Biol.
757:471–486. 2012. View Article : Google Scholar : PubMed/NCBI
|
|
30
|
Zhang H, Guo F and Zhu G: Involvement of
host cell integrin α2 in Cryptosporidium parvum infection.
Infect Immun. 80:1753–1758. 2012.
|
|
31
|
Chen J, Liu NN, Li JQ, et al: Association
between ITGA2 C807T polymorphism and gastric cancer risk. World J
Gastroenterol. 17:2860–2866. 2011.PubMed/NCBI
|