Introduction
Lung cancer is the most commonly diagnosed
malignancy and is the leading cause of mortality among all types of
cancer. Every year, lung cancer contributes to more than one
million mortalities worldwide, among which non-small cell lung
cancer (NSCLC) accounts for 85% of cases (1,2).
NSCLC can be divided into three types, including adenocarcinoma,
large cell lung carcinoma and squamous cell carcinoma (3). Each of these share a common set of
carcinoma characteristics. Cell lines derived from each of the main
lung tumor types are widely used as experimental models in lung
cancer biology (4). Reverse
transcription-quantitative polymerase chain reaction (RT-qPCR) has
revolutionized the field of gene expression analysis in living
organisms (5). The main advantages
of RT-qPCR are its superior specificity, sensitivity and broad
quantification range (6,7). Despite being a useful technique,
there are challenges coupled with its use, an important one being
the normalization with an accurate and reliable reference gene,
referred to as a housekeeping gene (HKG) (8,9). The
term housekeeping gene was initially used to describe genes that
are essential for cell function. Ideal HKGs are stably expressed in
each cell type, do not respond to external stimuli and exhibit
little or no run-to-run or sample-to-sample RT-qPCR variation. They
are an internal reference to which target gene expression can be
associated in order to correct unspecific variation caused by an
imprecise amount of input RNA, RNA degradation or the presence of
reaction inhibitors (8,10). Reference genes are often selected
from the literature and are used across several experimental
conditions, some of which may enhance the differences in the
expression of a reference gene under certain conditions. Previous
studies have indicated that certain commonly used HKGs, including
β-actin (ACTB) and glyceraldehyde-3-phosphate dehydrogenase
(GAPDH) are differentially expressed in various tissues
(11–13). The reliability of normalized data
is reliant on the robustness of reference genes. If unrecognized,
unexpected changes in the expression of reference genes could
result in flawed conclusions of real biological effects. Therefore,
identification of stable and reliable reference genes is a
prerequisite to any reliable analysis of RT-qPCR data. Numerous
reference genes, including GADPH, ACTB,
β-2-microglobulin (B2M) and ribosomal protein large P0
(RPLPO) have been identified, and their suitability for gene
expression studies in diverse human tissue and cell types has been
validated (14–17). RT-qPCR has been used in lung cancer
studies to enumerate the expression of predictive and or prognostic
targets (18). In the present
study, three types of lung cancer cell lines (NCI-H A549, NCI-H446
and NCI-H460) were assembled and 10 common HKGs, including 18S,
GAPDH, RPLP0, ACTB, peptidylprolyl isomerase A
(PPIA), phosphoglycerate kinase-1 (PGK1), B2M,
ribosomal protein LI3a (RPL13A), hypoxanthine phosphoribosyl
transferase-1 (HPRT1) and TATA box binding protein
(TBP) (Table I) were
selected in order to examine their stability and suitability for
RT-qPCR normalization in NSCLC using three common statistical
algorithms, NormFinder, geNorm and BestKeeper. Candidate HKGs were
selected on the basis of two criteria: i) their previous use as a
reference gene and ii) their ability to cover a wide expression
spectrum.
 | Table ICandidate reference genes and their
respective symbols and functions used in the present study. |
Table I
Candidate reference genes and their
respective symbols and functions used in the present study.
| Symbol | Name | Function |
|---|
| 18S | 18s ribosomal
RNA | Component of the
40s ribosomal subunit |
| GAPDH |
Glyceraldehyde-3-phosphate
dehydrogenase | Oxidoreductase in
glycolysis and gluconeogenesis |
| RPLP0 | Ribosomal protein
large P0 | Component of the
60s ribosomal subunit |
| ACTB | β-actin | Protein involved in
various types of cell motility |
| PPIA | Peptidylprolyl
isomerase A, cydophilin A, romatase A | Accelerates the
folding of proteins, catalyzes the cis-tans isomerization of
proline imidic peptide bonds in oligopeptides |
| PGK1 | Phosphoglycerate
kinase-1 | Enzyme involved in
glycolysis |
| B2M |
β-2-microglobulin | Component of major
histocompatibility complex class 1 molecules |
| RPL13A | Ribosomal protein
LI3a | Structural
component of the large 60S ribosomal subunit |
| HPRT1 | Hypoxanthine
phosphoribosyl transferase-1 | Enzyme involved in
purine synthesis in salvage pathway |
| TBP | TATA box binding
protein | General RNA
polymerase 11 transcription factor |
Materials and methods
Cell lines
Human lung cancer cell lines A549 and NCI-H446 were
purchased from the American Type Culture Collection (Manassas, VA,
USA) and NCI-H460 was provided by the Central Gene Therapy
Department of China-Japan Union Hospital, Jilin University
(Changchun, Jilin, China). Cells were cultured in RPMI-1640 medium
(Gibco-BRL, Carslbad, CA, USA), supplemented with 10% fetal bovine
serum (Gibco-BRL) and 100 units of penicillin (Sigma-Aldrich, St.
Louis, MO, USA), and maintained at 37°C in a 5% CO2
humidified atmosphere.
RNA extraction
The cell lines A549, NCI-H446 and NCI-H460 were
cultured for 72 h, and total RNA was extracted from each cell using
TRIzol reagent (Takara Bio, Inc., Shiga, Japan) according to the
manufacturer’s instructions. Briefly, 1 ml of TRIzol reagent was
used to homogenize the cells (~2×10⁶). Samples were
thoroughly mixed and incubated at room temperature for 5 min. The
samples were then treated with 0.2 ml chloroform (Haodeng
Industrial Co., Ltd, Shanghai, China) by reverse mixing. Phase
separation was performed by placing the samples at room temperature
for 5 min followed by centrifugation at 12,000 × g and 4°C for 15
min. The aqueous layer was mixed with 0.5 ml isopropanol (Haodeng
Industrial Co., Ltd) to precipitate the RNA. Samples were placed at
room temperature for 10 min and centrifuged at 12,000 × g and 4°C
for 10 min. The RNA pellet was washed with 1 ml 75% alcohol and
centrifuged at 10,000 × g and 4°C for 5 min. The pellet was air
dried and resuspended with DNA/RNAase free water. The purity and
concentration of RNA was determined using NanoDrop 1000 (Thermo
Scientific, Waltham, MA, USA) spectrophotometry.
Complementary DNA (cDNA) synthesis
Total RNA (1 μg) from each cell group was
reverse-transcribed to cDNA using a First Strand cDNA Synthesis kit
(GeneCopoeia, Guangzhou, China) according to the manufacturer’s
instructions. The cDNA was stored at −20°C.
Quantitative PCR
For RT-qPCR analysis, SYBR Green Premix EX Taq
(Takara Bio, Inc.) was used in a reaction mixture that comprised 5
pmol of each gene-specific primer and 40 ng of cDNA sample, in a
final volume of 20 μl. The primer sequences used (Table II) were synthesized by Sangon
Biotech Co., Ltd. (Shanghai, China). RT-qPCR was performed using an
AB Prism 7500 PCR detection system (Applied Biosystems, Foster
City, CA, USA), under the following conditions: 30 sec of
polymerase activation at 95°C followed by 40 cycles of denaturation
at 95°C for 5 sec, annealing at 58°C for 60 sec and elongation at
72°C for 30 sec. Each assay was performed three times. The RT-PCR
products were then subjected to 1% agarose gel electrophoresis
containing ethidium bromide.
| Table IIPrimer sequences, product sizes and
PCR efficiencies of candidate reference genes. |
Table II
Primer sequences, product sizes and
PCR efficiencies of candidate reference genes.
| Symbol | Forward primer | Reverse primer | Product size
(bp) | PCR efficiency |
|---|
| 18S |
GTGGAGCGATTTGTCTGGTT |
AACGCCACTTGTCCCTCTAA | 115 | 1.90 |
| GAPDH |
ATGGGGAAGGTGAAGGTCG |
GGGGTCATTGATGGCAACAATA | 108 | 1.99 |
| RPLP0 |
CTGGAAGTCCAACTACTTCCT |
CATCATGGTGTTCTTGCCCAT | 160 | 2.74 |
| ACTB |
GAAGATCAAGATCATTGCTCCT |
TACTCCTGCTTGCTGATCCA | 111 | 1.89 |
| PPIA |
TCCTGGCATCTTGTCCAT |
TGCTGGTCTTGCCATTCCT | 179 | 2.10 |
| PGK1 |
GCCACTTGCTGTGCCAAATG |
CCCAGGAAGGACTTTACCTT | 102 | 2.62 |
| B2M |
CTATCCAGCGTACTCCAAAG |
GAAAGACCAGTCCTTGCTGA | 188 | 2.08 |
| RPL13A |
CGAGGTTGGCTGGAAGTACC |
CTTCTCGGCCTGTTTCCGTAG | 121 | 2.00 |
| HPRT1 |
CCTGGCGTCGTGATTAGTGAT |
AGACGTTCAGTCCTGTCCATAA | 131 | 1.78 |
| TBP |
GCACAGGAGCCAAGAGTGA |
GTTGGTGGGTGAGCACAAG | 174 | 2.10 |
Statistical analysis
Data analysis was performed using ABI 7500 SDS
system software (version 1.4; Applied Biosystems). All biological
replicates were used to calculate the average threshold cycle (Ct)
values. The stability of the 10 candidate reference genes was
comprehensively evaluated using NormFinder (version 0953;
http://moma.dk/normfinder-software)
(16) algorithms, geNorm (version
3.4; http://medgen.ugent.be/~jvdesomp/genorm/) (19) and BestKeeper (version 1; http://www.gene-quantification.com/bestkeeper.html)
(20,21). In order to enter the Ct values into
geNorm and NormFinder software, the (Ct) values were converted into
relative quantities using the following formula: 2−ΔCt
(ΔCt=Ct-lowest Ct). The raw data was entered into the BestKeeper
program and RT-qPCR efficiency was determined for each primer pair
using slope analysis with a linear regression model. Relative
standard curves for transcripts were performed with serial
dilutions of cDNA at 1/2.5, 1/5, 1/10 and 1/20 ng. The
corresponding RT-qPCR efficiencies (E) were calculated according to
the following equation: E = 2 - 1/slope.
Results
RNA purity and concentration
All RNA samples were examined for their purity and
concentration. The absorbance ratio at 260/280 nm was 1.85–1.95 for
each RNA sample group, reflecting high purity and
concentration.
RT-qPCR efficiency of each primer
pair
The RT-qPCR efficiency of each primer pair was
determined by serial dilution. The results demonstrated that the
efficiencies of the HKGs of interest ranged between 1.78
(HPRT1) and 2.74 (RPLP0) for each primer pair
(Table II).
Candidate reference gene expression
levels and ranges
In general, the 10 candidate reference genes
revealed wide expression levels with mean Ct values in a range that
is usually covered by HKGs, varying between 17.5 (ACTB) and
25.5 (TBP) among the three groups of lung cancer cell lines.
18S revealed the lowest variability of Ct among all groups of the
three cell lines (Fig. 1). The
dissociation curve of each target reference gene demonstrated one
single peak, which confirmed the specific amplification of the
target reference gene (Fig. 2A).
The gel electrophoresis results demonstrated one single band which
further confirmed the specific RT-qPCR amplification of the target
reference gene (Fig. 2B).
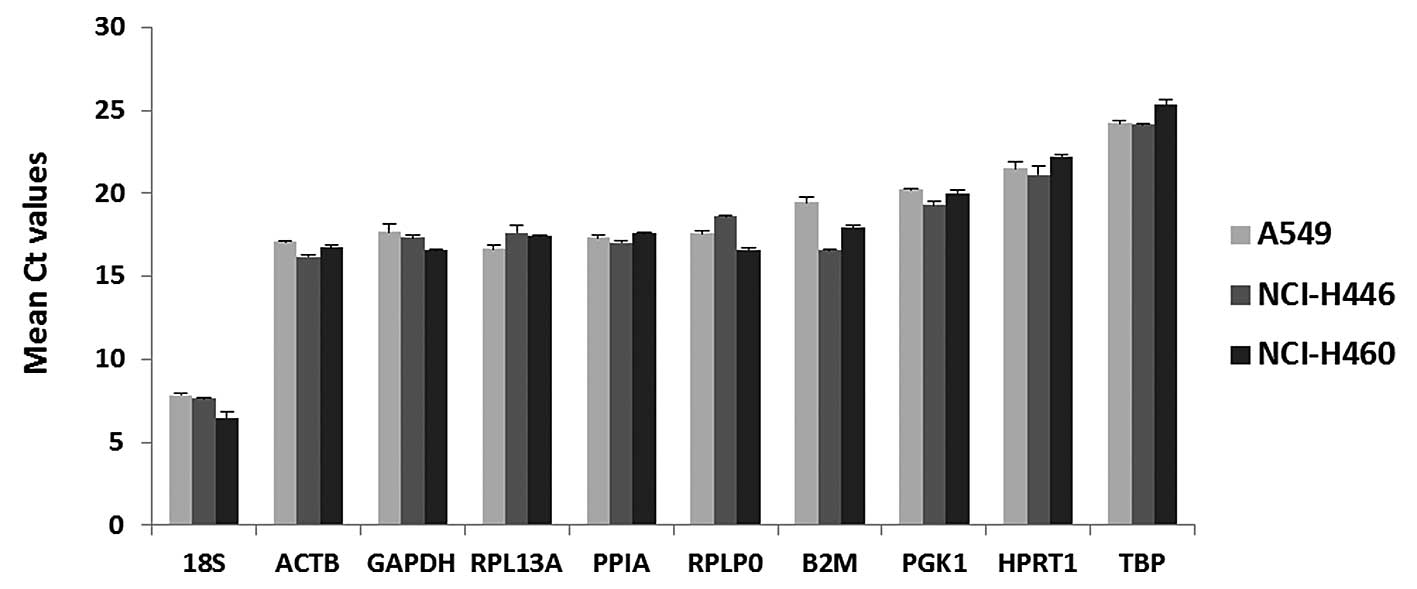 | Figure 1Mean Ct values of the candidate
reference genes among experimental samples. Ct, threshold cycle;
ACTB, β-actin; GADPH, glyceraldehyde-3-phosphate
dehydrogenase; RPL13A, ribosomal protein LI3a; PPIA,
peptidylprolyl isomerase A; RPLP0, ribosomal protein large
P0; B2M, β-2-microglobulin; PGK1, phosphoglycerate
kinase-1; HPRT1, hypoxanthine phosphoribosyl transferase-1;
TBP, TATA box binding protein. |
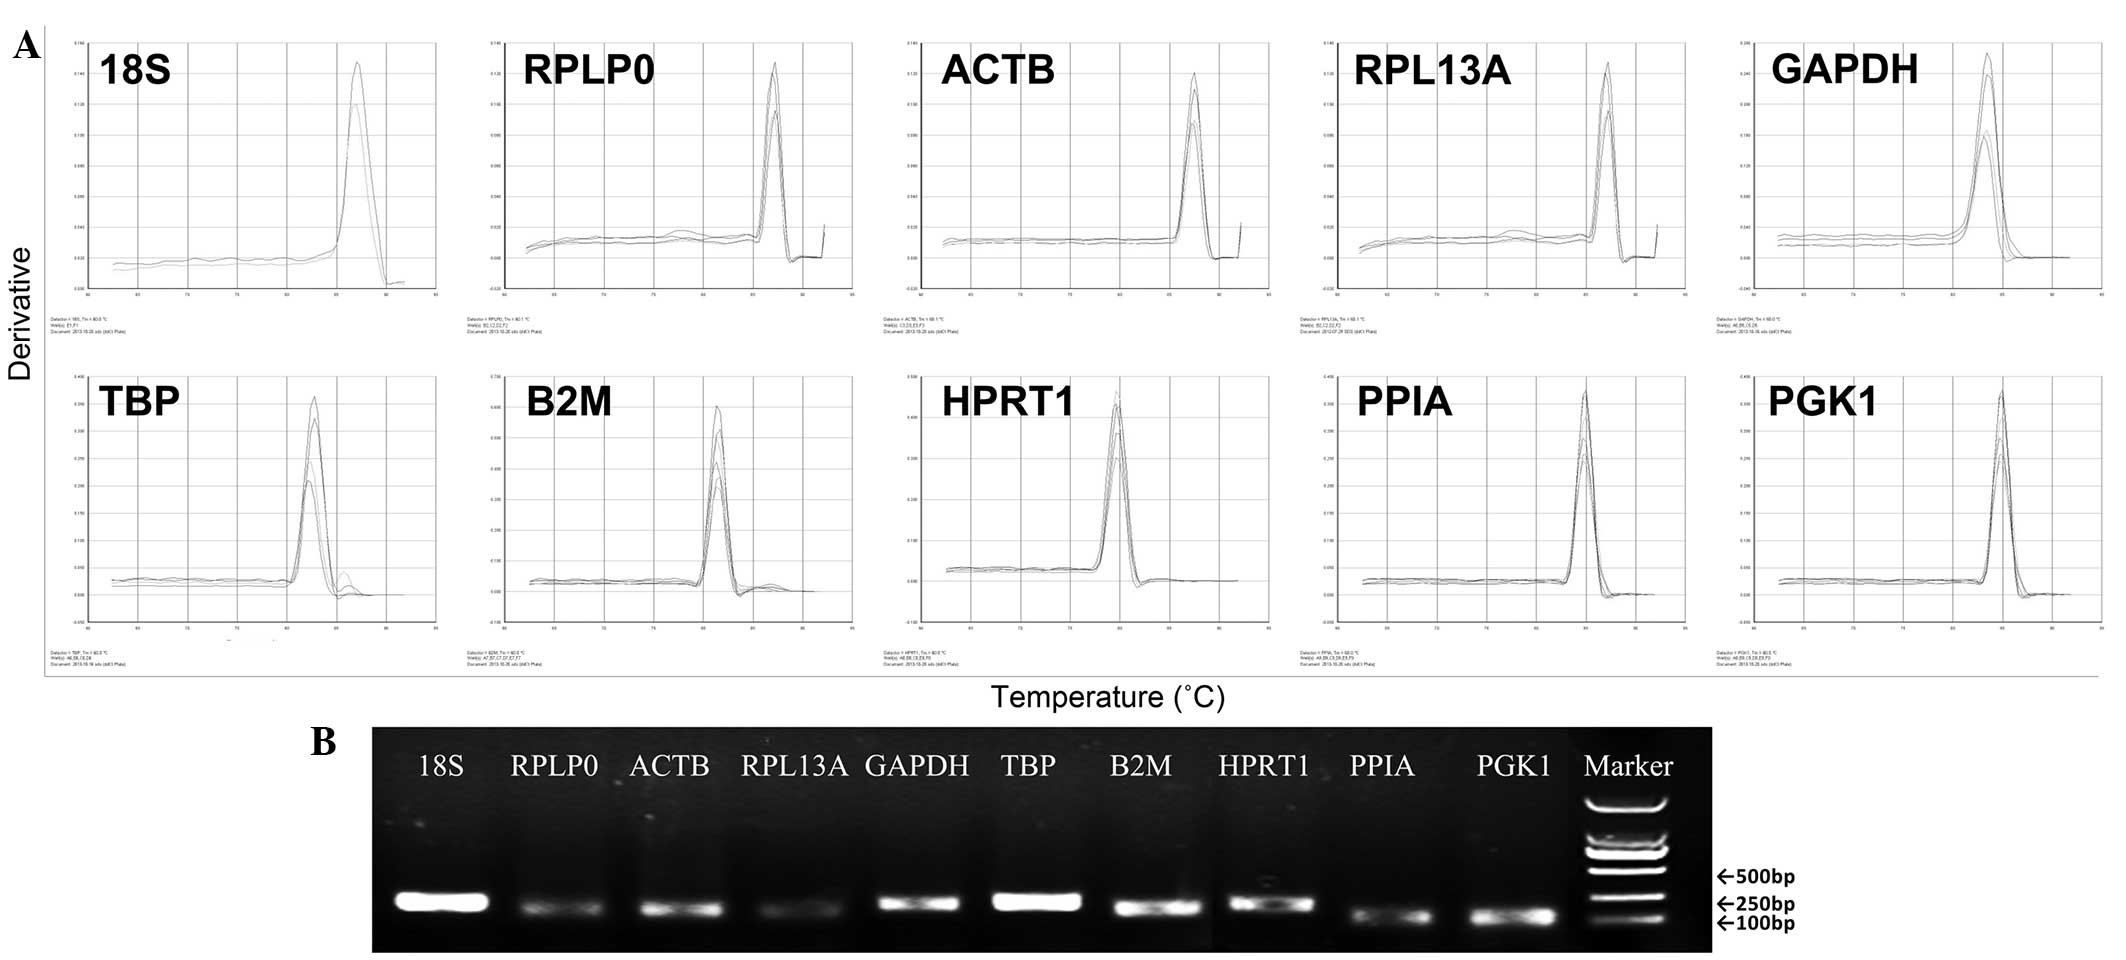 | Figure 2Reverse transcription-quantitative
polymerase chain reaction product of each of the 10 target
reference genes. (A) Dissociation curves of each of the 10 target
reference genes. (B) 1% agarose gel electrophoresis of amplified
fragments. Bp, base pairs; ACTB, β-actin; GADPH,
glyceraldehyde-3-phosphate dehydrogenase; RPL13A, ribosomal
protein LI3a; PPIA, peptidylprolyl isomerase A;
RPLP0, ribosomal protein large P0; B2M,
β-2-microglobulin; PGK1, phosphoglycerate kinase-1;
HPRT1, hypoxanthine phosphoribosyl transferase-1;
TBP, TATA box binding protein. |
Candidate HKG expression stability
The expression stability of each of the 10 reference
genes was analyzed using three commonly used software programs,
geNorm, NormFinder and BestKeeper.
geNorm analysis
The geNorm software program is an Excel based
program that calculates and compares the gene expression stability
measure (M) of all candidate genes, and excludes genes with an
M-value >1.5. The lower the M value the higher the gene
expression stability and repeats the calculations until there are
two genes remaining. The M value indicates the average pairwise
variation of a gene compared with all the other candidate genes. In
order to determine the maximum number of genes necessary for
adequate normalization in each panel of the experiment, geNorm
determines pairwise variation (V) Vn/Vn + 1.V = 0.15 which is used
as a cut-off value. A value <0.15 indicates the number of
control genes that is sufficient for valid normalization (Fig. 3A). The results demonstrated that
the M-value for each of the 10 reference genes was <1.5, thus
there was no exclusion. The most stable genes were ACTB and
PGK1, followed by PPIA, while the gene with the least
expression stability was B2M followed by RPLP0
(Fig. 3A).
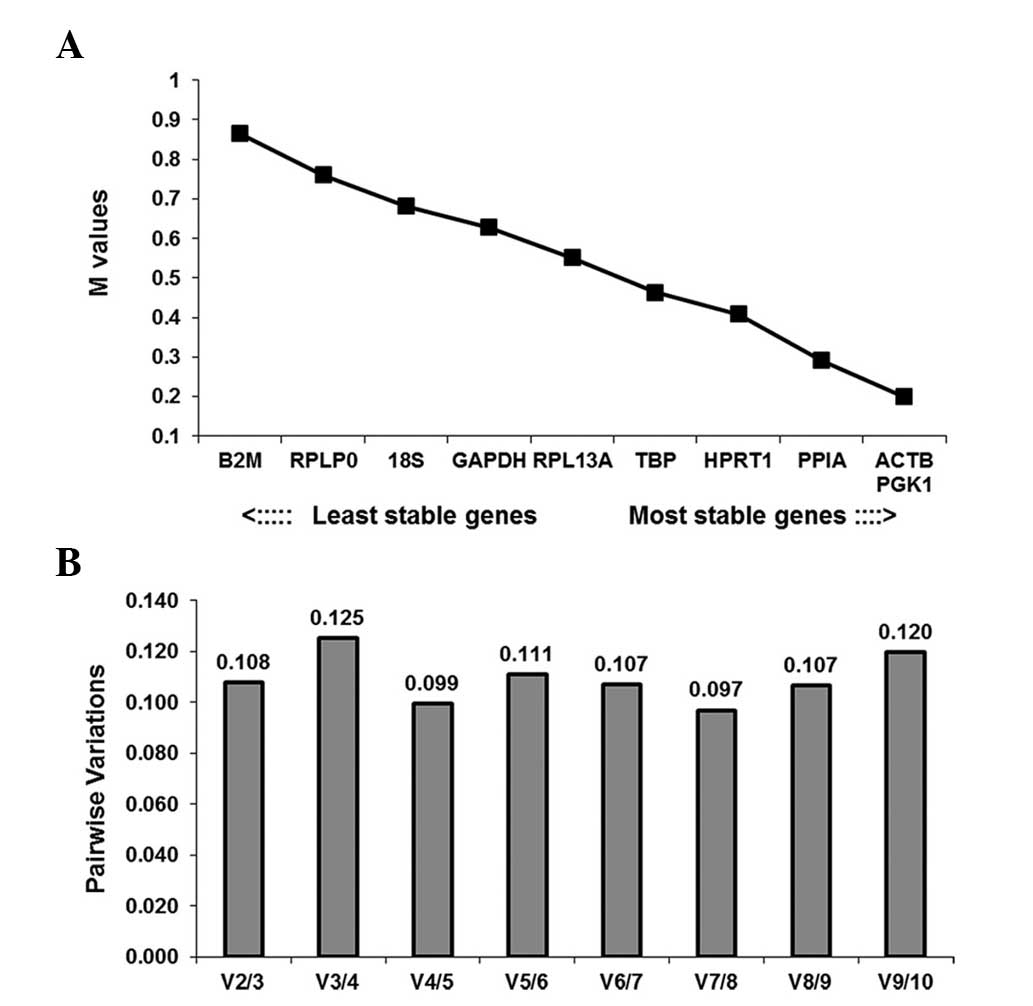 | Figure 3Stability values of the candidate
control genes analyzed by geNorm. (A) Determination of the optimal
number of control genes. The software calculates the normalization
factor from the least two stable genes at which the variable
defines the pairwise variation between two sequential normalization
factors. (B) M value of the 10 candidate reference genes analyzed
by geNorm software. The x-axis from left to right indicates the
ranking of the genes according to their stability; lower M values
indicate higher stability. M, gene expression stability measure; V,
variation; ACTB, β-actin; GADPH,
glyceraldehyde-3-phosphate dehydrogenase; RPL13A, ribosomal
protein LI3a; PPIA, peptidylprolyl isomerase A;
RPLP0, ribosomal protein large P0; B2M,
β-2-microglobulin; PGK1, phosphoglycerate kinase-1;
HPRT1, hypoxanthine phosphoribosyl transferase-1;
TBP, TATA box binding protein. |
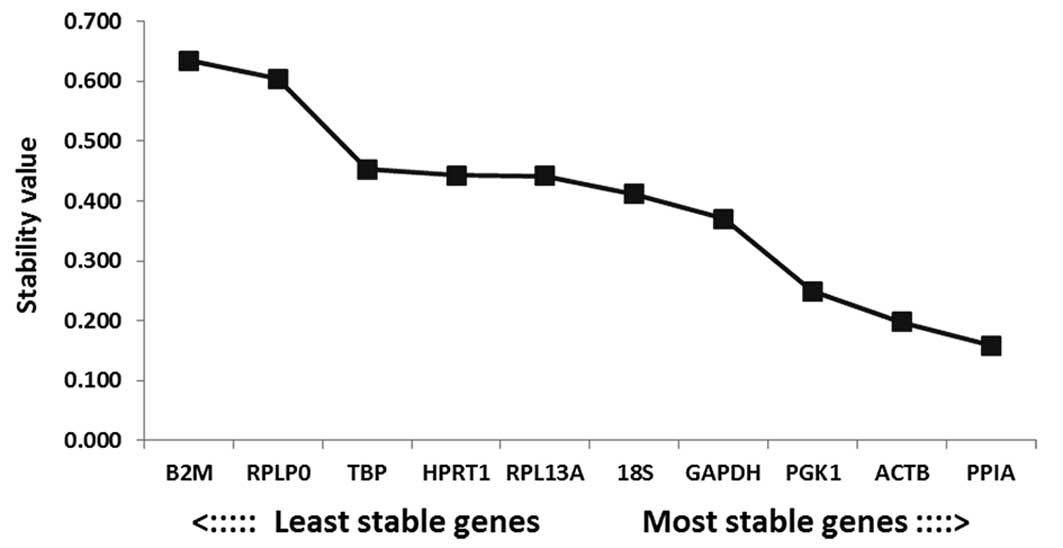
NormFinder analysis
The NormFinder software calculates the stability
value based on an estimation of intra and intergroup variation for
the analyzed genes. A low stability value has a low gene expression
variance and indicates high stability expression. The output of
this software analysis revealed that the most stable gene was
PPIA followed by ACTB and PGK1. The least
stable gene expression was B2M followed by RPLP0
(Fig. 4). These results were
consistent with the geNorm analysis output.
BestKeeper analysis
BestKeeper is an excel based tool that assesses the
stability of candidate HKGs based on the inspection of calculated
variation, including the standard deviation (SD) (22) and the coefficient of variance
values (Table III). According to
the BestKeeper program, the lowest variations revealed the highest
stability. Genes with an SD >1 are considered to have an
unacceptable range of variation (Fig.
5A). The analysis demonstrated that all 10 candidate HKGs had
an SD ≤1. GAPDH was the most stable, followed by 18S.
HPRT1 was the least stable, followed by PPIA
(Fig. 5B). The results from the
BestKeeper software were therefore inconsistent with those of the
geNorm and NormFinder software. A summary of the rankings produced
by each of the three software programs is exhibited in Table IV.
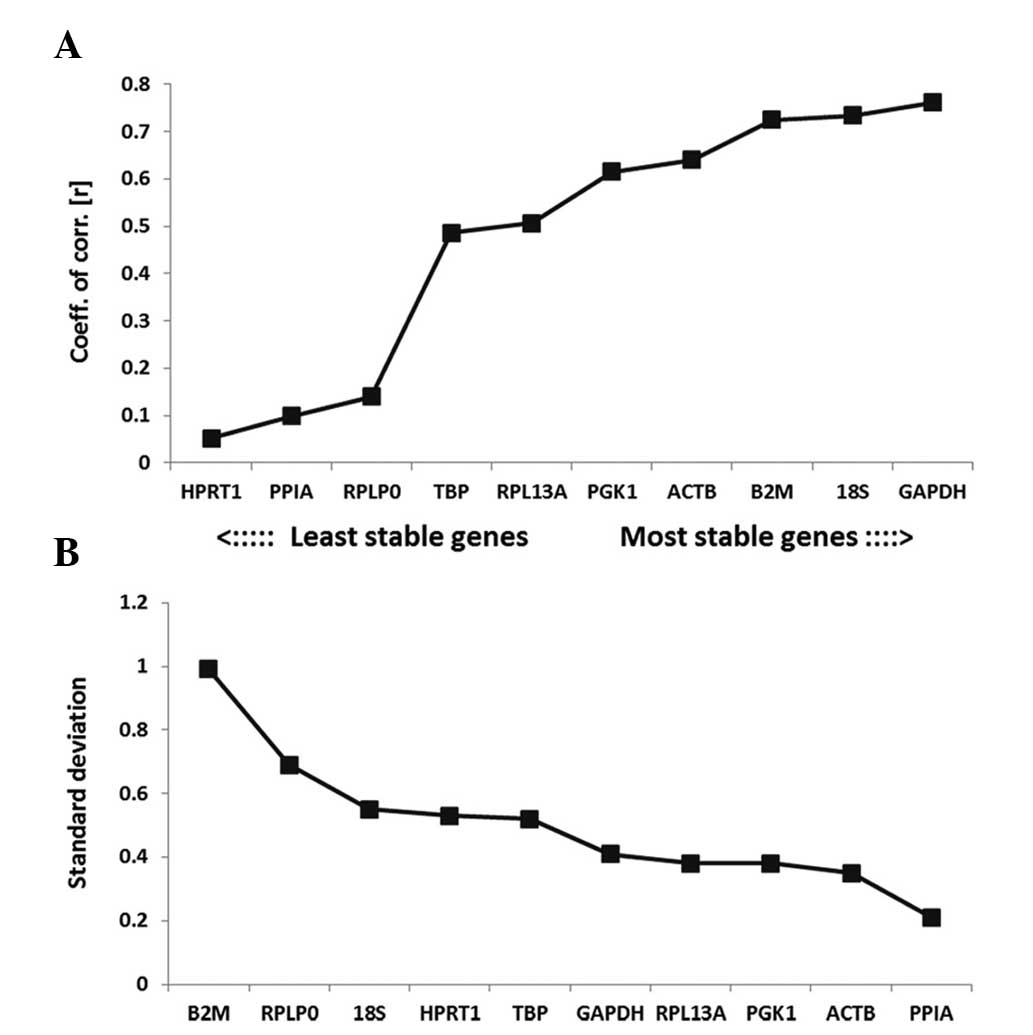 | Figure 5BestKeeper results for candidate
reference genes. (A) SD was plotted on the y-axis. Genes with an SD
>1.00 were excluded from further analysis. (B) Coefficient of
correlation was plotted on the y-axis. A higher coefficient of
correlation indicates a more stably expressed gene. SD, standard
deviation; ACTB, β-actin; GADPH,
glyceraldehyde-3-phosphate dehydrogenase; RPL13A, ribosomal
protein LI3a; PPIA, peptidylprolyl isomerase A;
RPLP0, ribosomal protein large P0; B2M,
β-2-microglobulin; PGK1, phosphoglycerate kinase-1;
HPRT1, hypoxanthine phosphoribosyl transferase-1;
TBP, TATA box binding protein. |
| Table IIIDescriptive statistical analysis of
candidate reference genes analyzed by BestKeeper software. |
Table III
Descriptive statistical analysis of
candidate reference genes analyzed by BestKeeper software.
| 18S | ACTB | GAPDH | RPL13A | PPIA | RPLP0 | B2M | PGK1 | HPRT1 | TBP |
|---|
| N=12 | 12 | 12 | 12 | 12 | 12 | 12 | 12 | 12 | 12 | 12 |
| Geo mean (CP) | 7.29 | 16.65 | 17.18 | 17.22 | 17.31 | 17.58 | 17.96 | 19.81 | 21.60 | 24.56 |
| Ar mean (CP) | 7.32 | 16.65 | 17.19 | 17.23 | 17.31 | 17.60 | 18.00 | 19.82 | 21.61 | 24.57 |
| Min (CP) | 6.24 | 16.06 | 16.48 | 16.39 | 17.01 | 16.50 | 16.50 | 19.04 | 20.80 | 24.07 |
| Max (CP) | 7.98 | 17.14 | 18.14 | 18.24 | 17.70 | 18.63 | 19.75 | 20.29 | 22.34 | 25.73 |
| SD (±CP) | 0.55 | 0.35 | 0.41 | 0.38 | 0.21 | 0.69 | 0.99 | 0.38 | 0.53 | 0.52 |
| CV (% CP) | 7.49 | 2.09 | 2.38 | 2.23 | 1.22 | 3.94 | 5.53 | 1.94 | 2.44 | 2.13 |
| Min (x-fold) | −2.07 | −1.50 | −1.62 | −1.78 | −1.23 | −2.12 | −2.74 | −1.71 | −1.74 | −1.41 |
| Max (x-fold) | 1.60 | 1.41 | 1.95 | 2.03 | 1.31 | 2.07 | 3.47 | 1.39 | 1.67 | 2.25 |
| SD (± x-fold) | 1.46 | 1.27 | 1.33 | 1.3 | 1.16 | 1.62 | 1.99 | 1.30 | 1.44 | 1.44 |
| Coeff. of corr.
(r) | 0.73 | 0.64 | 0.76 | −0.51 | 0.10 | 0.14 | 0.72 | 0.62 | −0.05 | −0.49 |
| Table IVRanking of candidate control genes
using BestKeeper, NormFinder and geNorm software programs. |
Table IV
Ranking of candidate control genes
using BestKeeper, NormFinder and geNorm software programs.
| geNorm | NormFinder | BestKeeper |
|---|
| ACTB,
PGK1 | PPIA | GAPDH |
| ACTB | 18S |
| PPIA | PGK1 | B2M |
| HPRT1 | GAPDH | ACTB |
| TBP | 18S | PGK1 |
| RPL13A | RPL13A | RPL13A |
| GAPDH | HPRT1 | TBP |
| 18S | TBP | RPLP0 |
| RPLP0 | RPLP0 | PPIA |
| B2M | B2M | HPRT1 |
Discussion
Lung cancer is the most common type of cancer and
the most common cause of cancer-related mortality worldwide
(23). NSCLC is a highly fatal
disease with a poor prognosis and low survival rate (24). To increase the survival rate of
patients with NSCLC, the disease must be diagnosed as early as
possible. Lung tumor cell lines have been widely dispersed to and
used in experimental studies, including DNA sequencing (25), microRNA and microarray analyses
(26,27) and detection of genome-wide
methylated sequences (28,29). Previous RT-qPCR has been
demonstrated to be useful for early NSCLC diagnosis, prognosis,
prediction and gene expression analysis (30). The use of RT-qPCR technology to
study gene expression levels requires reliable normalization of
data to avoid unspecific variability caused by the differences in
cDNA quantity and/or quality, incorrect interpretation of
experimental results and mistaken analyses. Although diverse
methods are employed to normalize RT-qPCR, it remains one of the
main challenges in the efficacy of this technique (31). The identification of internal
control gene(s) is therefore essential for accurate quantification
of target mRNA by RT-qPCR in a given set of experimental samples
(32). Statistical software,
including NormFinder, BestKeeper and geNorm has been developed to
identify the stability of reference genes in a given set of
biological samples. Several studies have used these software
programs in the assessment of diverse HKGs to ascertain their
suitability as reference genes for normalization of qPCR data
(17,33). The present study examined the RNA
transcription levels of 10 common housekeeping genes, including
18S, GAPDH, RPLP0, ACTB, PPIA,
PGK1, B2M, RPL13A, HPRT1 and TBP
(Table I) in the NSCLC cell lines
NCI-H A549, NCI-H446 and NCI-H460. The three statistical softwares
NormFinder, BestKeeper and geNorm (34) were used to assess the expression
level stabilities of candidate reference genes. These programs use
different calculation algorithms and therefore may provide
different results (35,36). The present study demonstrated the
following i) the purity and concentration of total RNA extracted
from the abovementioned cell lines using TRIzol reagent; ii) the
expression levels of the 10 reference genes determined in the above
cell lines using qPCR and iii) the expression stability of the
candidate reference genes in the above cell lines using geNorm,
NormFinder and BestKeeper programs. In general, the present study
demonstrated that almost all 10 candidate reference genes analyzed
by the three independent programs could be used for future studies
using lung cancer cell lines. This finding was somewhat in
concordance with a previous study by Jacob et al (34). The analysis result of NormFinder
was consistent with geNorm analysis output; both identified that
ACTB, PGK1 and PPIA were the most stable
reference genes. By contrast, B2M and RPLP0 were the
least stable. BestKeeper analysis revealed that GAPDH, 18S
and B2M were the most stable and RPLP0, PPIA
and HPRT1 were the least stable reference genes. This was
consistent with previous studies demonstrating that GADPH
and 18S were the most stable reference genes in NSCLC (31,37).
By contrast, another previous study using lung tissue samples
demonstrated that GADPH and HPRT1 were the least
stable reference genes (38).
Variations obtained from these three programs were expected given
their distinct statistical algorithms. NormFinder and geNorm use
relative quantities transformed from Ct values for stability
calculation whereas BestKeeper uses Ct values directly, which may
explain the different outputs from these three software programs
(38). Several previous studies on
reference gene selection for lung cancer also identified
discrepancies between these programs (20,37)
and there was no agreement regarding which was the best method. Few
experimental studies have analyzed the stability of potential
reference genes in lung cancer cell lines. To the best of our
knowledge, no previous study has analyzed 10 reference genes in
lung cancer cell lines using three different statistical software
programs. The present study concluded that ACTB, PPIA
and PGK1 were the most stable reference genes analyzed by
the three statistical programs geNorm, NormFinder and BestKeeper.
These findings were somewhat inconsistent with those of previous
studies and it was not possible to determine a single universal
reference gene. Therefore, it is suggested that appropriate
reference genes require selection on the basis of specific
requirements and study conditions and in consideration of the
characteristics of target genes in practical applications.
Acknowledgements
This study was supported in part by grants from the
Scientific Research Foundation of Jilin Province (nos. 20100942,
20110740 and 2013727038YY) and a grant from the Scientific Research
Foundation of Jilin Province Development and Reform Commission (no.
2013c014-4).
References
|
1
|
Koutsokera A, Kiagia M, Saif MW, Souliotis
K and Syrigos KN: Nutrition habits, physical activity and lung
cancer: an authoritative review. Clin Lung Cancer. 14:342–350.
2013. View Article : Google Scholar : PubMed/NCBI
|
|
2
|
Perroud MW Jr, Honma HN, Barbeiro AS, et
al: Mature autologous dendritic cell vaccines in advanced non-small
cell lung cancer: a phase I pilot study. J Exp Clin Cancer Res.
30:652011. View Article : Google Scholar : PubMed/NCBI
|
|
3
|
Travis WD: Pathology of lung cancer. Clin
Chest Med. 32:669–692. 2011. View Article : Google Scholar : PubMed/NCBI
|
|
4
|
Watanabe T, Miura T, Degawa Y, et al:
Comparison of lung cancer cell lines representing four
histopathological subtypes with gene expression profiling using
quantitative real-time PCR. Cancer Cell Int. 10:22010. View Article : Google Scholar : PubMed/NCBI
|
|
5
|
Guenin S, Mauriat M, Pelloux J, Van
Wuytswinkel O, Bellini C and Gutierrez L: Normalization of qRT-PCR
data: the necessity of adopting a systematic, experimental
conditions-specific, validation of references. J Exp Bot.
60:487–493. 2009. View Article : Google Scholar : PubMed/NCBI
|
|
6
|
Dheda K, Huggett JF, Bustin SA, Johnson
MA, Rook G and Zumla A: Validation of housekeeping genes for
normalizing RNA expression in real-time PCR. Biotechniques.
37:112–114. 2004.PubMed/NCBI
|
|
7
|
Hendriks-Balk MC, Michel MC and Alewijnse
AE: Pitfalls in the normalization of real-time polymerase chain
reaction data. Basic Res Cardiol. 102:195–197. 2007. View Article : Google Scholar : PubMed/NCBI
|
|
8
|
Eisenberg E and Levanon EY: Human
housekeeping genes, revisited. Trends Genet. 29:569–574. 2013.
View Article : Google Scholar : PubMed/NCBI
|
|
9
|
Arenas-Hernandez M and Vega-Sanchez R:
Housekeeping gene expression stability in reproductive tissues
after mitogen stimulation. BMC Res Notes. 6:2852013. View Article : Google Scholar : PubMed/NCBI
|
|
10
|
Huggett J, Dheda K, Bustin S and Zumla A:
Real-time RT-PCR normalisation; strategies and considerations.
Genes Immun. 6:279–284. 2005. View Article : Google Scholar : PubMed/NCBI
|
|
11
|
Barber RD, Harmer DW, Coleman RA and Clark
BJ: GAPDH as a housekeeping gene: analysis of GAPDH mRNA expression
in a panel of 72 human tissues. Physiol Genomics. 21:389–395. 2005.
View Article : Google Scholar : PubMed/NCBI
|
|
12
|
Bas A, Forsberg G, Hammarstrom S and
Hammarstrom ML: Utility of the housekeeping genes 18S rRNA,
beta-actin and glyceraldehyde-3-phosphate-dehydrogenase for
normalization in real-time quantitative reverse
transcriptase-polymerase chain reaction analysis of gene expression
in human T lymphocytes. Scand J Immun. 59:566–573. 2004. View Article : Google Scholar
|
|
13
|
Selvey S, Thompson EW, Matthaei K, Lea RA,
Irving MG and Griffiths LR: Beta-actin - an unsuitable internal
control for RT-PCR. Mol Cell Probes. 15:307–311. 2001. View Article : Google Scholar : PubMed/NCBI
|
|
14
|
Andersen CL, Jensen JL and Orntoft TF:
Normalization of real-time quantitative reverse transcription-PCR
data: a model-based variance estimation approach to identify genes
suited for normalization, applied to bladder and colon cancer data
sets. Can Res. 64:5245–5250. 2004. View Article : Google Scholar
|
|
15
|
Rodriguez-Mulero S and Montanya E:
Selection of a suitable internal control gene for expression
studies in pancreatic islet grafts. Transplantation. 80:650–652.
2005. View Article : Google Scholar : PubMed/NCBI
|
|
16
|
Sorby LA, Andersen SN, Bukholm IR and
Jacobsen MB: Evaluation of suitable reference genes for
normalization of real-time reverse transcription PCR analysis in
colon cancer. J Exp Clinical Cancer Res. 29:1442010. View Article : Google Scholar
|
|
17
|
Chua SL, See Too WC, Khoo BY and Few LL:
UBC and YWHAZ as suitable reference genes for accurate
normalisation of gene expression using MCF7, HCT116 and HepG2 cell
lines. Cytotechnology. 63:645–654. 2011. View Article : Google Scholar : PubMed/NCBI
|
|
18
|
Kim B, Lee HJ, Choi HY, et al: Clinical
validity of the lung cancer biomarkers identified by bioinformatics
analysis of public expression data. Cancer Res. 67:7431–7438. 2007.
View Article : Google Scholar : PubMed/NCBI
|
|
19
|
Schlotter YM, Veenhof EZ, Brinkhof B, et
al: A GeNorm algorithm-based selection of reference genes for
quantitative real-time PCR in skin biopsies of healthy dogs and
dogs with atopic dermatitis. Vet Immunol Immunopathol. 129:115–118.
2009. View Article : Google Scholar : PubMed/NCBI
|
|
20
|
Wang Q, Ishikawa T, Michiue T, Zhu BL,
Guan DW and Maeda H: Stability of endogenous reference genes in
postmortem human brains for normalization of quantitative real-time
PCR data: comprehensive evaluation using geNorm, NormFinder and
BestKeeper. Int J Legal Med. 126:943–952. 2012. View Article : Google Scholar : PubMed/NCBI
|
|
21
|
Pfaffl MW, Tichopad A, Prgomet C and
Neuvians TP: Determination of stable housekeeping genes,
differentially regulated target genes and sample integrity:
BestKeeper - Excel-based tool using pair-wise correlations.
Biotechno Lett. 26:509–515. 2004. View Article : Google Scholar
|
|
22
|
de Oliveira LA, Breton MC, Bastolla FM, et
al: Reference genes for the normalization of gene expression in
eucalyptus species. Plant Cell Physiol. 53:405–422. 2012.
View Article : Google Scholar
|
|
23
|
Bunn PA Jr: Worldwide overview of the
current status of lung cancer diagnosis and treatment. Arch
Pathology Lab Med. 136:1478–1481. 2012. View Article : Google Scholar
|
|
24
|
Tsuboi M, Ohira T, Saji H, et al: The
present status of postoperative adjuvant chemotherapy for
completely resected non-small cell lung cancer. Ann Thoracic
Cardiovasc Surg. 13:73–77. 2007.
|
|
25
|
Liu J, Lee W, Jiang Z, et al: Genome and
transcriptome sequencing of lung cancers reveal diverse mutational
and splicing events. Genome Res. 22:2315–2327. 2012. View Article : Google Scholar : PubMed/NCBI
|
|
26
|
Sokilde R, Kaczkowski B, Podolska A, et
al: Global microRNA analysis of the NCI-60 cancer cell panel. Mol
Cancer The. 10:375–384. 2011. View Article : Google Scholar
|
|
27
|
Che CL, Zhang YM, Zhang HH, et al: DNA
microarray reveals different pathways responding to paclitaxel and
docetaxel in non-small cell lung cancer cell line. Int J Clin Exp
Path. 6:1538–1548. 2013.
|
|
28
|
Gazdar AF, Girard L, Lockwood WW, Lam WL
and Minna JD: Lung cancer cell lines as tools for biomedical
discovery and research. J Natl Cancer Inst. 102:1310–1321. 2010.
View Article : Google Scholar : PubMed/NCBI
|
|
29
|
Gazdar AF, Gao B and Minna JD: Lung cancer
cell lines: Useless artifacts or invaluable tools for medical
science? Lung Cancer. 68:309–318. 2010. View Article : Google Scholar : PubMed/NCBI
|
|
30
|
van Eijk R, Licht J, Schrumpf M, et al:
Rapid KRAS, EGFR, BRAF and PIK3CA mutation analysis of fine needle
aspirates from non-small-cell lung cancer using allele-specific
qPCR. PloS One. 6:e177912011. View Article : Google Scholar : PubMed/NCBI
|
|
31
|
Saviozzi S, Cordero F, Lo Iacono M,
Novello S, Scagliotti GV and Calogero RA: Selection of suitable
reference genes for accurate normalization of gene expression
profile studies in non-small cell lung cancer. BMC Cancer.
6:2002006. View Article : Google Scholar : PubMed/NCBI
|
|
32
|
Ho-Pun-Cheung A, Bascoul-Mollevi C,
Assenat E, et al: Validation of an appropriate reference gene for
normalization of reverse transcription-quantitative polymerase
chain reaction data from rectal cancer biopsies. Anal Biochem.
388:348–350. 2009. View Article : Google Scholar : PubMed/NCBI
|
|
33
|
Ohl F, Jung M, Xu C, et al: Gene
expression studies in prostate cancer tissue: which reference gene
should be selected for normalization? J Mol Medicine. 83:1014–1024.
2005. View Article : Google Scholar
|
|
34
|
Jacob F, Guertler R, Naim S, et al:
Careful selection of reference genes is required for reliable
performance of RT-qPCR in human normal and cancer cell lines. PloS
One. 8:e591802013. View Article : Google Scholar : PubMed/NCBI
|
|
35
|
Mafra V, Kubo KS, Alves-Ferreira M, et al:
Reference genes for accurate transcript normalization in citrus
genotypes under different experimental conditions. PloS One.
7:e312632012. View Article : Google Scholar : PubMed/NCBI
|
|
36
|
Mallona I, Lischewski S, Weiss J, Hause B
and Egea-Cortines M: Validation of reference genes for quantitative
real-time PCR during leaf and flower development in Petunia
hybrida. BMC Plant Biol. 10:42010. View Article : Google Scholar : PubMed/NCBI
|
|
37
|
Liu DW, Chen ST and Liu HP: Choice of
endogenous control for gene expression in nonsmall cell lung
cancer. Eur Respir J. 26:1002–1008. 2005. View Article : Google Scholar : PubMed/NCBI
|
|
38
|
Gresner P, Gromadzinska J and Wasowicz W:
Reference genes for gene expression studies on non-small cell lung
cancer. Acta Biochim Pol. 56:307–316. 2009.PubMed/NCBI
|