Introduction
Gene expression is regulated at different
hierarchical levels, one of which is the accessibility of genes and
their cis-regulatory elements to the transcriptional
complex. This can be effected by the degree of chromatin
compaction, which is controlled, in part, by epigenetic regulators
belonging to the polycomb group of proteins (1). The histone methyltransferase,
enhancer of zeste 2 (EZH2), is a component of the
polycomb-repressive complex (PRC) 2, which catalyzes the
methylation of histone H3 lysine 27 residues and mediates the
epigenetic silencing of target genes. Identification of the genes
that PRC2 regulates is important as EZH2 is often aberrantly
expressed in neoplasms, including colorectal cancer (CRC) (2).
Cell-to-cell adhesion in the epithelial cell
monolayer is mediated by four types of junctions: Tight junctions,
adherens junctions, gap junctions and desmosomes (3). Claudins (CLDNs) constitute the
backbone of tight junctions and are comprised of a multigene family
of 24 protein members with molecular masses ranging between 20 and
27 kDa. The CLDN proteins create paracellular barriers, which are
critical for sealing epithelial sheets, maintaining cell polarity
and controlling the flux of ions and small molecules between
epithelial cells (4). These
proteins also regulate intercellular signaling and cell morphology
(5). CLDNs are expressed in a
tissue-specific manner and the majority of tissues express multiple
CLDNs (6). Aberrant expression of
CLDNs has been demonstrated in several malignancies and this is
dependent on the tumor localization, stage and grade (4,7).
However, tumors exhibit changes in the expression levels of a
limited number of CLDNs. Furthermore, previous studies have
investigated the epigenetic mechanism underlying the deregulation
of CLDNs in certain types of tumor (7,8).
One of the characteristics of cancer is disruption
of the attachment of epithelial cells to other cells and to the
extracellular matrix, followed by local invasion and distant
metastasis (9). E-cadherin is the
predominant and most extensively investigated example of a junction
component, which is involved in cancer. This protein has been
implicated as a tumor suppressor in various types of cancer via its
negative regulation of cancer cell invasion (10,11).
The importance of other protein components of intracellular
junctions, including CLDNs, in tumorigenesis is also emerging.
However, the molecular mechanisms underlying their altered
expression in cancer and the biological significance of this remain
to be elucidated (4). This is
important for developing therapeutic interventions, which may
restore normal intercellular attachment.
The present study demonstrated that the expression
of CLDN23 is significantly reduced in CRC tissue. A chromatin
immunoprecipitation followed by deep sequencing (ChIP-Seq) assay
revealed that a high level of EZH2 is bound to the CLDN23 locus in
CRC tissue, suggesting that EZH2-mediated histone methylation was
responsible for the downregulation of the expression of CLDN23. The
present study suggested a functional link between the binding and
activity of EZH2 at the CLDN23 locus and the repression of CLDN23
expression during the development of CRC.
Materials and methods
Tissue samples
Chromatin was isolated from 12 adenocarcinoma (AC)
samples and their healthy colonic mucosa (NC) counterparts, which
were collected in our previous study (12). Cryostat sections were prepared from
each sample using a Microm HM 505E cryostat (Zeiss, Göttingen,
Germany). Upper and lower sections from each cryosection were
evaluated by a pathologist to confirm whether they contained the
expected cell type. Furthermore, individual RNA and DNA samples
from 24 pairs of healthy colon and AC specimens, which were
extracted in our previous study (13) were used for reverse transcription
quantitative polymerase chain reaction (RT-qPCR) and DNA
methylation analyses.
Cell lines
All cell lines were obtained from American Type
Culture Collection (Rockville, MD, USA). A total of three CRC cell
lines were cultured in a humidified 5% CO2 atmosphere at
37°C in media purchased from Invitrogen Life Technologies
(Carlsbad, CA, USA). The Colo205 cells were cultured in RPMI-1640
medium, supplemented with 10% fetal bovine serum (FBS; Invitrogen
Life Technologies). HT-29 and HCT-116 cells were cultured in
McCoy’s 5A modified medium, supplemented with 10% FBS (Invitrogen
Life Technologies). The cells were grown for 24 h in 6-well culture
plates (Sarstedt AG & Co., Nümbrecht, Germany) to 40–50%
confluency, prior to treatment with dimethyl sulfoxide (0.01%;
Sigma-Aldrich, St. Louis, MO, USA) or an EZH2 inhibitor (GSK126;
Biovision, Mountain View, CA, USA) at a final concentration of 0.5,
1, 2 and 5 μM and collected 72 h later. Control cells
reached 80–90% confluence following 72 h culture.
3-(4,5-Dimethylthiazol-2-yl)-2,5-diphenyltetrazolium brom ide (MTT)
assay
Following incubation with 0.5, 1, 2 and 5 μM
GSK126 for 72 h in a humidified 5% CO2 atmosphere at
37°C, MTT solution (Sigma-Aldrich) was added at a final
concentration of 0.5 mg/ml from a stock solution of 5 mg/ml,
prepared using phosphate-buffered saline (PBS; Sigma-Aldrich), and
the cells were incubated for 3 h in a humidified 5% CO2
atmosphere at 37°C. The cells were subsequently lysed in acidified
2-propanol (POCH S.A., Gliwice, Poland) and the absorbance was
subsequently measured at 550–560 nm using a Victor3 microplate
reader (Perkin Elmer, Waltham, MA, USA).
ChIP assay
The tissue cryostat section (50 mg) was immersed in
2 ml hypotonic buffer A, containing 10 mM HEPES (pH 7.9), 2 mM
MgCl2 and 2 mM KCl, supplemented with protease and
phosphatase inhibitors (78441) (Thermo Fisher Scientific, Co.,
Ltd., Waltham, MA, USA). The samples were ground using a loose (10
times) and tight (30 times) dounce pestle (Wheaton Industries,
Inc., Millville, NJ, US) and subsequently centrifuged at 700 × g
for 5 min in 4°C. The nuclei in the pellet were cross-linked in 1
ml PBS, containing 1% formaldehyde (Sigma-Aldrich) for 10 min at
room temperature, following which the reaction was quenched at room
temperature for 5 min by adding glycine (Sigma-Aldrich) at a final
concentration of 125 mM (from a stock solution of 2 M). Following
centrifugation at 700 × g for 5 min at room temperature, the nuclei
were washed once with 1 ml of PBS and subsequently stored at
−80°C.
Cross-linking of the cell lines to isolate chromatin
was performed, as described previously (14). Pelleted nuclei were resuspended in
lysis buffer, containing 12.5 mM Tris-HCl (pH 8.0), 2.5 mM EDTA and
0.25% sodum dodecyl sulphate (SDS) (Sigma-Aldrich), supplemented
with protease and phosphatase inhibitors (no. 78441; Thermo Fisher
Scientific).
Chromatin was sheared in a Bioruptor Plus
(Diagenode, Denville, NJ, USA) using a 30 sec on-off cycle for 15
min at high intensity. ChIP assays were performed using the
Matrix-ChIP method (15).
Alternatively, a modified Fast-ChIP method was used for the
ChIP-Seq libraries (16). ChIP DNA
data are expressed as the percentage of input DNA, as described
previously (14). For sequencing,
ChIP was performed using a rabbit polyclonal anti-EZH2 antibody
(ab3748; Abcam, Cambridge, UK) and non-specific rabbit
immunoglobulin G (IgG; I-1000; Vector Laboratories, Burlingame, CA,
USA). The following antibodies were also used in the ChIP assays:
Mouse monoclonal anti-RNA polymerase II (Pol2; sc-47701; Santa Cruz
Biotechnology, Inc., Santa Cruz, CA, USA), rabbit polyclonal
anti-histone H3 lysine 27 trimethylation (H3K27m3; no. 07–449; EMD
Millipore, Billerica, MA, USA), rabbit polyclonal anti-histone H3
(ab1791; Abcam) and rabbit polyclonal anti-histone H3 lysine 4
trimethylation (H3K4me3; no. 07–473; EMD Millipore).
ChIP-Seq
The DNA (10 ng) was processed using a ChIP-Seq
Sample Prep Kit (IP-102-1001; Illumina, Inc., San Diego, CA, USA)
according to the manufacturer’s instructions, with PCR conditions
for adapter-modified DNA fragments perfomed exactly as described
previously (17). Deep sequencing
was performed at ATLAS Biolabs GmbH (Berlin, Germany) using the
Genome Analyzer IIx (Illumina, Inc.) with single-end 36 bp reads.
The sequences were obtained using the Analysis Pipeline (Illumina,
Inc.) and then mapped to the human genome assembly (version hg19)
using Bowtie software (18). The
protein binding sites were detected with MACS (19), assuming a change in binding
intensity of at least 10-fold for highly confident peaks (cancerous
sample, vs. healthy samples; specific antibody, vs. IgG).
Western blotting
The cells were lysed in 1X Laemmli buffer [65.8 mM
Tris-HCl (pH 6.8), 2.1% SDS, 26.3% (w/v) glycerol, 0.01%
bromophenol blue, 4% β-mercaptoethanol; Sigma-Aldrich) and the
proteins were resolved by SDS-PAGE and electrotransferred to
polyvinylidene fluoride membranes (EMD Millipore). The blotted
proteins were assessed by western blot analysis using the following
antibodies: Anti-EZH2, anti-H3K27m3, anti-histone H3 and
anti-CLDN23 (ab23355; Abcam).
Extraction of total RNA from the cell
lines and reverse transcription
The total RNA was extracted from the cells using a
TRIzol® Plus RNA Purification kit (Life Technologies)
and on-column DNase I treatment was performed according to the
manufacturer’s instructions. The total RNA (1 μg) and random
hexamers were used to synthesize the cDNA with Superscript III
(Life Technologies) according to the manufacturer’s
instructions.
qPCR
The qPCR of the cDNA and ChIP samples were performed
using an Applied Biosystems 7900HT Fast Real-Time PCR system
(Applied Biosystems Life Technologies, Foster City, CA, USA) and a
Sensimix SYBR kit (Bioline Ltd., London, England) in a 5 μl
reaction according to manufacturers’ instructions. α-tubulin 1B was
used as the reference mRNA expression. The mRNA expression levels
of EZH2 and CLDN23 were determined in 24 NC and 24 AC tissue
samples using RT-qPCR, as described previously (13). The sequences of the primers used
are shown in Table I. Differences
in expression levels were evaluated using the Mann-Whitney U-test
in GraphPad Prism 5 (GraphPad Software, Inc., La Jolla, CA, USA).
P<0.05 was considered to indicate a statistically significant
difference.
 | Table IPrimers used in the present
study. |
Table I
Primers used in the present
study.
| Gene | Sequence
(5′-3)′ | Assay | Chromosome
location |
|---|
| RPLP0 |
| Forward |
GCAATGTTGCCAGTGTCTG | RT-qPCR | Exon 7–8 |
| Reverse |
GCCTTGACCTTTTCAGCAA |
| EZH2 |
| Forward |
ATGGGAAAGTACACGGGGAT | RT-qPCR | Exon 5–6 |
| Reverse |
ATTGACCAAGGGCATTCACC |
| CLDN23 |
| Forward |
GGGTCCCTCCCTCCC | ChIP-qPCR | Promotera |
| Reverse |
CTGGCCCTAATCGAAACCA |
| CLDN23 |
| Forward |
GAGGGAACTAGCCTAAGTGG | RT, ChIP-qPCR | Aa |
| Reverse |
GAGCCCTGATCGCTCC |
| CLDN23 |
| Forward |
CAGTGGACGTGGAGTTGTA | ChIP-qPCR | Ba |
| Reverse |
GAAGTAGCCCCACTGGTC |
| CLDN23 |
| Forward |
TCTCACTTATTTTTGCGGTGA | ChIP-qPCR | Ca |
| Reverse |
GACCTTTGTTCTCCTCTTGG |
| ACTB |
| Forward |
ACGCCTCCGACCAGTGTT | ChIP-qPCR | Promotera |
| Reverse |
GCCCAGATTGGGGACAAA |
| GAPDH |
| Forward |
CGCCCCCGGTTTCTATAAAT | ChIP-qPCR | Promotera |
| Reverse |
TCGAACAGGAGGAGCAGAGAG |
| HBB |
| Forward |
GCAATAGATGGCTCTGCCCT | ChIP-qPCR | Promotera |
| Reverse |
GACAGGTACGGCTGTCATCA |
| CLDN23 |
| Forward |
AGAAGGAAGGTAGGTTGTAGG | Pyrosequencing | 5′-end |
| Reverse |
Biotin-ACTAACTAATTCAAAAAACCCTTCAC |
DNA methylation analysis
The level of DNA methylation was assessed in the CRC
cell lines, CRC and NC samples from 12 patients using a
pyrosequencing assay. DNA was isolated using a QIAamp DNA Mini kit
(Qiagen, Hilden, Germany) and bisulfite-converted using an EpiTect
kit (Qiagen), according to the manufacturer’s instructions. The PCR
was performed in a 30 μl reaction mixture, containing 1X PCR
buffer, 2 mM MgCl2, 0.25 mM dNTPs, 0.2 μM forward
and reverse primers and 0.5 units FastStart DNA Polymerase (Roche
Applied Science, Indianapolis, IN, USA). The cycling conditions
were as follows: Initial denaturation at 94°C for 3 min, followed
by 40 cycles of 94°C for 30 sec, 52°C for 30 sec and 72°C for 30
sec, followed by a final elongation at 72°C for 7 min. The PCR
products were purified and analyzed using the PyroMark Q24 system
(Biotage AB, Uppsala, Sweden), according to the manufacturer’s
instructions. The mean methylation levels in the amplified regions
were analyzed.
Results
Genome-wide mapping of EZH2 demonstrates
that the CLDN23 gene is occupied by PRC2 in the CRC samples
To identify genes, of which expression is regulated
by PRC2 in CRC tissues, ChIP-Seq was performed to survey EZH2 on a
pool of chromatin derived from 12 pairs of NC and AC samples. In
total, 86.9/61.6 and 92.5/62.6 million tags were sequenced/mapped
in the NC and AC samples, respectively. The binding densities of
EZH2 were correlated with transcriptomic datasets generated in our
previous microarray study of CRC samples (12). The presence of EZH2 on chromatin is
often associated with chromatin compaction and transcription
repression. Therefore, through this analysis, a list of genes
potentially regulated by EZH2 was comprised to only include those
for which the level of EZH2 binding, and the level of mRNA
expression were inversely associated. As cut-offs, a 2- and 4-fold
change (FC) in the EZH2-binding density and mRNA expression of a
given gene, respectively, between the NC and AC samples was used
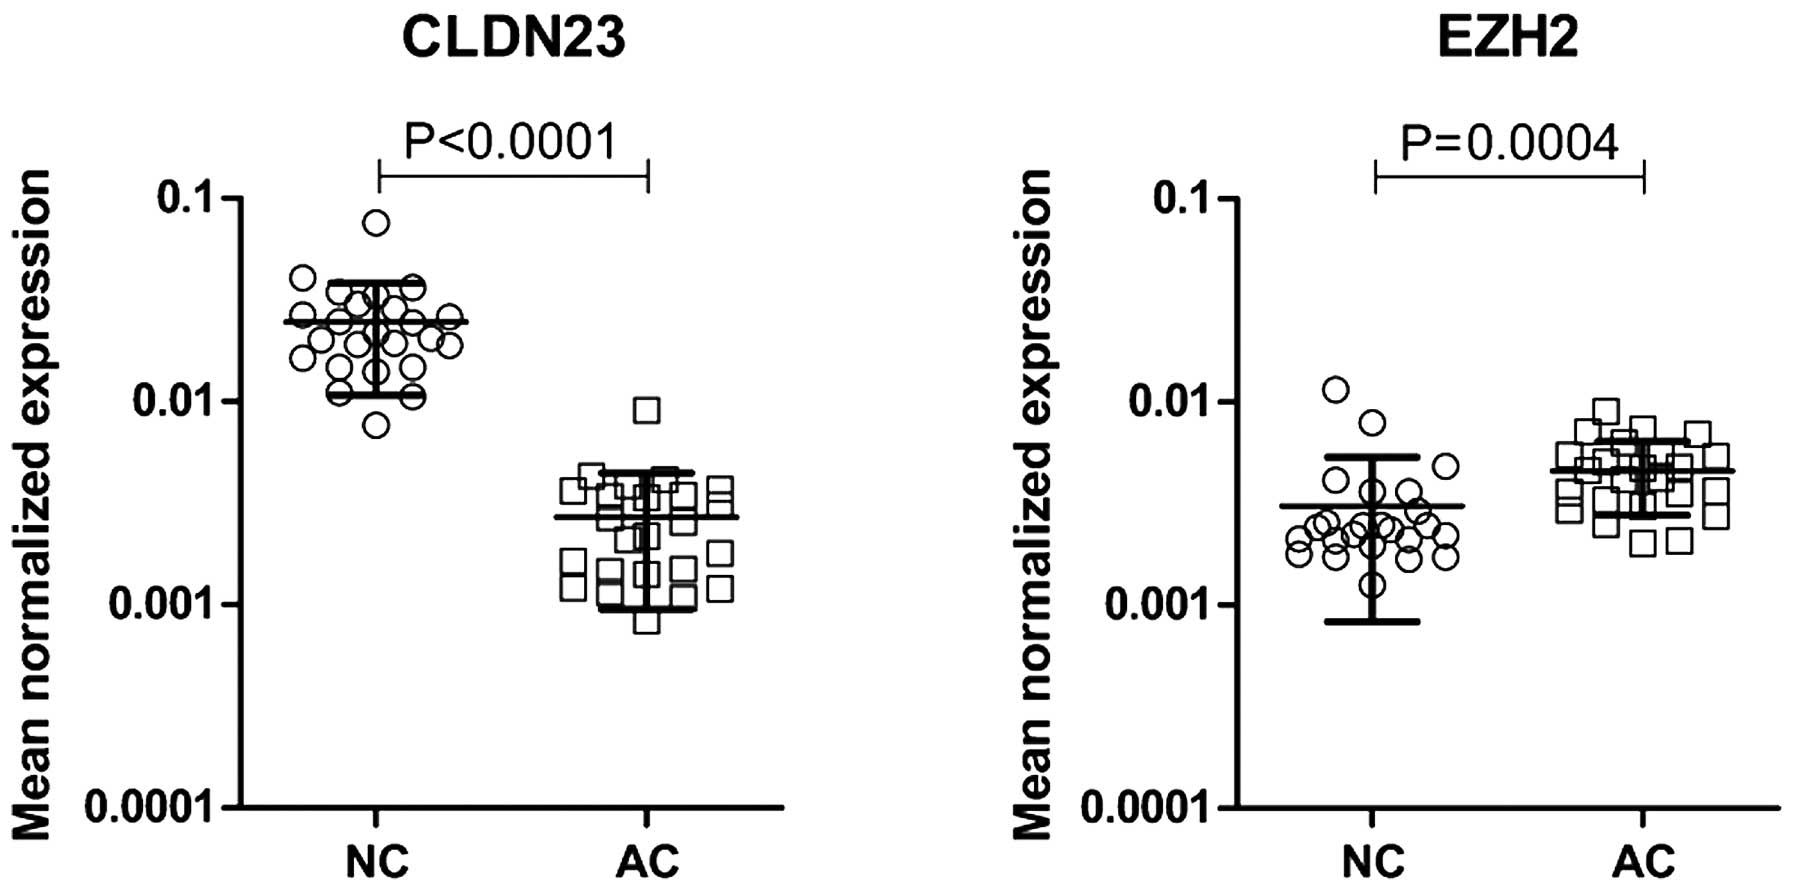
(Table II). Among the 15 genes,
which met these criteria, the expression of CLDN23 differed the
most between the NC and AC samples, with a FC in mRNA expression of
7.2. This difference in the mRNA expression of CLDN23 was confirmed
in 24 pairs of NC and AC cDNA samples using RT-qPCR (13). It was confirmed that, in AC
tissues, the expression of CLDN23 was significantly reduced
(FC=9.1) and the mRNA expression of EZH2 was markedly increased
(Fig. 1).
| Table IIGenes exhibit increased binding of
EZH2 and decreased mRNA expression levels in AC compared with NC
tissues. |
Table II
Genes exhibit increased binding of
EZH2 and decreased mRNA expression levels in AC compared with NC
tissues.
| Gene | Tag
| P-value | mRNA FC AC/NC | FC in EZH2
binding |
|---|
| EZH2 AC | EZH2 NC |
|---|
| CLDN23 | 109 | 23 |
1.07−11 | 0.14 | 4.74 |
| MALL | 112 | 12 |
1.67−10 | 0.16 | 9.33 |
| TMEM171 | 135 | 28 |
4.30−10 | 0.17 | 4.82 |
| SRPX | 108 | 20 |
7.98−5 | 0.33 | 5.40 |
| LMOD1 | 118 | 22 |
6.15−3 | 0.38 | 5.36 |
| CAPN5 | 130 | 21 |
9.52−7 | 0.39 | 6.19 |
| SH3BGRL2 | 101 | 25 |
9.54−10 | 0.40 | 4.04 |
| GLIPR2 | 139 | 27 |
1.23−10 | 0.40 | 5.15 |
| CDC42SE2 | 115 | 24 |
3.80−7 | 0.43 | 4.79 |
| AQP11 | 152 | 37 |
1.15−5 | 0.43 | 4.11 |
| ACADVL | 112 | 18 |
1.94−8 | 0.45 | 6.22 |
| WASL | 107 | 14 |
1.43−6 | 0.47 | 7.64 |
| TCN2 | 107 | 23 |
2.96−8 | 0.47 | 4.65 |
| C1orf106 | 132 | 21 |
5.64−5 | 0.48 | 6.29 |
| GNAQ | 113 | 20 |
9.47−6 | 0.49 | 5.65 |
Inspection of the EZH2 binding tracks using the UCSC
genome browser (20) revealed that
more EZH2 was bound to chromatin in the AC samples compared with
the NC samples (Fig. 2A).
ChIP-qPCR analysis of the same chromatin preparations that were
used in the ChIP-Seq survey confirmed that the occupancy of the
promoter and downstream regions of the CLDN23 gene by EZH2 was
increased in the AC samples (Fig.
2B). In accordance with the role of EZH2 in suppressing gene
expression (2), the level of
H3K27m3 was also increased in the AC samples, while occupancy of
the CLDN23 gene by the Pol2 complex was lower in the AC samples
compared with the NC samples. As a control, constitutively
repressed and constitutively active gene promoters, namely,
β-globin (HBB) and glyceraldehyde 3-phosphate dehydrogenase,
respectively, were analyzed.
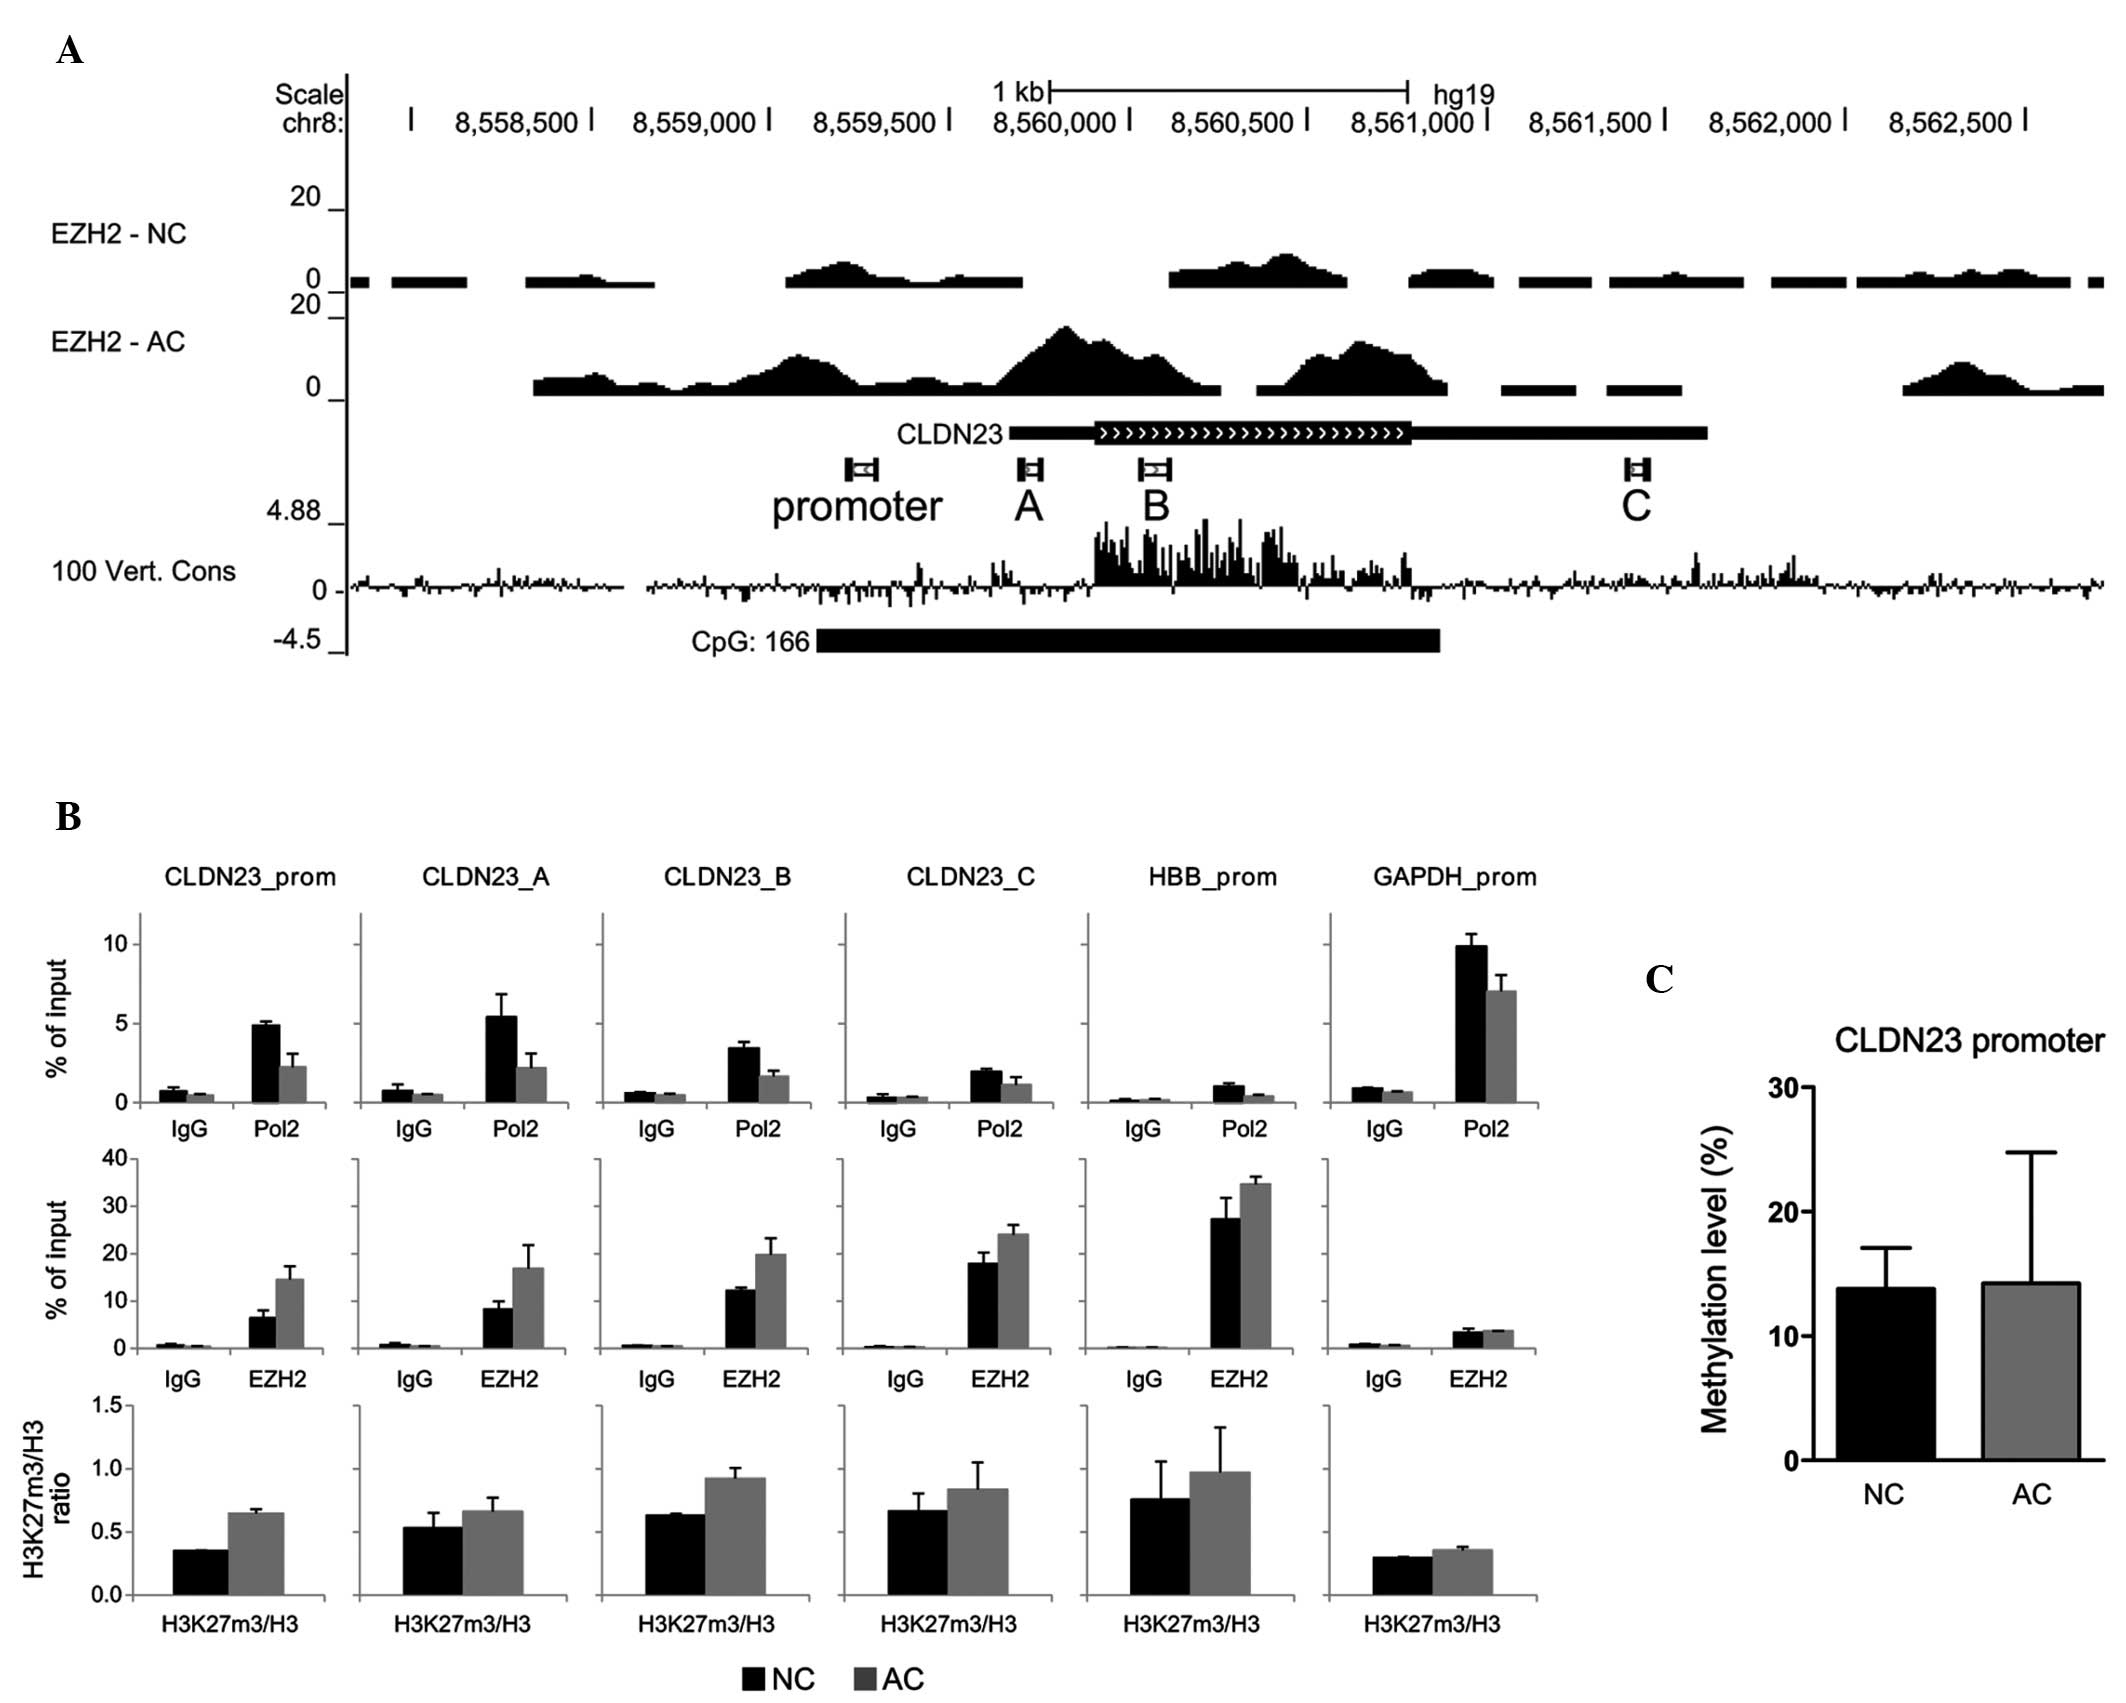 | Figure 2Binding of EZH2 to the CLDN23 gene is
increased in CRC. (A) Chip-Seq EZH2/IgG libraries for pooled AC and
NC tissues were sequenced using Genome Analyzer II. Non-specific
tags from the IgG library (ChIP assay background) were filtered
out. EZH2-specific tags were mapped to the human genome (version
hg19) and visualized in the UCSC genome browser. The coordinates of
the presented area were chr8:8,557,830-8,562,722. (B) ChIP-qPCR
data of the pooled samples used in the ChIP-Seq survey for Pol2,
EZH2 and H3K27m3. ChIP results are shown for the PCR products
depicted in A. ChIP data are expressed as the DNA recovered, either
as the percentage of input DNA, or as the ratio of H3K27m3 to total
histone H3 (mean ± standard deviation; n=3). (C) Pyrosequencing
analysis of the methylation of the CLDN23 5′ end CpG island in 12
pairs of NC and AC tissue samples. DNA methylation data is
expressed as a percentage of fully methylated reference DNA. CRC,
colorectal cancer; Ig, immunoglobulin; AC, adenocarcinoma; NC,
normal colon; EZH2, enhancer of zeste 2; CLDN23, claudin 23; ChIP,
chromatin immunoprecipitation; qPCR, quantitative polymerase chain
reaction. |
In cancer development, aberrant DNA methylation is
an underlying epigenetic mechanism, which leads to the inactivation
of tumor suppressor genes (9).
Since the observed downregulation of the expression of CLDN23 in AC
tissues may arise from DNA hypermethylation within its CpG island
at the 5′ end of the gene, the level of CpG dinucleotide
methylation was measured using pyrosequencing in 12 pairs of NC and
AC tissues. The level of cytosine methylation at the CLDN23 CpG
island remained unchanged between the NC and the AC tissues
(Fig. 2C). This result, together
with the ChIP-based data, suggested that EZH2 affects the
expression of CLDN23 in colonic tissues.
EZH2 regulates the expression of CLDN23
in colon cancer cell lines
EZH2 ChIP-Seq data acquired within the frames of the
ENCODE project demonstrated that EZH2 abundantly occupied CLDN23 in
several cell lines, confirming the direct involvement of EZH2 in
the regulation of CLDN23 transcription (21). Based on these results, the activity
of EZH2 was altered using the EZH2-specific inhibitor, GSK126, in
the Colo205, HT-29 and HCT-116 colon cancer cell lines, and changes
in the expression of CLDN23 were analyzed. GSK126 is a potent,
highly specific small molecule inhibitor of wild-type and mutant
EZH2 (22). The effects of
treatment with 0.5, 1, 2 and 5 μM GSK126 on the viability of
the colon cancer cell lines were evaluated. Treatment with 5
μM GSK126 for 72 h was cytotoxic (Fig. 3A), whereas treatment with the lower
concentrations of GSK126 were not cytotoxic to any of the cell
lines. Therefore, in subsequent analyses, 2 μM GSK126 was
used. As demonstrated by western blotting, H3K27me3 was markedly
reduced in the cell lines treated with 2 μM GSK126 (Fig. 3B). To exclude the possibility that
methylation of CLDN23 underlies the repression of the transcription
of this gene, pyrosequencing was performed to measure the levels of
methylation in a 40 bp region of CLDN23 containing 10 CpG
dinucleotides. This revealed that the mean levels of methylation
were 15.7, 26.3 and 96.8% in the HT-29, Colo205, and HCT-116 cell
lines, respectively (data not shown). The level of methylation at
CLDN23 was high in the HCT-116 cells, therefore, to evaluate the
role of EZH2 in the repression of CLDN23 transcription, this cell
line was excluded from further analyses. In accordance with
transcriptional repression by EZH2, mRNA (Fig. 3C) and protein (Fig. 3D and E) expression levels of CLDN23
were increased in the HT-29 and Colo205 cell lines following
treatment with 2 μM GSK126.
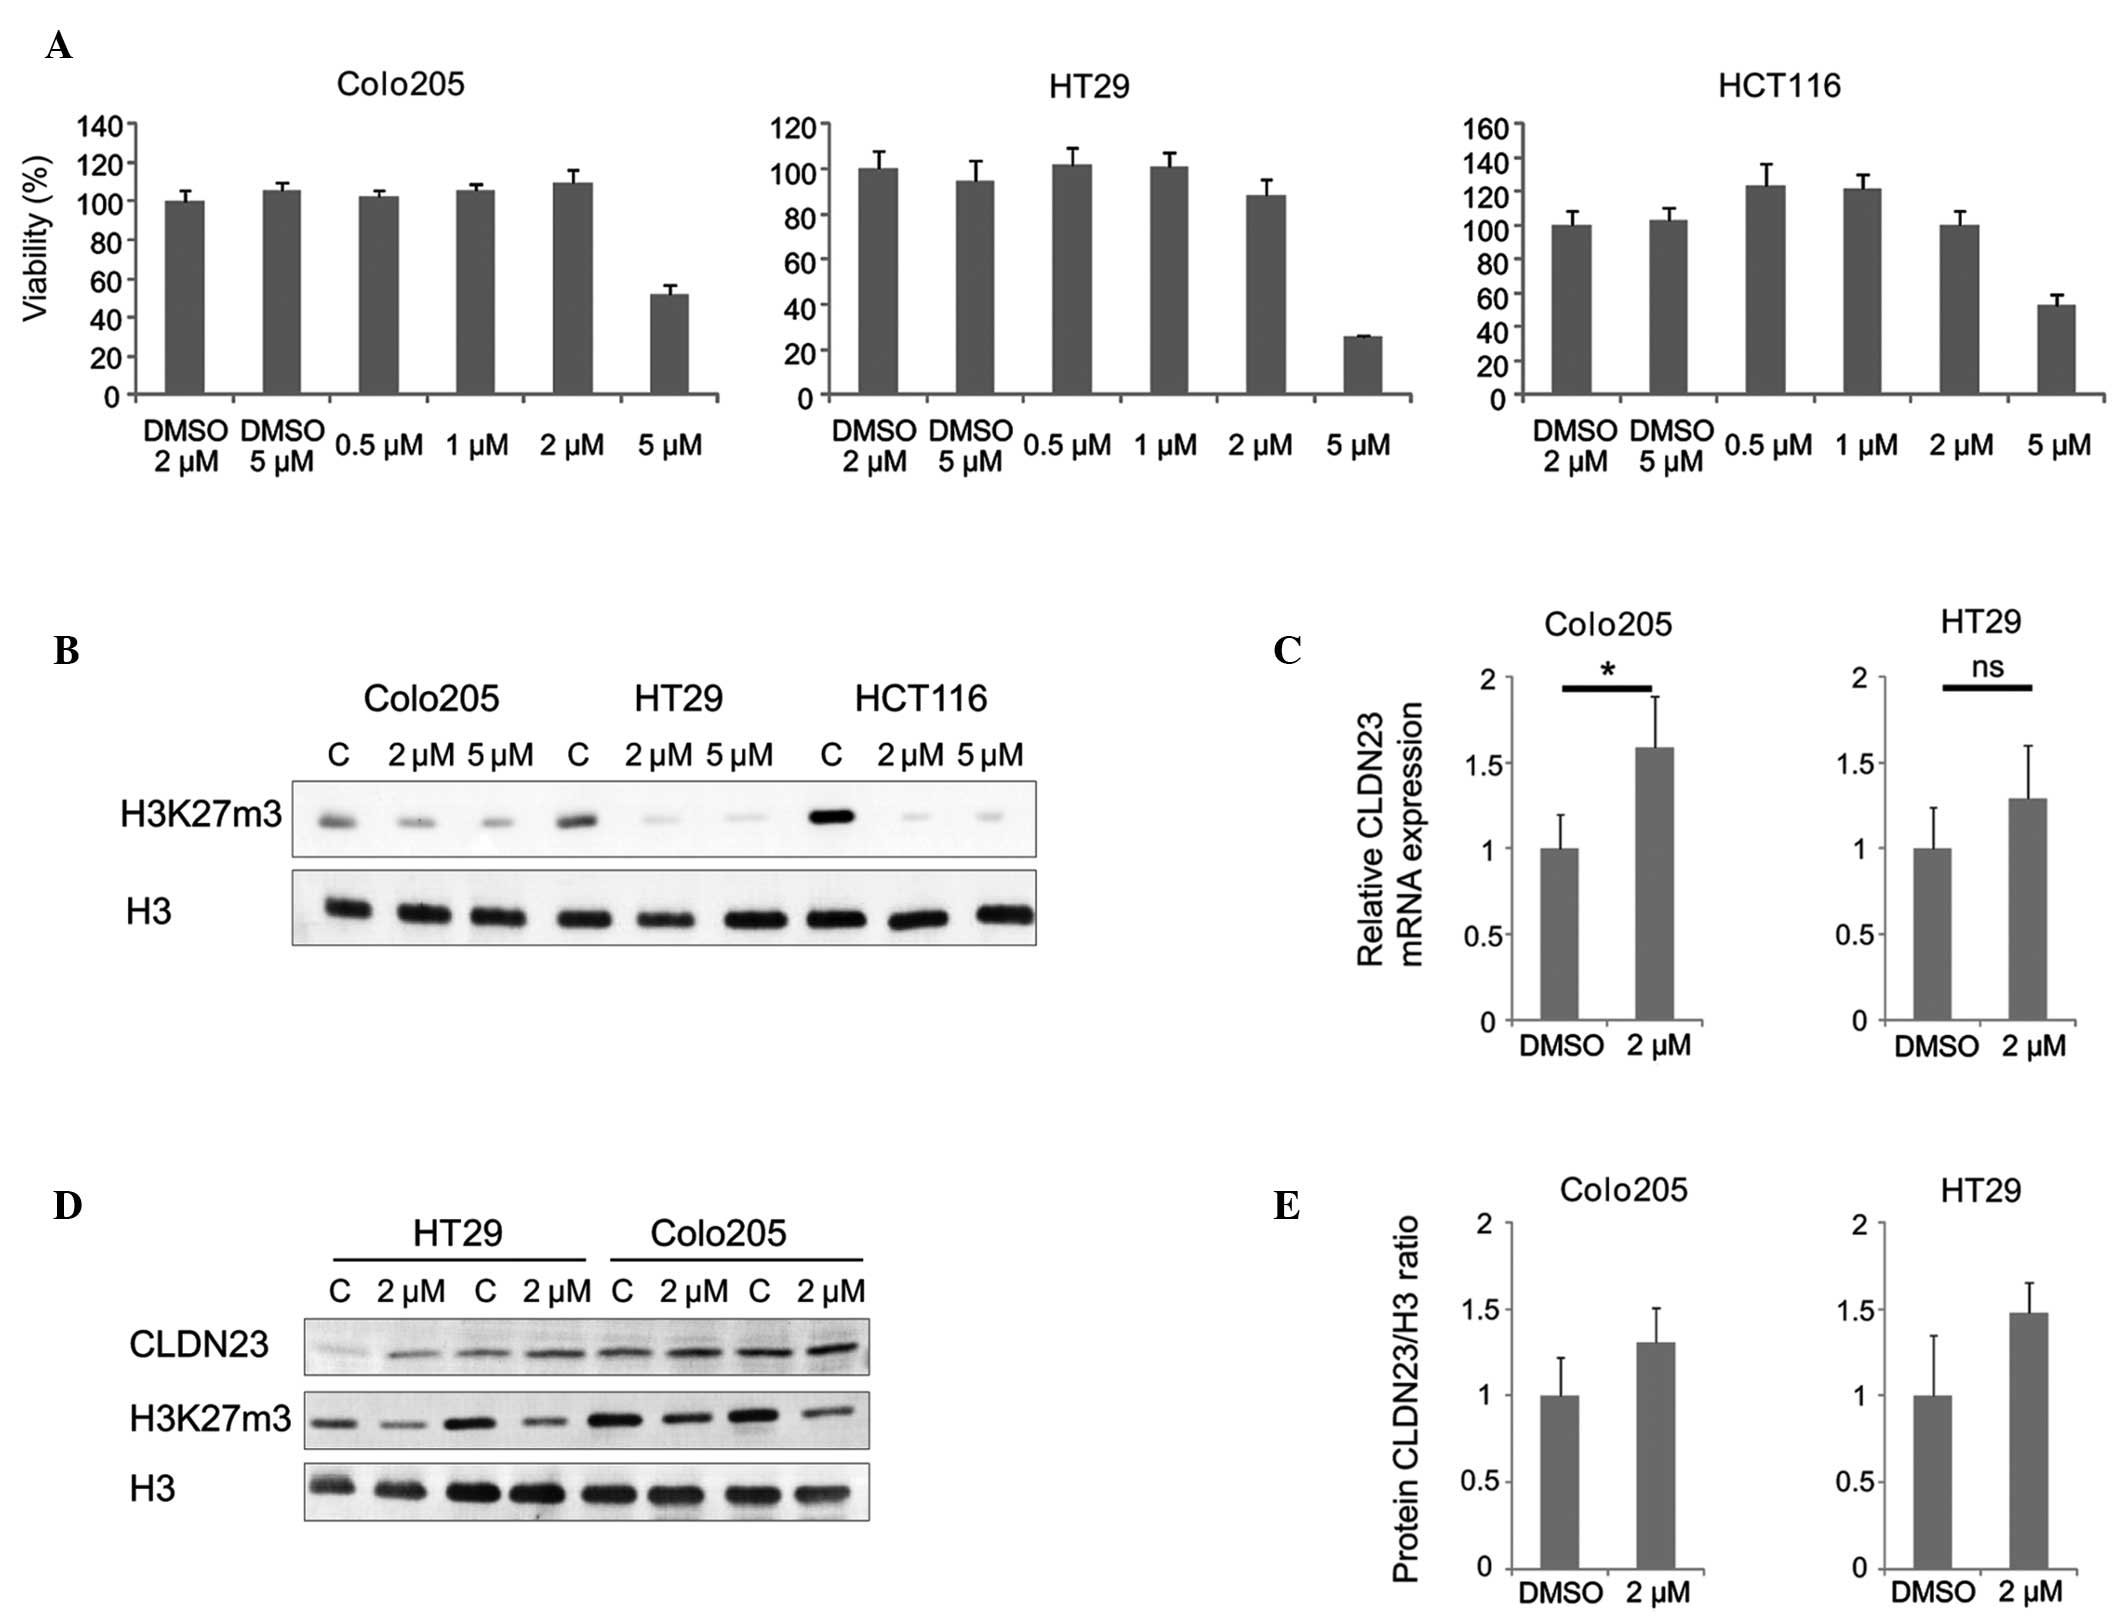 | Figure 3Inhibition of EXH2 by GSK126
increases the expression of CLDN23 in colon cancer cell lines. (A)
Colo205, HT-29 and HCT-116 cell lines were cultured under standard
conditions in the presence of 0.5, 1, 2 or 5 μM GSK126 for
72 h and were analyzed using a
3-(4,5-dimethylthiazol-2-yl)-2,5-di-phenyltetrazolium bromide
assay. The data are expressed as percentage viability compared with
the control cells maintained in 0.1% dimethyl sulfoxide (mean ±
standard deviation; n=6). (B) Colo205, HT-29 and HCT-116 cell lines
were treated with 2 or 5 μM GSK126 for 72 h and subsequently
harvested. The lysates were resolved by SDS-PAGE and
electrotransferred onto PVDF membranes. Western blot analysis was
performed using anti-histone H3 and anti-H3K27me3 antibodies. (C)
Colo205 and HCT-116 cell lines were incubated with 2 μM
GSK126 for 72 h. Total RNA was extracted using TRIzol, treated with
DNAse I and subjected to reverse transcription quantitative
polymerase chain reaction. The results were normalized against the
mRNA expression of RPLP0 (mean ± standard deviation; n=4;
*P<0.05 was considered to indicate a statistically
significant difference). (D) Colo205 and HCT-116 cell lines were
cultured in the presence of 2 μM GSK126 for 72 h and
subsequently harvested. Equal quantities of protein were resolved
by SDS-PAGE and electrotransferred onto PVDF membranes.
Immunostaining was performed using anti-CLDN23, anti-histone H3,
and anti-H3K27me3 antibodies. (E) Densities of western blotting
bands from (D) were measured using OptiQuant image analysis
software. The protein expression level of CLDN23 was normalized to
the level of total histone H3 (mean ± standard deviation; n=2).
PVDF, polyvinylidene fluoride; EZH2, enhancer of zeste 2; CLDN23,
claudin 23. |
Epigenetic changes at the CLDN23 loci are
associated with GSK126 treatment
Treatment with GSK126 increased the expression of
CLDN23, therefore, the epigenetic changes along the CLDN23 gene,
which accompany the inhibition of EZH2 in the Colo205 and HT-29
cell lines were characterized using ChIP (Fig. 4). The promoters of constitutively
active and constitutively repressed genes, namely, β-actin (ACTB)
and HBB, respectively, were surveyed. As expected, in the presence
of GSK126, the abundance of H3K27m3 on the CLDN23 gene decreased by
51 and 48% in the Colo205 and HT-29 cell lines, respectively. The
level of H3K27m3 at the HBB promoter was also decreased in the two
cell lines. Notably, the level of H3K27m3 at the ACTB promoter was
also decreased in the two cell lines, although to a lesser extent
in the HT-29 cells compared with the Colo205 cells. ChIP analyses
revealed no marked changes in the occupancy of CLDN23, the HBB
promoter or the ACTB promoter by EZH2 between GSK126-treated cells
and non-treated cells, indicating that GSK126 treatment does not
impair the binding of EZH2. Notably, the distribution of EZH2
increased towards the 3′ end of CLDN23. The level of EZH2 was
highest at the HBB promoter and lowest at the ACTB promoter. The
level of Pol2 at CLDN23 remained unchanged upon treatment with
GSK126. The level of Pol2 was lowest at the HBB promoter and
highest at the ACTB promoter. H3K4me3 is associated with the 5′
ends of actively transcribed genes (23). The level of H3K4me3 at CLDN23 was
not affected by treatment with GSK126 and, as expected, decreased
towards the 3′ end of the gene. Notably, ChIP measurements revealed
a high level of H3K4me3 at the CLDN23 promoter, which reached 83
and 61% abundance of that mark at the ACTB promoter in Colo205 and
HT-29 cells, respectively.
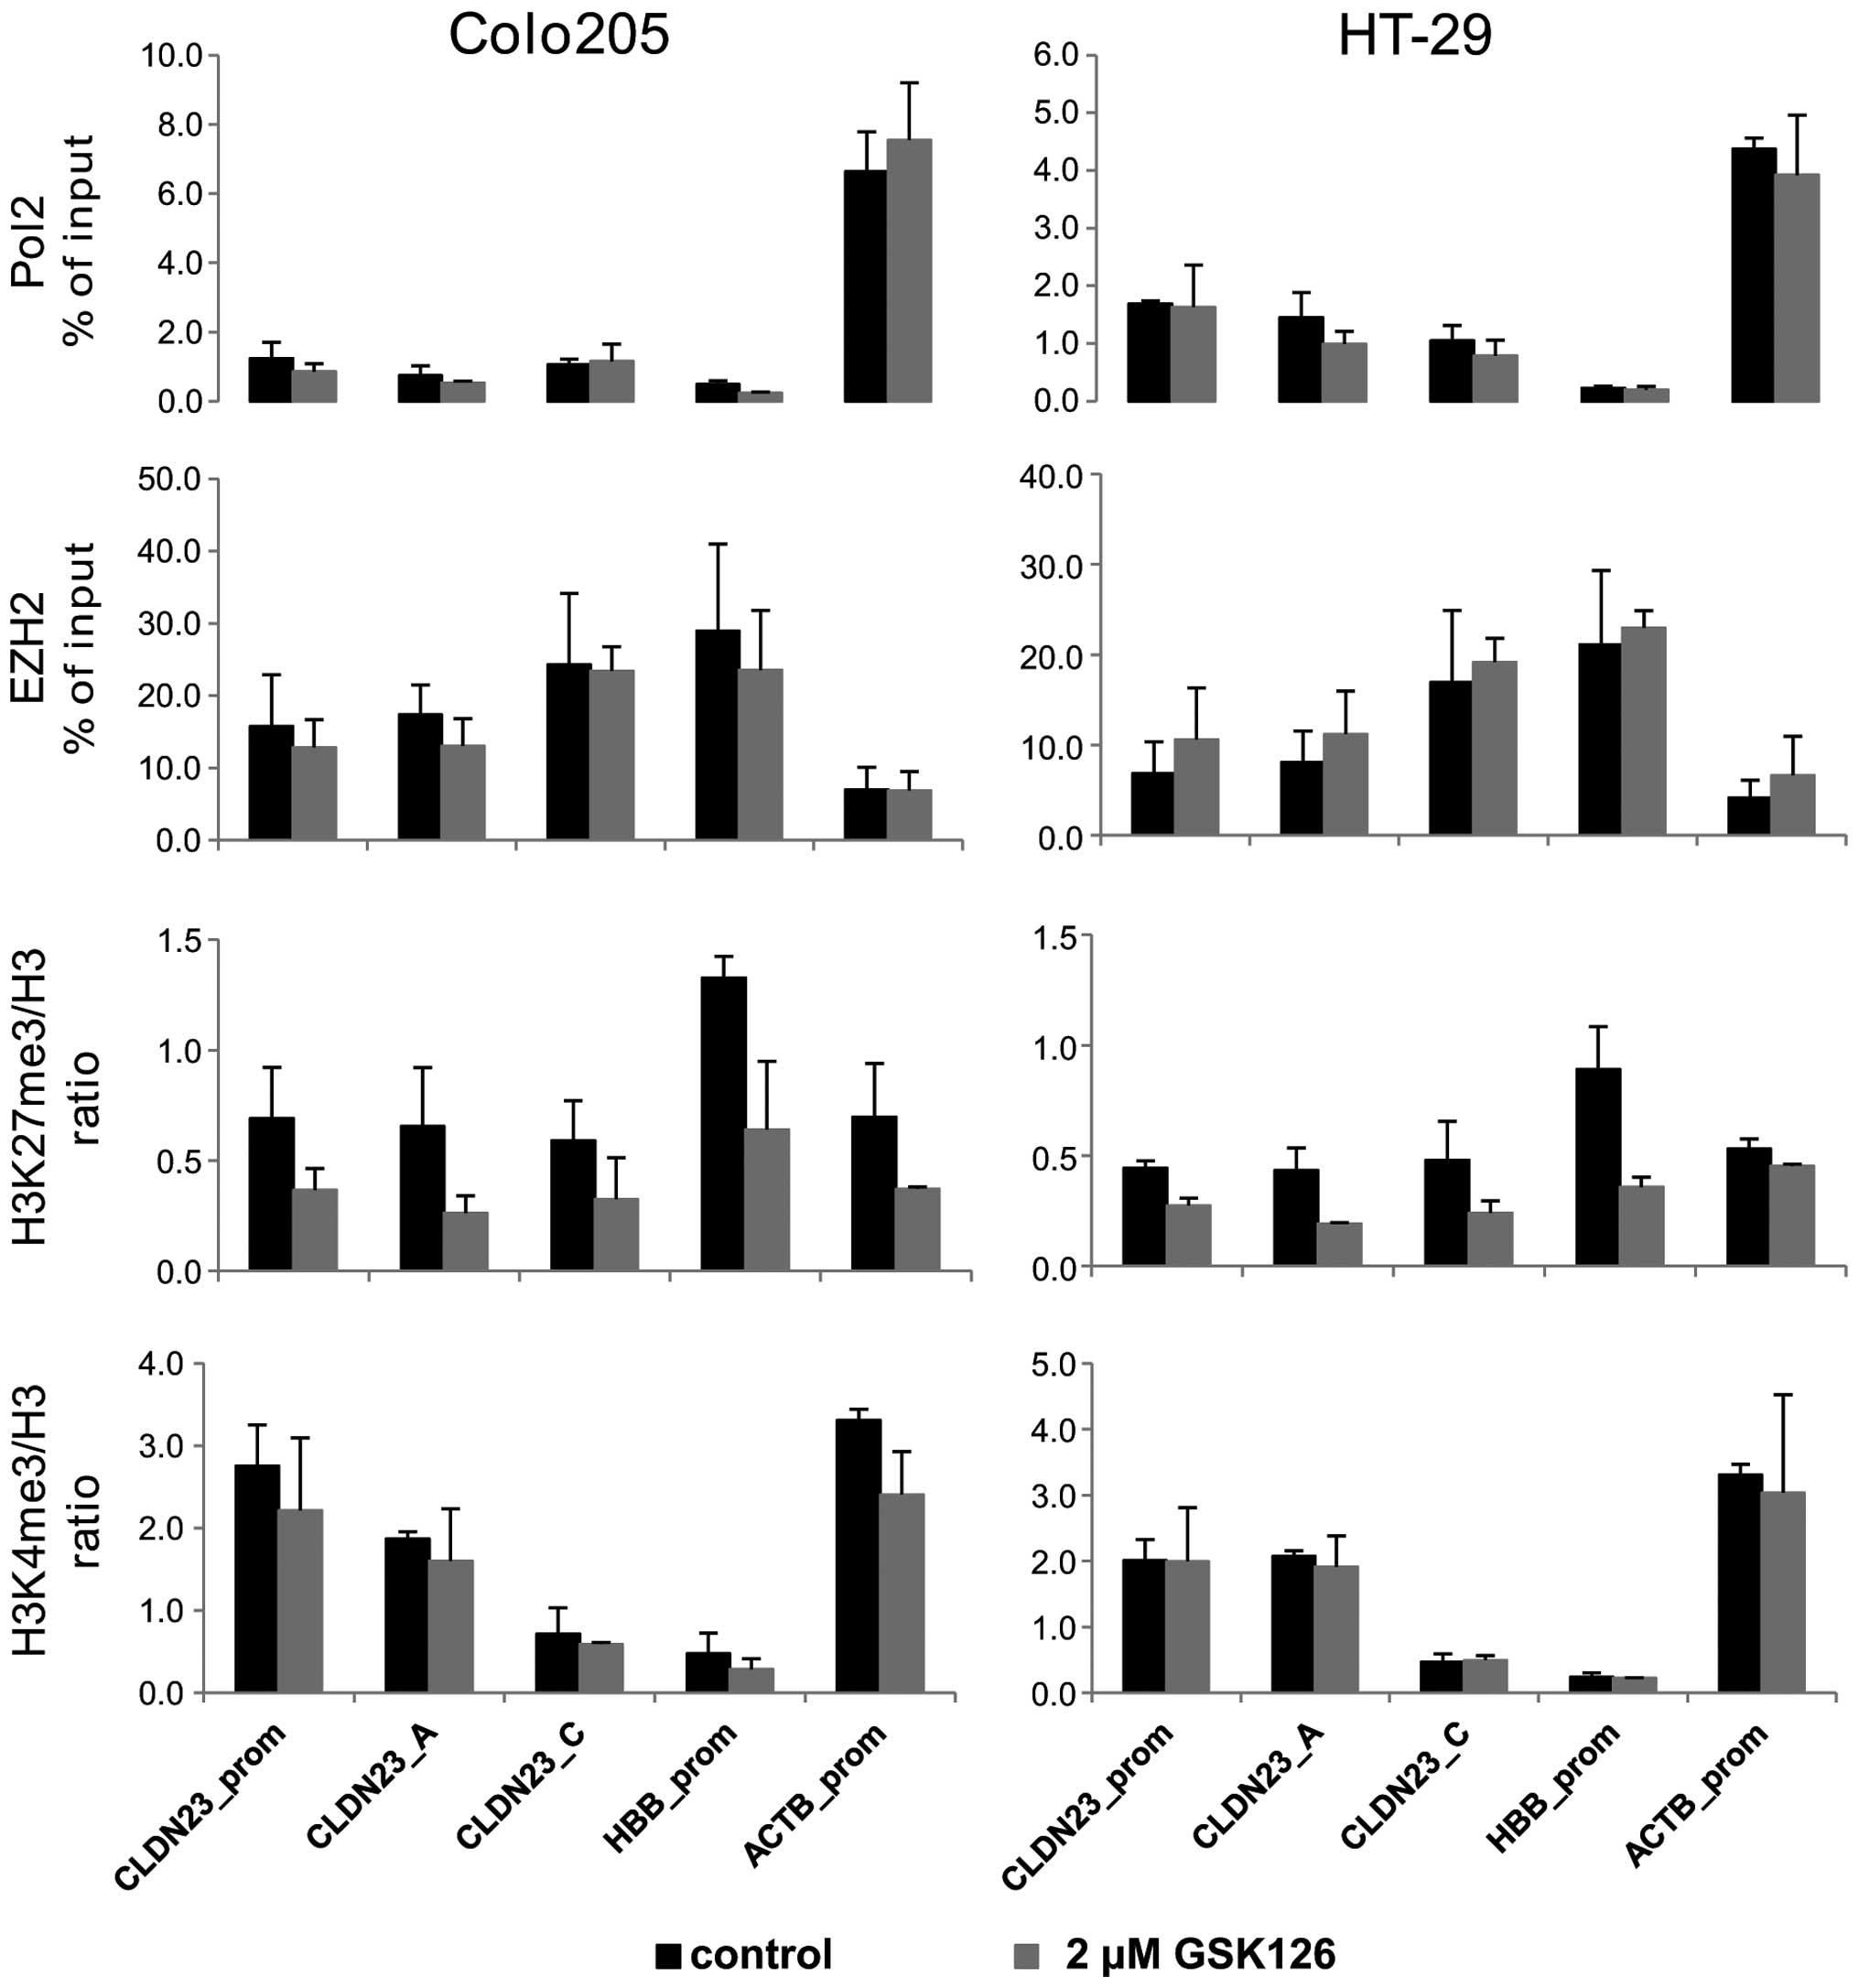 | Figure 4Epigenetic changes at the CLDN23 loci
in Colo205 and HT-29 cell lines following treatment with GSK126.
Colo205 and HT-29 cell lines were cultured in the presence of 2
μM GSK126 for 72 h and subsequently harvested. Total
chromatin was isolated and used in ChIP assays with anti-Pol2,
anti-EZH2, anti-histone H3, anti-H3K4me3 and anti-H3K27me3
antibodies. Isolated DNA was used as the template in reverse
transcription quantitative polymerase chain reaction analyses,
using primers designed to amplify the CLDN23 gene and the promoters
of the HBB and ACTB genes. The data are expressed as a percentage
of the input chromatin for Pol2 and EZH2, or as the ratios of
modified histone ChIP signals to total histone H3 ChIP signals. The
data are expressed as the mean ± standard deviation of two
independent experiments. EZH2, enhancer of zeste 2; CLDN23, claudin
23; Pol, polymerase; HBB, β-globin; ACTB, β-actin. |
Discussion
The claudin family of proteins create a junctional
protein complex in epithelial and endothelial cells, which
maintains cell-to-cell integrity and regulates the diffusion of
ions and macromolecules (5,6).
Epithelial tight junctions are modulated during epithelial tissue
remodeling, wound repair, inflammation and tumorigenesis (24). There are at least 24 claudin
proteins, a number of which are upregulated or downregulated in
cancer, and these expression changes are tissue-specific (24). Although claudins are important in
cancer growth and progression (4,7),
relatively little is known about the underlying mechanisms
regulating their differential expression. Cancer-associated
epigenetic alterations can deregulate the accessibility of DNA
during gene transcription, replication, and DNA repair processes,
which result in massive deregulation of gene expression during
cancer development and progression (25).
In the present study, using a genome-wide ChIP-Seq
analysis, it was demonstrated that a high level of EZH2 at the
CLDN23 gene was associated with a decreased mRNA level of CLDN23 in
CRC tissue (Figs. 1 and 2). The inhibition of EZH2 enzymatic
activity using GSK126 increased the protein expression of CLDN23 in
HT-29 and Colo205 cell lines (Fig.
3C–E). Analysis of histone modifications upon the inhibition of
EZH2 revealed that the level of H3K27m3 was decreased at the CLDN23
promoter, whereas the level of H3K4me3 was high (Fig. 4). The presence of H3K4m3 and
H3K27m3 modifications, which are markers of active and repressed
transcription, respectively, simultaneously at a promoter was first
observed in embryonic stem (ES) cells and these regions were termed
‘bivalent domains’ (26). Previous
studies, using publically available chromatin datasets, also
detected bivalent domains in cell types of restricted potency and
cancer cell lines (27,28). The observation that genes central
to development/embryogenesis exhibit bivalent histone modifications
suggested that this bivalency enables regulation of the expression
of crucial factors during development and protects against
unscheduled gene expression, collectively contributing to the
robustness of these processes and reducing transcriptional noise
(29). Notably, the CLDN23 gene
has been classified as bivalent in three genome-wide analyses of
chromatin states in ES cells performed by Mikkelsen et al
(30), Ku et al (31) and Brookes et al (32). The latter study demonstrated that
the CLDN23 gene is occupied by EZH2 and components of the PRC1
complex, namely, Suz12 and the ubiquitin ligase Ring1B, which
monoubiquitinylates histone H2A at K119. Furthermore, this previous
study demonstrated that, in ES cells, the CLDN23 promoter is bound
by Pol2, which is phosphorylated at Ser5 within its C-terminal
domain, and is the form of Pol2, which initiates transcription. The
results did not assign CLDN23 to the actively expressed group of
PRC-occupied genes in ES cells, however, the study revealed that
even genes exhibiting high levels of expression can be associated
with repressive PRCs. This indicated that bivalency represents a
dynamic equilibrium between transcription activation and
repression, which maintains genes in a plastic, inducible state,
enabling increased expression levels when required (29). Of note, bivalent histone
modifications also effect the expression of the CLDN4 gene. The
expression of CLDN4 is repressed in healthy gastric and ovarian
tissues in association with bivalent histone modifications, and the
loss of repressive histone methylations and gain of active histone
modifications during tumorigenesis correlate with CLDN4
upregulation in gastric (33) and
ovarian (34) tissues.
The human CLDN23 gene was first characterized by
Katoh and Katoh (35) following
the observation that the mRNA encoded by CLDN23 was downregulated
in gastric cancer tissue. The CLDN23 transcript was reported to be
significantly downregulated in CRC tissue and a lower expression
level of this transcript was correlated with shorter overall
survival rates in CRC patients (36). Although the CLDN23 gene was first
described more than a decade ago, few studies have investigated and
no reports have described the mechanism regulating its expression
(7). The present study provided
evidence that the expression of CLDN23 is epigenetically regulated
and disruption of bivalent histone modifications at the CLDN23
locus may be responsible for the substantial downregulation of the
expression of CLDN23 in CRC tissue compared with that in NC tissue.
It was hypothesized that this downregulation contributes to a
decrease or loss of intercellular attachment, providing cancerous
cells with more oxygen and nutrients in their microenvironment,
enabling them to metastasize from their primary site to other areas
of the body. This hypothesis requires further investigation.
Acknowledgments
This study was supported by a grant from the
Ministry of Science and Higher Education (no. N401 071439).
References
|
1
|
Di Croce L and Helin K: Transcriptional
regulation by Polycomb group proteins. Nat Struct Mol Biol.
20:1147–1155. 2013. View Article : Google Scholar : PubMed/NCBI
|
|
2
|
Chang CJ and Hung MC: The role of EZH2 in
tumour progression. Br J Cancer. 106:243–247. 2012. View Article : Google Scholar :
|
|
3
|
Forbes MS: Cell Structure. Cell Physiology
Source Book. 4th. Sperelakis N: Academic Press; San Diego, CA: pp.
67–83. 2012
|
|
4
|
Ding L, Lu Z, Lu Q and Chen YH: The
claudin family of proteins in human malignancy: a clinical
perspective. Cancer Manag Res. 5:367–375. 2013.PubMed/NCBI
|
|
5
|
Findley MK and Koval M: Regulation and
roles for claudin family tight junction proteins. IUBMB Life.
61:431–437. 2009. View
Article : Google Scholar : PubMed/NCBI
|
|
6
|
Günzel D and Yu ASL: Claudins and the
modulation of tight junction permeability. Physiol Rev. 93:525–569.
2013. View Article : Google Scholar : PubMed/NCBI
|
|
7
|
Turksen K and Troy TC: Junctions gone bad:
claudins and loss of the barrier in cancer. Biochim Biophys Acta.
1816:73–79. 2011.PubMed/NCBI
|
|
8
|
Valle BL and Morin PJ: Claudins in Cancer
Biology. Current Topics in Membranes. Yu ASL: 65. Academic Press;
Amsterdam: pp. 293–333. 2010
|
|
9
|
Hanahan D and Weinberg RA: Hallmarks of
cancer: the next generation. Cell. 144:646–674. 2011. View Article : Google Scholar : PubMed/NCBI
|
|
10
|
Frixen UH, Behrens J, Sachs M, et al:
E-cadherin-mediated cell-cell adhesion prevents invasiveness of
human carcinoma cells. J Cell Biol. 113:173–185. 1991. View Article : Google Scholar : PubMed/NCBI
|
|
11
|
Hirohashi S and Kanai Y: Cell adhesion
system and human cancer morphogenesis. Cancer Sci. 94:575–581.
2003. View Article : Google Scholar : PubMed/NCBI
|
|
12
|
Skrzypczak M, Goryca K, Rubel T, et al:
Modeling oncogenic signaling in colon tumors by multidirectional
analyses of microarray data directed for maximization of analytical
reliability. PLoS One. 5:e130912010. View Article : Google Scholar : PubMed/NCBI
|
|
13
|
Mikula M, Rubel T, Karczmarski J, Goryca
K, Dadlez M and Ostrowski J: Integrating proteomic and
transcriptomic high-throughput surveys for search of new biomarkers
of colon tumors. Funct Integr Genomics. 11:215–224. 2011.
View Article : Google Scholar
|
|
14
|
Flanagin S, Nelson JD, Castner DG,
Denisenko O and Bomsztyk K: Microplate-based chromatin
immunoprecipitation method, Matrix ChIP: a platform to study
signaling of complex genomic events. Nucleic Acids Res. 36:e172008.
View Article : Google Scholar : PubMed/NCBI
|
|
15
|
Yu J, Feng Q, Ruan Y, Komers R, Kiviat N
and Bomsztyk K: Microplate-based platform for combined chromatin
and DNA methylation immunoprecipitation assays. BMC Mol Biol.
12:492011. View Article : Google Scholar : PubMed/NCBI
|
|
16
|
Mikula M, Bomsztyk K, Goryca K, Chojnowski
K and Ostrowski J: Heterogeneous nuclear ribonucleoprotein (HnRNP)
K genome-wide binding survey reveals its role in regulating 3′-end
RNA processing and transcription termination at the early growth
response 1 (EGR1) gene through XRN2 exonuclease. J Biol Chem.
288:24788–24798. 2013. View Article : Google Scholar : PubMed/NCBI
|
|
17
|
Aird D, Ross MG, Chen W-S, et al:
Analyzing and minimizing PCR amplification bias in Illumina
sequencing libraries. Genome Biol. 12:R182011. View Article : Google Scholar : PubMed/NCBI
|
|
18
|
Langmead B, Trapnell C, Pop M and Salzberg
SL: Ultrafast and memory-efficient alignment of short DNA sequences
to the human genome. Genome Biol. 10:R252009. View Article : Google Scholar : PubMed/NCBI
|
|
19
|
Zhang Y, Liu T, Meyer CA, et al:
Model-based analysis of ChIP-Seq (MACS). Genome Biol. 9:R1372008.
View Article : Google Scholar : PubMed/NCBI
|
|
20
|
Kent WJ, Sugnet CW, Furey TS, et al: The
human genome browser at UCSC. Genome Res. 12:996–1006. 2002.doi:
10.1101/gr.229102.Article published online before print in May
2002. PubMed/NCBI
|
|
21
|
ENCODE Project Consortium: An integrated
encyclopedia of DNA elements in the human genome. Nature.
489:57–74. 2012. View Article : Google Scholar : PubMed/NCBI
|
|
22
|
McCabe MT, Ott HM, Ganji G, et al: EZH2
inhibition as a therapeutic strategy for lymphoma with
EZH2-activating mutations. Nature. 492:108–112. 2012. View Article : Google Scholar : PubMed/NCBI
|
|
23
|
Mikula M, Gaj P, Dzwonek K, et al:
Comprehensive analysis of the palindromic motif TCTCGCGAGA: a
regulatory element of the HNRNPK promoter. DNA Res. 17:245–260.
2010. View Article : Google Scholar : PubMed/NCBI
|
|
24
|
Singh AB, Sharma A and Dhawan P: Claudin
family of proteins and cancer: an overview. J Oncol. 2010:2010.
View Article : Google Scholar : PubMed/NCBI
|
|
25
|
Chi P, Allis CD and Wang GG: Covalent
histone modifications - miswritten, misinterpreted and mis-erased
in human cancers. Nat Rev Cancer. 10:457–469. 2010. View Article : Google Scholar : PubMed/NCBI
|
|
26
|
Bernstein BE, Mikkelsen TS, Xie X, et al:
A bivalent chromatin structure marks key developmental genes in
embryonic stem cells. Cell. 125:315–326. 2006. View Article : Google Scholar : PubMed/NCBI
|
|
27
|
Larson JL and Yuan GC: Chromatin states
accurately classify cell differentiation stages. PLoS One.
7:e314142012. View Article : Google Scholar : PubMed/NCBI
|
|
28
|
Rodriguez J, Muñoz M, Vives L, Frangou CG,
Groudine M and Peinado MA: Bivalent domains enforce transcriptional
memory of DNA methylated genes in cancer cells. Proc Natl Acad Sci
USA. 105:19809–19814. 2008. View Article : Google Scholar : PubMed/NCBI
|
|
29
|
Voigt P, Tee WW and Reinberg D: A double
take on bivalent promoters. Genes Dev. 27:1318–1338. 2013.
View Article : Google Scholar : PubMed/NCBI
|
|
30
|
Mikkelsen TS, Ku M, Jaffe DB, et al:
Genome-wide maps of chromatin state in pluripotent and
lineage-committed cells. Nature. 448:553–560. 2007. View Article : Google Scholar : PubMed/NCBI
|
|
31
|
Ku M, Koche RP, Rheinbay E, et al:
Genomewide analysis of PRC1 and PRC2 occupancy identifies two
classes of bivalent domains. PLoS Genet. 4:e10002422008. View Article : Google Scholar : PubMed/NCBI
|
|
32
|
Brookes E, de Santiago I, Hebenstreit D,
et al: Polycomb associates genome-wide with a specific RNA
polymerase II variant, and regulates metabolic genes in ESCs. Cell
Stem Cell. 10:157–170. 2012. View Article : Google Scholar : PubMed/NCBI
|
|
33
|
Kwon MJ, Kim SH, Jeong HM, et al:
Claudin-4 overexpression is associated with epigenetic derepression
in gastric carcinoma. Lab Invest. 91:1652–1667. 2011. View Article : Google Scholar : PubMed/NCBI
|
|
34
|
Kwon MJ, Kim SS, Choi YL, et al:
Derepression of CLDN3 and CLDN4 during ovarian tumorigenesis is
associated with loss of repressive histone modifications.
Carcinogenesis. 31:974–983. 2010. View Article : Google Scholar : PubMed/NCBI
|
|
35
|
Katoh M and Katoh M: CLDN23 gene,
frequently down-regulated in intestinal-type gastric cancer, is a
novel member of CLAUDIN gene family. Int J Mol Med. 11:683–689.
2003.PubMed/NCBI
|
|
36
|
Pitule P, Vycital O, Bruha J, et al:
Differential expression and prognostic role of selected genes in
colorectal cancer patients. Anticancer Res. 33:4855–4865.
2013.PubMed/NCBI
|