Introduction
Glycosylation of proteins is the most important
posttranslational modification in eukaryotes. Changes in
glycosylation patterns are known to occur during cancer formation
and progression (1–3). These changes influence cellular
functions including cell adhesion and cell immunogenicity (4,5), and
facilitate the generation of remote metastases (1). These effects predominantly occur from
changes in gene expression levels of glycosyltransferases (GTs),
which are often regulated by oncogenes (6,7).
Hence, conclusive studies using cancer cell lines and primary
tumours (4) have suggested that
the gene expression patterns of glycosyltransferases may serve as a
prognostic marker in patients with cancer (8,9).
Circulating tumour cells (CTCs) are cells that
dissociate from primary epithelial tumours, circulate through blood
stream and lymphatic vessels and are the predominant cause of
remote metastasis (10–12). All these abilities can reportedly
be regulated by glycosylation and therefore establish a strong
association to altered glycosylation (13). It is hypothesized that CTCs show
different glycosyltransferase (GT) gene expression levels not only
in comparison to normal epithelial cells, but also in comparison to
surrounding blood cells. This hypothesis therefore suggests that
CTCs may be detected and analyzed by quantitative polymerase chain
reaction and in a further step might also open roads towards
characterizing CTCs by GT gene expression levels.
The present study first analyzed the gene expression
levels of six GT genes including: N-acetylgalactosaminyl
transferase 6 (GALNT6), N-acetylglucosaminyl transferase V
(MGAT5B), ST3 β-galactoside α-2,3-sialyltransferase 1 (ST3GAL1),
fucosyl transferase 3 (FUT3), ST3 β-galactoside α-2,3-sialyl
transferase 3 (ST3GAL3) and ST6 (α-N-acetyl-neuraminyl-2,3-β-galac
tosyl-1,3)-N-acetylgalactosaminide α-2,6-sialyltransferase 1
(ST6GALNac1) in blood samples of healthy donors that had been
inoculated with different numbers of breast cancer cells.
The studied genes were selected due to the following
associations with breast cancer: GALNT6 is involved in the
fibronectin pathway and is responsible for breast tumour
development and progression (14);
MGAT5B has been reported to function in cell motility and
metastasis formation (1,5); ST3GAL1 was found to be increasingly
expressed in primary breast carcinoma cells and may be correlated
to histological grade (15); FUT3
is an effector of metastasis in hormone receptor dependent breast
cancers (16); ST3GAL3 is known to
be correlated with tumour size and number of affected lymph nodes
(9); and ST6GALNac1 is associated
with ductal carcinomas and patients with an elevated expression of
ST6GALNac1 have a better prognosis for survival (17).
After establishing a model system, the three best
performing genes in the primary blood samples of 20 patients with
adjuvant breast cancer were compared to 20 healthy donors. The
differences in expression levels of the two groups were analysed
and correlated to GT gene expression levels with tumour
characteristics.
Materials and methods
Blood samples
All patients enrolled in the present study provided
a written informed consent and the research was performed in
compliance with the Helsinki Declaration (ethical vote 148-12). A
total of 20 ml blood was obtained from 20 patients with adjuvant
breast cancer and from healthy donors in EDTA-tubes to prevent
early coagulation. As a standard, all samples, from adjuvant breast
cancer patients as well as from healthy donors with or without
inoculation, were treated in the same manner including the
subsequent reverse transcription and quantitative PCR reactions.
The blood samples were subjected to density gradient centrifugation
(400 × g, 30 min); the buffy-coat solutions were discarded and the
harvested cell pellets were washed twice with phosphate-buffered
saline (Biochrom GmBH, Berlin, Germany) and centrifugation (250 ×
g, 10 min). After discarding surplus supernatant, the cell pellets
were air-dried and stored at −80°C until further use.
Cell lines
Cama-1 (HTB-21; mammary gland adenocarcinoma), MCF-7
(57136; mammary gland adenocarcinoma) and ZR-75-1 (CRL-1500; ductal
carcinoma) breast cancer cell lines were obtained from the American
Type Culture Collection (Manassas, VA, USA) and sub-cultured
according to the manufacturer’s instructions. After a detachment
step with trypsin (Biochrom GmBH), the cells were counted with a
hematocytometer and added to the blood samples in predefined
numbers (10 cells/ml blood, 100 cells/ml blood, 1,000 cells/ml
blood).
RNA extraction
Blood cell pellets were thawed and dissolved in 1 ml
TRIzol® (Invitrogen Life Technologies, Darmstadt,
Germany). For innoculation experiments, the breast cancer cells
were subsequently added following TRIzol treatment, in order to
prevent immunologic effects. Subsequently, 0.2 ml chloroform (Merck
Millipore, Darmstadt, Germany) was added and the suspension was
vigorously mixed before centrifugation at 12,000 × g for 15 min at
4°C. The clear liquid phase was aspired and 1 ml isopropanol (Merck
Millipore, Darmstadt, Germany) was added. The solution was stored
overnight at −20°C to precipitate the RNA. On the following day,
the solution was centrifuged at 12,000 × g for 10 min at 4°C, the
supernatant was carefully removed and the RNA pellet was washed
twice with 75% ethanol (Merck Millipore) by centrifugation at
12,000 × g for 10 min at 4°C. The RNA-pellet was dried, resolved in
20 μl DEPC-treated water and stored at −20°C until further
use. To control the RNA quantity and quality, the concentration was
measured using a Nano-photometer (Implen GmbH, Munich, Germany) and
denaturing formaldehyde gel electrophoresis was performed.
Reverse transcription
Reverse transcription was performed using
SuperScript III First Strand Synthesis Super Mix (Invitrogen Life
Technologies), according to the manufacturer’s instructions. A
total of 4 μg RNA was used for a single reverse
transcription reaction.
Quantitative PCR
For quantitative PCR, TaqMan® Fast
Universal PCR Master Mix (Applied Biosystems Life Technologies,
Foster City, CA, USA) was used. For each gene, a reaction mix
consisting of 10 μl Master Mix, 7 μl H2O
and 1 μl TaqMan Primer (GALNT6: Hs_00200529_m1, MGAT5B:
Hs_01586300_m1, ST3GAL1: Hs_00161688_m1, FUT3: Hs_00356857_m1,
ST3GAL3: Hs_00544033_m1, ST6GALNac1: Hs_00300842_m1) was prepared
and added to 2 μl cDNA in a 96-well plate (Micro
Amp® Fast Optical 96-Well Reaction Plate with Barcode;
Applied Biosystems Life Technologies), which was then sealed with
an adhesive cover and analysed in a 7500 Fast Real Time PCR machine
(Applied Biosystems Life Technologies). Each gene was analysed as
quadruplicate. The PCR cycles were run as follows: initial
denaturation (95°C for 20 s), followed by 40 cycles with
denaturation (3 s at 95°C) and primer extension (30 s at 60°C). The
fluorescence for each gene was displayed by the SDS 1.3.1 software
(Applied Biosystems Life Technologies).
Evaluation
The SDS software performed an automatic calculation
of CT-, ΔCT-, ΔΔCT- and relative quantification (RQ) values
(18). The resulting files were
exported to Microsoft® Excel™(Microsoft Corporation,
Redmond, WA, USA) and graphs were generated. Statistical
evaluations were performed by using SPSS version 21.0
(International Business Machines Corporation, Ehningen, Germany).
For patient samples and negative control samples, the average RQ
value of all 20 samples was calculated including the “not
detected”-samples, using “0” as replacement character.
Results
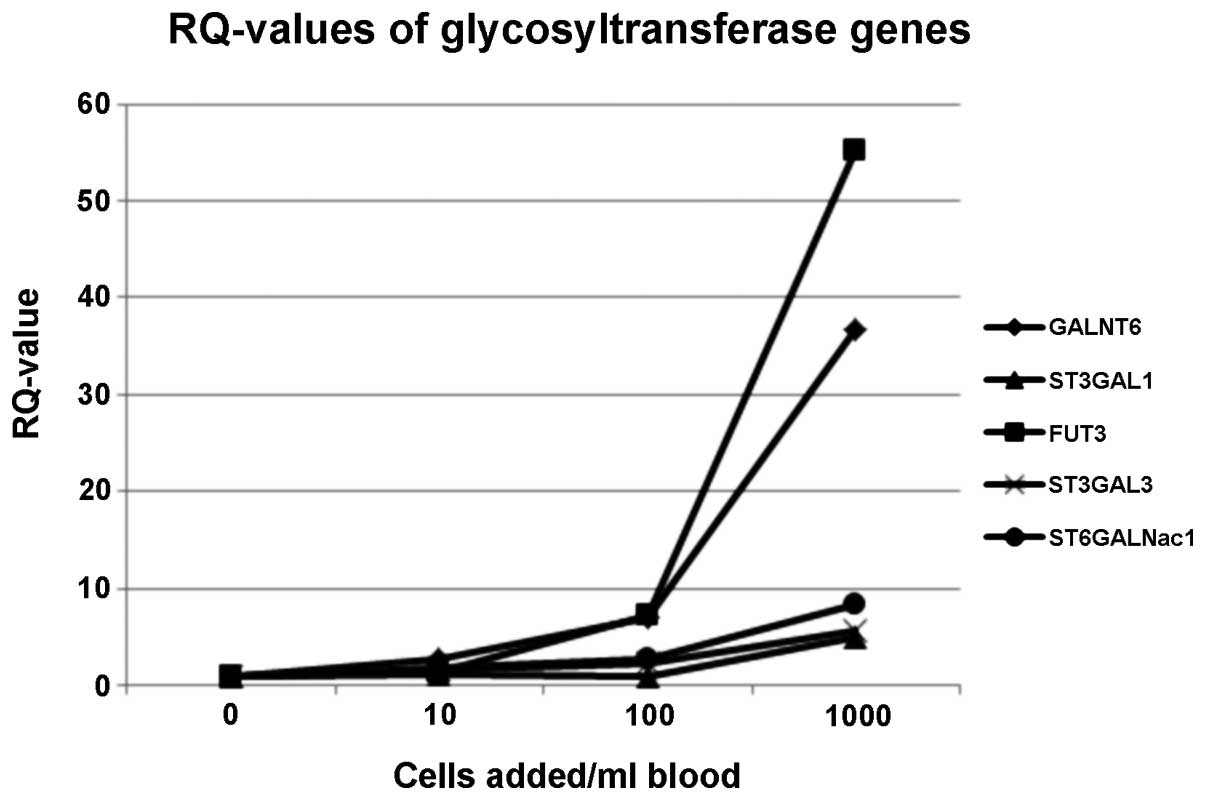
RQ-values of glycosyltransferase genes in
blood inoculation experiments
The RQ curves showed that 5/6 analysed GT genes
could be used for CTC-detection. Only one gene (MGAT5B) was
expressed at low levels such that it was not detected by
quantitative PCR. FUT3 and GALNT6 exhibited the highest RQ-values,
which indicated that they maybe suitable genes for CTC detection
from blood samples. Gene expression levels of ST3GAL3 and
ST6GALNac1 also increased from the 10-cells/ml blood sample on, but
underperformed in the logarithmic model system. The only gene for
which the RQ-values markedly increased from the 100-cells/ml blood
on was ST3GAL1 (Fig. 1).
Statistical evaluation of inoculation
experiments
Increases in gene expression were analysed
statistically for each gene and every concentration of added breast
cancer cells. ΔCt-values were used for analysis. In a two-tailed
T-test, the ΔCt-values of the reference sample without addition of
tumour cells were compared to the samples where 10, 100 and 1,000
breast cancer cells had been added. The results of these statistics
are shown in Table I. Regarding
the statistical evaluation, the best gene for CTC-detection, with
significantly different ΔCt-values from the 10-cell level on is
GALNT6 (P=0.0023). Accordingly, GALNT6 P-values for the 100- and
1000- cell samples were significantly different from the reference
sample and revealed the highest P-values of all examined genes
(P=1.3×10⁻⁵ and P=3.8×10⁻⁷, respectively).
ST3GAL3 and ST6GALNac1 exhibited borderline significantly different
ΔCt-values at the 10-cell level (P=0.0051 and P=0.0097), and the
values for the 100- and 1,000 cell samples for these two genes were
significantly different from the reference sample
(P=4.9×10⁻⁵ and 1.3×10⁻⁶ for ST3GAL3 and
0.0039 and 1×10⁻⁴ for ST6GALNac1). The ΔCt-values of
FUT3 showed a significant difference to the 0-cell sample from the
100-cell level (P=0.027 and P=0.0018 for 1000 cells added to the
blood sample), whereas the 10-cell sample showed no difference to
the sample without addition of tumour cells (P=0.553). ST3GAL1 was
only significantly different in ΔCt-value for the 1000-cell sample
(P=0.0013). The other two values did not reach significance
(P=0.5918 for 10 breast cancer cells added and P=0.684 for 100
breast cancer cells).
 | Table IStatistical comparison of ΔCt values
of glycosyltransferase genes between samples without addition of
breast cancer cells and samples containing 10, 100, or 1,000 tumour
cells. |
Table I
Statistical comparison of ΔCt values
of glycosyltransferase genes between samples without addition of
breast cancer cells and samples containing 10, 100, or 1,000 tumour
cells.
| Δ Ct comparison | P-value
|
|---|
| GALNT6 | MGAT5B | ST3GAL1 | FUT3 | ST3GAL3 | ST6GALNac1 |
|---|
| 0 vs. 10 cells | 0.0023 | nd | 0.5918 | 0.553 | 0.0051 | 0.097 |
| 0 vs. 100 cells |
1.3×10⁻⁵ | nd | 0.684 | 0.027 |
4.9×10⁻⁵ | 0.0039 |
| 0 vs. 1,000
cells |
3.8×10⁻⁷ | nd | 0.0013 | 0.0018 |
1.3×10⁻⁶ |
1.0×10⁻⁴ |
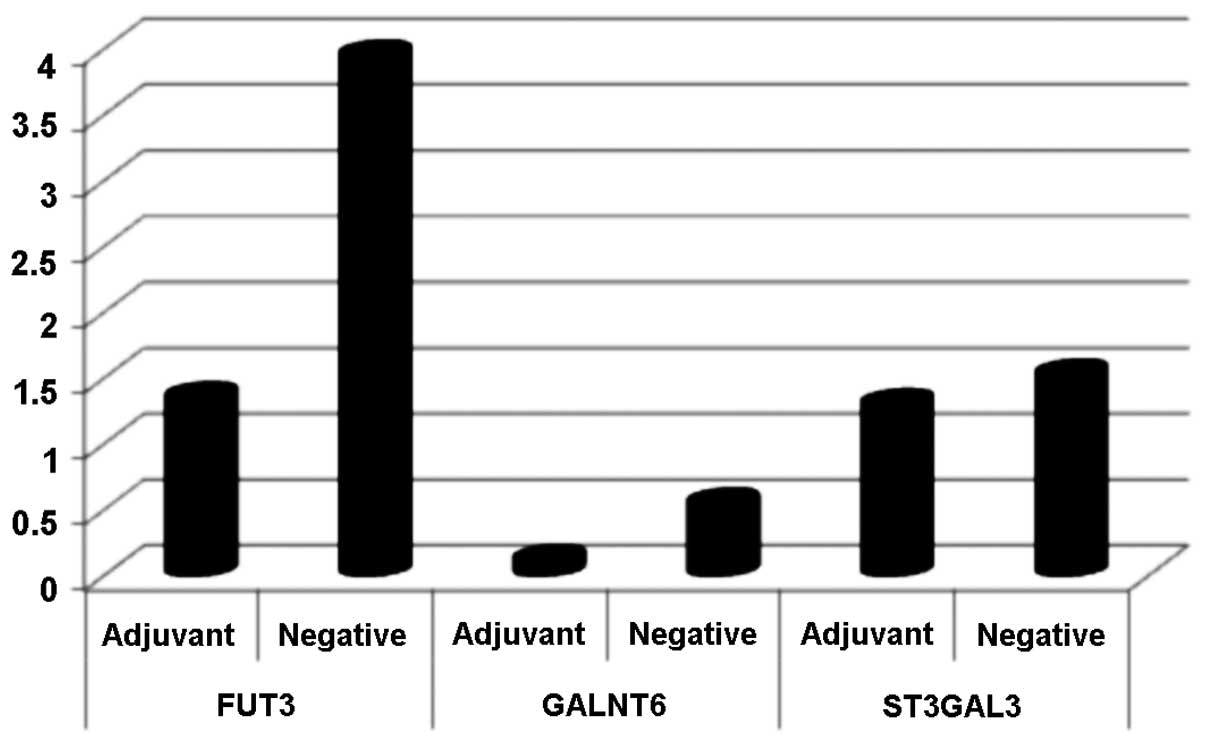
RQ-values of adjuvant breast cancer
patient samples vs. negative control samples
After establishing the model system, GALNT6, FUT3
and ST3GAL3 were selected to be analysed in the patient samples.
FUT3 expression was detected in five of the patients and seven of
the negative control samples, GALNT6 in 12 and 14 samples,
respectively, and ST3GAL3 was detectable in almost all patients
(n=19) and negative control (n=17) samples, by quantitative PCR.
Average RQ-values for each gene were calculated for the adjuvant
breast cancer patients as well as for the negative control group.
For the three genes analysed, the average RQ-values were higher
overall in the negative control sample group as compared with the
patient sample group. The highest average RQ-value divergence was
observed in FUT3 (Fig. 2).
Association of RQ-values with tumour
characteristics
The RQ-values of gene expression of the adjuvant
breast cancer samples were correlated to their tumour
characteristics. It was identified that in two patients (No. 6 and
15) all three gene expression values were upregulated (RQ-values
>1). In two further patients (No. 7 and 11), FUT3 and ST3GAL3
were upregulated in comparison to a healthy control sample
(Table II). However, significant
correlations of changes in gene expressions to age at primary
diagnosis, histological subtype, tumour size, nodal state, grading
or hormone- and Her-2 receptors, could not be generated from this
dataset.
| Table IIAssociation of relative quantification
(RQ)-values with patient/tumour characteristics. |
Table II
Association of relative quantification
(RQ)-values with patient/tumour characteristics.
| Patient number | Age (years) | Histological
subtype | Tumour size (mm) | Nodal stage | Grading | ER % | PR % | Her2 | FUT3 | GALNT6 | ST3GAL3 |
|---|
| 1 | 58 | Inv. duct. | 1b (11) | 1a | 2 | 100 | 50 | pos | n.d. | n.d. | 0.025 |
| 2 | 71 | Inv. duct. /
DCIS | 2 (27) | 1 | 2 | pos | pos | neg | n.d. | n.d. | 0.129 |
| 3 | 50 | Inv. duct. | 1c (12) | 0 | 3 | 90 | 100 | neg | n.d. | n.d. | 4.185 |
| 4 | 52 | Inv. duct. | 1c (18) | 0 | 2 | 90 | 30 | neg | n.d. | n.d. | 2.828 |
| 5 | 42 | Inv. duct. | 3 (58) | 0 | 3 | 75 | 0 | neg | n.d. | n.d. | n.d. |
| 6 | 48 | Inv. duct. | 1c (11) | 0 | 3 | 0 | 0 | pos | 14.893 | 1.416 | 5.023 |
| 7 | 42 | Inv. duct. /
DCIS | 1 (1) | 1 | 2 | 90 | 1 | neg | 3.829 | 0.905 | 4.327 |
| 8 | 38 | Inv. duct. | 1b (8) | 0 | 2 | 100 | 30 | neg | n.d. | n.d. | 0.137 |
| 9 | 73 | Inv. duct. | 1c (12) | 1a | 2 | 90 | 90 | neg | n.d. | n.d. | 0.041 |
| 10 | 62 | Inv. lob. /
LIN | 2 (38) | 0 | 2 | 90 | 80 | neg | n.d. | n.d. | 0.037 |
| 11 | 69 | Inv. lob. | 1b (9) | 0 | 2 | 90 | 5 | neg | 1.271 | 0.210 | 1.365 |
| 12 | 56 | Inv. duct. | 1a (4) | 0 | 1 | 81 | 5 | neg | n.d. | 0.018 | 0.164 |
| 13 | 60 | Inv. lob. /
DCIS | 2 (40) | 1a | 2 | 90 | 30 | pos | n.d. | 0.043 | 0.093 |
| 14 | 54 | Inv. duct. /
DCIS | 1a (10) | 0 | 2 | 80 | 5 | pos | 1.481 | 0.052 | 0.168 |
| 15 | 58 | Inv. duct. | 1c (10) | 0 | 2 | 10 | 1 | neg | 5.538 | 1.194 | 4.785 |
| 16 | 73 | Inv. duct. | 2 (25) | 0 | 2 | 80 | 80 | neg | n.d. | 0.110 | 0.108 |
| 17 | 54 | Inv. duct. | 1c (13) | 0 | 1 | 100 | 100 | neg | n.d. | 0.213 | 1.863 |
| 18 | 51 | Inv. duct. /
lob. | 1c (19) | 1a | 2 | 90 | 90 | neg | n.d. | 0.101 | 0.082 |
| 19 | 33 | Inv. duct. | 2 (30) | 0 | 2 | 99 | 99 | pos | n.d. | 0.110 | 0.100 |
| 20 | 74 | Inv. duct. | 1c (25) | 0 | 2 | 99 | 99 | pos | n.d. | 0.470 | 0.499 |
Discussion
Altered glycosylation of membrane bound proteins is
a predominant feature of tumour cells that is necessary for cell
adhesion and detachment processes and facilitates immune escape of
malignant cells. Quantitative PCR-based techniques are already in
use for solid tumour profiling and are considered to be objective,
robust and cost-effective molecular techniques that could be used
in routine cancer diagnostics (19). The present study used a
Quantitative PCR assay for the detection of CTCs from peripheral
blood. This approach is advantageous for the patient, avoiding
painful and sometimes unsatisfactory procedures for biopsies or
bone marrow aspirations for analysis.
Glycosyl transferases are a new group of marker
genes for CTC-detection from blood samples of patients with breast
cancer. In the model system presented, increases in gene expression
of different glycosyl transferases were identified through
Quantitative PCR, with increasing numbers of breast cancer cells
that had been added to the blood sample of a healthy donor.
The inoculation of blood with breast cancer cells
identified FUT3 as the most suitable gene for CTC-detection.
Further statistical evaluation revealed that GALNT6 could be
another valuable marker to detect CTCs, since as few as 10 breast
cancer cells per ml blood sample were detectable with statistical
significance when compared to the reference sample.
In contrast, in the patient situation, the detection
of glycosyltransferase gene expression appears to be more
difficult. In some of the patient samples, expressions for the
selected genes were not detectable at all. In other cases, the
average gene values of the three most promising markers were
markedly higher in the 20 negative control samples, as compared to
the 20 adjuvant breast cancer samples. It may therefore be
concluded that results from the inoculation experiments should be
regarded with caution. The model system situation does not
necessarily allow conclusions to be drawn in a clinical
setting.
To overcome these limitations, a greater patient
collective should be analysed by quantitative PCR in order to
minimize statistical shortcomings due to low patient numbers.
Simultaneously, patient samples could be purified by the
CellSearch™ system, which is the only Food and Drug
Administration-approved method for CTC-detection from blood
samples. The benefit is that especially in the metastatic setting,
cleaner cell populations could be analysed and subsequently
compared to results of whole blood analysis. Since it is known that
the incidence for CTCs is much higher in metastatic patients, we
suspect that the establishment of a detection assay based on
quantitative PCR with GT markers could be much easier. However,
blood samples of metastatic breast cancer patients are more
difficult to obtain and thereby sample numbers are limited. Another
obstacle is, that a simultaneous CellSearch™ analysis to
quantitative PCR is relatively expensive. Importantly,
hematopoietic cells display at least a background expression of
glycosyltransferases, which emphasizes the role and importance of
adequate negative controls of healthy patients.
It could be of major importance to take into account
that multiple different subsets of breast cancers exist. In that
regard, it may be required to establish standards for each subset
(such as hormone-receptor positive, HER2neu overexpression, claudin
low, basal, luminal etc.) to balance out the possibility of
differential patterns of expression. A prior association between
different gradings cannot be ruled out.
Glycosyltransferases may not be the ideal marker
genes for quantitative PCR-based detection of CTCs from blood
samples of breast cancer patients. This may be due to environmental
influence, which can change rapidly according to different handling
techniques. Also, precise and careful handling of the primary
patient-derived blood samples is critical. Moreover, the monitoring
of gene expression of glycosyltransferases cannot be directly
associated to aberrant glycosylation and unfolding, as the temporal
order of events may differ. However, encouraging results in the
present study, especially in the presented model system, suggest
that a few select glycosyltransferases could be of use in certain
defined situations.
Acknowledgments
The present study was supported by a grant of the
Heuer-Stiftung Für Medizinische Forschung (grant no. 0012013). The
authors thank T. Thormeyer for help with statistical
evaluations.
References
|
1
|
Dennis JW, Granovsky M and Warren CE:
Glycoprotein glycosylation and cancer progression. Biochim Biophys
Acta. 1473:21–34. 1999. View Article : Google Scholar : PubMed/NCBI
|
|
2
|
Hakomori S: Aberrant glycosylation in
tumors and tumor-associated carbohydrate antigens. Adv Cancer Res.
52:257–331. 1989.PubMed/NCBI
|
|
3
|
Varki A, Cummings R and Esko J:
Glycosylation Changes in Cancer. Essentials of Glycobiology. Varki
A: Cold Spring Harbor Press; 1999
|
|
4
|
Cazet A, Julien S, Bobowski M, Burchell J
and Delannoy P: Tumour-associated carbohydrate antigens in breast
cancer. Breast Cancer Res. 12:2042010. View
Article : Google Scholar : PubMed/NCBI
|
|
5
|
Demetriou M, Nabi IR, Coppolino M, Dedhar
S and Dennis JW: Reduced contact-inhibition and substratum adhesion
in epithelial cells expressing GlcNAc-transferase V. J Cell Biol.
130:383–392. 1995. View Article : Google Scholar : PubMed/NCBI
|
|
6
|
Buckhaults P, Chen L, Fregien N and Pierce
M: Transcriptional regulation of N-acetylglucosaminyltransferase V
by the src oncogene. J Biol Chem. 272:19575–19581. 1997. View Article : Google Scholar : PubMed/NCBI
|
|
7
|
Le Marer N, Laudet V, Svensson EC, et al:
The c-Ha-ras oncogene induces increased expression of
beta-galactoside alpha-2, 6-sial-yltransferase in rat fibroblast
(FR3T3) cells. Glycobiology. 2:49–56. 1992. View Article : Google Scholar : PubMed/NCBI
|
|
8
|
Hebbar M, Krzewinski-Recchi MA, Hornez L,
et al: Prognostic value of tumoral sialyltransferase expression and
circulating E-selectin concentrations in node-negative breast
cancer patients. Int J Biol Markers. 18:116–122. 2003.PubMed/NCBI
|
|
9
|
Recchi MA, Hebbar M, Hornez L,
Harduin-Lepers A, Peyrat JP and Delannoy P: Multiplex reverse
transcription polymerase chain reaction assessment of
sialyltransferase expression in human breast cancer. Cancer Res.
58:4066–4070. 1998.PubMed/NCBI
|
|
10
|
Pantel K and Brakenhoff RH: Dissecting the
metastatic cascade. Nat Rev Cancer. 4:448–456. 2004. View Article : Google Scholar : PubMed/NCBI
|
|
11
|
Ring A, Smith IE and Dowsett M:
Circulating tumour cells in breast cancer. Lancet Oncol. 5:79–88.
2004. View Article : Google Scholar : PubMed/NCBI
|
|
12
|
Smerage JB and Hayes DF: The measurement
and therapeutic implications of circulating tumour cells in breast
cancer. Br J Cancer. 94:8–12. 2006. View Article : Google Scholar
|
|
13
|
Lange T, Samatov TR, Tonevitsky AG and
Schumacher U: Importance of altered glycoprotein-bound N- and
O-glycans for epithelial-to-mesenchymal transition and adhesion of
cancer cells. Carbohydr Res. 389:39–45. 2014. View Article : Google Scholar : PubMed/NCBI
|
|
14
|
Park JH, Katagiri T, Chung S, Kijima K and
Nakamura Y: Polypeptide N-acetylgalactosaminyltransferase 6
disrupts mammary acinar morphogenesis through O-glycosylation of
fibronectin. Neoplasia. 13:320–326. 2011. View Article : Google Scholar : PubMed/NCBI
|
|
15
|
Fan TC, Li WD, Chang CH, et al: Role of
ST3Gal1 sialyltransferase in breast cancer cells. Cancer Res.
71:23052011. View Article : Google Scholar
|
|
16
|
Julien S, Ivetic A, Grigoriadis A, et al:
Selectin ligand sialyl-Lewis x antigen drives metastasis of
hormone-dependent breast cancers. Cancer Res. 71:7683–7693. 2011.
View Article : Google Scholar : PubMed/NCBI
|
|
17
|
Patani N, Jiang W and Mokbel K: Prognostic
utility of glycosyltransferase expression in breast cancer. Cancer
Genomics Proteomics. 5:333–340. 2008.
|
|
18
|
Livak KJ and Schmittgen TD: Analysis of
relative gene expression data using real-time quantitative PCR and
the 2(-Delta Delta C(T)) Method. Methods. 25:402–408. 2001.
View Article : Google Scholar
|
|
19
|
Bernard PS and Wittwer CT: Real-time PCR
technology for cancer diagnostics. Clin Chem. 48:1178–1185.
2002.PubMed/NCBI
|