Introduction
Serum and plasma are two of the most commonly used
materials in clinical diagnosis. It is known that serum, following
the exclusion of fibrinogen and other blood clotting factors, is
essentially plasma. Fibrinogen is a type of protein responsible for
the coagulation of blood, by converting itself into fibrin, whereas
plasma is defined as the medium of blood, in which red blood cells,
white blood cells and other components are suspended (1).
The identification of cell-free nucleic acids in
plasma and serum (2–4) has led to the detection of fetal DNAs
and fetal RNAs in maternal plasma (5–7).
However, few reports have demonstrated the differences between the
plasma and serum, and the majority have predominantly selected
plasma and serum randomly in clinical and academic investigations.
Lo et al revealed no significant differences in the results
obtained from the serum or the plasma (8), although other previous studies have
revealed that serum fetal DNA was higher compared with plasma fetal
DNA (5,9,10).
However, there remains no consensus regarding the method of
selection of nucleic acids for specific investigations. Therefore,
systematic investigations at the level of the genome are required
to determine differences in the expression of certain nucleic acids
between the serum and plasma.
MicroRNAs (miRNAs) are common, 19–22 nucleotide
long, non-coding RNA molecules, which post-transcriptionally
regulate gene expression by base-pairing with the 3′ untranslated
region of complementary messenger RNA targets (11,12).
miRNAs have been identified in animal cells and are considered to
be important in numerous vital processes, including embryonic
development, cellular differentiation, proliferation and apoptosis
(13). It has also been
demonstrated that miRNAs may function as tumor suppressors and
oncogenes (14). Given the
importance of miRNAs in post-transcriptional regulation,
identification of these differentially expressed miRNAs may assist
in elucidating the molecular differences between the serum and
plasma of pregnant females.
miRNA in the peripheral blood of pregnant females,
as one of the circulating nucleic acids, has been an area of focus
due to its importance in gene regulation (15) and its potential use in non-invasive
prenatal diagnosis. The development of the next generation
sequencing technology has provided a promising tool for whole
genomic assays of circulating miRNAs. Differentially expressed
miRNAs have been detected using sequencing in maternal plasma at
differential gestational ages and inabnormal pregnancy in several
associated studies (8,16–19).
In the present study, the miRNA in the serum and plasma of pregnant
females were sequenced using Sequencing by Oligonucleotide Ligation
and Detection (SOLiD) technology. Identification of the
differentially expressed miRNAs between the maternal serum and
plasma may provide an important foundation for the future
application of serum and plasma in clinical investigations.
Patients and methods
Patients
Plasma samples were collected from 12 pregnant
females in the second trimester (24–28 weeks of gestational age),
serum samples were collected from 20 pregnant females in the same
trimester and three females contributed serum and plasma samples.
All pregnancies were normal, uncomplicated singleton pregnancies
with no fetal malformation. Written informed consent was obtained
from all the patients involved in the present study and the study
was approved by the Ethics Committee of Zhongda Hospital, Southeast
University (Nanjing, China).
Sample processing and miRNA
extraction
The plasma and serum were separated from the blood
samples, according to our previous study (20). Briefly, for the plasma samples, 2
ml blood was collected from each female, placed in EDTA-containing
tubes and centrifuged at 4°C and 1,600 × g for 10 min, and then at
4°C and 16,000 × g for a further 10 min, in order to free the
plasma from any remaining blood cells. For the serum samples, the
blood was allowed to clot by leaving it undisturbed at room
temperature for 30 min following collection of the whole blood,
following which the clot was removed by centrifugation at 4°C and
3,000 × g for 10 min. The serum and plasma were carefully
transferred into fresh tubes and stored at −80°C. All the plasma
and serum samples were pooled, respectively, prior to sequencing.
The miRNA was extracted from 5 ml of the pooled plasma or serum
using an mirVana™ miRNA Isolation kit (Ambion, Austin, TX, USA)
with minor modifications (3 ml TRIzol LS reagent was added to the
plasma or serum samples prior to purifying with the column). The
circulating miRNA was eluted to a final volume of 20 µl, and
~500 ng of miRNA was obtained from each group. The quantity and
quality of the obtained miRNA was measured using a NanoDrop ND-1000
spectrophotometer (NanoDrop, Wilmington, DE, USA).
Small RNA library construction and
high-throughput sequencing
Small RNA libraries were constructed based on
ligase-enhanced genome detection technology using a SOLiD small RNA
expression kit (Life Technologies, Grand Island, NY, USA) with
minor modifications, including using a different Ligase (T4 RNA
ligase 1; NEB, Ipswich, MA, USA). L-adaptors and R-adaptors
(Takara, Bio, Inc., Dalian, China) were ligated to the miRNA
samples, which were subsequently purified by size-selection using
6% polyacrylamide gel electrophoresis following each ligation. A
six nucleotide barcode (Takara Bio, Inc.) was introduced during
RT-qPCR amplification. These two prepared libraries and other
encoded samples were pooled at the same concentration (50
pg/µl) prior to emulsion PCR (21). All the procedures for template bead
preparation were performed, according to the standard SOLiD
protocol, and the prepared slides were analyzed on a SOLiD system
V3 (Life Technologies), according to the multiplexing
instructions.
Read filter and small RNA annotation
For the deep-sequencing reads produced by the SOLiD
sequencer, the sequencing reads were decoded using barcodes,
consequently allowing one mismatch in each six nucleotide coding
region. Those reads, which matched a barcode uniquely were used for
mapping. Mapping of the SOLiD reads was performed using a SOLiD
system small RNA analysis pipeline tool (RNA2MAP, version 0.5.0;
Life Technologies). Following filtering of the other human
non-coding RNAs (rRNA, snoRNA, snRNA and tRNA), raw expression
values (read counts) were obtained by totalling the number of reads
that mapped uniquely to the, miRBase release 14.0 (http://www.mirbase.org/ftp.shtml) and Human
Genome RefSeq Hg19 (ftp://ftp.sanger.ac.uk/pub/gencode/Gencode_human/)
reference databases.
To quantify and compare the expression levels of
miRNAs across the datasets or samples, the raw expression profiles
were normalized using linear transformations of each dataset. Only
those miRNAs with count values >10 were selected to produce the
novel and reliable expression profiles for further analysis. The
expression profiles were normalized against the total counts of
1,000,000, according to their percentage spaces. To compare the
differential expression of miRNAs in the serum compared with the
plasma, two indexes were analyzed, and the P-value and the
fold-change of logarithmic analysis of the read counts (log2-ratio)
were determined. Only those miRNAs with P<0.01 and fold-change
>2 were considered to be differentially expressed in the sample
compared with the control.
Functional enrichment analysis of
predicted target genes of differentially expressed miRNAs
Subsequently, the experimentally validated target
sites were collected from the TargetScan database (22). The functional relationship of genes
that are targeted by ≥2 miRNAs was evaluated using gene ontology
(GO) and Kyoto Encyclopedia of Genes and Genomes (KEGG). To
identify KEGG pathways enriched with gene targets, the gene set
analysis was performed using WEB-based GEne SeT AnaLysis Toolkit
(Web-Gestalt; Department of Biomedical Informatics, Vanderbilt
University, Nashville, TN, USA). Statistical significance of
pathways was determined on the basis of P<0.05 and the presence
of at least two target genes in the pathway.
Reverse transcription-quantitative
(RT-q)PCR
The miRNA was extracted from the plasma and serum
samples following pooling, according to the method described above.
For the RT reactions, ~150 ng small RNA was used with an AMV
Reverse Transcriptase XL kit (Takara Bio, Inc.) at 42°C for 60 min
with a final volume of 20 µl, followed by final incubation
at 95°C for 5 min. The following qPCR was performed using
SYBR® Premix Ex Taq™ II (Perfect Real Time; Takara,
Bio., Inc.) on an Applied Biosystems 7500 real-time PCR machine
(Life Technologies) by using 2 µl of the cDNA obtained in
the RT reaction. The primers were synthesized by Takara Bio, Inc..
The PCR reaction was performed at 95°C for 5 min, followed by 45
cycles at 94°C for 15 sec, 58°C for 30 sec and 72°C for 30 sec.
Each PCR was repeated three times. The relative expression level of
each miRNA was normalized against that of U6 snRNA. The mean value
of Ct for each triplicate was calculated. Fold changes in gene
expression were calculated by ΔΔCt (23) and normalized with ΔCt =
CtmiRNA − CtU6, ΔΔCt = ΔCtserum −
ΔCtplasma. Quantification of qPCR was based on
determination of the quantification cycle and PCR efficiency was
calculated from the log-linear portion of the standard curves.
P-values of differentially expressed miRNAs were calculated based
on Poisson's distribution. P<0.05 was considered to indicate a
statistically significant difference.
Results and Discussion
SOLiD sequencing results of maternal
serum and plasma
To investigate small RNA transcriptions, SOLiD
high-throughput sequencing was performed in serum and plasma small
RNA libraries. The results demonstrated that ~47% of the decoded
sequences were mappable using the SOLiD system small RNA analysis
pipeline tool (RNA2MAP, version 0.5.0). Following filtering and
removal of reads with low quality and no insert between the
L-adaptor and R-adaptor, 2,925,149 and 6,850,295 sequence reads
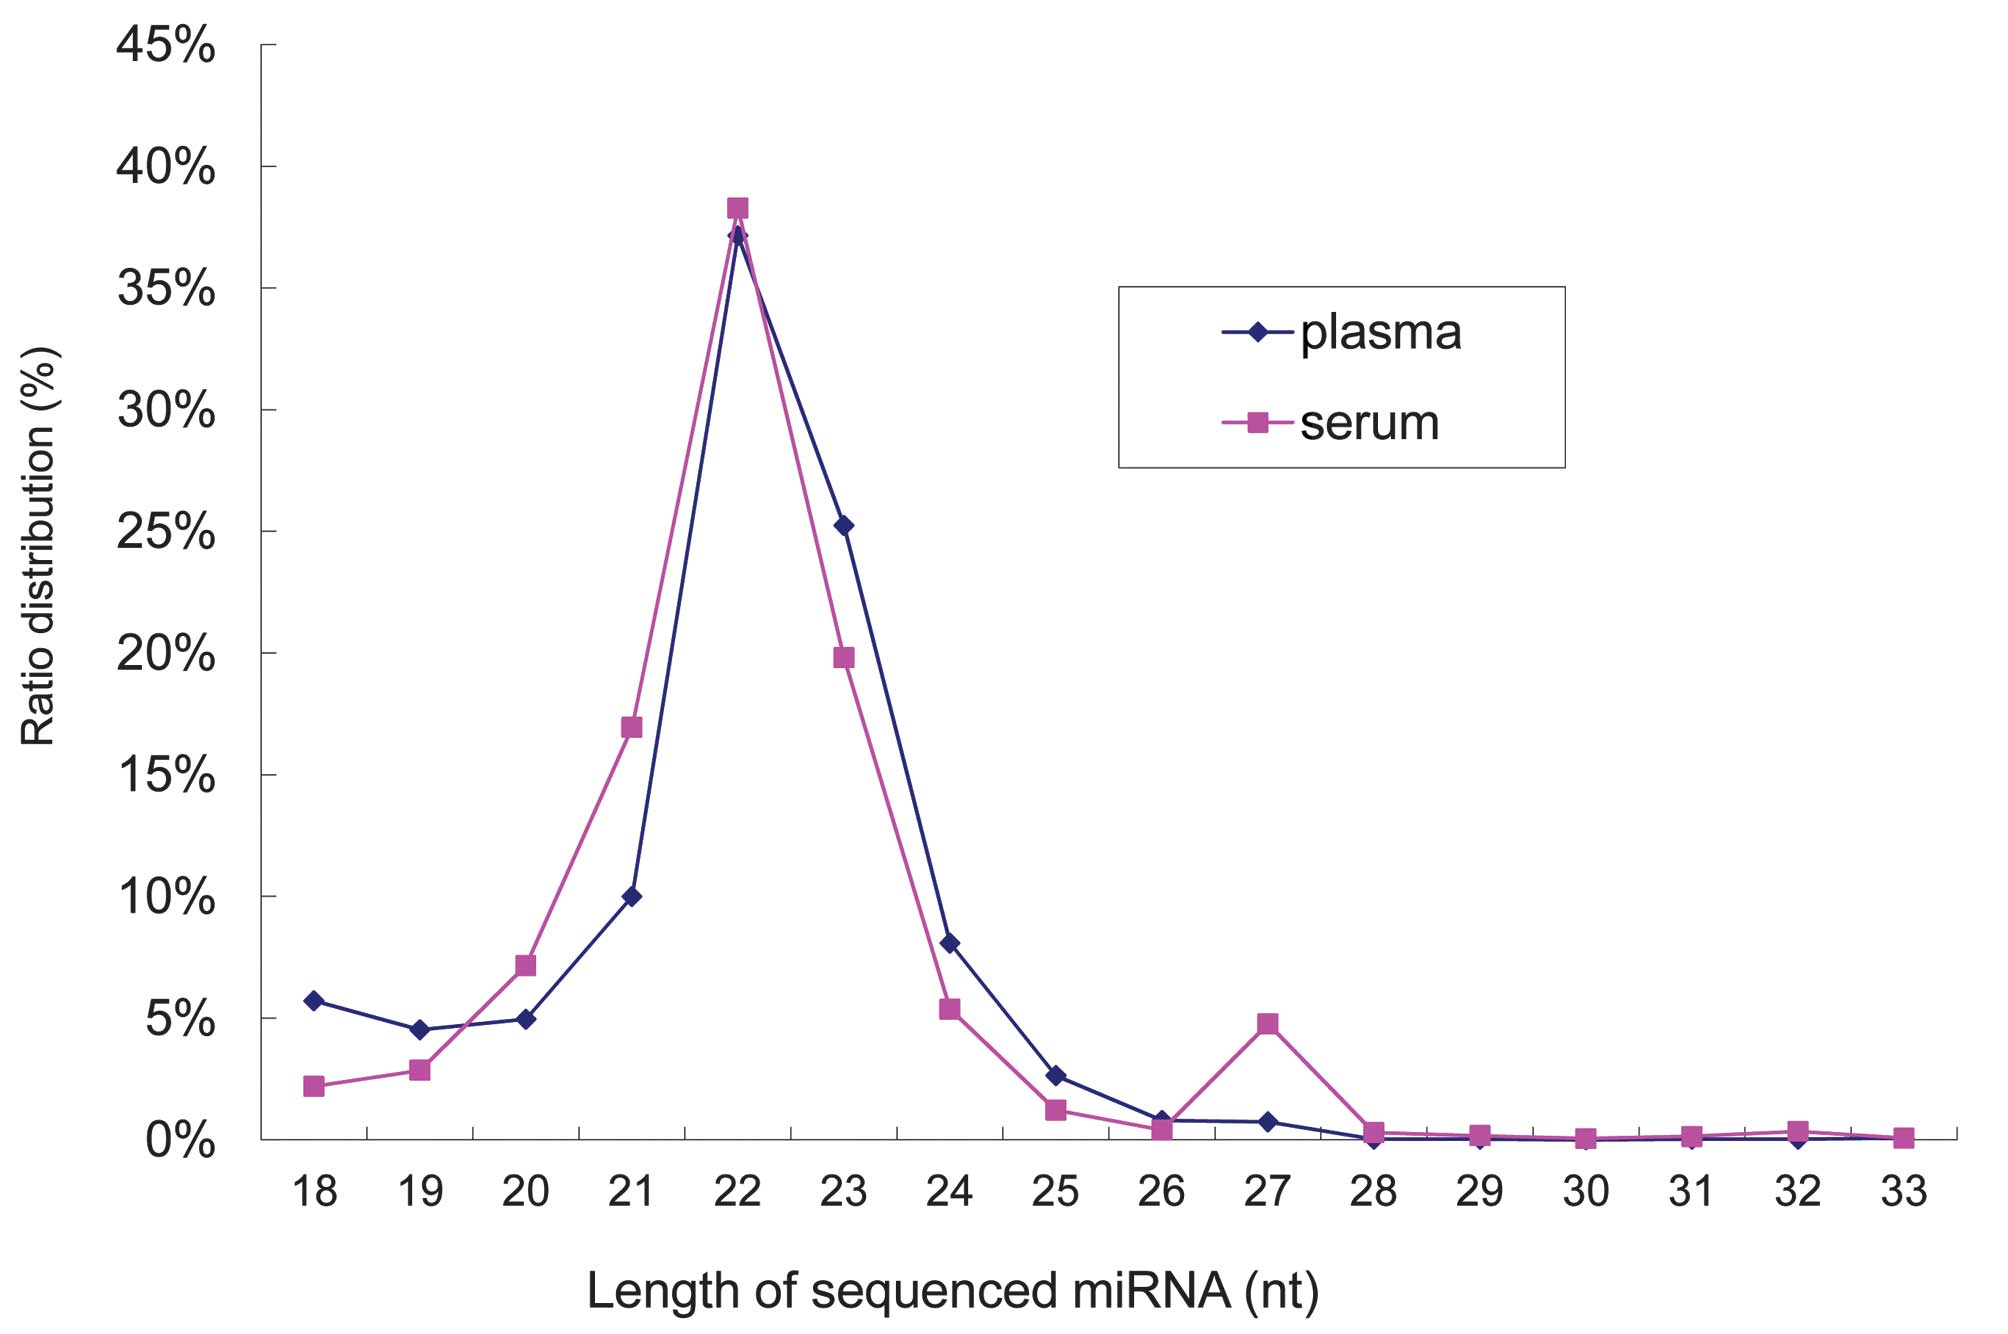
were obtained from the plasma and serum, respectively. On examining
the length distribution of the small RNAs, it was revealed that the
majority of the small RNAs from the two libraries were 22
nucleotides in length (Fig. 1),
which was consistent with the typical size of miRNA from Dicer
digestion products. These results indicated that the miRNAs had
been successively enriched from the two libraries.
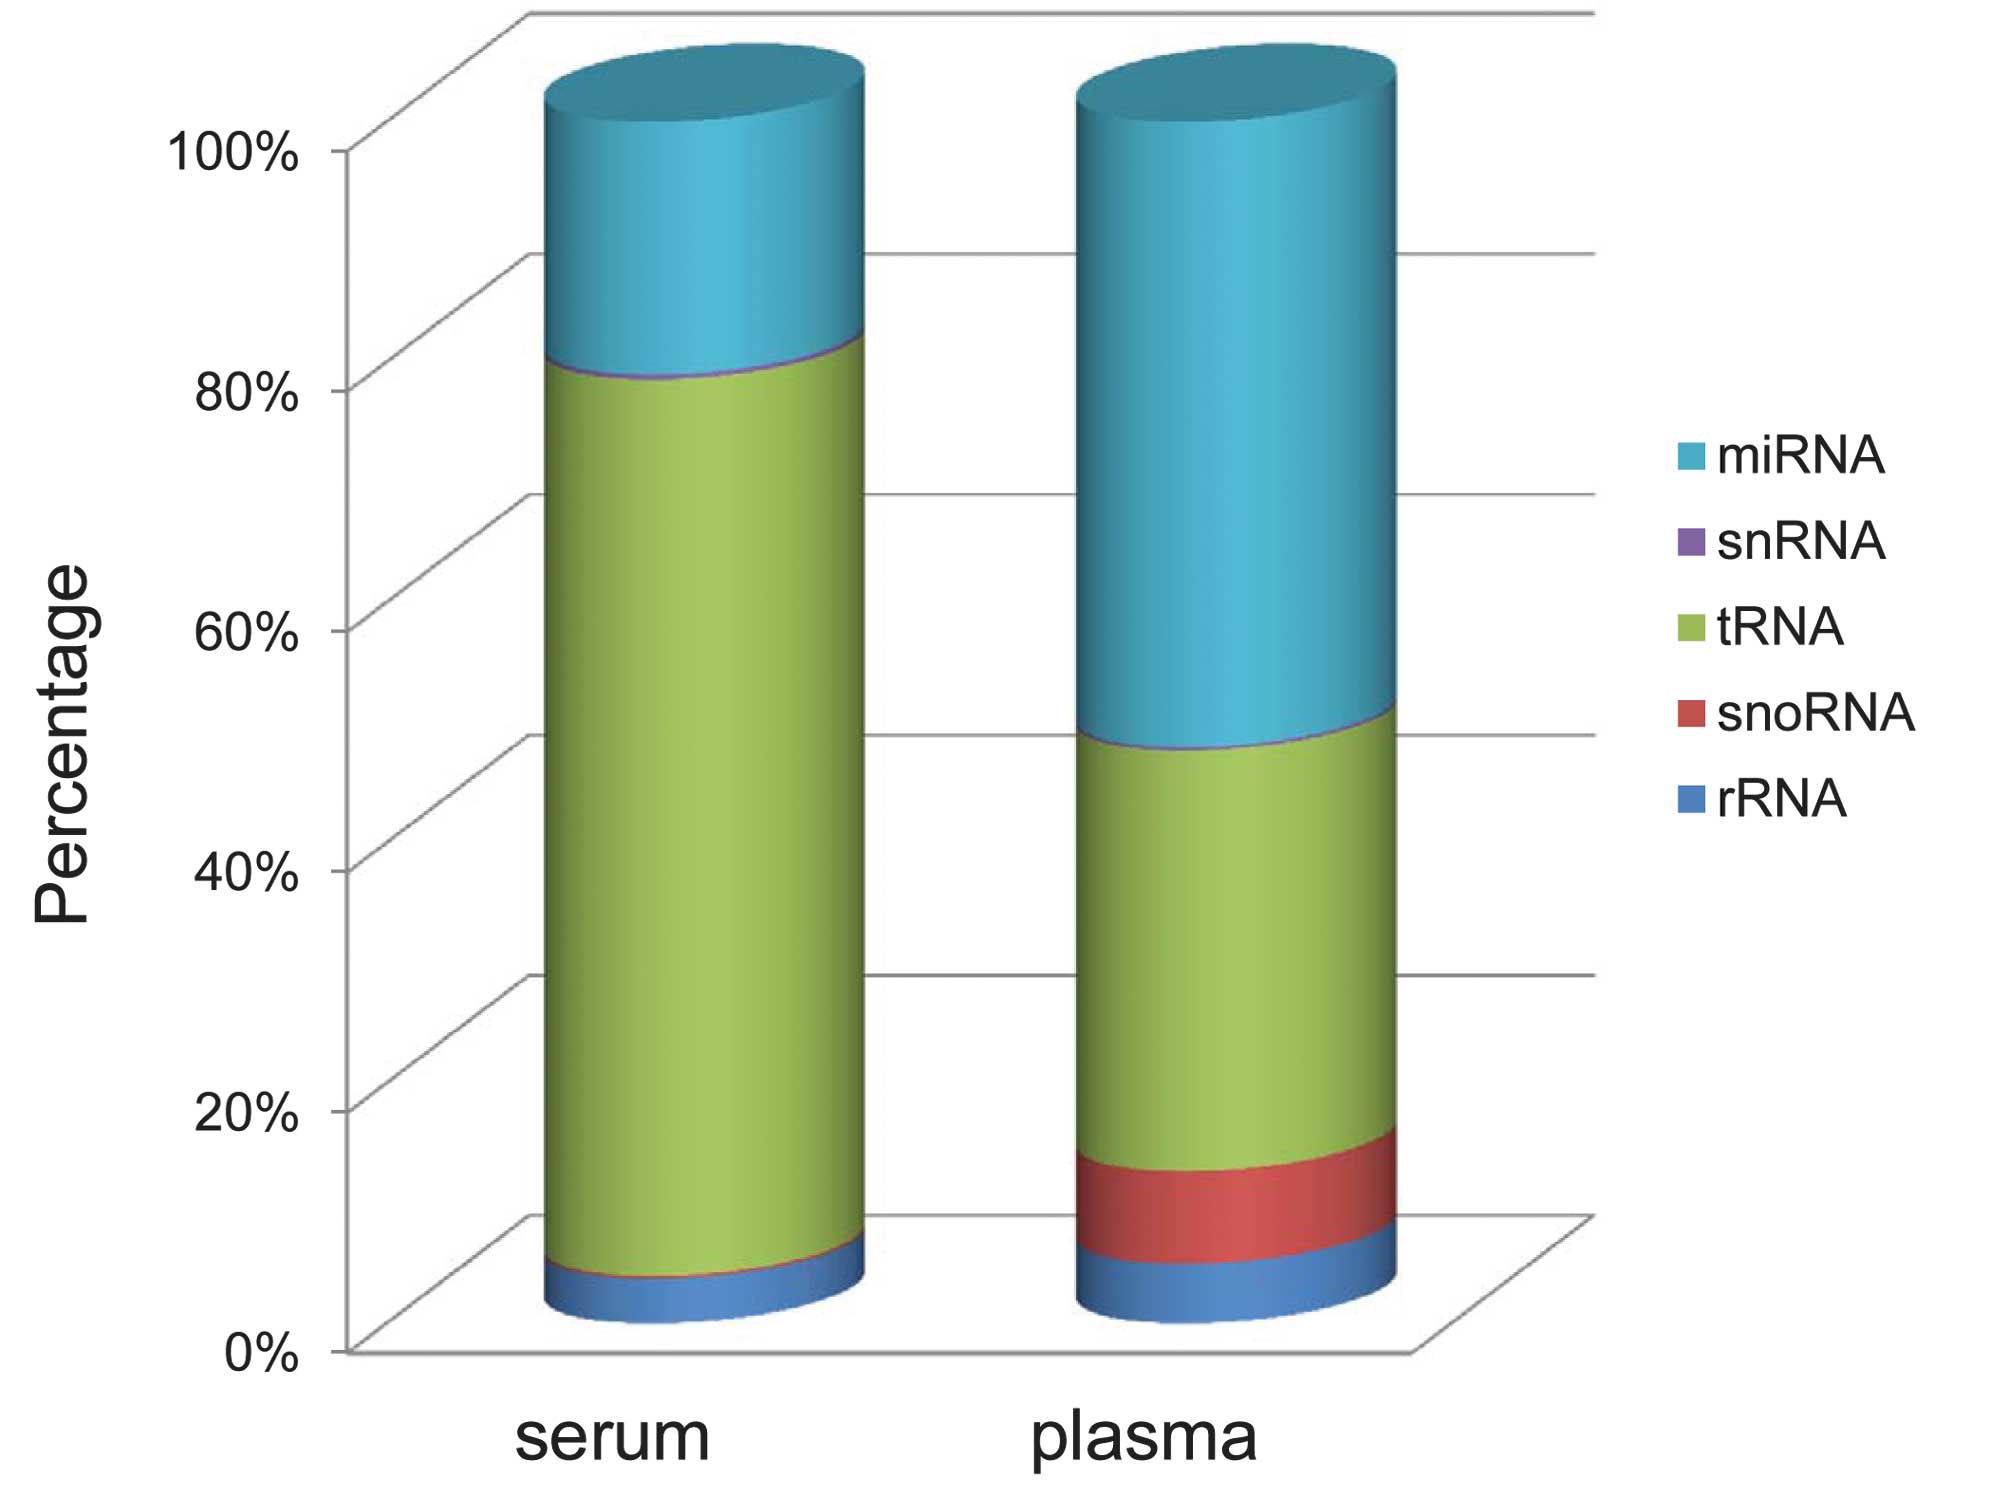
Based on human genome annotations and a number of
well-characterized RNA databases, these small RNA sequences were
annotated as known miRNA, tRNA, rRNA or snRNA/snoRNA. The most
abundant RNA category from the plasma was a the known miRNA, which
was 52.04%, as expected. However, the percentage of known miRNAs in
the serum was only 21.02%, and the most abundant RNA category was
tRNA, at 74.61% (Fig. 2). The
other less abundant category, in the plasma library was tRNA.
Differential expression of maternal serum
and plasma miRNA
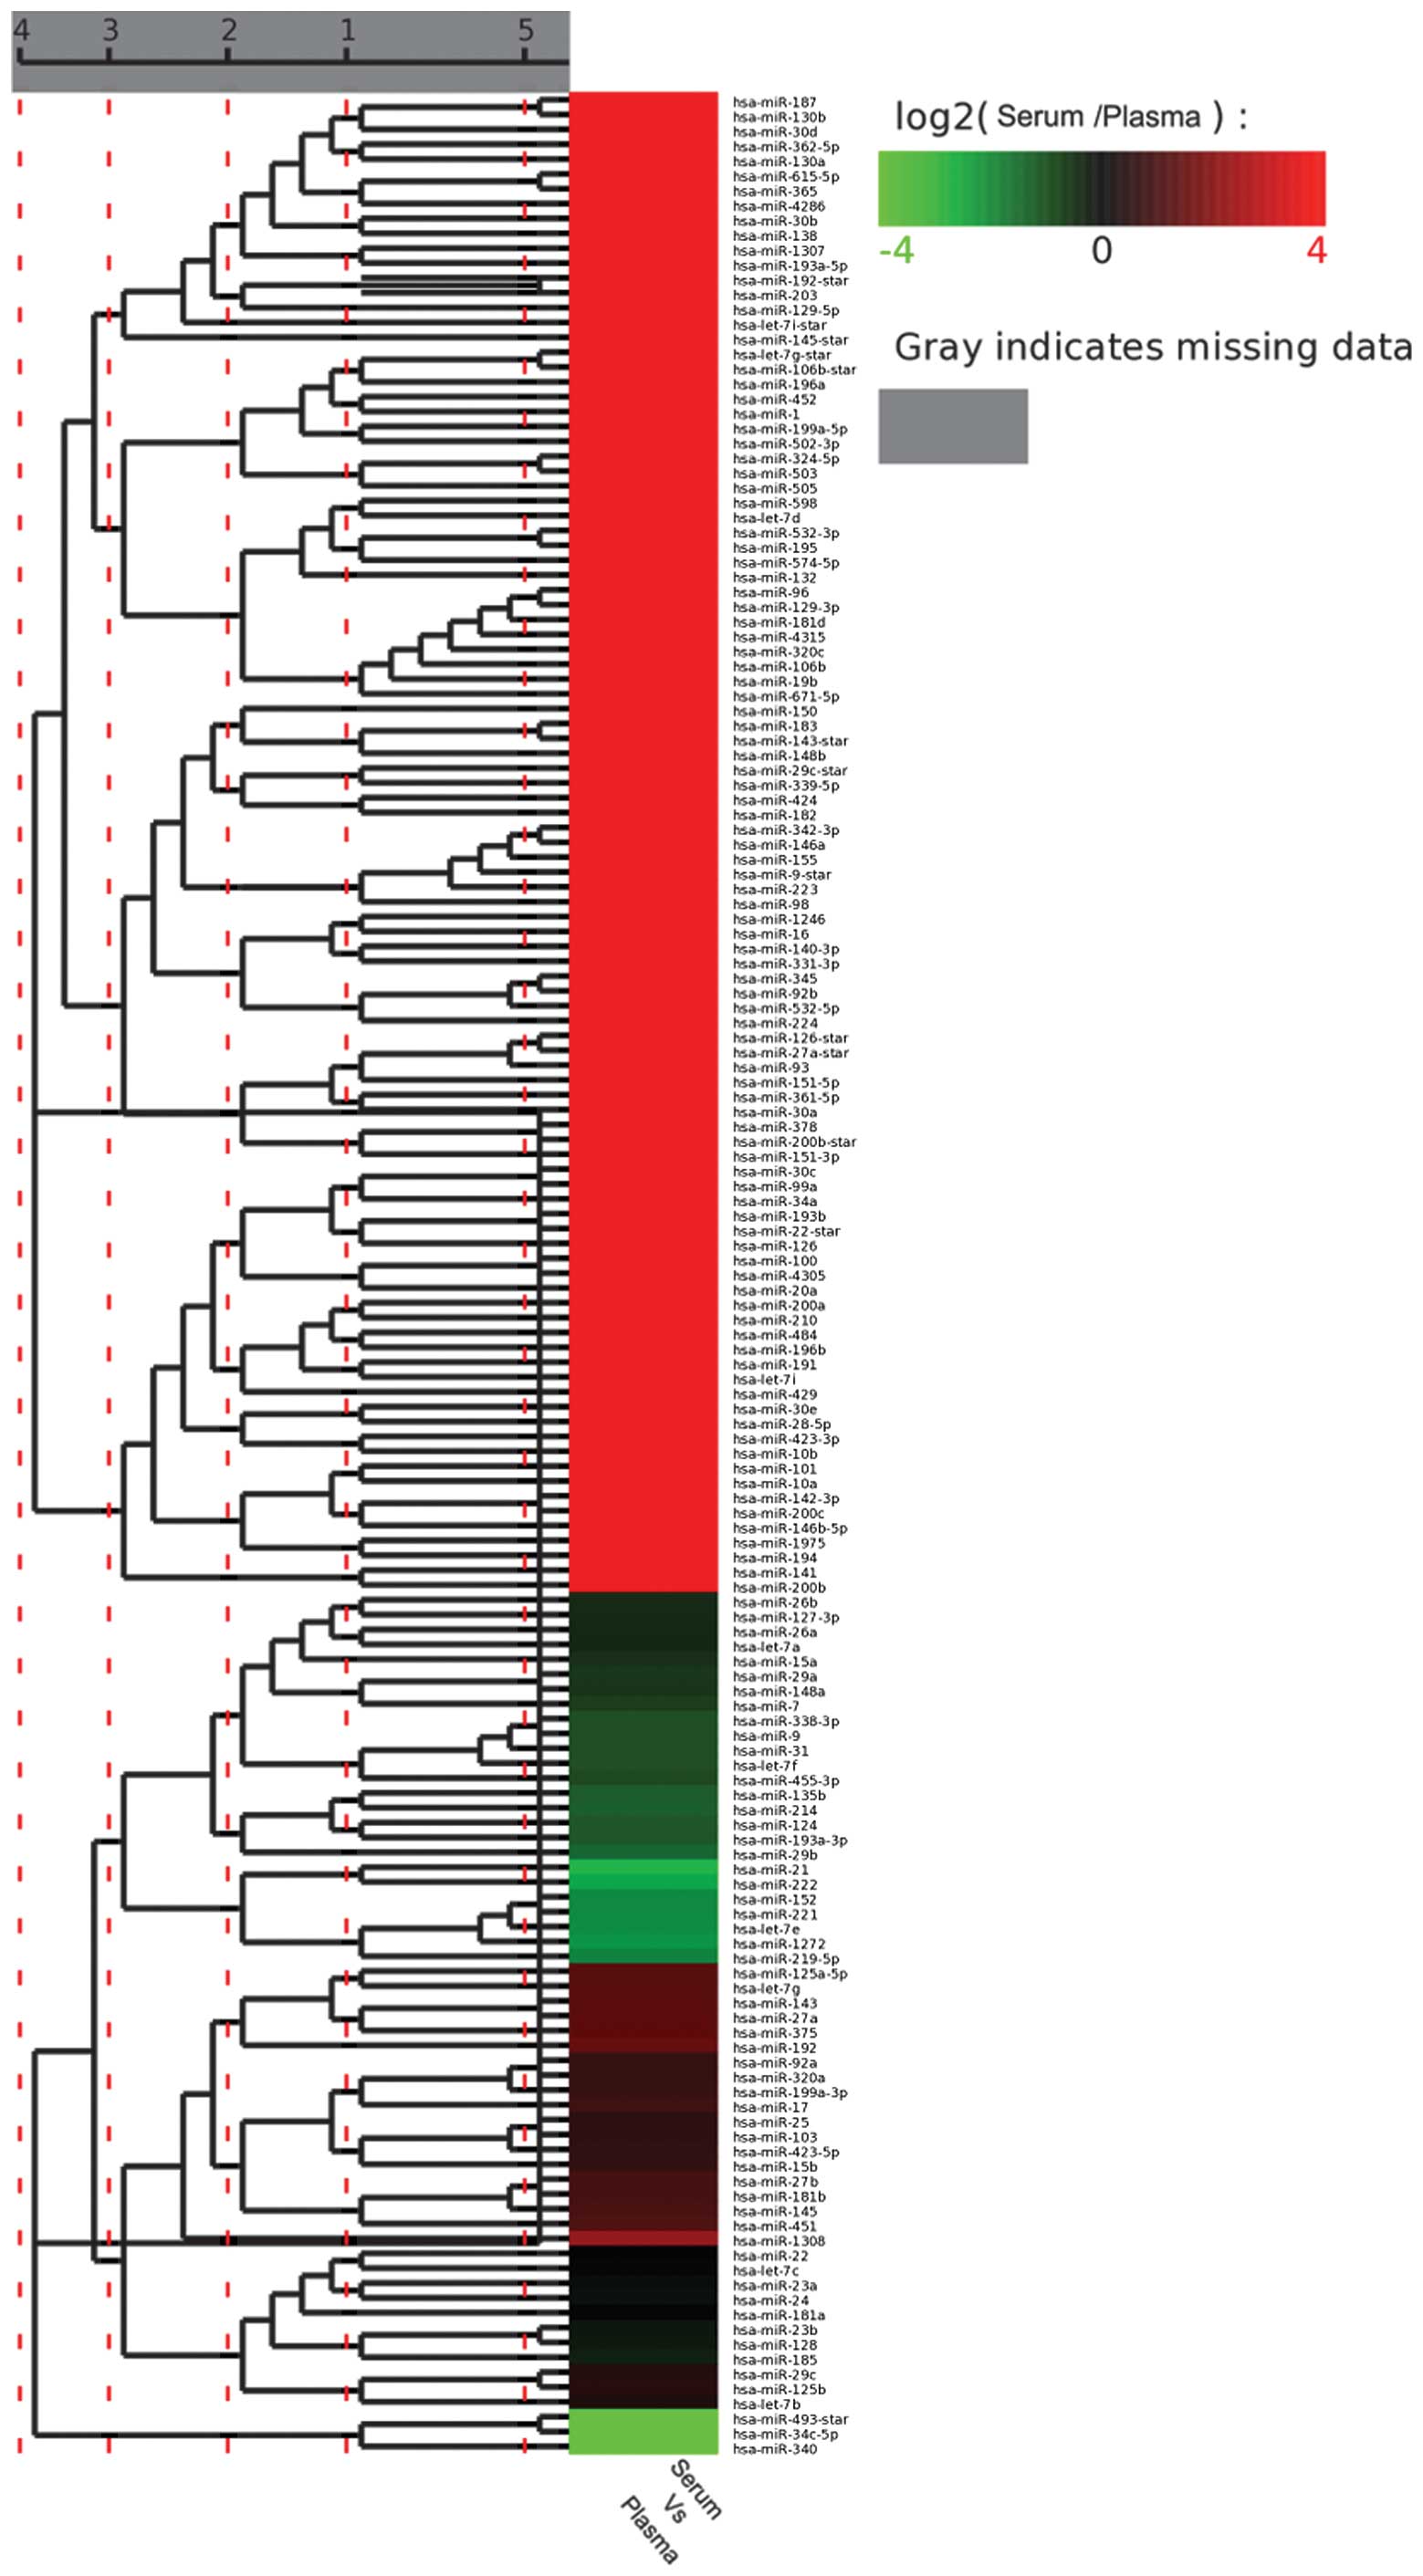
Compared with the plasma samples, upregulation and
down-regulation in the expression levels of miRNAs were observed in
the serum samples of the pregnant females. Significant changes in
the expression levels of the sequenced miRNA are shown in Fig. 3, determined using hierarchical
clustering analysis. The color represents the differential
expression of miRNAs between the serum and plasma samples, with red
indicating upregulated expression and green indicating
down-regulated expression of specific miRNAs.
A total of 329 miRNAs (276 miRNAs and 53
miRNAs*) and 193 miRNAs (171 miRNAs and 22
miRNAs*) were detected in the maternal serum and plasma,
respectively. miRNA* is a product produced from
pre-miRNA. miRNA and miRNA* are complementary in the
stem-loop of pre-miRNA. The present study demonstrated that the
differential miRNAs exhibited significantly differential expression
levels, as measured by the frequency of read counts, indicating a
marked functional divergence of these miRNAs. In the serum, ~9.12%
of the miRNAs and miRNAs* exhibited high read counts
(>500), among which the hsa-let-7 family, comprising hsa-let-7c,
hsa-let-7f, hsa-let-7a, hsa-let-7d, hsa-let-7b and hsa-let-7e, was
one of the most abundant miRNAs in the data set.
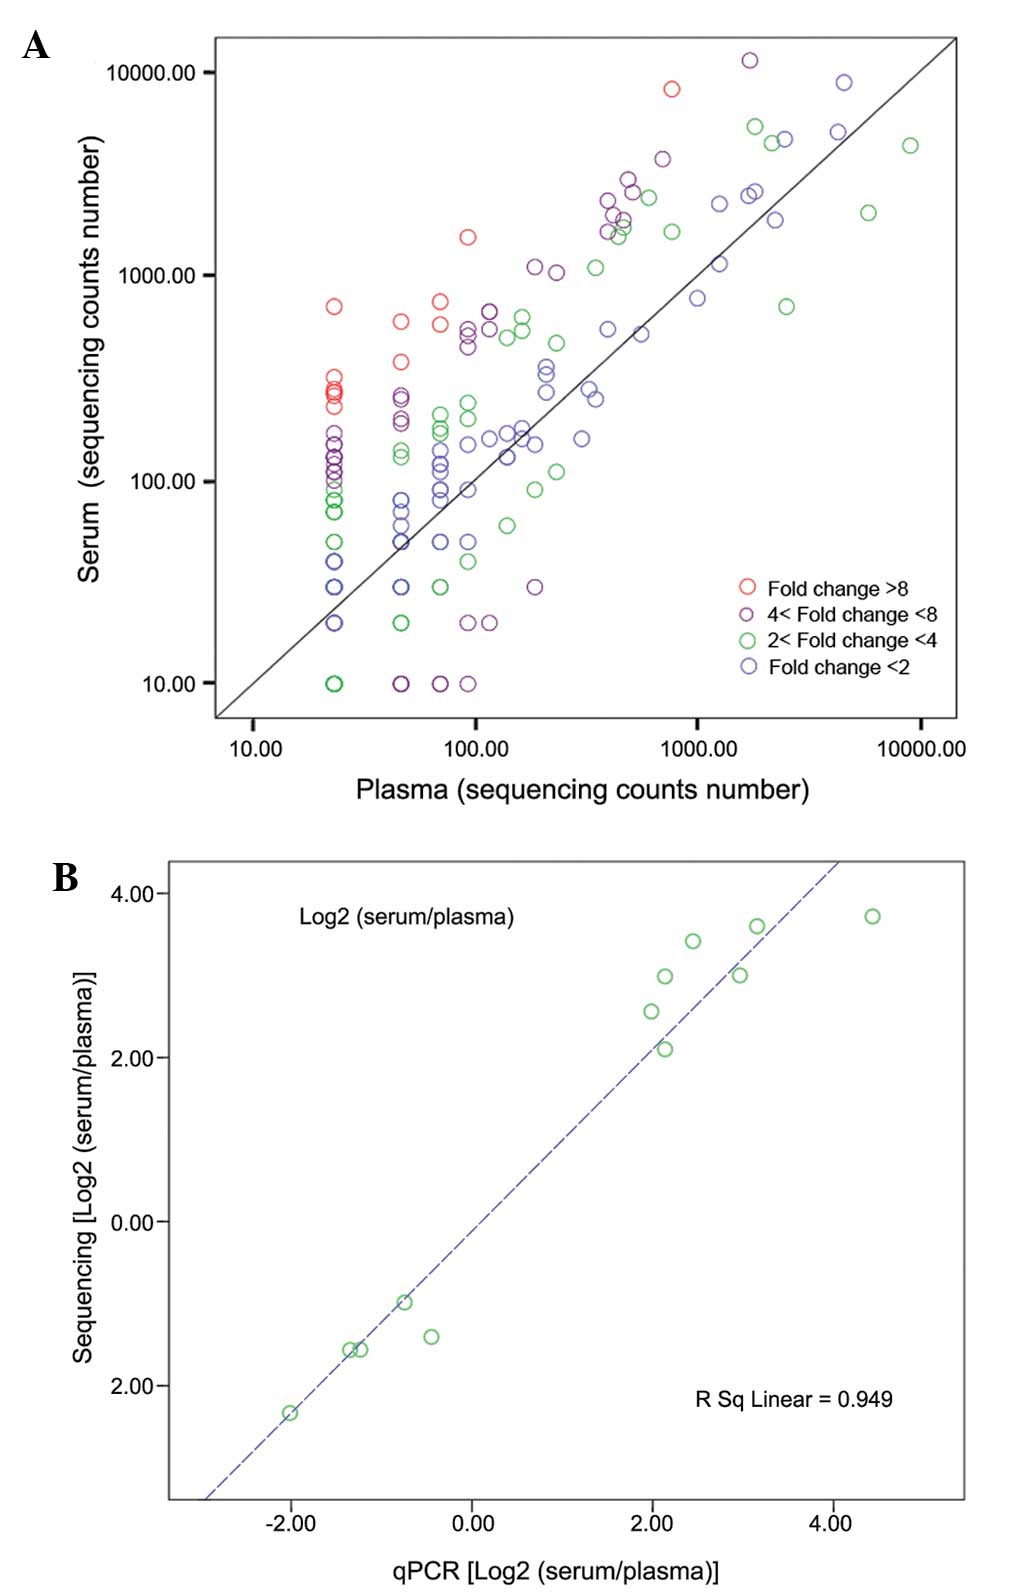
The relative count of sequencing reads was used to
quantify the miRNA expression levels between the serum and plasma.
Based on the normalized number of reads per sample (specific miRNA
/ total sequencing tags in the library), the miRNAs sequenced from
the two libraries were counted. A total of 36 and 113 abundant
miRNAs (original counts >20) were detected from the maternal
plasma and serum, respectively. The miRNAs sequenced from the
maternal plasma were all identified in the maternal serum, however,
77 miRNAs were only sequenced from the maternal serum. Among the 36
miRNAs, which were detected in the plasma and serum, 25 were
identified to be differentially expressed, exhibiting fold changes
>2.0 and P<0.001. (Table I;
Fig. 4A), 19 were upregulated and
six were downregulated. Among these, hsa-miR-1308 was identified as
a fragment of tRNA and was excluded. The 20 miRNAs exhibiting the
highest levels of expression in the two libraries are shown in
Table I. The majority of the
abundant miRNAs in the maternal plasma were also observed in the
maternal serum.
 | Table ImiRNAs with the highest levels of
expression (top 20) and miRNAs up/downregulated in the serum,
compared with the plasma of pregnant females. |
Table I
miRNAs with the highest levels of
expression (top 20) and miRNAs up/downregulated in the serum,
compared with the plasma of pregnant females.
| Upregulated in serum
compared with plasma | Downregulated in
serum compared with plasma | Most highly expressed
miRNAs in plasma | Most highly expressed
miRNAs in serum |
|---|
| hsa-miR-1308 | hsa-miR-21 | hsa-miR-221 | hsa-miR-192 |
| hsa-miR-192 | hsa-miR-222 | hsa-miR-222 | hsa-miR-23a |
| hsa-miR-375 | hsa-let-7e | hsa-miR-23a | hsa-miR-1308 |
| hsa-miR-143 | hsa-miR-221 | hsa-miR-29a | hsa-let-7b |
| hsa-miR-451 | hsa-miR-219-5p | hsa-miR-21 | hsa-miR-29a |
| hsa-miR-145 | hsa-miR-29b | hsa-miR-24 | hsa-miR-24 |
| hsa-miR-27b | | hsa-miR-124 | hsa-miR-22 |
| hsa-miR-17 | | hsa-miR-22 | hsa-miR-221 |
| hsa-miR-199a-3p | | hsa-let-7b | hsa-miR-451 |
| hsa-miR-320a | | hsa-miR-26a | hsa-miR-375 |
| hsa-miR-92a | | hsa-miR-192 | hsa-miR-26a |
| hsa-miR-423-5p | | hsa-let-7a | hsa-miR-145 |
| hsa-miR-25 | | hsa-let-7f | hsa-let-7a |
| hsa-miR-29c | | hsa-miR-23b | hsa-miR-92a |
| hsa-let-7b | | hsa-miR-214 | hsa-miR-143 |
| hsa-miR-181a | | hsa-miR-1308 | hsa-miR-23b |
| hsa-miR-22 | | hsa-miR-181a | hsa-miR-222 |
| hsa-let-7c | | hsa-miR-451 | hsa-miR-27b |
| hsa-miR-23a | | hsa-miR-92a | hsa-miR-124 |
| | hsa-miR-31 | hsa-miR-320a |
RT-qPCR verification
To further validate the differentially expressed
miRNAs identified, 12 individual miRNAs were selected for RT-qPCR
from independent biological replicates. These 12 selected miRNAs
included highly expressed miRNAs, which were upregulated miRNAs
(hsa-miR-192, hsa-miR-375, hsa-miR-451, hsa-miR-320a, hsa-miR-92a,
hsa-let-7b and hsa-miR-181a) and downregulated (hsa-miR-21 and
hsa-miR-221) and miRNAs with low levels of expression (hsa-let-7e,
hsa-miR-29b and hsa-miR-219-5p) which were all downregulated in the
serum, compared with plasma. As shown in Fig. 4B, a significant correlation
(Pearson's correlation = 0.974) was revealed between the SOLiD deep
sequencing data and the RT-qPCR measurements, indicating the
robustness of deep sequencing based expression analysis.
Predicted targets of differentially
expressed miRNAs
The most abundant maternal plasma miRNAs were
selected to analyze the differential expression of miRNA between
the serum and plasma samples. Those miRNAs with sequencing counts
≥20 and an absolute fold change >2 or <0.5 in the serum
compared with the plasma, were regarded as differentially expressed
miRNAs.
To examine the biological function of the
differentially expressed miRNAs identified, computational analysis
was performed using TargetScan for the identification of predicted
messenger RNA targets for each miRNA. Table II lists the predicted targets, in
which a total of 3,198 genes were potential targets of these
miRNAs. To examine the target gene functions, these predicated
miRNA targets were annotated with GO and KEGG schemes using DAVID.
The predicted miRNA targets populated several major GO categories
and, for certain miRNAs, the number of gene targets was
significantly increased (P<0.001 using Benjamini's correction).
The molecular function, biological process and cellular component
GO classifications, were evaluated, however, only significant terms
of biological process are listed in Table II. The majority of the significant
GO terms were associated with the regulation of transcription.
There were also a number of significantly increased GO categories,
including cell division, cell cycle and mitosis.
| Table IIGO term predicted targets of
differentially expressed microRNAs. |
Table II
GO term predicted targets of
differentially expressed microRNAs.
| GO ID | GO Term | GO type | Hypergeometric
P-value | Corrected P-value
(BF) | Hit gene number for
term |
|---|
| GO:0006355 | Regulation of
transcription, DNA-dependent | Process | 5.664037e-10 | 1.137339e-06 | 159 |
| GO:0051301 | Cell division | Process | 3.218192e-09 | 6.462130e-06 | 44 |
| GO:0006366 | Transcription from
RNA polymerase II promoter | Process | 8.628167e-08 | 1.732536e-04 | 43 |
| GO:0006417 | Regulation of
translation | Process | 1.726526e-07 | 3.466864e-04 | 17 |
| GO:0016568 | Chromatin
modification | Process | 1.988089e-07 | 3.992083e-04 | 36 |
| GO:0007049 | Cell cycle | Process | 4.647136e-07 | 9.331448e-04 | 53 |
| GO:0000278 | Mitotic cell
cycle | Process | 7.049451e-07 | 1.415530e-03 | 43 |
| GO:0006468 | Protein
phosphorylation | Process | 1.558293e-06 | 3.129053e-03 | 48 |
| GO:0006351 | Transcription,
DNA-dependent | Process | 1.568039e-06 | 3.148622e-03 | 64 |
| GO:0045893 | Positive regulation
of transcription, DNA-dependent | Process | 2.264364e-06 | 4.546843e-03 | 50 |
| GO:0044419 | Interspecies
interaction between organisms | Process | 2.696993e-06 | 5.415562e-03 | 42 |
| GO:0007067 | Mitosis | Process | 3.184293e-06 | 6.394060e-03 | 29 |
Among the predicted targets, transmembrane (TM)
protein was involved in seven significantly upregulated miRNAs. TM,
is a receptor of thrombin and can change its conformation,
preventing blood from clotting.
To analyze the role of miRNAs in the regulatory
networks, putative miRNA targets were assigned to KEGG pathways,
which revealed 11 significantly increased pathways (P<0.001,
using Benjamini's correction). The majority of these miRNAs were
target genes involved in cell meiosis, cell cycle, leukemia, cancer
and infection (Table III).
| Table IIIKEGG term of the predicted targets of
the differentially expressed microRNAs. |
Table III
KEGG term of the predicted targets of
the differentially expressed microRNAs.
| KEGG term | Hypergeometric
P-value | Corrected P-value
(BF) | Hit gene number for
term |
|---|
| Pathways in
cancer | 4.165742e-08 | 7.789938e-06 | 47 |
| Chronic myeloid
leukemia | 5.045730e-08 | 9.435516e-06 | 19 |
| Prostate
cancer | 1.864796e-07 | 3.487168e-05 | 20 |
| Cell cycle | 4.543671e-07 | 8.496665e-05 | 24 |
| Oocyte meiosis | 6.022683e-07 | 1.126242e-04 | 22 |
| Pancreatic
cancer | 9.149623e-07 | 1.710979e-04 | 17 |
| Small cell lung
cancer | 2.688319e-06 | 5.027156e-04 | 18 |
| Renal cell
carcinoma | 5.485690e-06 | 1.025824e-03 | 16 |
| Non-small cell lung
cancer | 1.833852e-05 | 3.429304e-03 | 13 |
| Glioma | 2.430872e-05 | 4.545730e-03 | 14 |
| HTLV-I
infection | 2.436786e-05 | 4.556789e-03 | 34 |
The present study identified, using next generation
sequencing technology and RT-qPCR, a small set of miRNAs, which
were differentially expressed between the serum and plasma of
pregnant females. The differential miRNA suggested that different
results may be obtained when using either serum or plasma in
associated nucleic acid investigations and clinical applications. A
previous study confirmed the differences between plasma and serum.
Rudstein-Svetlicky et al revealed the existence of
differentially expressed proteins, and suggested that plasma may be
more suitable for diagnosis and investigations (24). Omenn et al demonstrated
that, compared with serum, plasma maintains increased fidelity
without in vitro coagulation (25). However, serum and plasma were
generally selected arbitrarily in the majority of the previous
studies, and no obvious differences were observed in these
associated experiments (26,27).
These findings suggested the importance of care in the selection of
serum or plasma for future investigation and clinical use.
In the present study, peripheral blood samples from
pregnant females were collected and sequenced. Pregnancy is a
highly regulated complex physiological process, and the maternal
body undergoes substantial changes to maintain a normal pregnancy
(28). A previous study
demonstrated that circulating miRNAs can be detected in samples
from the serum and plasma. The stability of miRNAs is high, making
the circulating miRNAs potentially useful candidates for diagnostic
and other clinical applications (29). For these reasons, it is important
to determine the differences in the expression levels of miRNAs
between serum and plasma, and investigation of whether the miRNA
expression pattern differs between the serum and plasma of patients
and healthy individuals is required in the future.
The advent of high-throughput sequencing technology
has reduced sequencing costs by orders of magnitude and has
significantly increased the throughput. Whole-genome sequencing has
become a technique for obtaining global genomic information about
patients (30). In the present
study, high-throughput sequencing was used to examine the entire
expression pattern and differences in the expression of miRNA in
maternal serum and plasma, however, to understand the difference
in-depth, the functions of these differentially expressed miRNAs
requires further analysis and confirmation.
The miRNA functions were analyzed using
bioinformatic technologies. The experimentally validated target
sites were collected from the miRTar-Base database (31) and those genes targeted by >2
miRNAs were regarded as target genes of maternal plasma miRNAs. The
functions and functional associations of these target genes were
analyzed using the KEGG database (32), and the results demonstrated that
the increased pathways of the differentially expressed miRNA
targets included the cell meiosis, cancer and cell cycle pathways.
These pathways were closely associated with the progression of
pregnancy, and a number were associated with blood coagulation.
These results suggested that a number of the differentially
expressed miRNAs in the serum, compared with the plasma, were
involved in the process of blood coagulation and associated
changes. The details of the underlying regulatory mechanism remain
to be elucidated.
In conclusion, the present study sequenced and
analyzed circulating miRNAs in the plasma and serum of pregnant
females. Differentially expressed miRNAs were identified between
these two libraries and a number of these miRNAs were involved in
the process of blood coagulation. These results demonstrated that
plasma may more suitable for further investigations into miRNA
during pregnancy.
Acknowledgments
This study was supported by grants from the National
Natural Science Foundation of China (.nos. 61271055 and
61271054).
References
|
1
|
Solheim BG, Bergerud UE, Kjeldsen-Kragh J,
et al: Improved blood preservation with 0.5CPD Erythro-Sol.
Coagulation factor VIII activity and erythrocyte quality after
delayed separation of blood. Vox Sang. 74:168–175. 1998. View Article : Google Scholar : PubMed/NCBI
|
|
2
|
Chen HM and Chen CH: Compare stress and
social support between adolescent and adult pregnant women during
third trimester. Kaohsiung. J Med Sci. 12:183–192. 1996.
|
|
3
|
Chen XQ, Stroun M, Magnenat JL, et al:
Microsatellite alterations in plasma DNA of small cell lung cancer
patients. Nat Med. 2:1033–1035. 1996. View Article : Google Scholar : PubMed/NCBI
|
|
4
|
Nawroz H, Koch W, Anker P, Stroun M and
Sidransky D: Microsatellite alterations in serum DNA of head and
neck cancer patients. Nat Med. 2:1035–1037. 1996. View Article : Google Scholar : PubMed/NCBI
|
|
5
|
Lo YM, Corbetta N, Chamberlain PF, et al:
Presence of fetal DNA in maternal plasma and serum. Lancet.
350:485–487. 1997. View Article : Google Scholar : PubMed/NCBI
|
|
6
|
Bianchi DW: Fetal DNA in maternal plasma:
the plot thickens and the placental barrier thins. Am J Hum Genet.
62:763–764. 1998. View
Article : Google Scholar : PubMed/NCBI
|
|
7
|
Pertl B and Bianchi DW: Fetal DNA in
maternal plasma: emerging clinical applications. Obstet Gynecol.
98:483–490. 2001. View Article : Google Scholar : PubMed/NCBI
|
|
8
|
Chen X, Ba Y, Ma L, et al:
Characterization of microRNAs in serum: a novel class of biomarkers
for diagnosis of cancer and other diseases. Cell Res. 18:997–1006.
2008. View Article : Google Scholar : PubMed/NCBI
|
|
9
|
Lo YM, Tein MS, Lau TK, et al:
Quantitative analysis of fetal DNA in maternal plasma and serum:
implications for noninvasive prenatal diagnosis. Am J Hum Genet.
62:768–775. 1998. View
Article : Google Scholar : PubMed/NCBI
|
|
10
|
Sekizawa A, Kondo T, Iwasaki M, et al:
Accuracy of fetal gender determination by analysis of DNA in
maternal plasma. Clin Chem. 47:1856–1858. 2001.PubMed/NCBI
|
|
11
|
Bartel DP: MicroRNAs: genomics,
biogenesis, mechanism and function. Cell. 116:281–297. 2004.
View Article : Google Scholar : PubMed/NCBI
|
|
12
|
Mattick JS and Makunin IV: Non-coding RNA.
Hum Mol Genet. 15:R17–R29. 2006. View Article : Google Scholar : PubMed/NCBI
|
|
13
|
Ambros V: MicroRNA pathways in flies and
worms: Growth, death, fat, stress, and timing. Cell. 113:673–676.
2003. View Article : Google Scholar : PubMed/NCBI
|
|
14
|
Lu J, Getz G, Miska EA, et al: MicroRNA
expression profiles classify human cancers. Nature. 435:834–838.
2005. View Article : Google Scholar : PubMed/NCBI
|
|
15
|
Rathjen T, Pais H, Sweetman D, Moulton V,
Munsterberg A and Dalmay T: High throughput sequencing of microRNAs
in chicken somites. FEBS Lett. 583:1422–1426. 2009. View Article : Google Scholar : PubMed/NCBI
|
|
16
|
Morales-Prieto DM, Ospina-Prieto S,
Chaiwangyen W, Schoenleben M and Markert UR: Pregnancy-associated
miRNA-clusters. J Reprod Immunol. 97:51–61. 2013. View Article : Google Scholar : PubMed/NCBI
|
|
17
|
Ge Q, Li H, Yang Q, et al: Sequencing
circulating miRNA in maternal plasma with modified library
preparation. Clin Chim Acta. 412:1989–1994. 2011. View Article : Google Scholar : PubMed/NCBI
|
|
18
|
Li H, Guo L, Wu Q, Lu J, Ge Q and Lu Z: A
comprehensive survey of maternal plasma miRNAs expression profiles
using high-throughput sequencing. Clin Chim Acta. 413:568–576.
2012. View Article : Google Scholar
|
|
19
|
Yang Q, Lu J, Wang S, Li H, Ge Q and Lu Z:
Application of next-generation sequencing technology to profile the
circulating microRNAs in the serum of preeclampsia versus normal
pregnant women. Clin Chim Acta. 412:2167–2173. 2011. View Article : Google Scholar : PubMed/NCBI
|
|
20
|
Ge Q, Bai Y, Liu Z, Liu Q, Yan L and Lu Z:
Detection of fetal DNA in maternal plasma by microarray coupled
with emulsions PCR. Clin Chim Acta. 369:82–88. 2006. View Article : Google Scholar : PubMed/NCBI
|
|
21
|
Diehl F, Li M, He Y, Kinzler KW,
Vogelstein B and Dressman D: BEAMing: Single-molecule PCR on
microparticles in water-in-oil emulsions. Nat Methods. 3:551–559.
2006. View
Article : Google Scholar : PubMed/NCBI
|
|
22
|
Lewis BP, Burge CB and Bartel DP:
Conserved seed pairing, often flanked by adenosines, indicates that
thousands of human genes are microRNA targets. Cell. 120:15–20.
2005. View Article : Google Scholar : PubMed/NCBI
|
|
23
|
Livak KJ and Schmittgen TD: Analysis of
relative gene expression data using real-time quantitative PCR and
the 2(−Delta Delta C(T)) method. Methods. 25:402–408. 2001.
View Article : Google Scholar
|
|
24
|
Rudstein-Svetlicky N, Loewenthal R,
Horejsi V and Gazit E: HLA-G levels in serum and plasma. Tissue
Antigens. 69:S140–S142. 2007. View Article : Google Scholar
|
|
25
|
Omenn GS, States DJ, Adamski M, et al:
Overview of the HUPO Plasma Proteome Project: results from the
pilot phase with 35 collaborating laboratories and multiple
analytical groups, generating a core dataset of 3020 proteins and a
publicly-available database. Proteomics. 5:3226–3245. 2005.
View Article : Google Scholar : PubMed/NCBI
|
|
26
|
Lo YM, Leung TN, Tein MS, et al:
Quantitative abnormalities of fetal DNA in maternal serum in
preeclampsia. Clin Chem. 45:184–188. 1999.PubMed/NCBI
|
|
27
|
Gao L, Xie E, Yu T, et al: Methylated APC
and RASSF1A in multiple specimens contribute to the differential
diagnosis of patients with undetermined solitary pulmonary nodules.
J Thorac Dis. 7:422–432. 2015.PubMed/NCBI
|
|
28
|
Larciprete G, Valensise H, Vasapollo B,
Altomare F, Sorge R, Casalino B, De Lorenzo A and Arduini D: Body
composition during normal pregnancy: Reference ranges. Acta
Diabetol. 40(Suppl 1): S225–S232. 2003. View Article : Google Scholar : PubMed/NCBI
|
|
29
|
Reid G, Kirschner MB and van Zandwijk N:
Circulating microRNAs: Association with disease and potential use
as biomarkers. Crit Rev Oncol Hematol. 80:193–208. 2011. View Article : Google Scholar
|
|
30
|
Su Z, Ning B, Fang H, et al:
Next-generation sequencing and its applications in molecular
diagnostics. Expert Rev Mol Diagn. 11:333–343. 2011.PubMed/NCBI
|
|
31
|
Hsu SD, Lin FM, Wu WY, et al: miRTarBase:
a database curates experimentally validated microRNA-target
interactions. Nucleic Acids Res. 39(Database Issue): D163–D169.
2011. View Article : Google Scholar :
|
|
32
|
Enquobahrie DA, Abetew DF, Sorensen TK,
Willoughby D, Chidambaram K and Williams MA: Placental microRNA
expression in pregnancies complicated by preeclampsia. Am J Obstet
Gynecol. 204:e12–e21. 2011. View Article : Google Scholar
|