Introduction
Diabetic retinopathy (DR) is a major complication of
diabetes mellitus and one of the leading causes of blindness in
working-age adults (1). The
disease is characterized and diagnosed by visual fundus examination
to reveal vascular lesions and macular edema (2). Abundant data suggests that diabetes
affects the entire neurovascular unit of the retina, with early
loss of neurovascular coupling, gradual neurodegeneration, gliosis
and neuroinflammation occurring prior to observable vascular
pathologies (3,4). The treatment of DR can only be
achieved through an enhanced understanding of the pathogenesis of
the disease. However, DR is a multifactorial progressive disease of
the retina, and the pathogenesis of the disease is complex,
involving several different cells, molecules and factors. Despite
several investigations attempting to identify the molecular
mechanisms of pathogenesis in DR, they remain to be fully
elucidated.
Streptozotocin (STZ)-induced diabetes in rats is the
most commonly used experimental model for the investigation of DR.
This model mimics human diabetes through the destruction of b-cells
in the pancreas, which leads to hypoinsulinemia and hyperglycemia
(5).
Next-generation sequencing based on RNA sequence
(RNA-seq) technology is predominantly used for quantitative gene
expression analyses of biological processes in a particular tissue
or cell in a certain species. RNA-seq can be used to investigate
genome-wide differences in gene expression and information analysis
platforms. This process has several advantages, including more
accurate quantization, higher repeatability, wider testing range
and more reliable analyses. Thus, RNA-seq has the potential to
provide useful and detailed information on the mechanisms, unknown
pathways and networks of a disease, and may lead to the
identification of novel treatment strategies (6).
The purpose of the present study was to use RNA-seq
to investigate the molecular mechanisms of DR within the retinas of
STZ-induced diabetic rats. The results of this investigation may
reveal novel avenues of investigation into treatment strategies for
DR.
Materials and methods
STZ-induced diabetes in rats
Diabetes was chemically induced in 10-week-old male
Sprague-Dawley rats (n=30; weight, 230–280 g; Chengdu DaShuo
Biotech Co., Ltd. Chengdu, China) with STZ (Sigma-Aldrich, St.
Louis, MO, USA). The rats received a single intraperitoneal
injection of a freshly prepared solution of STZ in citrate buffer
(0.01 M; pH 4.5; Junrui Biological Technology Co., Ltd., Shanghai,
China) at a dose of 60 mg/kg bodyweight. A corresponding number of
weight and age-matched animals (n=30) were maintained as controls,
and these rats received a single intraperitoneal injection of
citrate buffer only, at a dose of 60 mg/kg bodyweight. The diabetic
status of the animals was confirmed by measuring the blood glucose
levels of the rats using a glucometer (ACCU-CHEK®
Performa; Roche Diagnostics GmbH, Mannheim, Germany), with fasting
blood glucose levels >16.7 mmol/l considered to indicate
diabetic conditions. Insulin was not administered to the animals.
The rats were housed in a controlled environment at 20–25°C with a
12 h light/dark cycle, and were provided with ad libitum
access to food and water. All the animals were maintained and
handled in accordance with the guidelines of the Association for
Research in Vision and Ophthalmology statement for the Use of
Animals in Ophthalmic and Vision Research (7). The present study was approved by the
Animal Protection and Ethics Committee of Sichuan University
(Chengdu, China).
Measurement of retinal function using
flash-electroretinography (F-ERG)
Following dark adaptation for 60 min in a box, six
rats from either the experimental group (n=30) or control group
(n=30) received intraperitoneal injections of chloral hydrate
solution (Junrui Biological Technology Co., Ltd.) at a
concentration of 0.3 ml/100 g bodyweight, and had their pupils
fully dilated with compound tropicamide eye-drops prior to
assessment. Lidocaine hydrochloride (2%; Shanghai Fosun Zhaohui
Pharmaceutical Co., Ltd., Shanghai, China) was applied to the
animals for retinal surface anesthesia. The cornea-touch electrode,
reference electrode and grounding electrode were placed at the
corneal margin of the eye, forehead and end of the tail under the
skin, respectively.
The stimulator used was a Ganzfeld full-field
(SG-2002; LKC Technologies, Inc. Gaithersburg, MD, USA) dome
stimulator, as recommended by the standard F-ERG guidelines
provided by the International Society for Clinical
Electrophysiology of Vision (ISCEV) in 2004 (8). The stimulus intensity of the standard
flash was 2.448 cdxs/m2. F-ERG retinal function was
assessed using a visual electrophysiological system (MEB9200; Nihon
Kohden, Tokyo, Japan). The amplitude and implicit duration of each
wave form were analyzed.
Sample collection, RNA extraction and
quality analysis
After 16 weeks, the rats were anesthetized with 10%
chloral hydrate at a dose of 0.3 ml/100 g bodyweight by
intraperitoneal injection. The rats were then sacrificed by
overdose with 10% chloral hydrate following the removal of the
eyes. Each retina was immediately dissected from the eye under a
dissecting microscope (model SX-4; Guangzhou Ming-Mei Technology
Co., Ltd., Guangzhou, China). These samples were then frozen in
liquid nitrogen (Sichuan Qiaoyuan Gas Co., Ltd., Sichuan, China)
and stored at −80°C. Microsurgical scissors were used to section
the eye along the corneoscleral limbus. The retinas were then
immediately dissected from the eye using the SX-4 dissecting
microscope. The retinas of the rats were placed into a
nuclease-free frozen storage tube prior to being frozen in liquid
nitrogen overnight and stored at −80°C. The rat retinas were then
placed into a nuclease-free microcentrifuge tube with plastic
grinding rods. Retinal RNA was extracted using 1 ml TRIzol reagent
(Invitrogen; Thermo Fisher Scientific, Waltham, MA, USA) and
quantified at an absorbance of 260 nm using an ultraviolet-visible
(UV-Vis) spectrophotometer (NanoDrop 8000; Thermo Fisher
Scientific, Inc.). Its integrity was determined using an Agilent
2100 Bioanalyzer (G2939AA; Agilent Technologies, Santa Clara, CA,
USA).
Library preparation
The total RNA samples were first treated with DNase
I (New England Biolabs, Inc., Ipswich, MA, USA) to degrade any
possible DNA contamination, and the digestion products were then
purified with magnetic beads (Dynabeads® mRNA
Purification kit; Invitrogen; Thermo Fisher Scientific, Inc.).
Subsequently, the mRNA was enriched using oligo (dT) magnetic beads
(for eukaryotes; Dynabeads® mRNA Purification kit). The
mRNA was then mixed with fragmentation buffer (Ambion®
RNA Fragmentation Reagents; Ambion; Thermo Fisher Scientific, Inc.)
and fragmented into short fragments (~200 bp). The first strand of
cDNA was then synthesized using random hexamer-primed reverse
transcription (Super Script® II Reverse Transcriptase;
Invitrogen; Thermo Fisher Scientific, Inc.) according to the
manufacturer's protocol. Second strand buffer (Invitrogen; Thermo
Fisher Scientific, Inc.), deoxynucleotide triphosphates (New
England Biolabs, Inc.), RNase H (Second Strand Master Mix;
Invitrogen; Thermo Fisher Scientific, Inc.) and DNA polymerase I
(Second Strand Master Mix; Invitrogen; Thermo Fisher Scientific,
Inc.) were added to synthesize the second strand. The double strand
cDNA was then purified with magnetic beads. End reparation was then
performed, and the adaptors were then ligated to the ends of the
fragments using a ClaSeek Library Preparation kit (Thermo Fisher
Scientific, Inc.) according to the manufacturer's protocol. The
ligation products were selected by size and purified on a
Tris-acetate-EDTA-agarose gel (Sigma-Aldrich). Finally, the
fragments were enriched by polymerase chain reaction (PCR)
amplification using Platinum® Pfx DNA Polymerase
(Invitrogen; Thermo Fisher Scientific, Inc.) and
GeneAmp® system 9700 (Applied Biosystems; Thermo Fisher
Scientific, Inc.) according to the manufacturer's protocol. PCR
products were purified with magnetic beads and dissolved in 50
µl Epstein-Barr solution (Agencourt®
AMPure® XP Beads-PCR Purification; Beckman Coulter,
Inc., Brea, CA, USA). During the quality control step, an Agilent
2100 Bioanalyzer was used to qualify and quantify the sample
library.
RNA sequencing
The library products were prepared for sequencing
with an Ion Proton platform (Ion Torrent™; Thermo Fisher
Scientific, Inc.). Data filtering was performed to obtain
high-quality reads, and the clean reads were saved as '.bam' files
and used as the original sequencing results. All the sequence reads
were mapped to the reference genome sequences. The maximum number
of mismatches allowed for the mapping was set at two.
The expression level for each gene was determined by
the number of reads uniquely mapped to the specific gene, and by
the total number of uniquely mapped reads in the sample. To
determine the expression levels of various genes and compare them
between samples, the variable read per kilobase of exon per million
mapped reads (RPKM) method was used (9). The statistical significance of the
differential expression of each gene was determined, according to
the P-value. Fold-change (FC) differences between the control and
diabetic groups of rats were calculated. The P-values were adjusted
for multiplicity to control the false discovery rate (FDR).
Differentially expressed genes (DEGs) were defined as those with an
|FC| >2 and FDR <5%.
Gene ontology (GO) and pathway enrichment
analysis of DEGs
GO enrichment analysis provides all the GO terms,
which are significantly enriched among DEGs, compared with the
background genome, and filters the DEGs that correspond to
biological functions (10). This
method first maps all the DEGs to GO terms in the GO database
(http://www.geneontology.org/) and
calculates the numbers of genes for every term. It then uses a
hypergeometric test to identify significantly enriched GO terms
among the DEGs in relation to the background genome. Using
non-redundant (NR) annotation, the Blast2GO version 3.0 program
(Biobam, Valencia, Spain) was used to obtain GO annotations for the
DEGs. Subsequently, WEGO software (http://wego.genomics.org.cn/cgi-bin/wego/index.pl)
(11) was used to generate GO
functional classifications for the DEGs and determine the
distribution of gene functions of a species from the macro
level.
Genes usually interact during certain biological
functions, and a pathway-based analysis can assist in establishing
the the biological functions of a gene (12). KEGG is a major public
pathway-associated database (13).
Pathway enrichment analysis identifies significantly enriched
metabolic pathways and signal transduction pathways in DEGs,
relative to the whole background genome.
Reverse transcription-quantitative PCR
(RT-qPCR) validation of the RNA-seq data
To validate the RNA-seq findings in the present
study, 10 genes, identified as differentially expressed, were
randomly selected for RT-qPCR validation. The RT-qPCR was performed
using eight samples of purified RNA, including four from the
diabetes group and four from the control group. Total RNA was first
reverse-transcribed into cDNA using a RevertAid First Strand cDNA
Synthesis kit (Thermo Fisher Scientific, Inc.) according to the
manufacturer's instructions. The primers were designed using Primer
Express 3.0 (v. 0.4.0; http://bioinfo.ut.ee/primer3-0.4.0/) and the sequences
are listed in Table I. GAPDH was
used as a reference control. Subsequent qPCR was performed with a
Mastercycler® ep realplex (Eppendorf, Germany) using
SYBR Premix Ex Taq™ II (Takara Bio, Inc., Otsu, Japan) in
accordance with the manufacturer's protocol. The qPCR was conducted
with the following thermal cycling conditions: 95°C for 30 sec,
followed by 40 cycles of 95°C for 5 sec and 60°C for 30 sec, and
three replicates were performed for each amplification. Relative
quantification analyses were performed using the comparative Cq
method, and relative gene expression levels were calculated using
the 2−∆∆Cq method (14).
 | Table IList of primers used in reverse
transcription-quantitative polymerase chain reaction analysis. |
Table I
List of primers used in reverse
transcription-quantitative polymerase chain reaction analysis.
| Gene | Primer sequence
(5′–3′) |
|---|
| Cryaa | F:
CAGAGGGCTGAGGATTTGAG
R: ATGCCATCATTCCCTCTGAC |
| Cryab | F:
CTGGGAGACGTGATTGAGGT
R: TCCGGTACTTCCTGTGGAAC |
| Htra2 | F:
CAGCTGTGGATCCTGTAGCA
R: CTGAGCAGAGCTGACAATGC |
| Pitx3 | F:
CGCCTCCTCCCCTTATGTAT
R: GCGTACTGGCAGGGACTAAG |
| Fgf2 | F:
GGCTGCTGGCTTCTAAGTGT
R: CCGTTTTGGATCCGAGTTTA |
| Casp3 | F:
GGACCTGTGGACCTGAAAAA
R: GCATGCCATATCATCGTCAG |
| Stat3 | F:
TGATGCGCTCTTATGTGAGG
R: GGCGGACAGAACATAGGTGT |
| Fabp7 | F:
CCAGCTGGGAGAAGAGTTTG
R: TTTCTTTGCCATCCCACTTC |
| Jak3 | F:
CAGAACTCACAACCCCAGGT
R: GACAGGAGAGCAAGGGACTG |
| Xiap | F:
GACAAATGTCCCATGTGCTG
R: CTAATGGACTGCGATGCTGA |
| Gapdh | F:
AGACAGCCGCATCTTCTTGT
R: TGATGGCAACAATGTCCACT |
Statistical analysis
Independent sample t-tests were performed to assess
for any significant differences in the measured variables between
the control and diabetic groups. All values are reported as the
mean ± standard error of the mean, unless otherwise stated. Data
were analyzed using Statistical Package for the Social Sciences
software, version 18.0 (SPSS, Inc., Chicago, IL, USA). P<0.05
was considered to indicate a statistically significant
difference.
Results
STZ induces diabetes
All the STZ-treated rats exhibited characteristics
of diabetes, and their blood glucose levels were significantly
higher, compared with those in the age-matched control rats.
However, changes in weight occurred more slowly in the diabetic
rats, compared with the age-matched control rats, following STZ
treatment (Table II) and showed
symptoms of polyuria. The age-matched control rats had normal
glucose levels, showed no signs of polyuria and gained weight
consistently until the animals were sacrificed.
| Table IIRat blood glucose levels and
weights. |
Table II
Rat blood glucose levels and
weights.
| Parameter | Control | Diabetes | P-value |
|---|
| Blood glucose
(mmol/l) | 5.408±0.957 | 29.215±4.474 | <0.001a |
| Weight (g) | 332.538±34.391 | 241.077±46.232 | <0.001a |
F-ERG measurements
The ERG responses were defined according to the
current ISCEV standards (15). The
a-wave is a fast negative ERG component, obtained primarily from
the maximal combined response. The leading edge reflects the
membrane current in the photoreceptors. The a-wave amplitude is
measured from the baseline to a-wave trough. The b-wave is a large
positive ERG potential. Under scotopic conditions, the rising phase
(up to the peak) is directly generated by bipolar cells and Müller
cells. The implicit duration of the b-wave is measured from flash
onset to the peak of the b-wave (16–18).
The oscillatory potentials (OPs) are three to five low-amplitude,
high-frequency wavelets, superimposed on the ascending limb of the
ERG b-wave. The OPs are considered to result from feedback between
the amacrine cells and bipolar cells, and/or feedback from ganglion
cells to amacrine cells. The peak to trough amplitudes of the waves
are frequently combined to provide an overall measure of the OP
amplitude. Alternatively, the amplitudes of individual wavelets may
be recorded. The latter may be preferable, as OPs are complex in
origin, and individual wavelets may be generated at different sites
within the retina (19,20).
The amplitudes of the a-wave, b-wave, OP1, OP2 and
∑OP were all significantly reduced (Table III) in the diabetic group,
compared with the control group (P<0.05). Furthermore, the
implicit b-wave durations in the diabetic group were significantly
longer (Table IV) than those in
the control group (P<0.001). No significant differences were
found in the implicit durations of the a-wave, OP1, OP2, OP3 or ∑OP
between the control and diabetic groups.
| Table IIIAmplitudes of the
flash-electroretinography waves. |
Table III
Amplitudes of the
flash-electroretinography waves.
| Wave | Control
(µV) | Diabetes
(µV) | P-value |
|---|
| a-wave | 184.500±67.847 | 94.600±40.357 | 0.002a |
| b-wave | 366.400±79.120 | 228.800±86.334 | 0.002a |
| OP1 | 41.200±21.353 | 16.800±8.284 | 0.003a |
| OP2 | 51.600±26.667 | 21.000±13.622 | 0.005a |
| OP3 | 15.400±10.211 | 11.000±8.446 | 0.308 |
| ∑OP | 108.200±44.696 | 48.800±26.080 | 0.002a |
| Table IVImplicit durations of the
flash-electroretinography waves. |
Table IV
Implicit durations of the
flash-electroretinography waves.
| Wave | Control (ms) | Diabetes (ms) | P-value |
|---|
| a-wave | 22.440±2.029 | 21.990±1.600 | 0.589 |
| b-wave | 67.200±12.026 | 99.420±17.328 | <0.001a |
| OP1 | 27.420±3.308 | 27.390±3.206 | 0.984 |
| OP2 | 37.260±2.952 | 39.240±6.569 | 0.396 |
| OP3 | 48.330±6.034 | 51.470±7.181 | 0.304 |
| ∑OP | 113.010±10.140 | 118.800±16.380 | 0.414 |
RNA-seq analysis and global gene
expression profiles
To obtain triplicate results, three samples were
obtained from the control and the diabetic groups of animals, with
each sample obtained from a pair of rat retinas. In total, six
RNA-Seq libraries were constructed, and over 14,000,000 clean reads
were generated in each library. Subsequently, ~87.9% of the total
reads were mapped to the reference genome. The detailed mapping
statistics are listed in Table
V.
| Table VRead numbers and mapping results for
the six RNA-sequencing libraries. |
Table V
Read numbers and mapping results for
the six RNA-sequencing libraries.
| Sample ID | Total reads n
(%) | Total base pairs n
(%) | Total mapped reads
n (%) | Unique match n
(%) | Multi-position n
(%) | Total unmapped n
(%) |
|---|
| DR16W1 | 14,398,797
(100.00) | 1,850,115,823
(100.00) | 12,519,880
(86.95) | 11,647,945
(80.90) | 871,935 (6.06) | 1,878,917
(13.05) |
| DR16W2 | 14,414,451
(100.00) | 1,854,697,611
(100.00) | 12,649,675
(87.76) | 11,725,904
(81.35) | 923,771 (6.41) | 1,764,776
(12.24) |
| DR16W3 | 14,386,289
(100.00) | 1,838,427,407
(100.00) | 12,703,346
(88.30) | 11,736,604
(81.58) | 966,742 (6.72) | 1,682,943
(11.70) |
| N1 | 14,337,585
(100.00) | 1,899,871,368
(100.00) | 12,601,774
(87.89) | 11,653,121
(81.28) | 948,653 (6.62) | 1,735,811
(12.11) |
| N2 | 14,373,209
(100.00) | 1,876,888,894
(100.00) | 12,722,255
(88.51) | 11,835,434
(82.34) | 886,821 (6.17) | 1,650,954
(11.49) |
| N3 | 14,325,365
(100.00) | 1,809,430,612
(100.00) | 12,574,237
(87.78) | 11,692,479
(81.62) | 881,758 (6.16) | 1,751,128
(12.22) |
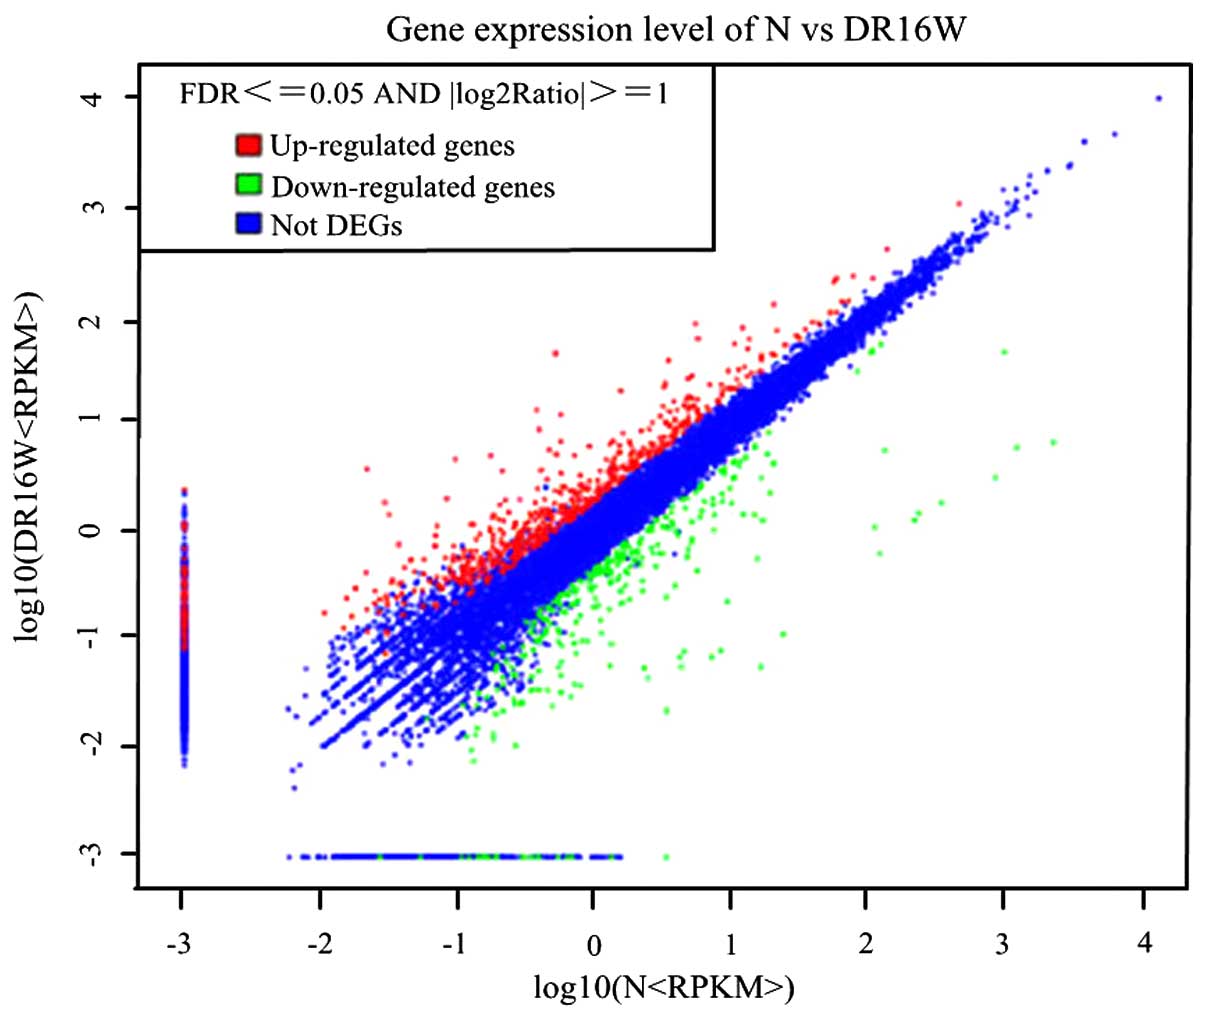
Gene expression levels and DEGs
The triplicate samples from the control and diabetic
groups were assayed for DEGs (Fig.
1), and a total of 868 genes were found to be differentially
expressed, with 565 upregulated genes and 303 downregulated genes.
The 10 most markedly upregulated and downregulated genes are listed
in Table VI.
| Table VITop 10 upregulated and downregulated
genes in the retina of streptozotocin-induced rats, compared with
normal control rats. |
Table VI
Top 10 upregulated and downregulated
genes in the retina of streptozotocin-induced rats, compared with
normal control rats.
| Gene | Description | N-RPKM | DR16W-RPKM | Fold change | P-value | FDR |
|---|
| Upregulated | | | | | | |
| Rnu5g | RNA, U5G small
nuclear | 0.001 | 2.603 | 11.346 | 0.017 | 0.046 |
| Ifi27l2a | Interferon,
α-inducible protein 27 like 2A | 0.001 | 1.256 | 10.294 | >0.001 | 0.001 |
| Fabp7 | Fatty acid binding
protein 7, brain | 0.001 | 1.189 | 10.215 | >0.001 | >0.001 |
| Ifi27l2b | Interferon,
α-inducible protein 27 like 2B | 0.001 | 1.105 | 10.110 | >0.001 | >0.001 |
| Adm2 | Adrenomedullin
2 | 0.001 | 0.735 | 9.522 | >0.001 | >0.001 |
| Calca |
Calcitonin/calcitonin-related polypeptide,
α | 0.001 | 0.591 | 9.207 | >0.001 | 0.001 |
| Batf | Basic leucine
zipper transcription factor, ATF-like | 0.001 | 0.501 | 8.969 | 0.002 | 0.008 |
| Smim6 | Small integral
membrane protein 6 | 0.001 | 0.465 | 8.860 | 0.002 | 0.008 |
| Gm766 | Predicted gene
766 | 0.001 | 0.444 | 8.793 | >0.001 | 0.001 |
| Downregulated | | | | | | |
| Gja3 | Gap junction
protein, α3 | 3.261 | 0.001 | −11.671 | >0.001 | >0.001 |
| Pitx3 | Paired-like
homeodomain transcription factor 3 | 1.300 | 0.001 | −10.344 | >0.001 | >0.001 |
| Wnt7a | Wingless-related
MMTV integration site 7A | 0.671 | 0.001 | −9.390 | >0.001 | >0.001 |
| Foxe3 | Forkhead box
E3 | 0.615 | 0.001 | −9.263 | >0.001 | 0.002 |
| Gm765 | Predicted gene
765 | 0.528 | 0.001 | −9.043 | 0.002 | >0.001 |
| Tmem30c | Transmembrane
protein 30C | 0.386 | 0.001 | −8.590 | >0.001 | >0.001 |
| Gpr50 | G-protein-coupled
receptor 50 | 0.377 | 0.001 | −8.557 | >0.001 | >0.001 |
| 1110059M19Rik | RIKEN cDNA
1110059M19 gene | 0.345 | 0.001 | −8.431 | 0.004 | 0.012 |
| Defb1 | Defensin β1 | 0.312 | 0.001 | −8.285 | 0.015 | 0.042 |
| Cryaa | Crystallin, αA | 2170.114 | 7.093 | −8.257 | >0.001 | >0.001 |
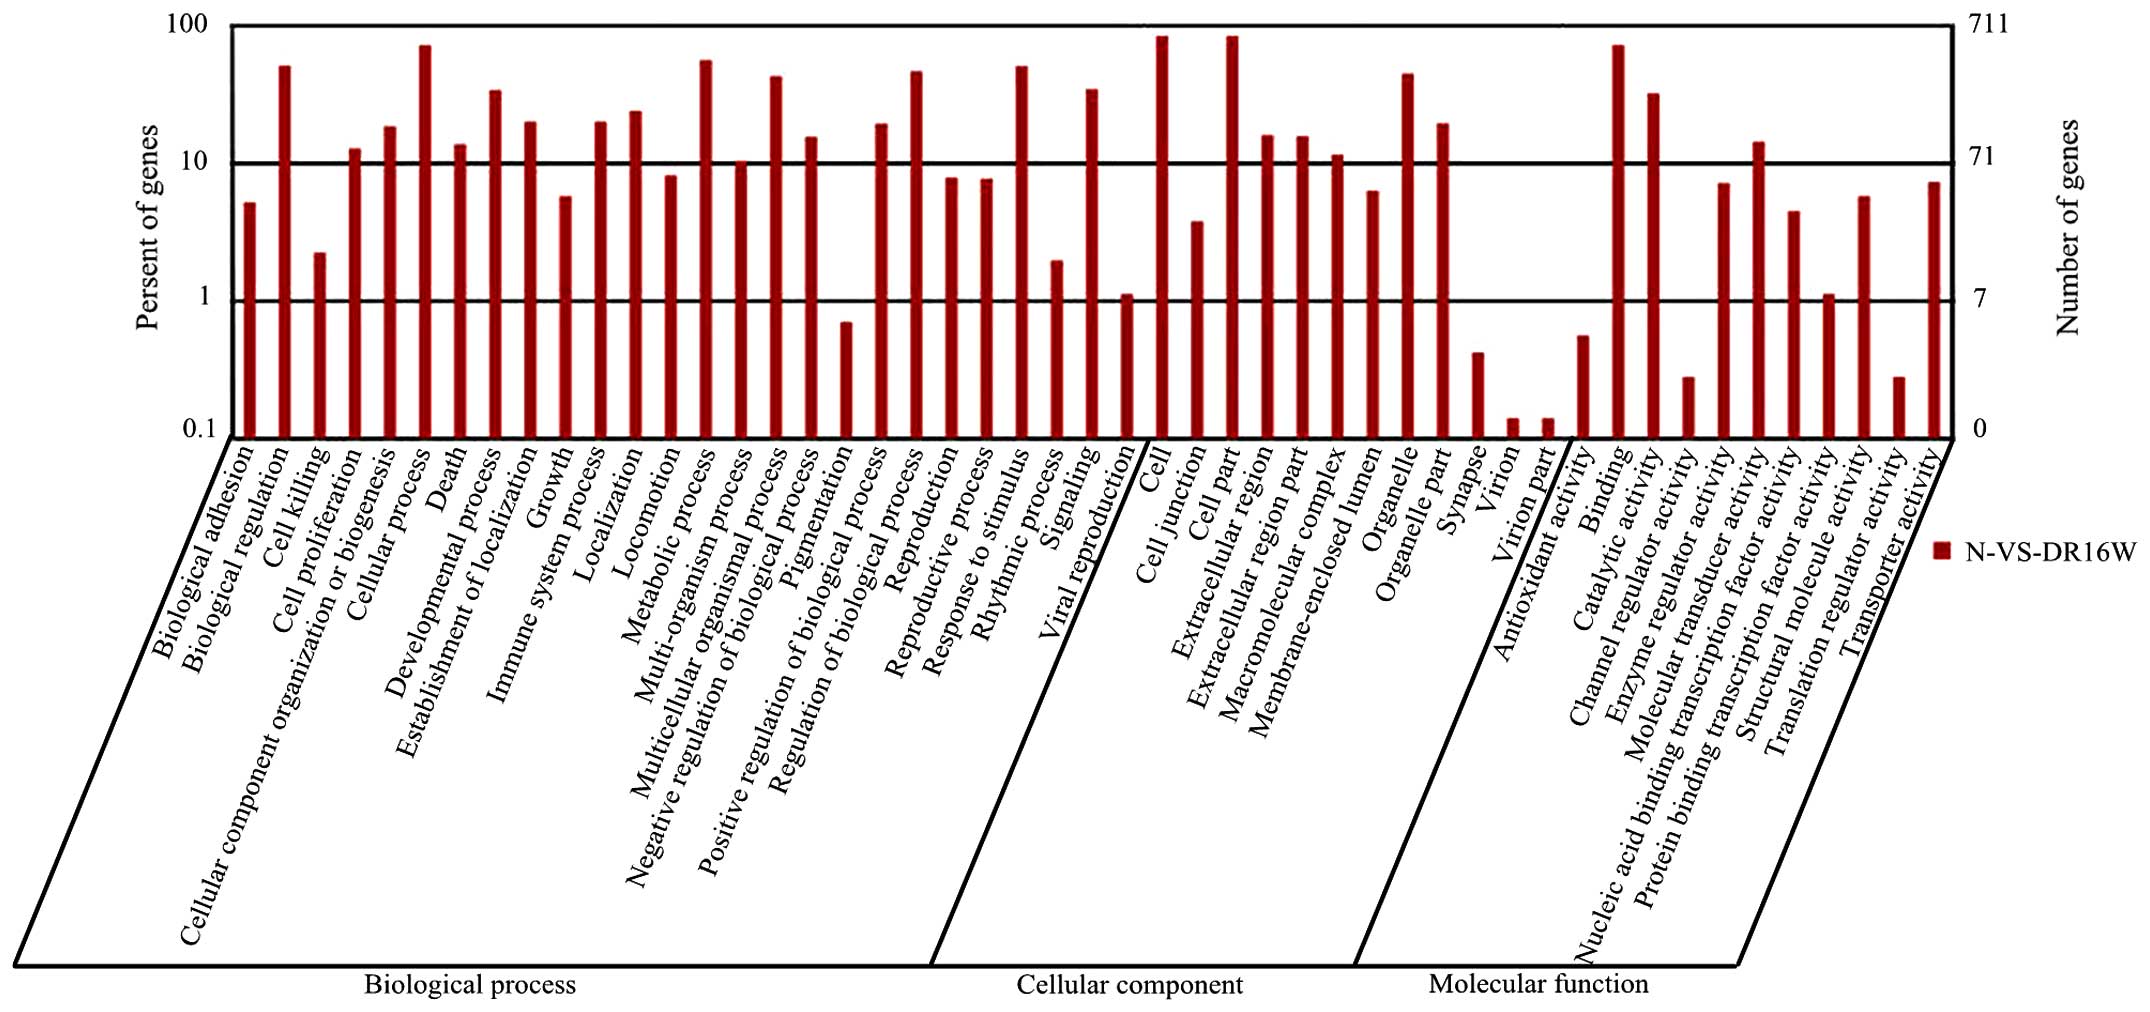
GO categories and pathways
The GO classification comprises cellular component,
molecular function and biological process domains. Based on
sequence homology, the 868 DEGs identified in the present study
were categorized into 49 functional groups. In the cellular
component, molecular function and biological process GO
classification categories, 26, 12 and 11 functional groups were
identified, respectively (Fig. 2).
Among these groups, the cellular process, cell and cell parts, and
binding were the predominant in each of the three categories. A
high percentage of the altered genes in the biological processes in
the DEGs were involved in response to stimulus (349/637 genes;
54.8%), regulation of biological processes (331/637 genes; 52.0%)
and metabolic processes (331/637 genes; 52.0%). Furthermore, 94
apoptotic and apoptotic regulatory genes, and 19 inflammatory
genes, were also detected as having changed.
The KEGG pathway significant enrichment analysis
revealed that the DEGs were involved in 217 pathways, including
CAMs, complement and coagulation cascades, and antigen processing
and presentation.
Confirmation of DEGs using RT-qPCR
To validate the RNA-seq findings, the present study
prepared rat retinas from separate groups of rats in each group
qPCR analysis. In total, 10 genes were selected, comprising Gryaa,
Gryab, Htra2, Pitx3, Fgf2, Casp3, Stat3, Fabp7, Jak3, Xiap and
Gapdh. Changes in the expression levels of these genes were
determined using RT-qPCR. These results were similar to those
obtained following the RNA-seq.
Discussion
In the present study, diabetes was induced
chemically in 10-week-old male Sprague-Dawley rats using STZ. All
the STZ-treated rats exhibited characteristics of diabetes,
including hyperglycemia, weight loss and polyuria. Furthermore,
varying degrees of cataracts were prevalent among the diabetic
rats. However, cataracts were not present in the age-matched
control rats. The present study examined F-ERG following dark
adaptation to evaluate the visual function of the control rats and
diabetes-induced rats after 16 weeks. F-ERG is a widely used ocular
electrophysiological assessment, and is considered an objective
method for evaluating retinal function. The maximal amplitudes of
the a- and b-waves were used as indicators for photoreceptor
function and inner nuclear layer functional integrity,
respectively. The sums of the OPs were used to assess the function
of the inner retina (16,17,19).
Previous studies have found significant a-wave changes 10–12 weeks
following STZ induction, which were not observed prior to this
period (21–23), and 33% b-wave loss at 12 weeks
post-STZ injection (24). It has
been reported that OPs are more affected by diabetes, compared with
a-waves or b-waves, which are more attenuated and are affected
earlier than the outer retinal responses (25,26).
Other studies have found that OPs are affected <5 weeks
following the induction of diabetes by STZ (24,27).
These results are consistent with our finding that the a-wave,
b-wave, OP1, OP2 and ∑OP amplitudes were significantly reduced 16
weeks following STZ induction in the diabetic rats, compared with
the control group (P<0.05). Furthermore, the implicit b-wave
durations in the diabetic rats were significantly longer, compared
with those of the control group (P<0.001). Therefore, it was
concluded that the inner and outer retinas 16 weeks following the
onset of STZ-induced diabetes were damaged by the high
concentration of glucose in the blood.
The RNA-seq methodology allows for accurate and
quantitative identification of molecular signatures. In the present
study, 10 transcripts were verified using RT-qPCR. Changes were
observed in a variety of retinal transcripts as a result of
diabetes, and these can be used in determining the molecular
signatures, which involve representative transcripts of the
retina.
The 10 most upregulated and downregulated genes were
identified in the present study. Interferon α-inducible protein
27-like 2A (Ifi27l2a) and interferon α-inducible protein 27-like 2B
(Ifi27l2b), also termed interferon stimulated gene 12 (ISG12)a and
ISG12b, respectively, belong to the ISG12 subfamily of ISGs. These
genes are poorly characterized, and their physiological functions
remain to be elucidated. However, studies have found that ISG12
inactivates the vasculoprotective functions of NR4A nuclear
receptors (28). Fatty acid
binding proteins (FABPs) are expressed in the majority of tissues,
and they are suggested to act as central regulators of lipid
metabolism, inflammation and energy homeostasis (29). FABP7, also termed brain FABP or
BLBP, is widely used as a radial glial cell marker, and its
expression is induced in astrocytes and Müller glial cells in rats
subjected to kainate acid treatment, which leads to neuronal
degeneration in the retina (30).
Calcitonin-related peptide α (CALCA), also known as calcitonin
gene-related peptide (CGRP), is a 37-amino-acid vasoactive
neuropeptide. Adrenomedullin 2 (ADM2) or intermedin (IMD) is a
member of the CGRP family (31,32).
CALCA is a potent vasodilator; thus, it possesses protective
mechanisms, which are important for physiological and pathological
conditions involving the cardiovascular system and wound healing
(33). The upregulation of CALCA
in the retina protects against cell apoptosis induced by the stress
of acute myocardial infarction (34). Basic leucine zipper transcription
factor ATF-like (Batf), which is a subgroup of the larger family of
basic leucine zipper (bZIP) transcription factors, includes
important positive transcriptional regulators in the immune system
(35).
Paired-like homeodomain 3 (Pitx3) is a
homeodomain-containing transcription factor and is crucial for the
development and differentiation of dopamine (DA) neurons. Pitx3 can
upregulate the expression levels of brain-derived neurotrophic
factor (BDNF) and glial cell line-derived neurotrophic factor
(GDNF) in the SH-SY5Y neuroblastoma cell line and in primary
ventral mesencephalon (VM) cultures (36). Investigations of Pitx3-deficiency
in aphakia mice have revealed that Pitx3 is required for the
development of DA neurons in SNc (37,38).
Studies have shown that Pitx3 directly regulates forkhead box E3
(Foxe3), a lens-specific transcription factor that is active during
early lens development (39). Wnt
signaling is essential for neuronal development and in developing
nervous system maintenance. Modulation of the Wnt pathway has been
reported to be a likely intervention target for DR (40). G protein-coupled receptor 50
(GPR50) is likely to be involved in the stress response and energy
homeostasis in the mouse brain through neurotransmitter signaling
(41).
Under control conditions in the present study,
Ifi27l2a, Ifi27l2b, FABP7, CALCA, ADM2, and Batf were expressed at
low levels, however they were markedly upregulated in the diabetic
rats. By contrast, Pitx3, Foxe3, Gja3, GPR50 showed the opposite
effects. These genes are involved in vasculoprotection, neuronal
degeneration, cell apoptosis and immune function, and represent an
important pool of candidate genes for future analysis (28–34,36–39,41).
Crystallins have been primarily characterized in the
lens, have been shown to be critical in maintaining lens
transparency, and may be involved in different cell and tissue
functions in normal and diseased conditions in various tissues
(42–44). These proteins are primarily
categorized into two distinct families: α- and β/γ-crystallins. The
two α-crystallins, αA and αB, are small heat-shock proteins, which
act as molecular chaperones and are involved in the regulation of
apoptosis (45). The function of
β/γ-crystallin remains to be fully elucidated, however, the
expression of β/γ-crystallins in the retina suggests that they may
also function as stress proteins. αA- and αB-crystallin, which can
protect retinal neurons from cell death (46), show increased expression in the
early stages of the disease and decreased expression as the disease
progresses. In the present study, it was found that the expression
levels of αA- and αB crystallins were downregulated 12 weeks
following STZ induction, and the inconsistency in these findings
with those of other reports (47–49)
may be due to different durations of hyperglycemia, different
species and/or different strains of animals. The expression of
crystallins is a dynamic process that is associated with the
duration of hyperglycemia and the extent of the pathogenic
condition (47,50).
There is an accumulating body of evidence indicating
that inflammation (51–54) and neurodegeneration (55–57)
are important in the pathogenesis of DR. The results of the present
study revealed that diabetes led to the abnormal expression of 94
genes involved in apoptosis and the regulation of apoptosis, and 19
inflammatory genes. The results of the KEGG pathway significant
enrichment analysis revealed enrichment of the CAMs, complement and
coagulation cascades, and of antigen processing and presentation.
CAMs are cell-surface proteins, which are involved in binding with
other cells or the extracellular matrix (ECM), and the binding of
CAMs to their receptors/ligands is important in the mediation of
fundamental inflammatory and immune reactions (58). Other studies have suggested that
CAMs are important markers of endothelial dysfunction and are
important in the development of DR (59–61).
Complement and coagulation cascades, and antigen processing and
presentation are involved in innate immune responses, and the
dysregulation of innate immunity is associated with an increased
inflammatory response (62,63).
In conclusion, the F-ERG results in the present
study revealed that the inner and outer retinas were damaged by 16
weeks of hyperglycemia. RNA-seq technology revealed a change in the
molecular signature of the retina, and provided novel insights into
the molecular mechanisms underlying DR. These abnormally expressed
genes have a pathogenic effect in DR. Further investigations are
necessary to examine the roles of these genes in the progression of
DR. Taken together, RNA-seq was identified as a technology offering
potential in the identification of novel biomarkers and therapeutic
targets for DR.
Acknowledgments
This study was supported by the Natural Science
Foundation of Guangxi Zhuang Autonomous Region (grant no.
2012GXNSFBA053122).
References
|
1
|
Ali TK and El-Remessy AB: Diabetic
retinopathy: Current management and experimental therapeutic
targets. Pharmacotherapy. 29:182–192. 2009. View Article : Google Scholar : PubMed/NCBI
|
|
2
|
Tang J and Kern TS: Inflammation in
diabetic retinopathy. Prog Retin Eye Res. 30:343–358. 2011.
View Article : Google Scholar : PubMed/NCBI
|
|
3
|
Abcouwer SF and Gardner TW: Diabetic
retinopathy: Loss of neuroretinal adaptation to the diabetic
metabolic environment. Ann N Y Acad Sci. 1311:174–190. 2014.
View Article : Google Scholar : PubMed/NCBI
|
|
4
|
Simó R and Hernández C; the European
Consortium for the Early Treatment of Diabetic Retinopathy
(EUROCONDOR): Neurodegeneration is an early event in diabetic
retinopathy: Therapeutic implications. Br J Ophthalmol.
96:1285–1290. 2012. View Article : Google Scholar : PubMed/NCBI
|
|
5
|
Melmed RN, Benitez CJ and Holt SJ:
Intermediate cells of the pancreas. 3. Selective autophagy and
destruction of beta-granules in intermediate cells of the rat
pancreas induced by alloxan and streptozotocin. J Cell Sci.
13:297–315. 1973.PubMed/NCBI
|
|
6
|
Montgomery SB, Sammeth M,
Gutierrez-Arcelus M, Lach RP, Ingle C, Nisbett J, Guigo R and
Dermitzakis ET: Transcriptome genetics using second generation
sequencing in a Caucasian population. Nature. 464:773–777. 2010.
View Article : Google Scholar : PubMed/NCBI
|
|
7
|
The Association for Research in Vision and
Ophtalmology: Policies: Statement for the use of animals in
ophtalmic and visual research. http://www.arvo.org/About_ARVO/Policies/Statement_for_the_Use_of_Animals_in_Ophthalmic_and_Visual_Research/.
Accessed January 15, 2013.
|
|
8
|
Marmor MF, Holder GE, Seeliger MW and
Yamamoto S: International Society for Clinical Electrophysiology:
Standard for clinical electroretinography (2004 update). Doc
Ophthalmol. 108:107–114. 2004. View Article : Google Scholar : PubMed/NCBI
|
|
9
|
Mortazavi A, Williams BA, McCue K,
Schaeffer L and Wold B: Mapping and quantifying mammalian
transcriptomes by RNA-Seq. Nat Methods. 5:621–628. 2008. View Article : Google Scholar : PubMed/NCBI
|
|
10
|
Zheng Q and Wang XJ: GOEAST: A web-based
software toolkit for Gene Ontology enrichment analysis. Nucleic
Acids Res. 36:W358–W363. 2008. View Article : Google Scholar : PubMed/NCBI
|
|
11
|
Ye J, Fang L, Zheng H, Zhang Y, Chen J,
Zhang Z and Wang J, Li S, Li R, Bolund L and Wang J: WEGO: A web
tool for plotting GO annotations. Nucleic Acids Res. 34(Web Server
issue): W293–W297. 2006. View Article : Google Scholar : PubMed/NCBI
|
|
12
|
Al-Shahrour F, Arbiza L, Dopazo H,
Huerta-Cepas J, Mínguez P, Montaner D and Dopazo J: From genes to
functional classes in the study of biological systems. BMC
Bioinformatics. 8:1142007. View Article : Google Scholar : PubMed/NCBI
|
|
13
|
Kanehisa M, Araki M, Goto S, Hattori M,
Hirakawa M, Itoh M, Katayama T, Kawashima S, Okuda S, Tokimatsu T
and Yamanishi Y: KEGG for linking genomes to life and the
environment. Nucleic Acids Res. 36(Database issue): D480–D484.
2008. View Article : Google Scholar :
|
|
14
|
Livak KJ and Schmittgen TD: Analysis of
relative gene expression data using real-time quantitative PCR and
the 2(-Delta Delta C(T)) method. Methods. 25:402–408. 2001.
View Article : Google Scholar
|
|
15
|
Hood DC, Bach M, Brigell M, Keating D,
Kondo M, Lyons JS, Marmor MF, McCulloch DL and Palmowski-Wolfe AM:
the International Society For Clinical Electrophysiology of Vision:
ISCEV standard for clinical multifocal electroretinography (mfERG)
(2011 edition). Doc Ophthalmol. 124:1–13. 2012. View Article : Google Scholar
|
|
16
|
Robson JG and Frishman LJ: Photoreceptor
and bipolar cell contributions to the cat electroretinogram: A
kinetic model for the early part of the flash response. J Opt Soc
Am A Opt Image Sci Vis. 13:613–622. 1996. View Article : Google Scholar : PubMed/NCBI
|
|
17
|
Hood DC and Birch DG: Beta wave of the
scotopic (rod) electroretinogram as a measure of the activity of
human on-bipolar cells. J Opt Soc Am A Opt Image Sci Vis.
13:6231996. View Article : Google Scholar : PubMed/NCBI
|
|
18
|
Kondo M: Animal models of human retinal
and optic nerve diseases analysed using electroretinography. Nippon
Ganka Gakkai Zasshi. 114:248–278. 2010.In Japanese.
|
|
19
|
Heynen H, Wachtmeister L and van Norren D:
Origin of the oscillatory potentials in the primate retina. Vision
Res. 25:1365–1373. 1985. View Article : Google Scholar : PubMed/NCBI
|
|
20
|
Hennekes R: Clinical electroretinography.
Fortschr Ophthalmol. 86:146–150. 1989.In German.
|
|
21
|
Phipps JA, Yee P, Fletcher EL and Vingrys
AJ: Rod photoreceptor dysfunction in diabetes: Activation,
deactivation and dark adaptation. Invest Ophthalmol Vis Sci.
47:3187–3194. 2006. View Article : Google Scholar : PubMed/NCBI
|
|
22
|
Phipps JA, Fletcher EL and Vingrys AJ:
Paired-flash identification of rod and cone dysfunction in the
diabetic rat. Invest Ophthalmol Vis Sci. 45:4592–4600. 2004.
View Article : Google Scholar : PubMed/NCBI
|
|
23
|
Li Q, Zemel E, Miller B and Perlman I:
Early retinal damage in experimental diabetes:
Electroretinographical and morphological observations. Exp Eye Res.
74:615–625. 2002. View Article : Google Scholar : PubMed/NCBI
|
|
24
|
Hancock HA and Kraft TW: Oscillatory
potential analysis and ERGs of normal and diabetic rats. Invest
Ophthalmol Vis Sci. 45:1002–1008. 2004. View Article : Google Scholar : PubMed/NCBI
|
|
25
|
Bui BV, Armitage JA, Tolcos M, Cooper ME
and Vingrys AJ: ACE inhibition salvages the visual loss caused by
diabetes. Diabetologia. 46:401–408. 2003.PubMed/NCBI
|
|
26
|
Sakai H, Tani Y, Shirasawa E, Shirao Y and
Kawasaki K: Development of electroretinographic alterations in
streptozotocin-induced diabetes in rats. Ophthalmic Res. 27:57–63.
1995. View Article : Google Scholar : PubMed/NCBI
|
|
27
|
Ramsey DJ, Ripps H and Qian H: An
electrophysiological study of retinal function in the diabetic
female rat. Invest Ophthalmol Vis Sci. 47:5116–5124. 2006.
View Article : Google Scholar : PubMed/NCBI
|
|
28
|
Papac-Milicevic N, Breuss JM, Zaujec J,
Ryban L, Plyushch T, Wagner GA, Fenzl S, Dremsek P, Cabaravdic M,
Steiner M, et al: The interferon stimulated gene 12 inactivates
vasculoprotective functions of NR4A nuclear receptors. Circ Res.
110:e50–e63. 2012. View Article : Google Scholar : PubMed/NCBI
|
|
29
|
Storch J and Thumser AE: Tissue-specific
functions in the fatty acid-binding protein family. J Biol Chem.
285:32679–32683. 2010. View Article : Google Scholar : PubMed/NCBI
|
|
30
|
Chang ML, Wu CH, Jiang-Shieh YF, Shieh JY
and Wen CY: Reactive changes of retinal astrocytes and Muller glial
cells in kainate-induced neuroexcitotoxicity. J Anat. 210:54–65.
2007. View Article : Google Scholar : PubMed/NCBI
|
|
31
|
Takei Y, Hyodo S, Katafuchi T and Minamino
N: Novel fish-derived adrenomedullin in mammals: Structure and
possible function. Peptides. 25:1643–1656. 2004. View Article : Google Scholar : PubMed/NCBI
|
|
32
|
Roh J, Chang CL, Bhalla A, Klein C and Hsu
SY: Intermedin is a calcitonin/calcitonin gene-related peptide
family peptide acting through the calcitonin receptor-like
receptor/receptor activity-modifying protein receptor complexes. J
Biol Chem. 279:7264–7274. 2004. View Article : Google Scholar
|
|
33
|
Russell FA, King R, Smillie SJ, Kodji X
and Brain SD: Calcitonin gene-related peptide: Physiology and
pathophysiology. Physiol Rev. 94:1099–1142. 2014. View Article : Google Scholar : PubMed/NCBI
|
|
34
|
Yang JH, Zhang YQ and Guo Z: Endogenous
CGRP protects retinal cells against stress induced apoptosis in
rats. Neurosci Lett. 501:83–85. 2011. View Article : Google Scholar : PubMed/NCBI
|
|
35
|
Murphy TL, Tussiwand R and Murphy KM:
Specificity through cooperation: BATF-IRF interactions control
immune-regulatory networks. Nat Rev Immunol. 13:499–509. 2013.
View Article : Google Scholar : PubMed/NCBI
|
|
36
|
Yang D, Peng C, Li X, Fan X, Li L, Ming M,
Chen S and Le W: Pitx3-transfected astrocytes secrete brain-derived
neurotrophic factor and glial cell line-derived neurotrophic factor
and protect dopamine neurons in mesencephalon cultures. J Neurosci
Res. 86:3393–3400. 2008. View Article : Google Scholar : PubMed/NCBI
|
|
37
|
Nunes I, Tovmasian LT, Silva RM, Burke RE
and Goff SP: Pitx3 is required for development of substantia nigra
dopaminergic neurons. Proc Natl Acad Sci USA. 100:4245–4250. 2003.
View Article : Google Scholar : PubMed/NCBI
|
|
38
|
Hwang DY, Ardayfio P, Kang UJ, Semina EV
and Kim KS: Selective loss of dopaminergic neurons in the
substantia nigra of Pitx3-deficient aphakia mice. Brain Res Mol
Brain Res. 114:123–131. 2003. View Article : Google Scholar : PubMed/NCBI
|
|
39
|
Ahmad N, Aslam M, Muenster D, Horsch M,
Khan MA, Carlsson P, Beckers J and Graw J: Pitx3 directly regulates
Foxe3 during early lens development. Int J Dev Biol. 57:741–751.
2013. View Article : Google Scholar : PubMed/NCBI
|
|
40
|
Chen Y, Hu Y, Zhou T, Zhou KK, Mott R, Wu
M, Boulton M, Lyons TJ, Gao G and Ma JX: Activation of the Wnt
pathway plays a pathogenic role in diabetic retinopathy in humans
and animal models. Am J Pathol. 175:2676–2685. 2009. View Article : Google Scholar : PubMed/NCBI
|
|
41
|
Grunewald E, Tew KD, Porteous DJ and
Thomson PA: Developmental expression of orphan G protein-coupled
receptor 50 in the mouse brain. ACS Chem Neurosci. 3:459–472. 2012.
View Article : Google Scholar : PubMed/NCBI
|
|
42
|
Smolich BD, Tarkington SK, Saha MS and
Grainger RM: Xenopus gamma-crystallin gene-expression: Evidence
that the gamma-crystallin gene family is transcribed in lens and
nonlens tissues. Mol Cell Biol. 14:1355–1363. 1994. View Article : Google Scholar : PubMed/NCBI
|
|
43
|
Head MW, Peter A and Clayton RM: Evidence
for the extralenticular expression of members of the
beta-crystallin gene family in the chick and a comparison with
delta-crystallin during differentiation and transdifferentiation.
Differentiation. 48:147–156. 1991. View Article : Google Scholar : PubMed/NCBI
|
|
44
|
Clayton RM, Jeanny JC, Bower DJ and
Errington LH: The presence of extralenticular crystallins and its
relationship with transdifferentiation to lens. Curr Top Dev Biol.
20:137–151. 1986. View Article : Google Scholar : PubMed/NCBI
|
|
45
|
Andley UP: Crystallins in the eye:
Function and pathology. Prog Retin Eye Res. 26:78–98. 2007.
View Article : Google Scholar
|
|
46
|
Losiewicz MK and Fort PE: Diabetes impairs
the neuroprotective properties of retinal alpha-crystallins. Invest
Ophthalmol Vis Sci. 52:5034–5042. 2011. View Article : Google Scholar : PubMed/NCBI
|
|
47
|
Heise EA, Marozas LM, Grafton SA, Green
KM, Kirwin SJ and Fort PE: Strain-independent increases of
crystallin proteins in the retina of type 1 diabetic rats. PLoS
One. 8:e825202013. View Article : Google Scholar : PubMed/NCBI
|
|
48
|
Kandpal RP, Rajasimha HK, Brooks MJ,
Nellissery J, Wan J, Qian J, Kern TS and Swaroop A: Transcriptome
analysis using next generation sequencing reveals molecular
signatures of diabetic retinopathy and efficacy of candidate drugs.
Mol Vis. 18:1123–1146. 2012.PubMed/NCBI
|
|
49
|
Fort PE, Freeman WM, Losiewicz MK, Singh
RS and Gardner TW: The retinal proteome in experimental diabetic
retinopathy: Up-regulation of crystallins and reversal by systemic
and periocular insulin. Mol Cell Proteomics. 8:767–779. 2009.
View Article : Google Scholar :
|
|
50
|
Yamamoto S, Yamashita A, Arakaki N, Nemoto
H and Yamazaki T: Prevention of aberrant protein aggregation by
anchoring the molecular chaperone αB-crystallin to the endoplasmic
reticulum. Biochem Biophys Res Commun. 455:241–245. 2014.
View Article : Google Scholar : PubMed/NCBI
|
|
51
|
Gologorsky D, Thanos A and Vavvas D:
Therapeutic interventions against inflammatory and angiogenic
mediators in proliferative diabetic retinopathy. Mediators Inflamm.
2012:6294522012. View Article : Google Scholar : PubMed/NCBI
|
|
52
|
Zhang W, Liu H, Rojas M, Caldwell RW and
Caldwell RB: Anti-inflammatory therapy for diabetic retinopathy.
Immunotherapy. 3:609–628. 2011. View Article : Google Scholar : PubMed/NCBI
|
|
53
|
King GL: The role of inflammatory
cytokines in diabetes and its complications. J Periodontol.
79:1527–1534. 2008. View Article : Google Scholar : PubMed/NCBI
|
|
54
|
Adamis AP: Is diabetic retinopathy an
inflammatory disease? Br J Ophthalmol. 86:363–365. 2002. View Article : Google Scholar : PubMed/NCBI
|
|
55
|
Martin PM, Roon P, Van Ells TK, Ganapathy
V and Smith SB: Death of retinal neurons in streptozotocin-induced
diabetic mice. Invest Ophthalmol Vis Sci. 45:3330–3336. 2004.
View Article : Google Scholar : PubMed/NCBI
|
|
56
|
Howell SJ, Mekhail MN, Azem R, Ward NL and
Kern TS: Degeneration of retinal ganglion cells in diabetic dogs
and mice: Relationship to glycemic control and retinal capillary
degeneration. Mol Vis. 19:1413–1421. 2013.PubMed/NCBI
|
|
57
|
Joussen AM, Poulaki V, Mitsiades N, Cai
WY, Suzuma I, Pak J, Ju ST, Rook SL, Esser P, Mitsiades CS, et al:
Suppression of Fas-FasL-induced endothelial cell apoptosis prevents
diabetic blood-retinal barrier breakdown in a model of
streptozotocin-induced diabetes. FASEB J. 17:76–78. 2003.
|
|
58
|
Golias C, Tsoutsi E, Matziridis A,
Makridis P, Batistatou A and Charalabopoulos K: Review. Leukocyte
and endothelial cell adhesion molecules in inflammation focusing on
inflammatory heart disease. In Vivo. 21:757–769. 2007.PubMed/NCBI
|
|
59
|
Ugurlu N, Gerceker S, Yülek F, Ugurlu B,
Sarı C, Baran P and Çağil N: The levels of the circulating cellular
adhesion molecules ICAM-1, VCAM-1 and endothelin-1 and the
flow-mediated vasodilatation values in patients with type 1
diabetes mellitus with early-stage diabetic retinopathy. Intern
Med. 52:2173–2178. 2013. View Article : Google Scholar : PubMed/NCBI
|
|
60
|
Adamiec J and Oficjalska-Mlynczak J:
Contribution of selected cellular adhesion molecules and
proinflammatory cytokines in the pathogenesis of proliferative
diabetic retinopathy. Przegl Lek. 64:389–392. 2007.In Polish.
|
|
61
|
Khalfaoui T, Lizard G, Beltaief O, Colin
D, Ben Hamida J, Errais K, Ammous I, Zbiba W, Tounsi L, Zhioua R,
et al: Immunohistochemical analysis of cellular adhesion molecules
(ICAM-1, VCAM-1) and VEGF in fibrovascular membranes of patients
with proliferative diabetic retinopathy: Preliminary study. Pathol
Biol (Paris). 57:513–517. 2009. View Article : Google Scholar
|
|
62
|
Graves DT and Kayal RA: Diabetic
complications and dysregulated innate immunity. Front Biosci.
13:1227–1239. 2008. View
Article : Google Scholar
|
|
63
|
Asnaghi V, Gerhardinger C, Hoehn T,
Adeboje A and Lorenzi M: A role for the polyol pathway in the early
neuroretinal apoptosis and glial changes induced by diabetes in the
rat. Diabetes. 52:506–511. 2003. View Article : Google Scholar : PubMed/NCBI
|