Introduction
Colorectal cancer (CRC) is one of the most commonly
diagnose types of cancer worldwide, and accounts for ~9.4% of all
malignancies (1). The most
effective treatment for CRC is surgery, however, ~60% of patients
who undergo curative resection experience local recurrence or
distant metastasis (2). Despite
advances in surgical techniques and chemotherapeutic options, the
survival rate of patients with CRC has not improved substantially,
and 20% of patients with CRC succumb to mortality from recurrence
of the disease (3). Thus, novel
and effective treatments are required to treat CRC. Among adjuvant
therapies, chemotherapy, including the use of oxaliplatin,
fluorouracil and leucovorin, has been an efficient strategy,
however, it remains incapable of preventing recurrence in all
patients (4). Therefore, targeting
tumor-associated proteins and inhibiting essential processes of the
tumor are being extensively investigated.
The proto-oncogene referred to as epidermal growth
factor receptor (EGFR) is a well-known tyrosine kinase growth
factor receptor (5). The EGFR
family includes four distinct receptors: HER1/EGFR/ErbB1,
HER2/ErbB2, HER3/ErbB3, and HER4/ErbB4, and their eight ligands:
Epidermal growth factor (EGF), transforming growth factor-α
(TGF-α), betacellulin (BTC), amphiregulin (AREG), epiregulin
(EREG), heparin-binding-EGF-like growth factor (HB-EGF), neuregulin
(NRG1) and NRG2 (5). Binding of a
ligand to its receptor and the subsequent receptor hetero- and
homo-dimerization leads to a phosphorylation cascade mediated via
tyrosine kinases (5). Therefore,
in addition to conventional treatments, EGFR family-targeted
monoclonal antibodies have been used to treat patients with
CRC.
Cetuximab and panitumumab, which are anti-ErbB1
monoclonal antibodies, are widely used in the treatment of CRC
(6–8). However, only 20% of patients respond
to anti-ErbB1 monotherapy (9).
K-ras is one of the downstream signaling molecules
of the EGFR family, and is one of the most frequently mutated
oncogenes, with K-ras mutations frequently found in various types
of tumor (10). Furthermore, upon
K-ras mutation, its downstream signaling pathway operates
independently of the EGFR family and its signaling activation by
ligands (11). The search for
predictive markers to improve clinical outcomes has identified that
the presence of a K-ras mutation predicts an adverse response,
which has led to routine K-ras assessments prior to anti-ErbB1
therapy (11). However, K-ras
mutations are present in only 30–40% of CRC tumors, and a
significant proportion of wild-type K-ras patients (50–65%) do not
respond to anti-ErbB1 therapy (9).
In addition, treatments for targets other than ErbB1 are not yet
available for CRC. ErbB2 is targeted by the monoclonal antibody
trastuzumab (Herceptin™) in breast cancer (12,13),
and therapeutic agents targeting ErbB3, including MM-121, AMG 888,
TK-A3, and TK-A4 are available, however, they are not used
clinically (14). A detailed
evaluation, describing the synchronous modulation of expression
between EGFR family receptors and their ligands, in terms of K-ras
mutations in CRC tissues, has not been reported.
Therefore, in the present study, the expression
profiles of the four EGFR family genes and their eight ligands were
examined in CRC tissues and in adjacent normal mucosa (ANM) tissues
from 122 patients using reverse transcription-quantitative
polymerase chain reaction (RT-qPCR) analysis. Furthermore, K-ras
gene mutations in CRC tissues were investigated, and the expression
of EGFR family genes and their ligands were compared between cases
of CRC exhibiting wild-type and mutant K-ras.
Materials and methods
Patients and samples
Tissue specimens were obtained from 122 patients (60
males and 62 females; 30–91 years old) who underwent resections for
CRC at Sagamihara National Hospital (Sagamihara, Japan) between
2010 and 2013 (Table I). As
control samples, resected specimens (5 mm3) were
obtained from the ANM at the margin of the CRC primary tumor (≥10
cm distance from the tumor). All specimens were confirmed as ANM or
CRC by a pathologist. The ANM specimens were further confirmed to
be free of cancer cells by the pathologist. The diameters of the
primary tumors, numbers of lymph nodes with metastases and
development of distant metastases were classified according to the
Union for International Cancer Control TNM staging system (15). The study procedures were approved
by the Research Ethical Committee of Sagamihara Hospital
(Sagamihara, Japan). Informed consent for the present study was
obtained from all patients and the patient's families prior to
commencement.
 | Table IClinicopathological characteristics
and percentages of K-ras mutations in patients with CRC. |
Table I
Clinicopathological characteristics
and percentages of K-ras mutations in patients with CRC.
| Clinicopathological
characteristic | Number of patients
(%) | Patients with
wild-type K-ras CRC (%) | Patients with
mutant K-ras CRC (%) |
|---|
| Total cases | 122 (100.0) | 77 (63.2) | 45 (36.8) |
| Gender | | | |
| Male | 60 (49.2) | 42 (70.0) | 18 (30.0) |
| Female | 62 (50.8) | 35 (56.5) | 27 (43.5) |
| Age (years) | | | |
| <65 | 35 (28.7) | 22 (62.9) | 13 (37.1) |
| ≥65 | 87 (71.3) | 55 (63.2) | 32 (36.8) |
| Site of tumor | | | |
| Rectum | 27 (22.1) | 17 (63.0) | 10 (37.0) |
| Sigmoid colon | 37 (30.3) | 24 (64.9) | 13 (35.1) |
| Descending
colon | 8 (6.6) | 6 (75.0) | 2 (25.0) |
| Transverse
colon | 11 (9.0) | 9 (81.8) | 2 (18.2) |
| Ascending
colon | 30 (24.6) | 16 (53.3) | 14 (46.7) |
| Cecum | 9 (7.4) | 5 (55.6) | 4 (44.4) |
| T stage | | | |
| pT1/T2 | 18 (14.8) | 10 (55.6) | 8 (44.4) |
| pT3/T4 | 104 (85.2) | 67 (64.4) | 37 (35.6) |
| N stage | | | |
| pN0 | 51 (41.8) | 37 (72.5) | 14 (27.5) |
| pN1–3 | 71 (58.2) | 40 (56.3) | 31 (43.7) |
| M stage | | | |
| M0 | 103 (84.4) | 64 (62.1) | 39 (37.9) |
| M1 | 19 (15.6) | 13 (68.4) | 6 (31.6) |
| Clinical stage | | | |
| I | 13 (10.7) | 9 (69.2) | 4 (30.8) |
| II | 38 (31.1) | 28 (73.7) | 10 (26.3) |
| III | 52 (42.6) | 27 (51.9) | 25 (48.1) |
| IV | 19 (15.6) | 13 (68.4) | 6 (31.6) |
Preparation of tissue specimens
Following surgery or biopsy, half of the ANM and CRC
specimens were immediately soaked in RNAlater® RNA
Stabilization Reagent (Qiagen, Hilden, Germany) and stored at −80°C
until performing RNA extraction. The other half were used for
pathological examinations.
RNA extraction and cDNA synthesis
The ANM and CRC specimens were homogenized in QIAzol
Lysis reagent with homogenizer beads (Qiagen) using a vortex-type
homogenizer (Shakeman 2; BioMedical Science, Co., Ltd., Tokyo,
Japan). Total RNA was extracted using an RNeasy® Lipid
Tissue kit (Qiagen). The quality and concentration of total RNA
were validated using an Agilent 2100 Bioanalyzer (Agilent
Technologies, Inc., Santa Clara, CA, USA). The freshly isolated
total RNA from the ANM and CRC tissues was converted into cDNA
using a PrimeScript™ RT Reagent kit (Takara Bio, Inc., Otsu,
Japan), according to the manufacturer's instructions.
RT-qPCR
RT-q-PCR was performed using a Bio-Rad CFX96 system
(Bio-Rad Laboratories, Inc., Hercules, CA, USA) according to the
manufacturer's instructions. The thermal cycling conditions were 30
sec at 95°C for one cycle, 50 cycles of 1 sec at 95°C and 5 sec at
60°C using the Bio-Rad CFX96 system (Bio-Rad Laboratories, Inc.).
Results were normalized to the expression of β-actin (ACTB) and the
absolute copy numbers of unknown samples were calculated by
comparing the threshold cycles with the corresponding standard
curve, based on the ΔΔCq method (16). Specific primers for the EGFR family
members (ErbB1, ErbB2, ErbB3 and ErbB4), EGFR ligands (EGF, TGF-α,
BTC, AREG, EREG, HB-EGF, NRG1 and NRG2) and housekeeping genes
(HKGs), including glycer-aldehyde-3-phosphate dehydrogenase
(GAPDH), hypoxanthine phosphoribosyltransferase (HPRT) and ACTB
were purchased from Takara Bio, Inc. (Table II).
| Table IIPrimer sequences used for reverse
transcription-quantitative polymerase chain reaction analysis. |
Table II
Primer sequences used for reverse
transcription-quantitative polymerase chain reaction analysis.
| Target | Forward primer
(5′-3′) | Reverse primer
(5′-3′) |
|---|
| GAPDH |
GCACCGTCAAGGCTGAGAAC |
ATGGTGGTGAAGACGCCAGT |
| HPRT |
GGCAGTATAATCCAAAGATGGTCAA |
GTCAAGGGCATATCCTACAACAAAC |
| ACTB |
TGGCACCCAGCACAATGAA |
CTAAGTCATAGTCCGCCTAGAAGCA |
| ErbB1 |
GGTGCGAATGACAGTAGCATTATGA |
AAAGGTGGGCTCCTAACTAGCTGAA |
| ErbB2 |
CAGGCACCGCAGCTCATCTA |
TCCCAGGTCACCATCAAATACATC |
| ErbB3 |
CCCAGCATCTGAGCAAGGGTA |
TTTAGGCGGGCATAATGGACA |
| ErbB4 |
TGATAGGCCGTTGGTTGTCTGA |
CCAGGTAGACATACCCAATCCAGTG |
| EGF |
CAACCAGTGGCTGGTGAGGA |
GAGCCCTTATCACTGGATACTGGAA |
| TGF-α |
AGATAGACAGCAGCCAACCCTGA |
CTAGGGCCATTCTGCCCATC |
| BTC |
CTTCACTGTGTGGTGGCAGATG |
ATGCAGTAATGCTTGTATTGCTTGG |
| AREG |
GTGGTGCTGTCGCTCTTGATACTC |
TCAAATCCATCAGCACTGTGGTC |
| EREG |
GTGATTCCATCATGTATCCCAGGAG |
AGATGCACTGTCCATGCAAACAA |
| HB-EGF |
GGGCATGACTAATTCCCACTGA |
GCCCAATCCTAGACGGCAAC |
| NRG1 |
TCGGTGTGAAACCAGTTCTGAATA |
TCTCCAGAATCAGCCAGTGATG |
| NRG2 |
ACCCTAGGCTTGGAGCTGGA |
CCATTCGGGTAGCTGTGTCTTTATC |
The amplified products were cloned into the
pGEM®-T Easy Vector system (Promega Corporation,
Madison, WI, USA). The same plasmid was linearized by enzymatic
digestion at 37°C for 2 h (Not I; Takara Bio, Inc.) and used as a
quantification standard. The sequences were confirmed by DNA
sequencing using a CEQ8000 Genetic Analysis System (Beckman
Coulter, Fullerton, CA, USA). The quality and concentration of the
quantification standard were validated using the Agilent 2100
Bioanalyzer. The qPCR reaction mixture consisted of 5 µl
SsoFast™ EvaGreen® Supermix (Bio-Rad Laboratories,
Inc.), 3.5 µl RNase/DNase-free water, 0.5 µl 5
µM primer mix and 1 µl cDNA in a final volume of 10
µl. The cycle number for RT-qPCR was 50. All experiments
were performed in duplicate.
Genomic DNA extraction and K-ras mutation
analysis
Genomic DNA was extracted from 500 mg of the samples
using a Quick Gene DNA tissue kit (Kurabo, Osaka, Japan). Mutations
in K-ras codons 12 and 13 were detected using a multiplex
PCR-Luminex method-based MEBGEN Mutation kit (Medical and
Biological Laboratories, Nagoya, Japan) according to the
manufacturer's instructions.
Statistical analyses
To compare expression levels in the ANM and CRC
tissues, Mann-Whitney U and Wilcoxon signed-rank tests were used.
All statistical analyses were performed using Prism5 for Windows
(GraphPad Software, Inc, San Diego, CA, USA). Data are presented as
the mean values. P<0.05 was considered to indicate a
statistically significant difference.
Results
Selection of appropriate HKGs in ANM and
CRC tissues
The present investigated the mRNA levels of three
HKGs in the ANM and CRC tissues using RT-qPCR (Table III). The copy numbers in the
experiments were compared using 1 µg total RNA. The mRNA
expression levels of ACTB were similar in the ANM and CRC tissues
(P=0.957). By contrast, the mRNA expression levels of GAPDH and
HPRT were significantly increased in the CRC tissues, compared with
those in the ANM tissues (P<0.001). Therefore, ACTB was selected
as the internal standard gene in the present study. The calculated
copy numbers were normalized based on the copy numbers of ACTB.
| Table IIIComparisons of the expression levels
of HKGs between ANM and CRC tissues. |
Table III
Comparisons of the expression levels
of HKGs between ANM and CRC tissues.
| HKG | ANM | CRC | P-value |
|---|
| GAPDH
(×106) | 11.4±3.46 | 21.1±4.30 | <0.001 |
| HPRT
(×104) | 28.7±7.48 | 76.7±1.91 | <0.001 |
| ACTB
(×106) | 19.7±8.91 | 20.3±8.29 |
0.957 |
Gene expression profiles of EGFR family
members and their ligands in ANM and CRC tissues
The present study determined the mRNA expression
levels of EGFR family members and their ligands in the ANM and CRC
tissues using RT-qPCR (Fig. 1).
Among the EGFR family members, the mRNA level of ErbB2 was the
highest (Fig. 1A). The mRNA
expression levels of ErbB1 and ErbB3 were approximately half of the
mRNA expression level of ErbB2. In addition, low expression levels
of ErbB4 were observed in the CRC and ANM tissues. The mRNA
expression levels of ErbB3 were significantly increased in the CRC
tissues, compared with those in the ANM tissues (P<0.005),
whereas the mRNA expression levels of ErbB1 were significantly
decreased in the CRC tissues, compared with those in the ANM
tissues (P<0.005). No significant differences were observed in
the expression levels of ErbB2 and ErbB4 between the ANM and CRC
tissues.
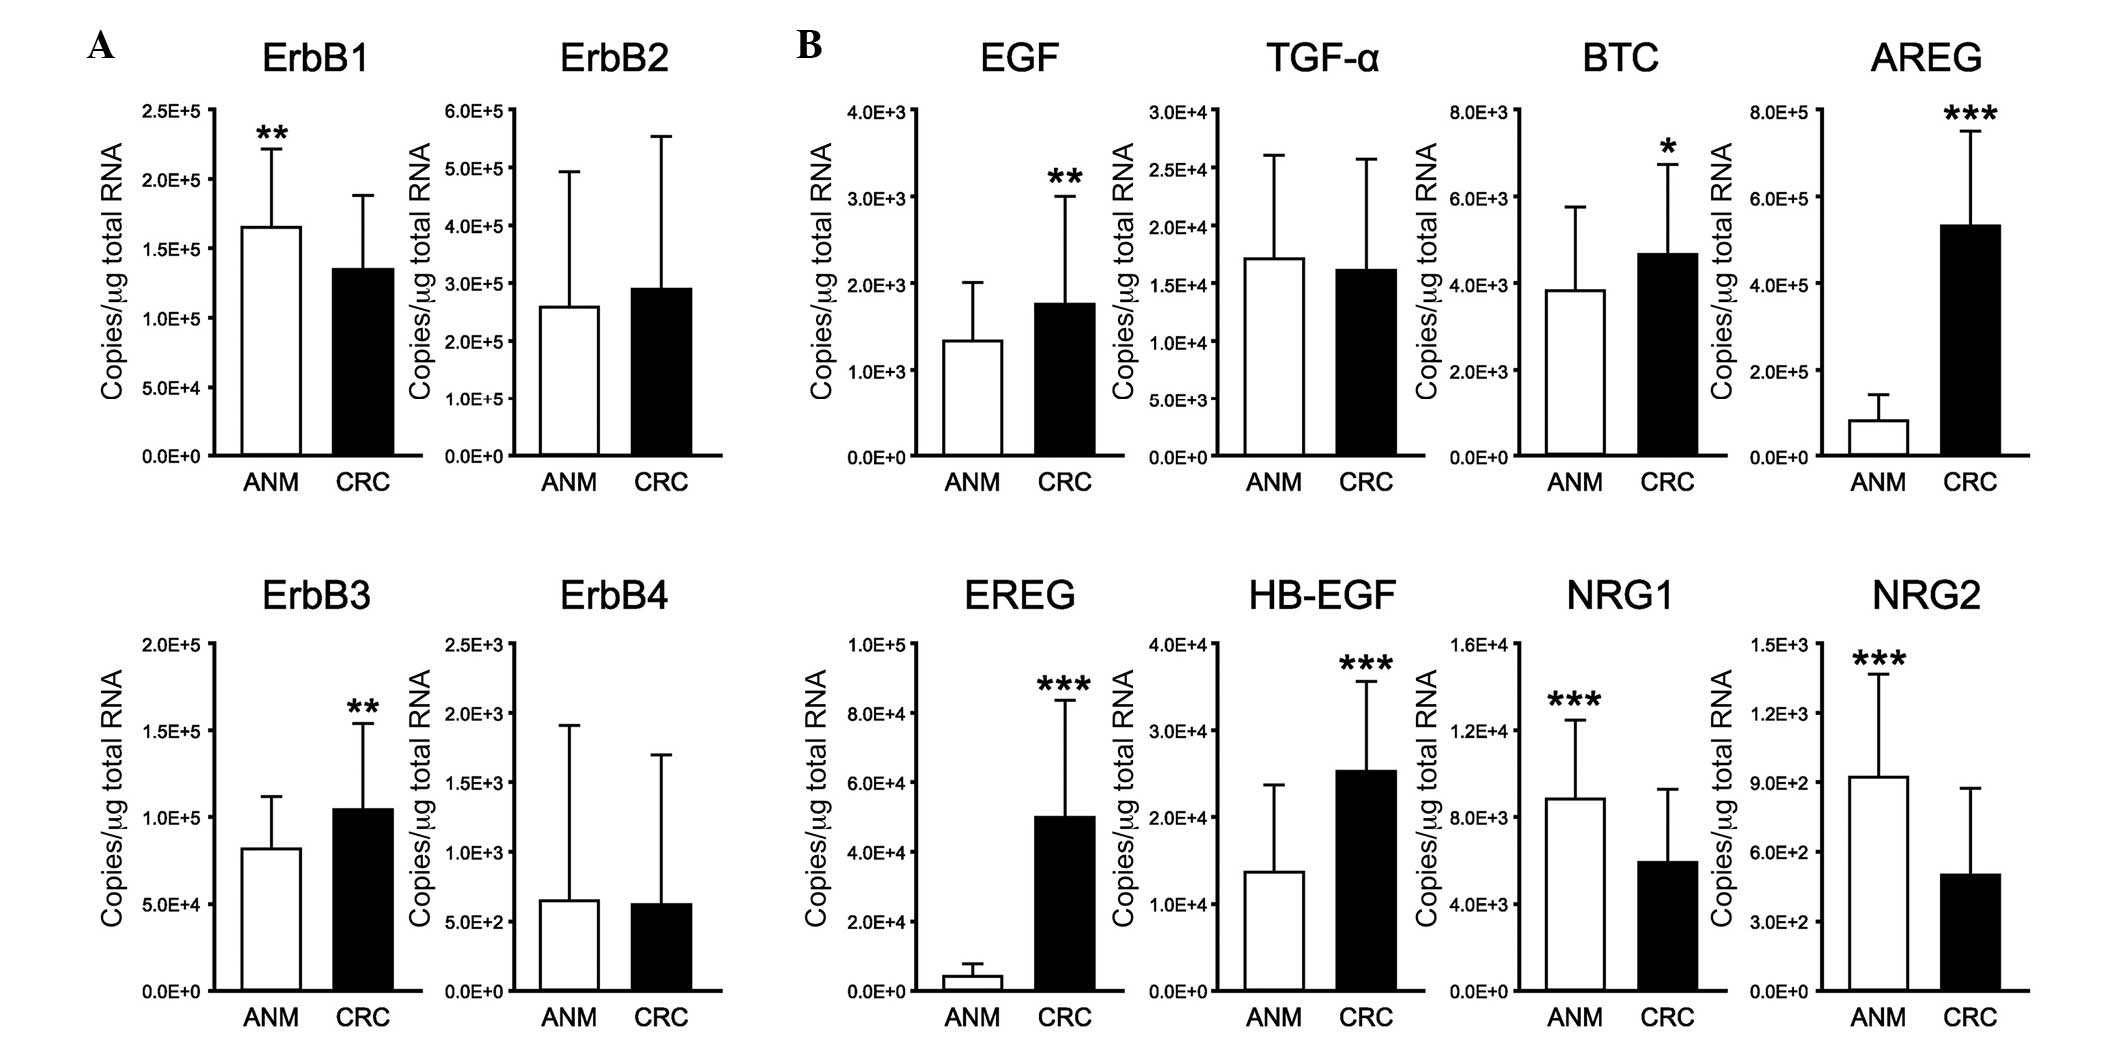 | Figure 1Gene expression profiles of EGFR
family members and their ligands in ANM and CRC tissues. mRNA
expression levels of (A) EGFR family members and their (B) ligands
in ANM and CRC tissues were examined using reverse
transcription-quantitative polymerase chain reaction. The ACTB gene
was used as an internal control. All experiments were performed in
duplicate. Data are presented as the mean ± standard deviation
(n=122). *P<0.05, **P<0.005 and
***P<0.001 (Wilcoxon signed-rank test). (A) mRNA
levels of ErbB3 were significantly increased in CRC tissues,
compared with ANM tissues, whereas mRNA expression levels of ErbB1
were significantly decreased in CRC tissues, compared with those in
ANM tissues. The mRNA expression level of ErbB2 exhibited the
highest level of expression among the EGFR family members in the
ANM and CRC tissues. (B) mRNA expression levels of EGF, BTC, AREG,
EREG and HB-EGF were increased significantly in the CRC tissues,
compared with those in the ANM tissues, whereas the mRNA expression
levels of NRG1 and NRG2 were decreased significantly in the CRC
tissues, compared with those in the ANM tissues. EGFR, epidermal
growth factor receptor; ANM, adjacent normal mucosa; CRC,
colorectal cancer; EGF, epidermal growth factor; TGF-α,
transforming growth factor-α; BTC, betacellulin; AREG,
amphiregulin; EREG, epiregulin; HB-EGF, heparin-binding-EGF-like
growth factor; NRG, neuregulin. |
Among the EGFR family ligands, the mRNA expression
levels of EGF, BTC, AREG, EREG and HB-EGF were significantly
increased in the CRC tissues, compared with those in the ANM
tissues (P<0.005, P<0.05, P<0.001, P<0.001 and
P<0.001, respectively), and the mRNA expression levels of NRG1
and NRG2 were significantly decreased in the CRC tissues, compared
with those in the ANM tissues (P<0.001; Fig. 1B). However, no difference was
observed in the expression levels of TGF-α between the ANM and CRC
tissues.
Detection of K-ras mutations in CRC
tissues
The present study subsequently evaluated the genomic
DNA from the tumor specimens for mutations in the K-ras gene
(Table I). Mutations in K-ras
codons 12 and 13 were detected in 45 of the 122 (36.8%) samples.
Comparisons of the K-ras mutations and clinicopathological
characteristics revealed that the mutation rate was higher in
females than in males. In terms of the tumor site, K-ras mutation
rates were higher in the ascending colon and cecum, and lower in
the descending colon and transverse colon. The pT1/T2 T stage,
pN1-3 N stage and clinical stage III groups exhibited K-ras
mutation rates of >40%.
Gene expression profiles of EGFR family
members and their ligands in CRC tissues with wild-type and mutant
K-ras
The present study determined the mRNA expression
levels of EGFR family members and their ligands in CRC tissues
exhibiting wild-type or mutant K-ras using RT-qPCR (Fig. 2). The mRNA expression levels of
ErbB1, ErbB2 and ErbB3, but not ErbB4, were significantly decreased
in the mutant K-ras group, compared with those in the wild-type
K-ras group (P<0.05; Fig. 2A).
Notably, the expression levels of the ErbB1-binding ligands (BTC,
AREG and EREG) and ErbB3-binding ligands (NRG1 and NRG2) were
significantly decreased in the mutant K-ras group, compared with
those in the wild-type K-ras group (P<0.05, P<0.005,
P<0.005, P<0.005 and P<0.05, respectively; Fig. 2B). By contrast, no significant
differences in the expression levels of EGF, TGF-α or HB-EGF were
observed between the mutant and wild-type K-ras groups.
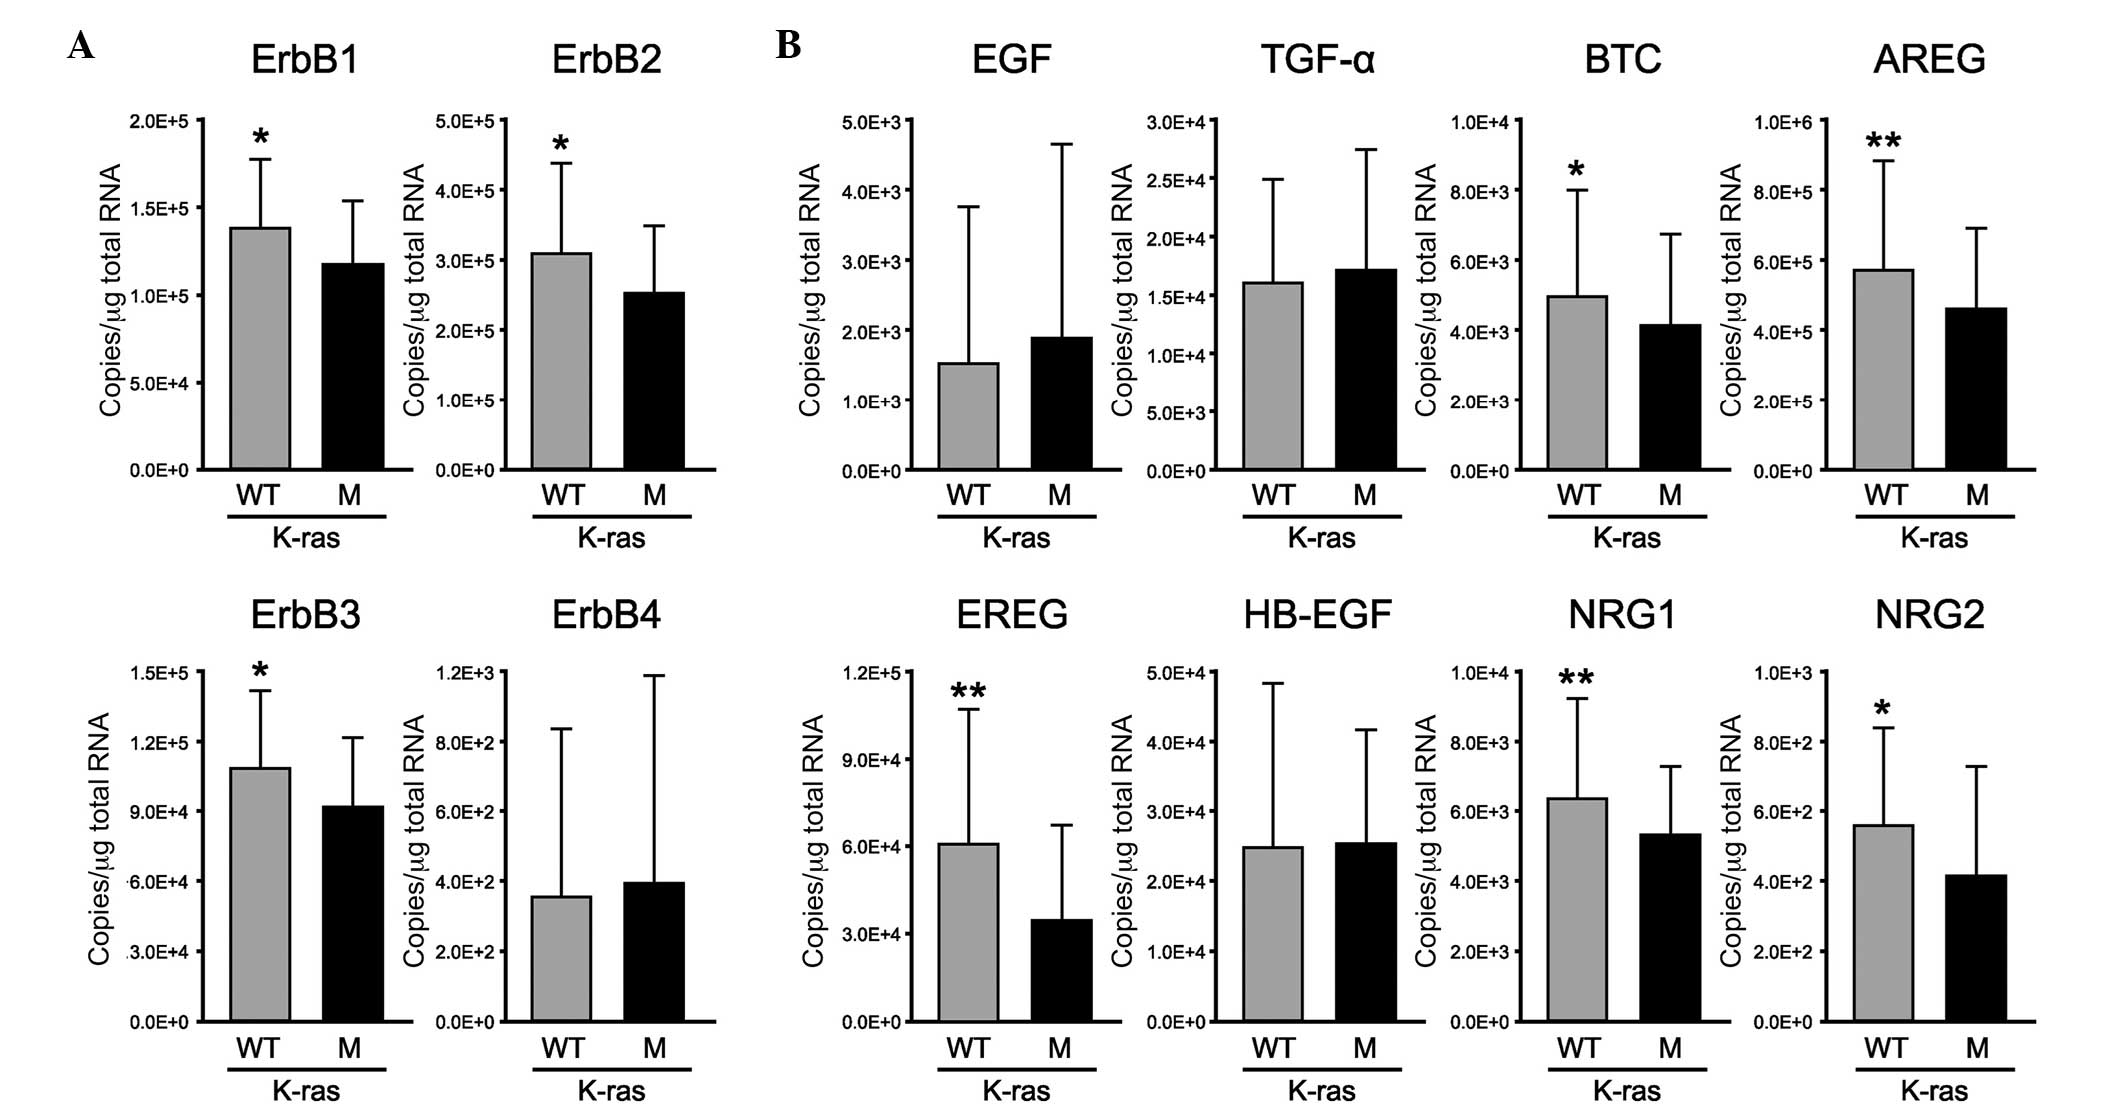 | Figure 2Gene expression profiles of EGFR
family members and their ligands in CRC tissues with wild-type or
mutant K-Ras. In the colorectal cancer tissues, the mRNA expression
levels of (A) EGFR family members and their (B) ligands in the
wild-type K-ras (gray; n=77) and mutant K-ras group (black; n=45)
were measured using reverse transcription-quantitative polymerase
chain reaction. The ACTB gene was used as an internal control. All
experiments were performed in duplicate. Data are presented as the
mean ± standard deviation. *P<0.05 and
**P<0.005 (Mann-Whitney U-test). (A) Expression
levels of ErbB1, ErbB2 and ErbB3 were significantly decreased in
the mutant K-ras group, compared with the wild-type K-ras group.
(B) Expression levels of the ErbB1-binding ligands (BTC, AREG and
EREG) and ErbB3-binding ligands (NRG1 and NRG2) were significantly
decreased in the mutant K-ras group, compared with the wild-type
K-ras group. EGFR, epidermal growth factor receptor; EGF, epidermal
growth factor; TGF-α, transforming growth factor-α; BTC,
betacellulin; AREG, amphiregulin; EREG, epiregulin; HB-EGF,
heparin-binding-EGF-like growth factor; NRG, neuregulin; WT,
wild-type; M, mutant. |
Discussion
In the present study, the mRNA expression levels of
the four EGFR family members and their eight ligands were analyzed
in tissue specimens from 122 patients with CRC using RT-qPCR. To
perform accurate analyses, the present study first compared the
mRNA levels of three HKGs (GAPDH, HPRT and ACTB), between the ANM
and CRC tissues. Certain studies have reported that the expression
levels of HKGs under hypoxic conditions vary widely (17–19).
Zhong and Simons reported that mRNA expression levels of GAPDH in
cell lines are increased by 21.2–75.1% under hypoxic conditions
(20). In HKG comparison study of
a large panel of cancer types, HPRT was suggested as the single
optimal reference gene (21).
Another report suggested that ACTB is the most stable gene in
diabetic glomeruli and primary mesangial cells (22). In the present study, the expression
levels of ACTB were almost equal in the ANM and CRC tissues.
However, compared with the ANM tissues, >2-fold increases in the
expression levels of GAPDH and HPRT were observed in the CRC
tissues. Therefore, these results suggested that ACTB was the most
suitable HKG for the analyses of patients with CRC in the presnt
study.
Overexpression of EGFR family members has been
associated with malignant transformation, as well as poor clinical
outcomes in CRC (23). ErbB1 is
overexpressed in patients with CRC (24), and high expression levels of ErbB3
have been observed in 70% of primary CRC tumors (25). In the present study, the mRNA
expression levels of ErbB3 were signifi-cantly increased in CRC
tissues, compared with those in ANM tissues, whereas the mRNA
expression levels of ErbB1 were significantly decreased in CRC
tissues, compared with those in ANM tissues. Koenders et al
reported similar results of low expression levels of ErbB1 in CRC
tissues, and concluded that the lower ErbB1 content in CRC is
caused by downregulation of the receptor by a locally produced
ligand (26). In the present
study, the expression levels of the EGFR ligands exhibited opposing
trends to their corresponding receptors, including EGF, BTC, AREG,
EREG and HB-EGF, which were increased, and NRG1 and NRG2, which
were decreased in the CRC tissues, compared with those in the AMN
tissues. Taken together, the expression levels of EGFR family
members and their ligands were altered between the ANM and CRC
tissues.
To perform a detailed evaluation of the expression
of EGFR in CRC, determination of K-ras gene mutations is important,
as mutation of K-ras leads to the downstream signaling pathway
operating independently of the EGFR family and its signaling
activation by ligands. Previous studies have concluded that K-ras
mutations lead to poor survival rates in patients, particularly
following treatment with anti-ErbB1 antibodies and chemotherapy
(27,28). Therefore, the present study
evaluated genomic DNA from tumor specimens for mutations in the
K-ras gene, and compared the findings with the clinicopathological
characteristics of the patients to investigate the function of the
EGFR family in CRC. In total, 45 mutations (36.8%) were found in
the 122 samples, including common mutations in codons 12 and 13. In
a previous cohort study, 37% (271/737) of patients with CRC were
found to have mutations in codons 12 and 13 in the K-ras gene
(29). Taback et al also
reported that mutation of the K-ras allele at codons 12 or 13
occurred in 42% (30/72) of paraffin-embedded primary CRC tissues
from a cohort of patients (30).
Therefore, the incidence of K-ras mutations in the present study
was concordant with those reported in previous studies of European
and American patients. Comparisons of K-ras mutations with the
clinicopathological characteristics revealed that the mutation rate
was >10% higher at clinical stage III, compared with the total
mean. Yunxia et al reported only tumor differentiation as
potentially correlated with K-ras mutations (31), whereas another study suggested no
correlation with clinicopathological parameters (32). In the present study, although no
significant correlation between K-ras mutations and
clinicopathological characteristics were identified, further
investigations with a larger sample size are required.
Based on the K-ras mutations, the present study
analyzed the expression levels of EGFR family members and their
ligands in the CRC tissues. With the exception of ErbB4, the
expression levels of EGFRs were decreased significantly in the
mutant K-ras group, compared with those in the wild-type K-ras
group, and the expression pattern of the ligands exhibited a
similar trend. These results suggested enhancement of EGFR
signaling without the expression of EGFR ligands in the patients
with CRC and K-ras mutations. Furthermore, these results indicated
that tumorigenesis of CRC with wild-type K-ras was mediated, not
only ErbB1, but also by ErbB2 and ErbB3. In particular, although
ErbB2 does not bind to any of the ErbB ligands, its expression
levels in the present study were different between the wild-type
and mutant K-ras groups. Therefore, it is possible that ErbB2
activates tumorigenesis as a heterodimer and not a homodimer.
Another report suggested this possibility and found that the
ErbB2-ErbB3 heterodimer is the most potent ErbB pair, with respect
to the strength of the interaction, ligand-induced tyrosine
phosphorylation and downstream signaling, and functions as an
oncogenic unit (33,34). Using ErbB3 knockdown mice, Lee
et al demonstrated that ErbB3 is essential in supporting
intestinal tumorigenesis, and suggested that ErbB3 may be a
promising target for the treatment of CRC (35). Trastuzumab is already used for the
treatment of ErbB2-overexpressing breast cancer, which binds to a
ErbB2 region that is not involved with receptor dimerization
(36). However, clinical
application has not been assessed in CRC patients due to the lack
of clinical proof-of-concept (14). The results of the present study
suggested that the most effective strategy to specifically target
ErbB1, and also ErbB2 and ErbB3 is monoclonal antibody
treatment.
In conclusion, the present study analyzed the
expression profiles of the four EGFR family members and their eight
ligands in ANM and CRC tissues of 122 patients using RT-qPCR. In
addition, K-ras mutation analyses were performed. The results
demonstrated that the expression levels of ErbB1, ErbB2, ErbB3,
BTC, AREG, EREG, NRG1 and NRG2 were significantly decreased in the
mutant K-ras group, compared with those in the wild-type K-ras
group. Therefore, the results suggested that the enhancement of
tumorigenesis was activated not only by ErbB1, but also by ErbB2
and ErbB3. The mRNA expression levels of ErbB3 were significantly
increased in the CRC tissues, compared with those in the ANM
tissues, whereas those of ErbB1 were significantly decreased in the
CRC tissues, compared with those in the ANM tissues. Together these
observations likely suggest that all ErbB2, ErbB3 and ErbB1 could
be potential targets for the treatment of CRC.
Acknowledgments
This study was supported by Chugai Pharmaceutical
Co., Ltd. (Toyko, Japan), Takeda Pharmaceutical Co., Ltd. (Osaka,
Japan) and Yenxakult Honsha Co., Ltd. (Tokyo, Japan).
Abbreviations:
|
CRC
|
colorectal cancer
|
|
ANM
|
adjacent normal mucosa
|
|
EGFR
|
epidermal growth factor receptor
|
|
RT-qPCR
|
reverse transcription-quantitative
polymerase chain reaction
|
|
EGF
|
epidermal growth factor
|
|
TGF-α
|
transforming growth factor-α
|
|
BTC
|
betacellulin
|
|
AREG
|
amphiregulin
|
|
EREG
|
epiregulin
|
|
HB-EGF
|
heparin-binding-EGF-like growth
factor
|
|
NRG
|
neuregulin
|
|
GAPDH
|
glyceraldehyde-3-phosphate
dehydrogenase
|
|
HPRT
|
hypoxanthine phosphoribosyl
transferase
|
|
ACTB
|
β-actin
|
References
|
1
|
Siegel R, Ma J, Zou Z and Jemal A: Cancer
statistics 2014. CA Cancer J Clin. 64:9–29. 2014. View Article : Google Scholar : PubMed/NCBI
|
|
2
|
Andre N and Schmiegel W: Chemoradiotherapy
for colorectal cancer. Gut. 54:1194–1202. 2005. View Article : Google Scholar : PubMed/NCBI
|
|
3
|
Jemal A, Siegel R, Ward E, Hao Y, Xu J and
Thun MJ: Cancer statistics, 2009. CA Cancer J Clin. 59:225–249.
2009. View Article : Google Scholar : PubMed/NCBI
|
|
4
|
André T, Boni C, Mounedji-Boudiaf L,
Navarro M, Tabernero J, Hickish T, Topham C, Zaninelli M, Clingan
P, Bridgewater J, et al: Oxaliplatin, fluorouracil, and leucovorin
as adjuvant treatment for colon cancer. N Engl J Med.
350:2343–2351. 2004. View Article : Google Scholar : PubMed/NCBI
|
|
5
|
Carpenter G and Cohen S: Epidermal growth
factor. J Biol Chem. 265:7709–7712. 1990.PubMed/NCBI
|
|
6
|
Douillard JY, Siena S, Cassidy J,
Tabernero J, Burkes R, Barugel M, Humblet Y, Bodoky G, Cunningham
D, Jassem J, et al: Randomized, phase III trial of panitumumab with
infusional fluorouracil, leucovorin and oxaliplatin (FOLFOX4)
versus FOLFOX4 alone as first-line treatment in patients with
previously untreated metastatic colorectal cancer: The PRIME study.
J Clin Oncol. 28:4697–4705. 2010. View Article : Google Scholar : PubMed/NCBI
|
|
7
|
Lacouture ME, Mitchell EP, Piperdi B,
Pillai MV, Shearer H, Iannotti N, Xu F and Yassine M: Skin toxicity
evaluation protocol with panitumumab (STEPP), a phase II,
open-label, randomized trial evaluating the impact of a pre-emptive
skin treatment regimen on skin toxicities and quality of life in
patients with metastatic colorectal cancer. J Clin Oncol.
28:1351–1357. 2010. View Article : Google Scholar : PubMed/NCBI
|
|
8
|
Peeters M, Price TJ, Cervantes A, Sobrero
AF, Ducreux M, Hotko Y, André T, Chan E, Lordick F, Punt CJ, et al:
Randomized phase III study of panitumumab with fluorouracil,
leucovorin and irinotecan (FOLFIRI) compared with FOLFIRI alone as
second-line treatment in patients with metastatic colorectal
cancer. J Clin Oncol. 28:4706–4713. 2010. View Article : Google Scholar : PubMed/NCBI
|
|
9
|
De Roock W, De Vriendt V, Normanno N,
Ciardiello F and Tejpar S: KRAS, BRAF, PIK3CA and PTEN mutations:
Implications for targeted therapies in metastatic colorectal
cancer. Lancet Oncol. 12:594–603. 2011. View Article : Google Scholar
|
|
10
|
Adjei AA: K-ras as a target for lung
cancer therapy. J Thorac Oncol. 3(6 Suppl 2): S160–S163. 2008.
View Article : Google Scholar : PubMed/NCBI
|
|
11
|
Messersmith WA and Ahnen DJ: Targeting
EGFR in colorectal cancer. N Engl J Med. 359:1834–1836. 2008.
View Article : Google Scholar : PubMed/NCBI
|
|
12
|
Sadeghi S, Olevsky O and Hurvitz SA:
Profiling and targeting HER2-positive breast cancer using
trastuzumab emtansine. Pharmgenomics Pers Med. 7:329–338.
2014.PubMed/NCBI
|
|
13
|
Shak S: Overview of the trastuzumab
(Herceptin) anti-HER2 monoclonal antibody clinical program in
HER2-overexpressing metastatic breast cancer. Herceptin
multinational investigator study group. Semin Oncol. 26(4 Suppl
12): S71–S77. 1999.
|
|
14
|
Aurisicchio L, Marra E, Roscilli G,
Mancini R and Ciliberto G: The promise of anti-ErbB3 monoclonals as
new cancer therapeutics. Oncotarget. 3:744–758. 2012. View Article : Google Scholar : PubMed/NCBI
|
|
15
|
Mehta SP, Jose P, Mirza A, Pritchard SA,
Hayden JD and Grabsch HI: Comparison of the prognostic value of the
6th and 7th editions of the Union for International Cancer Control
TNM staging system in patients with lower esophageal cancer
undergoing neoadjuvant chemotherapy followed by surgery. Dis
Esophagus. 26:182–188. 2013. View Article : Google Scholar
|
|
16
|
Bustin SA, Benes V, Garson JA, Hellemans
J, Huggett J, Kubista M, Mueller R, Nolan T, Pfaffl MW, Shipley GL,
et al: The MIQE guidelines: Minimum information for publication of
quantitative real-time PCR experiments. Clin Chem. 55:611–622.
2009. View Article : Google Scholar : PubMed/NCBI
|
|
17
|
Caradec J, Sirab N, Keumeugni C, Moutereau
S, Chimingqi M, Matar C, Revaud D, Bah M, Manivet P, Conti M and
Loric S: 'Desperate house genes': The dramatic example of hypoxia.
Br J Cancer. 102:1037–1043. 2010. View Article : Google Scholar : PubMed/NCBI
|
|
18
|
Schmittgen TD and Zakrajsek BA: Effect of
experimental treatment on housekeeping gene expression: Validation
by real-time, quantitative RT-PCR. J Biochem Biophys Methods.
46:69–81. 2000. View Article : Google Scholar : PubMed/NCBI
|
|
19
|
Lupberger J, Kreuzer KA, Baskaynak G,
Peters UR, le Coutre P and Schmidt CA: Quantitative analysis of
beta-actin, beta-2-microglobulin and porphobilinogen deaminase mRNA
and their comparison as control transcripts for RT-PCR. Mol Cell
Probes. 16:25–30. 2002. View Article : Google Scholar : PubMed/NCBI
|
|
20
|
Zhong H and Simons JW: Direct comparison
of GAPDH, beta-actin, cyclophilin and 28S rRNA as internal
standards for quantifying RNA levels under hypoxia. Biochem Biophys
Res Commun. 259:523–526. 1999. View Article : Google Scholar : PubMed/NCBI
|
|
21
|
de Kok JB, Roelofs RW, Giesendorf BA,
Pennings JL, Waas ET, Feuth T, Swinkels DW and Span PN:
Normalization of gene expression measurements in tumor tissues:
Comparison of 13 endogenous control genes. Lab Invest. 85:154–159.
2005. View Article : Google Scholar
|
|
22
|
Biederman J, Yee J and Cortes P:
Validation of internal control genes for gene expression analysis
in diabetic glomerulosclerosis. Kidney Int. 66:2308–2314. 2004.
View Article : Google Scholar : PubMed/NCBI
|
|
23
|
Yarom N and Jonker DJ: The role of the
epidermal growth factor receptor in the mechanism and treatment of
colorectal cancer. Discov Med. 11:95–105. 2011.PubMed/NCBI
|
|
24
|
Spano JP, Lagorce C, Atlan D, Milano G,
Domont J, Benamouzig R, Attar A, Benichou J, Martin A, Morere JF,
et al: Impact of EGFR expression on colorectal cancer patient
prognosis and survival. Ann Oncol. 16:102–108. 2005. View Article : Google Scholar
|
|
25
|
Lédel F, Hallström M, Ragnhammar P,
Öhrling K and Edler D: HER3 expression in patients with primary
colorectal cancer and corresponding lymph node metastases related
to clinical outcome. Eur J Cancer. 50:656–662. 2014. View Article : Google Scholar
|
|
26
|
Koenders PG, Peters WH, Wobbes T, Beex LV,
Nagengast FM and Benraad TJ: Epidermal growth factor receptor
levels are lower in carcinomatous than in normal colorectal tissue.
Br J Cancer. 65:189–192. 1992. View Article : Google Scholar : PubMed/NCBI
|
|
27
|
Lievre A, Bachet JB, Boige V, Cayre A, Le
Corre D, Buc E, Ychou M, Bouché O, Landi B, Louvet C, et al: KRAS
mutations as an independent prognostic factor in patients with
advanced colorectal cancer treated with cetuximab. J Clin Oncol.
26:374–379. 2008. View Article : Google Scholar : PubMed/NCBI
|
|
28
|
Andreyev J and Cunningham D: Markers,
markers everywhere. Prognosis in colorectal cancer-time for a new
approach. J Clin Oncol. 19:286–288. 2001.PubMed/NCBI
|
|
29
|
Brink M, de Goeij AF, Weijenberg MP,
Roemen GM, Lentjes MH, Pachen MM, Smits KM, de Bruïne AP, Goldbohm
RA and van den Brandt PA: K-ras oncogene mutations in sporadic
colorectal cancer in the Netherlands cohort study. Carcinogenesis.
24:703–710. 2003. View Article : Google Scholar : PubMed/NCBI
|
|
30
|
Taback B, Bilchik AJ, Saha S, Nakayama T,
Wiese DA, Turner RR, Kuo CT and Hoon DS: Peptide nucleic acid clamp
PCR: A novel K-ras mutation detection assay for colorectal cancer
microme-tastases in lymph nodes. Int J Cancer. 111:409–414. 2004.
View Article : Google Scholar : PubMed/NCBI
|
|
31
|
Yunxia Z, Jun C, Guanshan Z, Yachao L,
Xueke Z and Jin L: Mutations in epidermal growth factor receptor
and K-ras in Chinese patients with colorectal cancer. BMC Med
Genet. 11:342010. View Article : Google Scholar : PubMed/NCBI
|
|
32
|
Bazan V, Migliavacca M, Zanna I, Tubiolo
C, Grassi N, Latteri MA, La Farina M, Albanese I, Dardanoni G,
Salerno S, et al: Specific codon 13 K-ras mutations are predictive
of clinical outcome in colorectal cancer patients, whereas codon 12
K-ras mutations are associated with mucinous histotype. Ann Oncol.
13:1438–1446. 2002. View Article : Google Scholar : PubMed/NCBI
|
|
33
|
Tzahar E, Waterman H, Chen X, Levkowitz G,
Karunagaran D, Lavi S, Ratzkin BJ and Yarden Y: A hierarchical
network of interreceptor interactions determines signal
transduction by Neu differentiation factor/neuregulin and epidermal
growth factor. Mol Cell Biol. 16:5276–5287. 1996. View Article : Google Scholar : PubMed/NCBI
|
|
34
|
Pinkas-Kramarski R, Soussan L, Waterman H,
Levkowitz G, Alroy I, Klapper L, Lavi S, Seger R, Ratzkin BJ, Sela
M and Yarden Y: Diversification of Neu differentiation factor and
epidermal growth factor signaling by combinatorial receptor
interactions. Embo J. 15:2452–2467. 1996.PubMed/NCBI
|
|
35
|
Lee D, Yu M, Lee E, Kim H, Yang Y, Kim K,
Pannicia C, Kurie JM and Threadgill DW: Tumor-specific apoptosis
caused by deletion of the ERBB3 pseudo-kinase in mouse intestinal
epithelium. J Clin Invest. 119:2702–2713. 2009. View Article : Google Scholar : PubMed/NCBI
|
|
36
|
Cho HS, Mason K, Ramyar KX, Stanley AM,
Gabelli SB, Denney DW Jr and Leahy DJ: Structure of the
extracellular region of HER2 alone and in complex with the
herceptin fab. Nature. 421:756–760. 2003. View Article : Google Scholar : PubMed/NCBI
|


