Introduction
Fms-like tyrosine kinase 3 (FLT3) is expressed in
hematopoietic progenitor cells. In acute myeloid leukemia (AML),
its most frequent mutation is an internal tandem duplication
(FLT3/ITD), which has a prevalence of 30–35% (1). FLT3/ITD is a critical prognostic
factor for patients with AML. Compared with carriers of wild-type
FLT3, patients with the FLT3/ITD mutation have shorter overall
survival time and disease-free survival time (2). Early diagnosis of FLT3/ITD allows for
timely treatment of AML and thus benefits the clinical outcome.
Certain achievements have been made in revealing the
role of the FLT3/ITD mutation in AML and several feature genes
associated with the FLT3/ITD mutation have been identified. Chen
et al (3) reported that
signaling associated with the FLT3/ITD mutation includes the
suppression of SHP-1. Furthermore, aberrant expression of CD7 in
myeloblasts has been found to be highly associated with the
FLT3/ITD mutation in AML (4).
Okamoto et al (5) indicated
that Lyn, an important component of the signal transduction pathway
specific for FLT3/ITD, may be utilized as a therapeutic target for
the treatment of AML in carriers of the FLT3/ITD mutation.
Furthermore, PIM1, a serine/threonine kinase, has been found to be
upregulated in FLT3-ITD mutation-positive AML and may be involved
in FLT3-mediated leukemogenesis (6). Dalal et al (7) reported that CD56 can predict the
presence of the FLT3-ITD mutation in AML.
In order to distinguish the FLT3/ITD mutation from
the wild-type at the transcriptional level, the present study
analyzed microarray gene expression data of AML samples. Feature
genes were identified by a bioinformatics analysis and subsequent
classification was performed by machine learning models, namely the
support vector machine (SVM) and random forest (RF) methods. The
classification efficiency of the two models was also evaluated. The
feature genes identified in the present study may be used to
predict the mutation status of FLT3/ITD in patients with AML.
Materials and methods
Microarray data and data
pre-processing
Gene expression data of AML samples were downloaded
from the European Bioinformatics Institute (EBI; http://www.ebi.ac.uk) (8). Four relevant data sets for patient
cohorts with AML containing information on the FLT3/ITD mutation
were obtained, which included a total of 859 AML samples (Table I). Two data sets (containing 371
samples, including 281 FLT3/ITD mutation-negative and 90 FLT3/ITD
mutation-positive samples) were selected as the training group,
while the other two data sets (containing 488 samples, including
350 FLT3/ITD mutation-negative samples and 138 FLT3/ITD
mutation-positive samples) were used as the test group.
 | Table IMicroarray data sets used in the
present study. |
Table I
Microarray data sets used in the
present study.
| Data set ID | Total samples
(n) | FLT3/ITD mutation
negative (n) | FLT3/ITD mutation
positive (n) | Undetermined samples
(n) |
|---|
| Training sets |
| E-GEOD-61804 | 325 | 243 | 50 | 32 |
| E-GEOD-34860 | 78 | 38 | 40 | 0 |
| Total | 403 | 281 | 90 | 32 |
| Testing sets |
| E-GEOD-17855 | 237 | 189 | 48 | 0 |
| E-GEOD-15434 | 251 | 161 | 90 | 0 |
| Total | 488 | 350 | 138 | 0 |
The raw data were pre-processed using the affy
package (9) in R (www.r-project.org), including data format conversion,
filling in missing values (using median gene expression),
background correction using the MAS method and normalization with
the quantiles method (10).
Screening of differentially expressed
genes (DEGs)
Microarray data from wild-type and FLT3/ITD
mutation-positive AML samples were screened for DEGs using the
significance analysis of microarray method in R (11). The false discovery rate (FDR) was
estimated using the permutation method with P<0.05 (12,13)
and |log2(fold change)|>1 set as the thresholds.
Prediction of mutation status of AML
samples
The ability of DEGs to predict the FLT3/ITD mutation
status in AML samples was examined using two methods: SVM and
random forest.
SVM is a classification technique based on the
structural risk minimization principle (14). The SVM classifier was constructed
via the SVM function in the e1071 package of R with the non-linear
radial basis function as the kernel and penalty functions set at
1,000.
RF utilizes multiple classification and regression
trees to classify samples (15).
The function randomForest from the randomForest package in R was
adopted to classify AML samples from the training group.
A leave-one-out cross validation method was
performed to evaluate the classification efficiency of the two
methods. The sensitivity, specificity, positive predictive value
(PPV), negative predictive value (NPV) (16) and area under the receiver operating
characteristic (ROC) curve (17)
were calculated. The classification efficiency for the training
group, test group and the combined group were evaluated
individually. Whenever the construed SVM or RF classifier produced
a high reliability, the DEGs collected from the training sets were
considered as feature genes for distinguishing wild-type from
FLT3/ITD-mutation positive samples.
Functional enrichment analysis
Functional enrichment analysis of the feature genes
was performed using the Database for Annotation, Visualization and
Integration Discovery (http://david.abcc.ncifcrf.gov/) (18,19).
P<0.5 and FDR<0.1 were set as the cut-off values to screen
out significantly over-represented biological pathways.
Results
Screening for DEGs
A total of 585 DEGs were identified in FLT3/ITD
mutation-positive samples from the training group, comprising 580
upregulated and 5 downregulated genes compared with those in the
FLT3/ITD mutation-negative AML samples.
Sample classification using SVM or RF
classifier
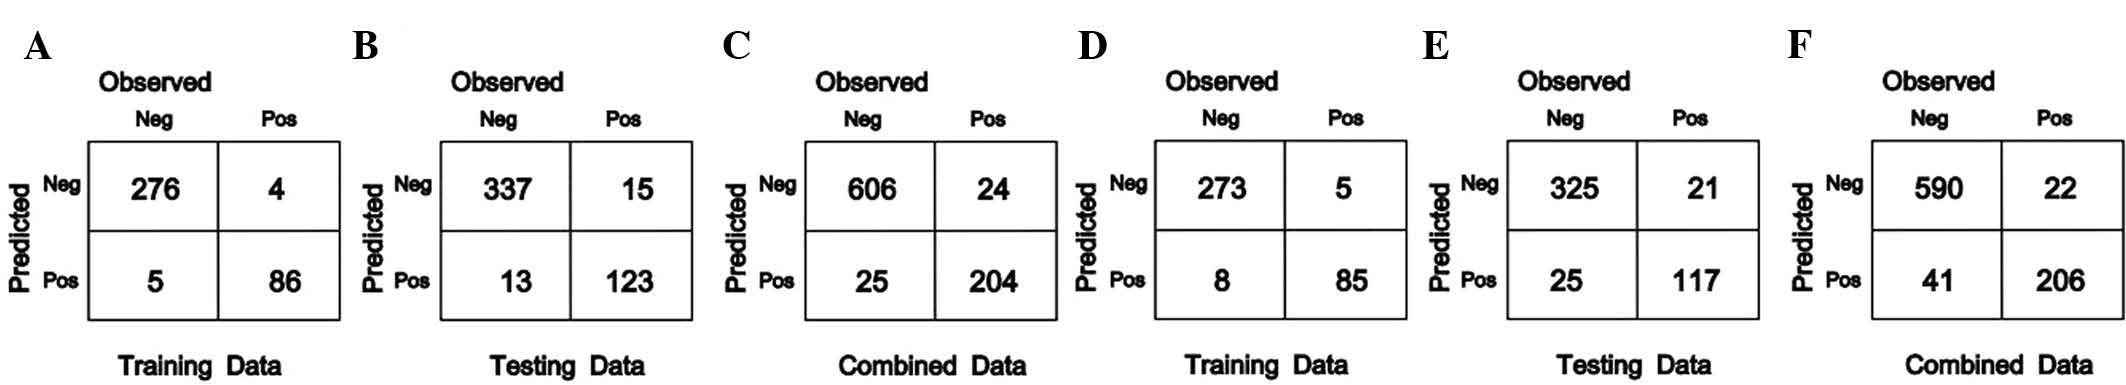
Classification of AML samples with regard to their
FLT3/ITD mutation status depending on their gene expression
profiles was performed using the SVM and RF methods (Fig. 1).
For the 371 AML samples from the training group, 276
and 273 mutation-negative samples, as well as 86 and 85
mutation-positive samples were correctly classified using the SVM
and RF method, respectively. The accuracy rates were 97.57 and
96.5%, respectively.
Among the 488 AML samples from the test group, 337
and 325 mutation-negative samples, as well as 123 and 117
mutation-positive samples were correctly classified by using the
SVM and RF method, respectively, and the accuracy rates were 94.26
and 90.57%.
For the 859 AML samples from the combined group, 606
and 590 mutation-negative samples, as well as 204 and 206
mutation-positive samples were correctly classified by using the
SVM and RF method, respectively, with accuracy rates of 94.3% and
92.67%.
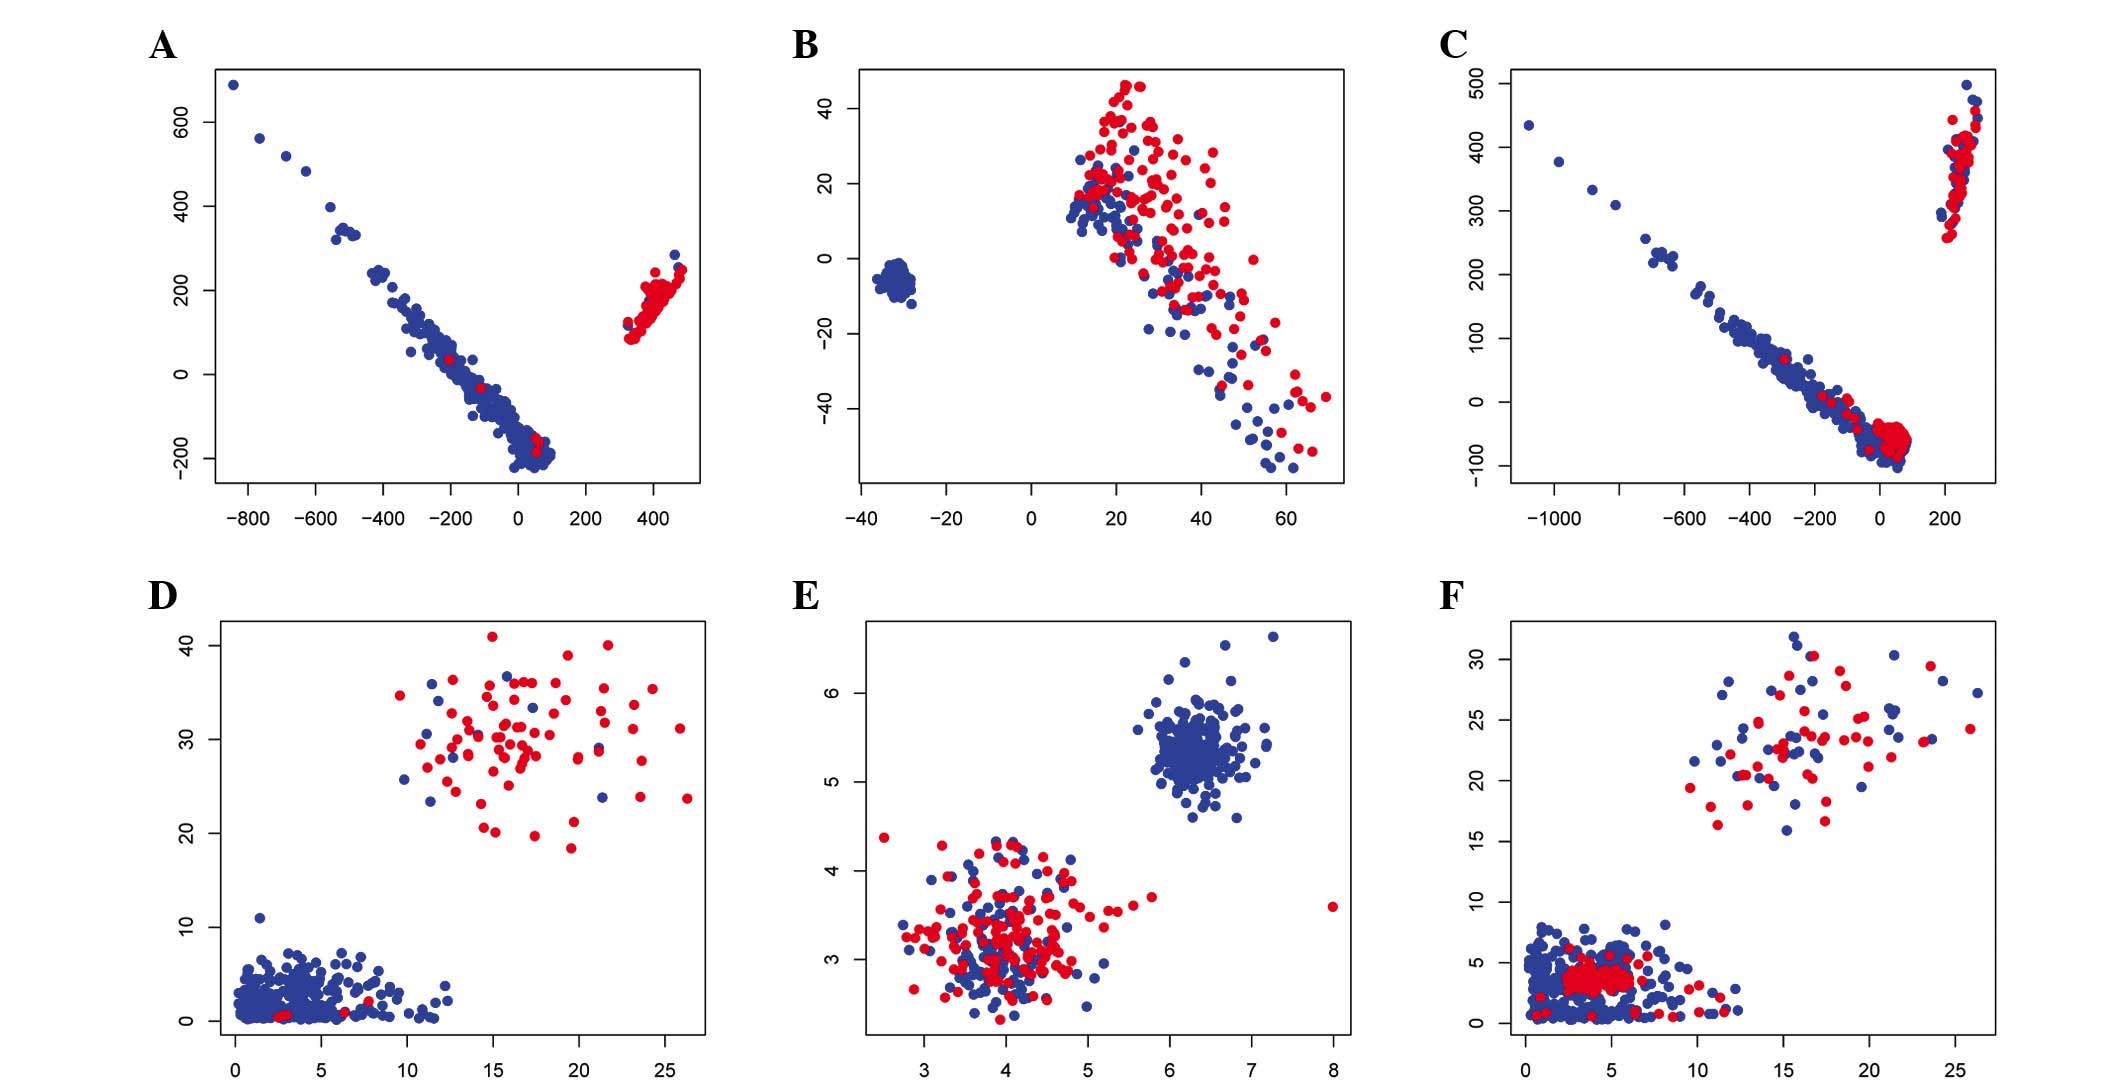
According to above classification results (Fig. 2), the classification using the SVM
method had a better accuracy rate than that of the RF method.
However, the accuracy rates were >90%, suggesting a good
classification ability of these two method based on the DEGs
identified.
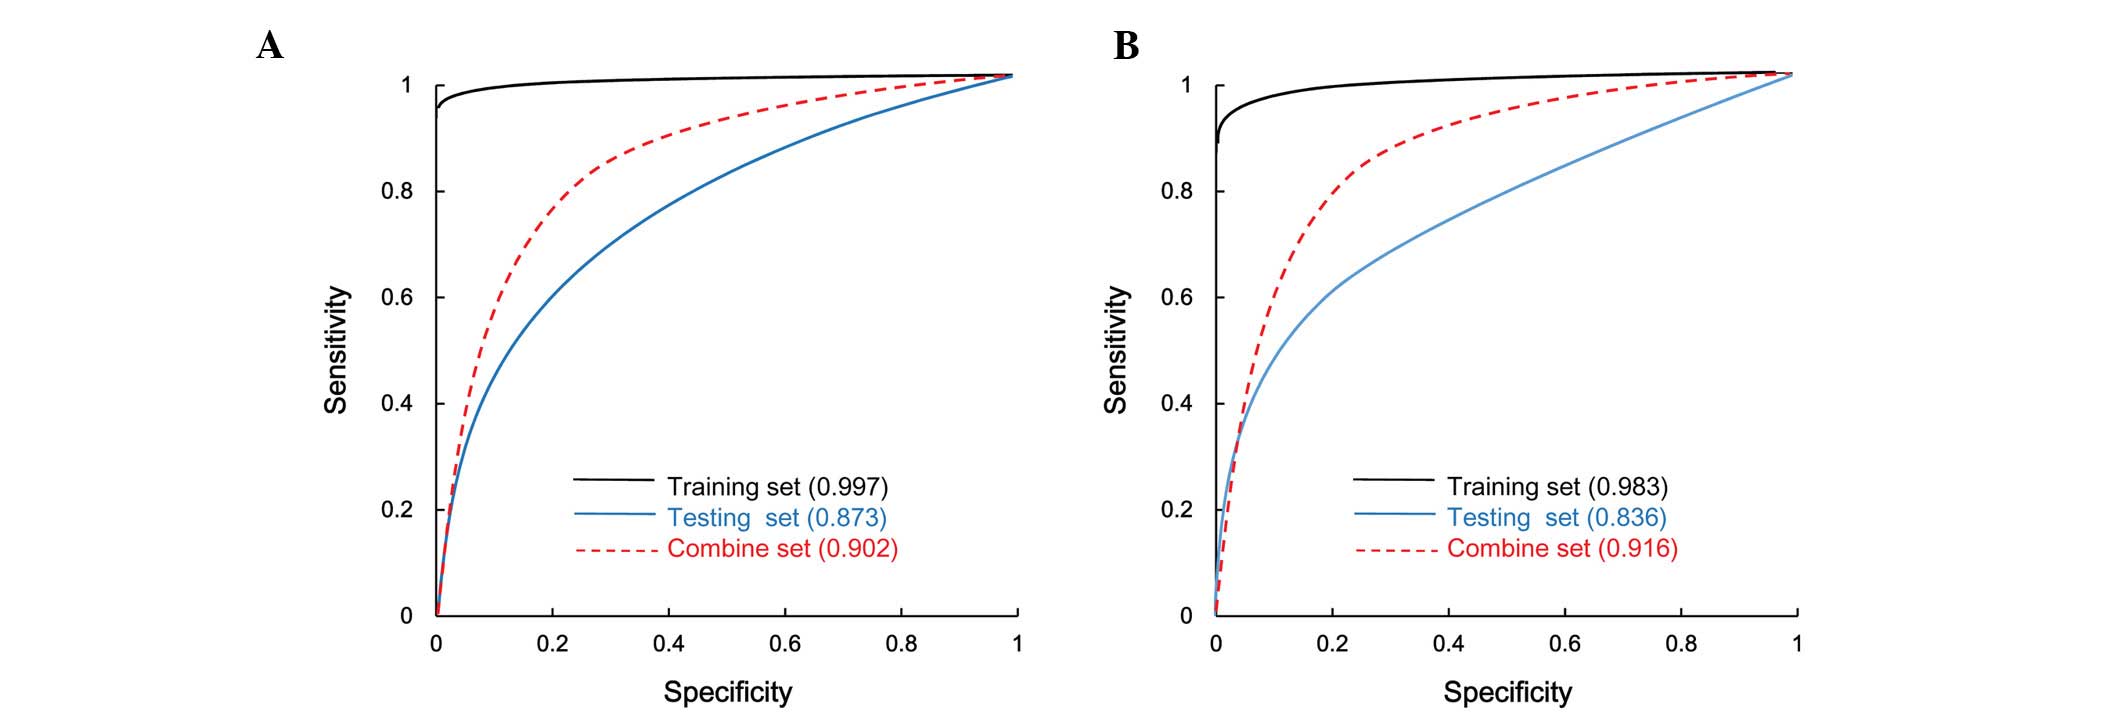
Classification efficiency
Five parameters were calculated to evaluate the
classification efficiency: Rate of correct prediction, sensitivity,
specificity, PPV, NPV (Table II)
and the area under the ROC curve (Fig.
3). For the SVM and RF methods, the rate of correct prediction,
specificity and PPV were >90%, while the sensitivity and NPV
were >80%, with the SVM method producing a slightly better
classification efficiency than the RF method.
| Table IIClassification effects of SVM method
and RF method. |
Table II
Classification effects of SVM method
and RF method.
| Method | No. of samples | Correct rate | Sensitivity | Specificity | PPV | NPV | AUROC |
|---|
| SVM |
| Training group | 371 | 0.9757 | 0.9556 | 0.9822 | 0.9451 | 0.9857 | 0.997 |
| Test group | 488 | 0.9426 | 0.8913 | 0.9629 | 0.9044 | 0.9574 | 0.876 |
| Combined | 859 | 0.9430 | 0.8947 | 0.9604 | 0.8908 | 0.9619 | 0.902 |
| RF |
| Training group | 371 | 0.9650 | 0.9444 | 0.9715 | 0.9140 | 0.9820 | 0.983 |
| Test group | 488 | 0.9057 | 0.8478 | 0.9286 | 0.8239 | 0.9393 | 0.818 |
| Combined | 859 | 0.9267 | 0.9035 | 0.9350 | 0.8340 | 0.9656 | 0.916 |
The feature genes identified were not only suitable
for correct predictions of the FLT3/ITD mutation status of AML
samples in the training group, but also in the test group and the
combined group, suggesting that these DEGs may be utilized for
distinguishing FLT3/ITD mutation-negative AML samples from
mutation-positive samples. It was indicated that the DEGs
identified in the present study are feature genes of the FLT3/ITD
mutation, including IDH1, SUZ12, BCORL1, RUVBL2, JMJD1C, TOP2A,
DAPK3, RPS15, RPS16, RPS9, EIF2α, EIF4E, EIF3B, EIF3 K, EIF3 L and
EIF1B.
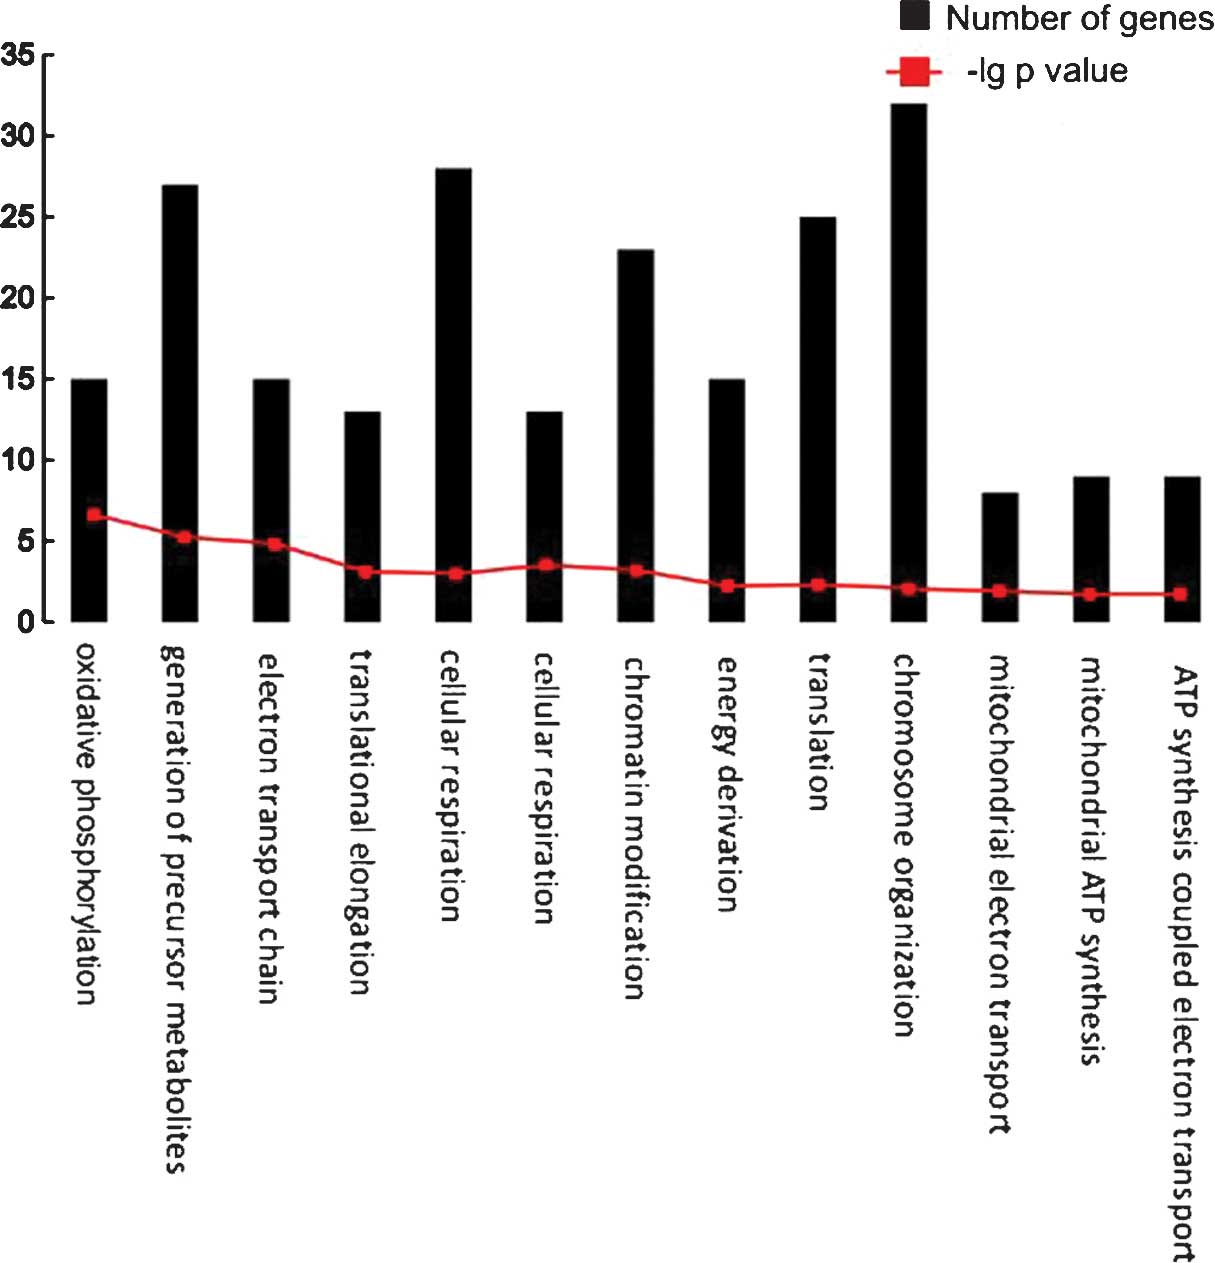
Biological pathways of feature genes
A total of 13 biological pathways were
over-represented by the feature genes (Table III). The number of genes in each
biological pathway is shown in Fig.
4. Several pathways were associated with energy metabolism,
including oxidative phosphorylation, mitochondrial electron
transport and mitochondrial adenosine triphosphate (ATP) synthesis.
Furthermore, chromatin organization, chromosome organization and
translation were significantly overrepresented.
| Table IIISignificantly over-represented
biological pathways in feature genes. |
Table III
Significantly over-represented
biological pathways in feature genes.
| Term | Count | P-value | FDR |
|---|
| GO:0006119 -
Oxidative phosphorylation | 15 |
3.80×10⁻⁶ | 0.008857 |
| GO:0006091 -
Generation of precursor metabolites | 27 |
1.50×10⁻⁵ | 0.017414 |
| GO:0022900 -
Electron transport chain | 15 |
2.25×10⁻⁵ | 0.017423 |
| GO:0045333 -
Cellular respiration | 13 |
8.00×10⁻⁵ | 0.045815 |
| GO:0016568 -
Chromatin modification | 23 |
1.11×10⁻⁴ | 0.050724 |
| GO:0006414 -
Translational elongation | 13 |
1.19×10⁻⁴ | 0.045367 |
| GO:0006325 -
Chromatin organization | 28 |
1.40×10⁻⁴ | 0.045654 |
| GO:0006412 -
Translation | 25 |
2.62×10⁻⁴ | 0.073784 |
| GO:0015980 - Energy
derivation | 15 |
2.89×10⁻⁴ | 0.072430 |
| GO:0051276 -
Chromosome organization | 32 |
3.37×10⁻⁴ | 0.075984 |
| GO:0006120 -
Mitochondrial electron transport | 8 |
4.01×10⁻⁴ | 0.081888 |
| GO:0042775 -
Mitochondrial ATP synthesis | 9 |
4.64×10⁻⁴ | 0.086660 |
| GO:0042773 - ATP
synthesis-coupled electron transport | 9 |
4.64×10⁻⁴ | 0.086660 |
Discussion
In the present study, a total of 585 feature genes
were identified to be differentially expressed between FLT3/ITD
mutation-positive and wild-type AML samples from the training group
(two data sets). Two methods, SVM and RF, were adopted to classify
AML samples from the training group and the test group (two further
data sets). The accuracy rates were >90% using either method on
either group of data sets. SVM produced a slightly more accurate
classification than RF. It was indicated that the feature genes
identified in the present study may be used to predict the FLT3/ITD
mutation status in patients with AML. Functional enrichment
analysis was also performed for the feature genes. Energy
metabolism, chromatin organization and translation were
significantly overrepresented.
Mitochondria are important organelles regulating the
energy levels, metabolism and apoptosis in cells, which can in turn
affect cell differentiation and proliferation. Therefore, they
mitochondria have important roles in the pathogenesis of AML
(20). Inhibition of mitochondrial
translation has been suggested as a potential therapeutic strategy
for AML (21). Yamaguchi et
al (22) reported that a
mutation in IDH1, which has an important role in the citrate
circle, has an adverse effect in patients with AML.
Several genes associated with chromatin organization
also participate in the development of AML. SUZ12 encodes a subunit
of polycomb repressive complex 2, which was shown to drive aberrant
self-renewal in a mouse model of AML (23). Tiacci et al (24) found that BCORL1 has a role AML.
Zagaria et al (25)
reported that the BCOR gene was dysregulated in AML is due to
chromosomal translocation. RUVBL2 is a critical mediator of
oncogenesis caused by the MLL-AF9 fusion gene and is a potential
therapeutic target for MLL-AF9-associated leukemia (26). In addition, Sroczynska et al
(27) found that JMJD1C is
required for leukemia maintenance, and that depletion of JMJD1C
impaired the expansion and colony formation of human leukemic cell
lines. Amplification of TOP2A was found identified in
myelodysplastic syndrome transforming to AML (28). DAPK3 was indicated to have a role
in the induction of apoptosis, and that CpG island methylation of
this gene, leading to its dysregulation, is implicated in AML
(29).
Translation was also significantly overrepresented
in the feature genes identified by the present study. Wang et
al (30) indicated that
silencing of RPS14 inhibits the proliferation of AML cells via
activating p53. It is likely that RPS15, RPS16, RPS9 and other
members of the RPS family may exert similar roles. In addition,
EIF2α and EIF4E have been implicated in AML (31,32).
The roles of EIF3B, EIF3 K, EIF3 L and EIF1B in AML may be worth
investigating.
In conclusion, the present study identified a number
of feature genes that may be used to distinguish FLT3/ITD
mutation-positive AML samples from FLT3 wild-type samples. Several
of the feature genes identified have been previously implicated in
AML. The computational tools developed in the present study may aid
in the clinical detection of FLT3/ITD mutation-positive AML for
possible early and targeted treatment of these patients.
References
|
1
|
Gilliland DG and Griffin JD: The roles of
FLT3 in hematopoiesis and leukemia. Blood. 100:1532–1542. 2002.
View Article : Google Scholar : PubMed/NCBI
|
|
2
|
Li Y, Li H, Wang MN, Lu D, Bassi R, Wu Y,
Zhang H, Balderes P, Ludwig DL, Pytowski B, et al: Suppression of
leukemia expressing wild-type or ITD-mutant FLT3 receptor by a
fully human anti-FLT3 neutralizing antibody. Blood. 104:1137–1144.
2004. View Article : Google Scholar : PubMed/NCBI
|
|
3
|
Chen P, Levis M, Brown P, Kim KT, Allebach
J and Small D: FLT3/ITD mutation signaling includes suppression of
SHP-1. J Biol Chem. 280:5361–5369. 2005. View Article : Google Scholar
|
|
4
|
Rausei-Mills V, Chang KL, Gaal KK, Weiss
LM and Huang Q: Aberrant expression of CD7 in myeloblasts is highly
associated with de novo acute myeloid leukemias with FLT3/ITD
mutation. Am J Clin Pathol. 129:624–629. 2008. View Article : Google Scholar : PubMed/NCBI
|
|
5
|
Okamoto M, Hayakawa F, Miyata Y, Watamoto
K, Emi N, Abe A, Kiyoi H, Towatari M and Naoe T: Lyn is an
important component of the signal transduction pathway specific to
FLT3/ITD and can be a therapeutic target in the treatment of AML
with FLT3/ITD. Leukemia. 21:403–410. 2007. View Article : Google Scholar : PubMed/NCBI
|
|
6
|
Fathi AT, Arowojolu O, Swinnen I, Sato T,
Rajkhowa T, Small D, Marmsater F, Robinson JE, Gross SD, Martinson
M, et al: A potential therapeutic target for FLT3-ITD AML: PIM1
kinase. Leuk Res. 36:224–231. 2012. View Article : Google Scholar :
|
|
7
|
Dalal BI, Mansoor S, Manna M, Pi S, Sauro
GD and Hogge DE: Detection of CD34, TdT, CD56, CD2, CD4 and CD14 by
flow cytometry is associated with NPM1 and FLT3 mutation status in
cytogenetically normal acute myeloid leukemia. Clin Lymphoma
Myeloma Leuk. 12:274–279. 2012. View Article : Google Scholar : PubMed/NCBI
|
|
8
|
Stoesser G, Baker W, van den Broek A,
Camon E, Garcia-Pastor M, Kanz C, Kulikova T, Leinonen R, Lin Q,
Lombard V, et al: The EMBL nucleotide sequence database. Nucleic
Acids Res. 30:21–26. 2002. View Article : Google Scholar :
|
|
9
|
Liu WM, Mei R, Di X, Ryder TB, Hubbell E,
Dee S, Webster TA, Harrington CA, Ho MH, Baid J and Smeekens SP:
Analysis of high density expression microarrays with signed-rank
call algorithms. Bioinformatics. 18:1593–1599. 2002. View Article : Google Scholar : PubMed/NCBI
|
|
10
|
Smyth GK and Speed T: Normalization of
cDNA microarray data. Methods. 31:265–273. 2003. View Article : Google Scholar : PubMed/NCBI
|
|
11
|
Zhang S: A comprehensive evaluation of
SAM, the SAM R-package and a simple modification to improve its
performance. Bmc Bioinformatics. 8:2302007. View Article : Google Scholar : PubMed/NCBI
|
|
12
|
Benjamini Y and Hochberg Y: Controlling
the false discovery Rate: A practical and powerful approach to
multiple testing. J R Stat Soc B. 57:289–300. 1995.
|
|
13
|
Benjamini and Yoav: Discovering the false
discovery rate. Journal of the Royal Statistical Society.
72:405–416. 2010. View Article : Google Scholar
|
|
14
|
Duval B and Hao JK: Advances in
metaheuristics for gene selection and classification of microarray
data. Brief Bioinform. 1:127–141. 2010. View Article : Google Scholar
|
|
15
|
Díaz-Uriarte R and Alvarez de Andrés S:
Gene selection and classification of microarray data using random
forest. Bmc Bioinformatics. 7:32006. View Article : Google Scholar : PubMed/NCBI
|
|
16
|
Croshaw R, Shapiro-Wright H, Svensson E,
Erb K and Julian T: Accuracy of clinical examination, digital
mammogram, ultrasound and MRI in determining postneoadjuvant
pathologic tumor response in operable breast cancer patients. Ann
Surg Oncol. 18:3160–3163. 2011. View Article : Google Scholar : PubMed/NCBI
|
|
17
|
Fawcett T: An introduction to ROC
analysis. Pattern Recogn Lett. 27:861–874. 2006. View Article : Google Scholar
|
|
18
|
Huang DW, Sherman BT and Lempicki RA:
Systematic and integrative analysis of large gene lists using DAVID
bioinformatics resources. Nat Protoc. 4:44–57. 2009. View Article : Google Scholar
|
|
19
|
Huang da W, Sherman BT and Lempicki RA:
Bioinformatics enrichment tools: Paths toward the comprehensive
functional analysis of large gene lists. Nucleic Acids Res.
37:1–13. 2009. View Article : Google Scholar
|
|
20
|
Basak NP and Banerjee S: Mitochondrial
dependency in progression of acute myeloid leukemia. Mitochondrion.
21:41–48. 2015. View Article : Google Scholar : PubMed/NCBI
|
|
21
|
Schimmer AD and Skrtić M: Therapeutic
potential of mitochondrial translation inhibition for treatment of
acute myeloid leukemia. Expert Rev Hematol. 5:117–119. 2012.
View Article : Google Scholar : PubMed/NCBI
|
|
22
|
Yamaguchi S, Iwanaga E, Tokunaga K, Nanri
T, Shimomura T, Suzushima H, Mitsuya H and Asou N: IDH1 and IDH2
mutations confer an adverse effect in patients with acute myeloid
leukemia lacking the NPM1 mutation. Eur J Haematol. 92:471–477.
2014. View Article : Google Scholar : PubMed/NCBI
|
|
23
|
Shi J, Wang E, Zuber J, Rappaport A,
Taylor M, Johns C, Lowe SW and Vakoc CR: The Polycomb complex PRC2
supports aberrant self-renewal in a mouse model of MLL-AF9;Nras
(G12D) acute myeloid leukemia. Oncogene. 32:930–938. 2013.
View Article : Google Scholar
|
|
24
|
Tiacci E, Grossmann V, Martelli MP,
Kohlmann A, Haferlach T and Falini B: The corepressors BCOR and
BCORL1: Two novel players in acute myeloid leukemia. Haematologica.
97:3–5. 2012. View Article : Google Scholar : PubMed/NCBI
|
|
25
|
Zagaria A, Anelli L, Casieri P, Coccaro N,
Tota G, Minervini CF, Minervini A, Impera L, Brunetti C, Orsini P,
et al: BCOR gene dysregulation due to chromosomal translocation in
acute myeloid leukemia: A new mechanism based on long non-coding
RNA dislocation? Leuk Lymphoma. 55:2199–2201. 2014. View Article : Google Scholar
|
|
26
|
Osaki H, Walf-Vorderwülbecke V, Mangolini
M, et al: The AAA+ ATPase RUVBL2 is a critical mediator of MLL-AF9
oncogenesis. Leukemia. 27:1461–1468. 2013. View Article : Google Scholar : PubMed/NCBI
|
|
27
|
Sroczynska P, Cruickshank VA, Bukowski JP,
Miyagi S, Bagger FO, Walfridsson J, Schuster MB, Porse B and Helin
K: shRNA screening identifies JMJD1C as being required for leukemia
maintenance. Blood. 123:1870–1882. 2014. View Article : Google Scholar : PubMed/NCBI
|
|
28
|
Martinsubero JI, Harder L, Gesk S, Schoch
R, Novo FJ, Grote W, Calasanz MJ, Schlegelberger B and Siebert R:
Amplification of ERBB2, RARA, and TOP2A genes in a myelodysplastic
syndrome transforming to acute myeloid leukemia. Cancer Genet
Cytogenet. 127:174–176. 2001. View Article : Google Scholar
|
|
29
|
Aggerholm A and Hokland P: DAP-kinase CpG
island methylation in acute myeloid leukemia: Methodology versus
biology? Blood. 95:2997–2998. 2000.PubMed/NCBI
|
|
30
|
Wang L, Luo J, Nian Q, Xiao Q, Yang Z and
Liu L: Ribosomal protein S14 silencing inhibits growth of acute
myeloid leukemia transformed from myelodysplastic syndromes via
activating p53. Hematology. 19:225–231. 2014. View Article : Google Scholar
|
|
31
|
Hariri F, Arguello M, Volpon L,
Culjkovic-Kraljacic B, Nielsen TH, Hiscott J, Mann KK and Borden
KL: The eukaryotic translation initiation factor eIF4E is a direct
transcriptional target of NF-κB and is aberrantly regulated in
acute myeloid leukemia. Leukemia. 10:2047–2055. 2013. View Article : Google Scholar
|
|
32
|
Assouline S, Culjkovic B, Cocolakis E,
Rousseau C, Beslu N, Amri A, Caplan S, Leber B, Roy DC, Miller WH
Jr and Borden KL: Molecular targeting of the oncogene eIF4E in
acute myeloid leukemia (AML): A proof-of-principle clinical trial
with ribavirin. Blood. 2:257–260. 2009. View Article : Google Scholar
|