Introduction
MicroRNA (miR) is a short-segment (length, 20–23 nt)
RNA, which binds to the 3′-untranslated region (UTR) of its target
DNA by reverse complement, thus preventing the translation of mRNA
or causing its degradation (1–3).
Extensively expressed in mammals, miR regulates various
physiological processes, cell functions and signaling pathways via
the regulation of gene expression (1–5).
Thus far, >2,000 miRs associated with humans have been
identified, many of which perform various gene regulatory functions
(6,7). However, the precise functions and
underlying regulatory mechanisms of miR remain to be fully
elucidated. A number of studies have suggested that miR is
associated with certain diseases (8–10).
Therefore, investigating the function of a specific miR and its
underlying mechanisms may improve our understanding of the
regulation of signaling pathways by miR and the subsequent effects,
including cell differentiation, proliferation and apoptosis. This
may contribute to improvement of human health and disease
treatment.
Morphine (MP) is commonly used during the treatment
of cancer. In addition to easing pain, it has been demonstrated to
increase the susceptibility of cancer cells to apoptosis by
promoting the expression of apoptosis-associated proteins, which
suppresses the proliferation of cancer cells (11–13).
However, MP treatment for cancer is complex and is often associated
with other factors, including miR (14,15).
In addition, as an opioid, MP is addictive and is associated with
various side effects (16,17), which may alter miR expression
(15,18,19).
miR-338-3p is a widely-reported miR that promotes cancer cell death
by regulating specific signaling pathways or associated genes
during cancer treatment (20,21).
Investigating the association between MP and miR-338-3p may
contribute to our understanding of the activity of miR-338-3p and
the underlying molecular mechanisms of the effects of MP in cancer
treatment. In the present study, mouse macrophages were transfected
with miR-338-3p and treated with MP to observe the effect on
miR-338-3p expression. Furthermore, the interaction between MP and
miR-338-3p was investigated and the target gene of miR-338-3p was
verified.
Materials and methods
Isolation of mouse peritoneal
macrophages
A total of 5 C57BL/6J mice (regardless of gender;
weight, 20±2 g), purchased from the laboratory animal center of
Xinjiang Medical University (Ürümqi, China), were housed at 21°C in
50% humidity, with a 12 h light/dark cycle, and free access to food
and water. A week later, the mice (6–8 weeks old) were sacrificed
by cervical dislocation; the whole mouse was soaked in 75% ethanol
for 5 min and dried with sterile gauze. A total of 5 ml Dulbecco's
modified Eagle's medium (DMEM; Gibco; Thermo Fisher Scientific,
Inc., Waltham, MA, USA) was injected i.p. A total of 5 min later,
3.5–4 ml liquid was withdrawn from the abdominal cavity via syringe
and centrifuged at 134 × g for 10 min at 4°C. The supernatant was
discarded and the cell pellet resuspended in Hank's balanced salt
solution (Beijing Huamaike Biotechnology Co., Ltd, Beijing, China).
DMEM containing 10% fetal bovine serum (Biowest, Nuaillé, France)
and double-antibody [penicillin (100 U/ml) and streptomycin (100
mg/ml)] was added to achieve the correct cell concentration
(1×10⁹/l), and the cells were cultured in a 25T-flask
under 5% CO2 for 48 h at 37°C. At this stage, certain
adherent cells exhibited round or oval morphology when observed
under a Zeiss Axio Observer A1 microscope (Carl Zeiss MicroImaging,
Inc., Thornwood, NY, USA). DMEM was then exchanged for RPMI-1640
medium (HyClone; GE Healthcare Life Sciences, Logan, UT, USA)
containing 10% fetal calf serum (Hyclone; GE Healthcare Life
Sciences) and the macrophages were cultured under 5%
CO2, 37°C and saturated humidity. Culture medium was
replaced every day; digestion was performed every 4 days with 0.25%
trypsin; when cell confluence reached 90%, the cells were passaged
at a ratio of 1:3. The present study was approved by the
Experimental Animals Ethics Committee of Linyi Yishui Central
Hospital (Linyi, China). All studies performed on the mice were
strictly in accordance with the Provisions of Protection and Use of
Experimental Animals from the International Association for the
Study of Pain (22).
Transfection and grouping of mouse
macrophages
When cell confluence reached 80–90%, macrophages
were transferred to a 24-well plate (3×10⁴/well). The
cultured cells were divided into 6 groups: i) Blank control group;
ii) MP group, in which the macrophages were treated with 10
μM MP (Sigma-Aldrich, St. Louis, MO, USA) for 24 h; iii)
MP+miR-338-3p mimic group, in which the macrophages were treated
with 10 μM MP for 24 h following transfection with a
miR-338-3p mimic for 24 h; iv) MP+control mimic group, in which the
macrophages were treated with 10 μM MP for 24 h following
transfection with a negative control mimic for 24 h; v)
MP+miR-338-3p inhibitor group, in which the macrophages were
treated with 10 μM MP following transfection with a
miR-338-3p inhibitor for 24 h; and vi) MP+control inhibitor group,
in which the macrophages were treated with 10 μM MP
following transfection with a negative control inhibitor for 24 h.
miR-338-3p mimic, mimic control, miR-338-3p inhibitor and inhibitor
control were purchased from Shanghai GenePharma Co., Ltd.,
Shanghai, China, and transfection sequences are listed in Table I. Transfection was performed using
Lipofectamine® 2000 (Invitrogen; Thermo Fisher
Scientific, Inc.) according to the manufacturer's instructions,
immediately when the confluence of the cells in each group reached
50–60% in each well. Each treatment group was performed in
triplicate and the experiment was repeated at least three times
with similar results.
 | Table ITransfection sequences of miR-338-3p
mimic, inhibitor and controls. |
Table I
Transfection sequences of miR-338-3p
mimic, inhibitor and controls.
| Group | Sequence |
|---|
| miR-338-3p
mimic | F,
5′-UCCAGCAUCAGUGAUUUUGUUG-3′ |
| R,
3′-UUAGGUCGUAGUCACUAAAACA-5′ |
| Mimic control | F,
5′-UUCUCCGAACGUGUCACGUTT-3′ |
| R,
3′-TTAAGAGGCUUGCACAGUGCA-5′ |
| miR-338-3p
inhibitor | F,
5′-CAACAAAAUCACUGAUGCUGGA-3′ |
| Inhibitor
control | R,
5′-UUGUAAGUUGCGACAGCCACUCA-3′ |
miR-338-3p and sex determining region
Y-box 4 (SOX4) mRNA expression levels detected by reverse
transcription-quantitative polymerase chain reaction (RT-qPCR)
TRIzol® reagent (Invitrogen; Thermo
Fisher Scientific, Inc.) was used to extract the total RNA and
diethylpyrocarbonate (DEPC; 50 μl; Sigma-Aldrich) was used
to inactivate RNases. RNA concentration was determined on a DU-800
Spectrophotometer (Beckman Coulter, Inc., Brea, CA, USA). RNA
purity and integrity were controlled in accordance with the width
ratio of 28S and 18S RNA bands following formaldehyde modified gel
electrophoresis (5 V for 1 h). The width ratio of 28S and 18S ≥1.5
and A260 nm/A280 nm ≥1.8 indicated that RNA
had a good completeness and no degradation. The extracted total RNA
showed clear and bright 28S and 18S bands; no degradation was
observed. The A260 nm/A280 nm ratio was 2.0, indicating that the
extracted total RNA was of high quality. miR-338-3p RT-qPCR was
performed with the All-in-One® First-Strand cDNA
Synthesis kit and the SYBR Green I based All-in-One®
qPCR Mix (GeneCopoeia, Inc., Rockville, MD, USA) according to the
manufacturer's instructions. The reverse transcription reaction
contained total RNA with a final concentration of 2 μg (2
μl), 2.5 U/μl PolyA polymerase (1 μl), reverse
transcriptase RTase Mix (1 μl), 5X reaction buffer (5
μl) and DEPC H2O (16 μl), in a total
volume of 25 μl. The reverse transcription reaction
conditions were: 37°C for 60 min and 85°C for 5 min. The qPCR
reaction system contained cDNA (2 μl), 2X All-in-ONE Q-PCR
Mix (10 μl), universal PCR primer (2 μl), 50X Rox
Reference Dye (0.4 μl), miR-338-3p or U6 primer (2
μl) and DEPC H2O (3.6 μl). qPCR cycling
conditions were as follows: Preheating for 10 min at 95°C,
degeneration for 10 sec at 95°C, annealing for 20 sec at 60°C and
extension for 34 sec at 72°C. A total of 40 cycles were performed.
SOX4 RT-qPCR was performed with Prime Script™ RT reagent kit
(Takara Bio, Inc.) and SYBR® Green Real time PCR Master
Mix (Toyobo Co., Ltd., Osaka, Japan) according to the
manufacturer's instructions. The reverse transcription reaction
contained 5X Moloney-murine leukemia virus (M-MLV) buffer (2
μl), deoxynucleotides (2 mM; 2 μl), Random 6 mers
(0.5 μl), RTase M-MLV (200 U/μl; 0.25 μl) and
RNA (1 μl), and DEPC H2O was added to make up a
final volume of 10 μl. Reaction conditions were as follows:
42°C for l0 min, 95°C for 2 min and 4°C for 10 min. The qPCR
reaction system contained 2x SYBR Green (10 μl), forward and
reverse primers (0.8 μl), cDNA template (1 μl) and
ddH2O was added to make up a total volume of 20
μl. U6 and GAPDH served as internal reference genes. All
primer sequences are listed in Table
II. The relative quantitative expression of the target gene was
calculated by the 2−ΔΔCq method (23). The formula was expressed as
follows: ΔΔCq= (Cqexperimental target gene −
Cqexperimental reference gene) − (Cqcontrol target
gene − Cqcontrol reference gene).
| Table IIPrimer sequences. |
Table II
Primer sequences.
| Gene | Sequence |
|---|
| miR-338-3p | F,
5′-TGCGGTCCAGCATCAGTGAT-3′ |
| R,
5′-CCAGTGCAGGGTCCGAGGT-3′ |
| U6 | F,
5′-TGCGGGTGCTCGCTTCGGCAGC-3′ |
| R,
5′-CCAGTGCAGGGTCCGAGGT-3′ |
| SOX4 | F,
5′-GTGAGCGAGATGATCTCGGG-3′ |
| R,
5′-CAGGTTGGAGATGCTGGACTC-3′ |
| GAPDH | F,
5′-AGAAGGCTGGGGCTCATTTG-3′ |
| R,
5′-AGGGGCCATCCACAGTCTTC-3′ |
Dual-luciferase reporter gene
detection
The target gene of mus musculus
(mmu)-miR-338-3p was predicted by TargetScan (version 7.1;
targetscan.org), PicTar (pictar.mdc-berlin.de/) and microRNA.org (August 2010 release; microrna.org/microrna/home.do) online
bioinformatics prediction software. The 3′-UTR of the SOX4 gene
contained sequences that regulated various sites; amplification was
performed according to the manufacturer's instructions of the
SYBR® Green Real Time PCR Master Mix (Toyobo Co., Ltd.,
Japan). The primer sequences were as follows: Forward,
GAGCTCCTCCGCCTTCTTTTCTAC and reverse, CTCGAGCACGTCTTCTCATTTACACC.
The reaction conditions were 42°C for 10 min, 95°C for 2 min and
4°C for 10 min. The reaction system contained 2x SYBR Green (10
μl), primers (0.8 μl), cDNA (1.0 μl) and
ddH2O was added to make up a total volume of 20
μl. The PCR amplified SOX4 3′UTR was cloned into the pmirGLO
luciferase miR target expression vector (Promega Corporation,
Madison, WI, USA). Site-directed mutagenesis of the miR-338-3p
binding site in the 3′-UTR of SOX4 were predicted using the
previously mentioned bioinformatics software. The primer sequences
were as follows: Forward, TGG ACG ACT TTA AAA AAA CAA TTC AG and
reverse, CAG ATT TGA GTT GCG TTT GAA TC. The primers were
synthetized by Sangon Biotech Co., Lyd., Shanghai, China). The
pRL-TK vector (Takara Bio, Inc.) expressing Renilla
luciferase served as an internal reference for transfection
efficiency. miR-338-3p mimic or miR-338-3p mimic control was
co-transfected with the luciferase vector containing the wild-type
or mutated SOX4 3′-UTR, and the negative control was added directly
to macrophages. Dual-luciferase reporter gene detection was
performed according to the manufacturer's instructions (24).
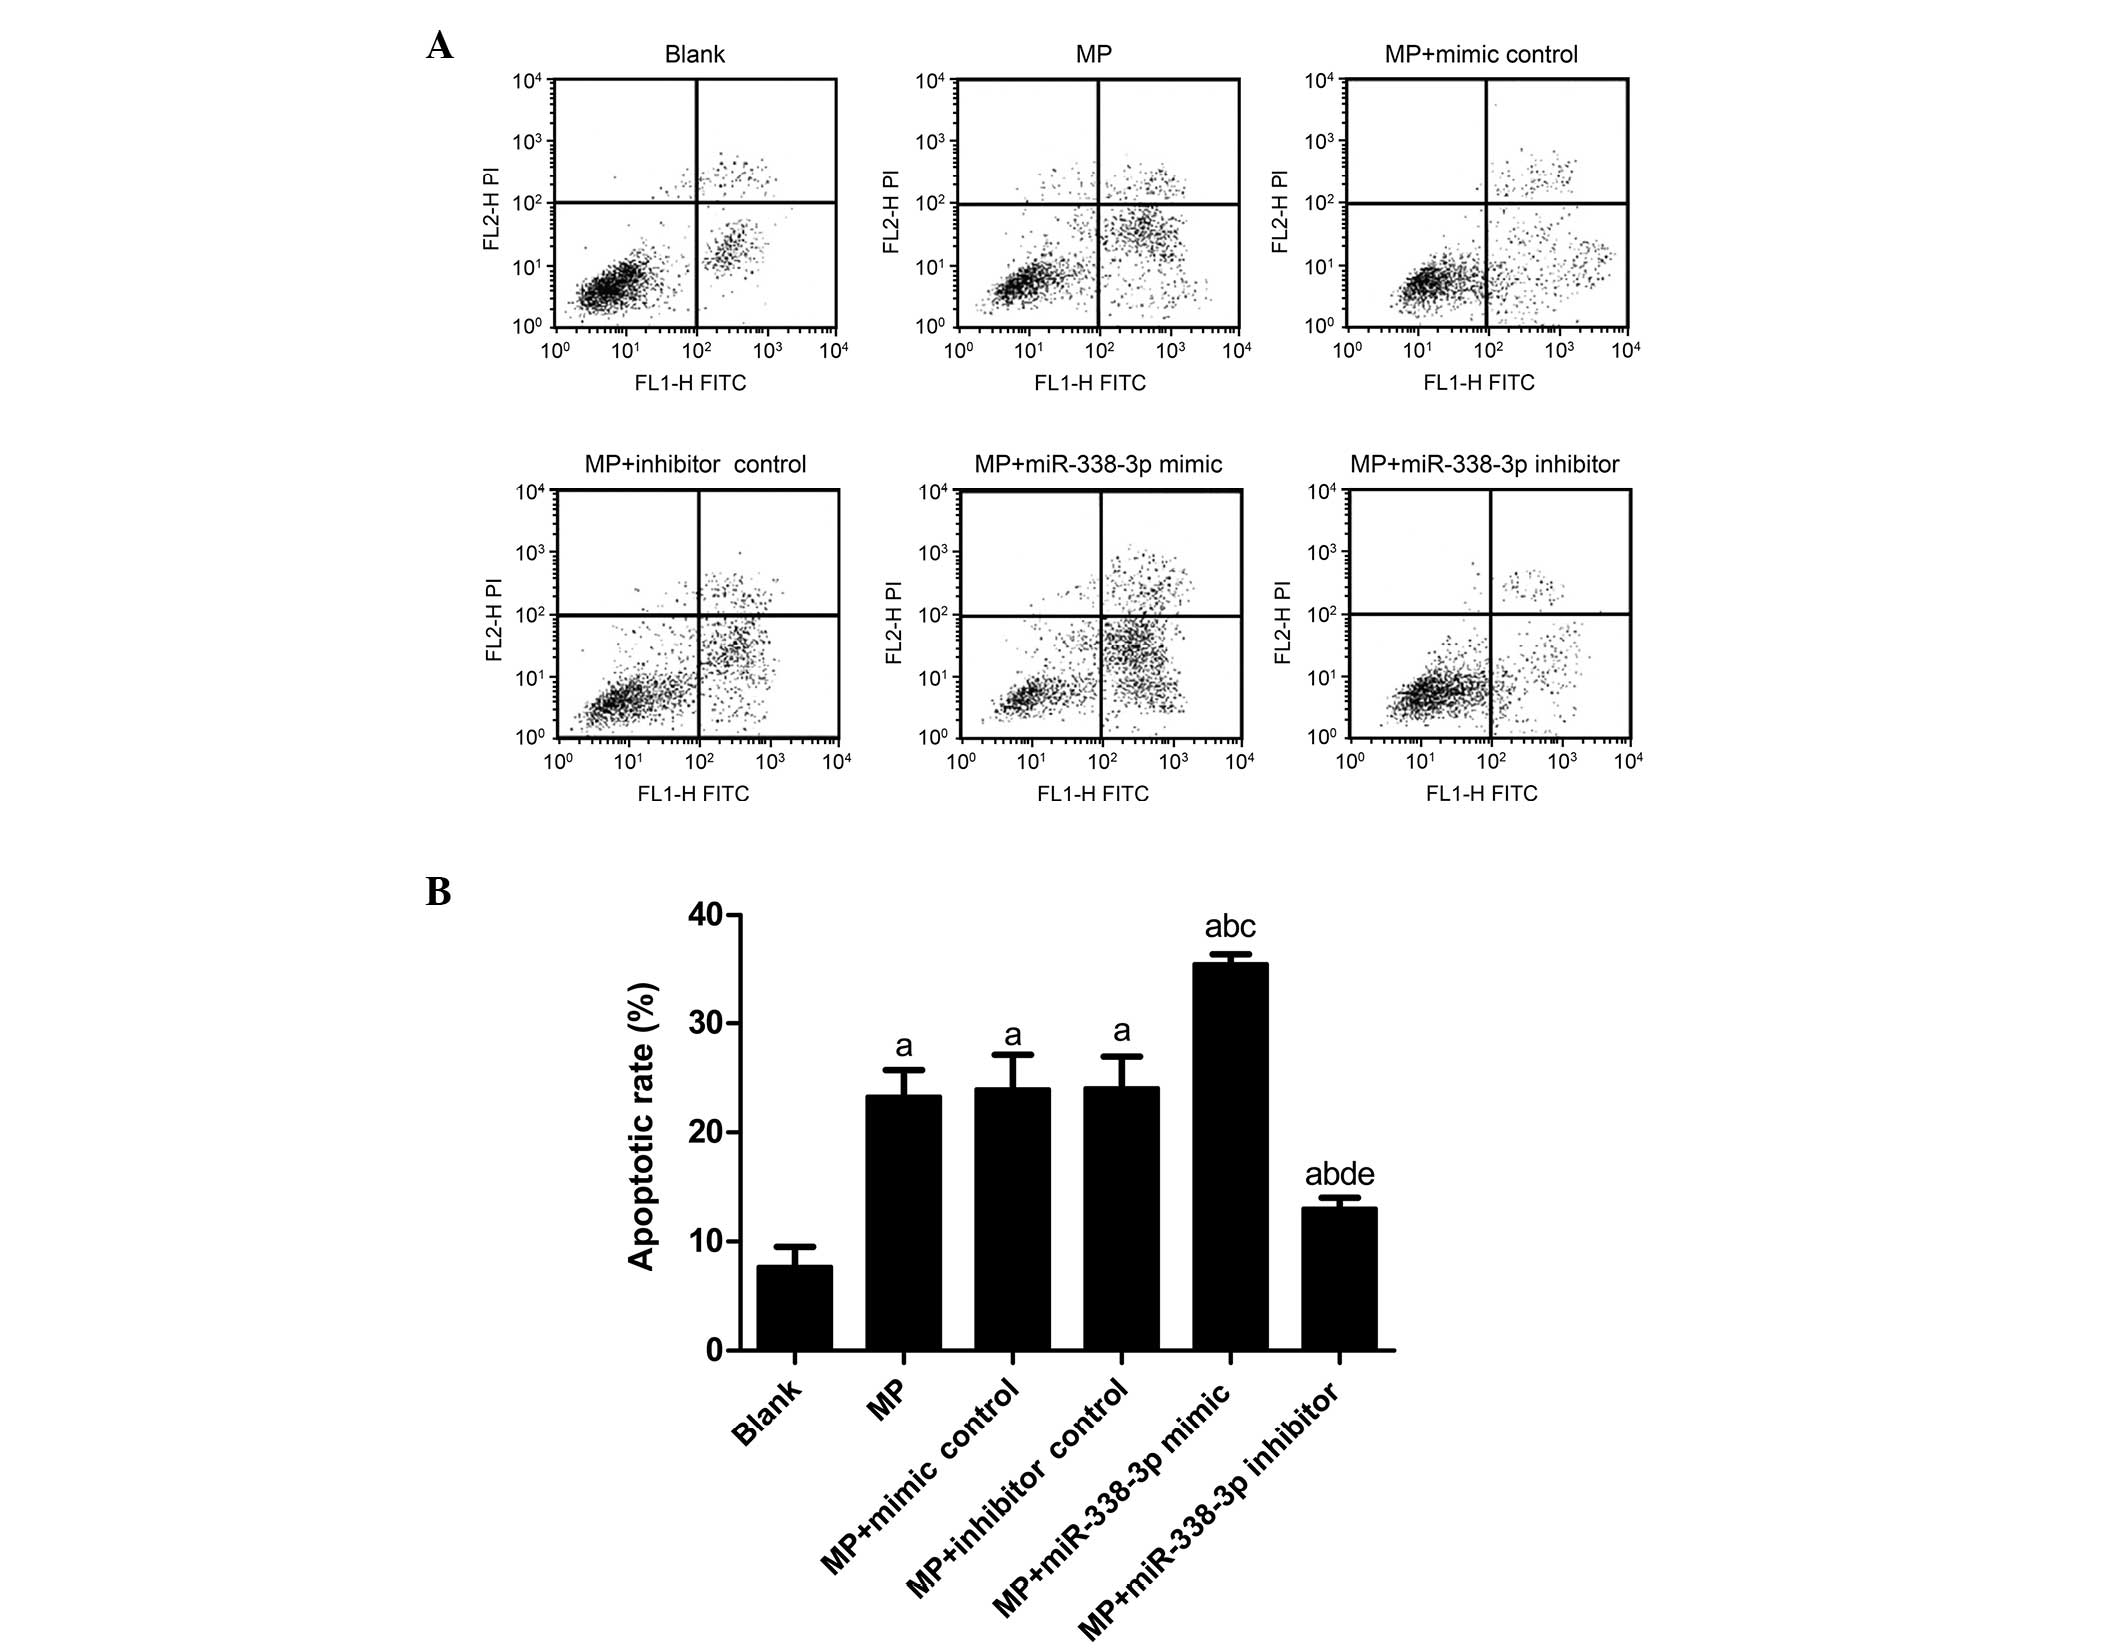
Apoptosis detection by annexin
V/propidium iodide (PI) double-staining
The apoptotic rate was determined by Annexin V/PI
double-staining (Nanjing KeyGen Biotech Co., Ltd., Nanjing, China).
Macrophages were digested with pancreatin and 1–5×10⁵
macrophages were transferred to an Eppendorf tube and washed twice
with 1 ml phosphate-buffered saline, followed by centrifugation at
134 × g for 10 min at 4°C. Cells were resuspended in binding buffer
(500 μl; Promega Corporation). A total of 5 μl
Annexin V-fluorescein isothiocyanate (FITC) was added to the
solution, followed by 5 μl PI. Cells were incubated for 5–15
min in the dark at room temperature; assessment by flow cytometry
was performed within 1 h of the conclusion of the incubation. The
green fluorescence of Annexin V-FITC was examined by the FL1
channel and the red fluorescence of PI was examined by the FL2
channel. The excitation wavelength was 488 nm, and FITC and PI
fluorescence were examined through filters with wavelengths of 515
and >560 nm, respectively. The lower left quadrant (Q4) of the
scatter diagram exhibited healthy living cells
(FITC−/PI−); the lower right quadrant (Q3)
contained early stage apoptotic cells
(FITC+/PI−); and the upper right quadrant
(Q2) contained necrotic and late stage apoptotic cells
(FITC+/PI+). Apoptotic rate=early stage (Q3)
percentage+late stage (Q2) percentage.
SOX4 and caspase-3 protein expression
levels detected by western blotting
Following lysis of macrophages with protein lysis
buffer [50 mM Tris/HCl, 150 mM NaCl, 50 mM NaF, 1 mM
Na4P2O7·10 H2O, 0.1%
deoxycorticosterone, 1.0% Nonidet P40, 50 μl of
Na3VO4 and Halt Protease Inhibitor Cocktail
(Pierce; Thermo Fisher Scientific, Inc.)], protein concentration
was measured by the bicinchoninic method (25). Protein (50 μg) was loaded
onto a 10% SDS-PAGE gel for electrophoresis at 200 V for 1 h.
Protein was transferred onto polyvinylidene difluoride membranes.
Membranes were blocked with 5% skim milk and probed with primary
rabbit anti-SOX4 (1:500; ab80261; Abcam, Cambridge, MA, USA),
anti-caspase-3 (1:500; ab4051; Abcam) and anti-β-actin (1:1,000;
ab8227, Abcam) overnight on a shaker at 4°C. The membranes were
then washed in Tris-buffered saline three times. The membranes were
subsequently incubated with the secondary goat anti-rabbit
horseradish peroxidase-conjugated antibody (1:2,000; ab6721; Abcam)
at room temperature for 1 h and visualized with Enhanced
Chemiluminescence Plus reagent (GE Healthcare Life Sciences,
Chalfont, UK). The protein bands were scanned by a GeneGenius
automated gel imaging system (Syngene, Frederick, MD, USA) and
analyzed with GeneTools software (version 4.0; Syngene).
Statistical analysis
The data was analyzed with SPSS software version
19.0 (IBM SPSS, Armonk, NY, USA), using the mean ± standard
deviation to denote the measurement data, on which normality tests
were conducted. The comparison between two groups or among multiple
groups was performed using independent sample t-test or
one-way analysis of variance (uniformity test of error variance was
performed prior to analysis), respectively. The comparison between
any two means was conducted using the least significant difference
t-test. P<0.05 was considered to indicated a
statistically significant difference.
Results
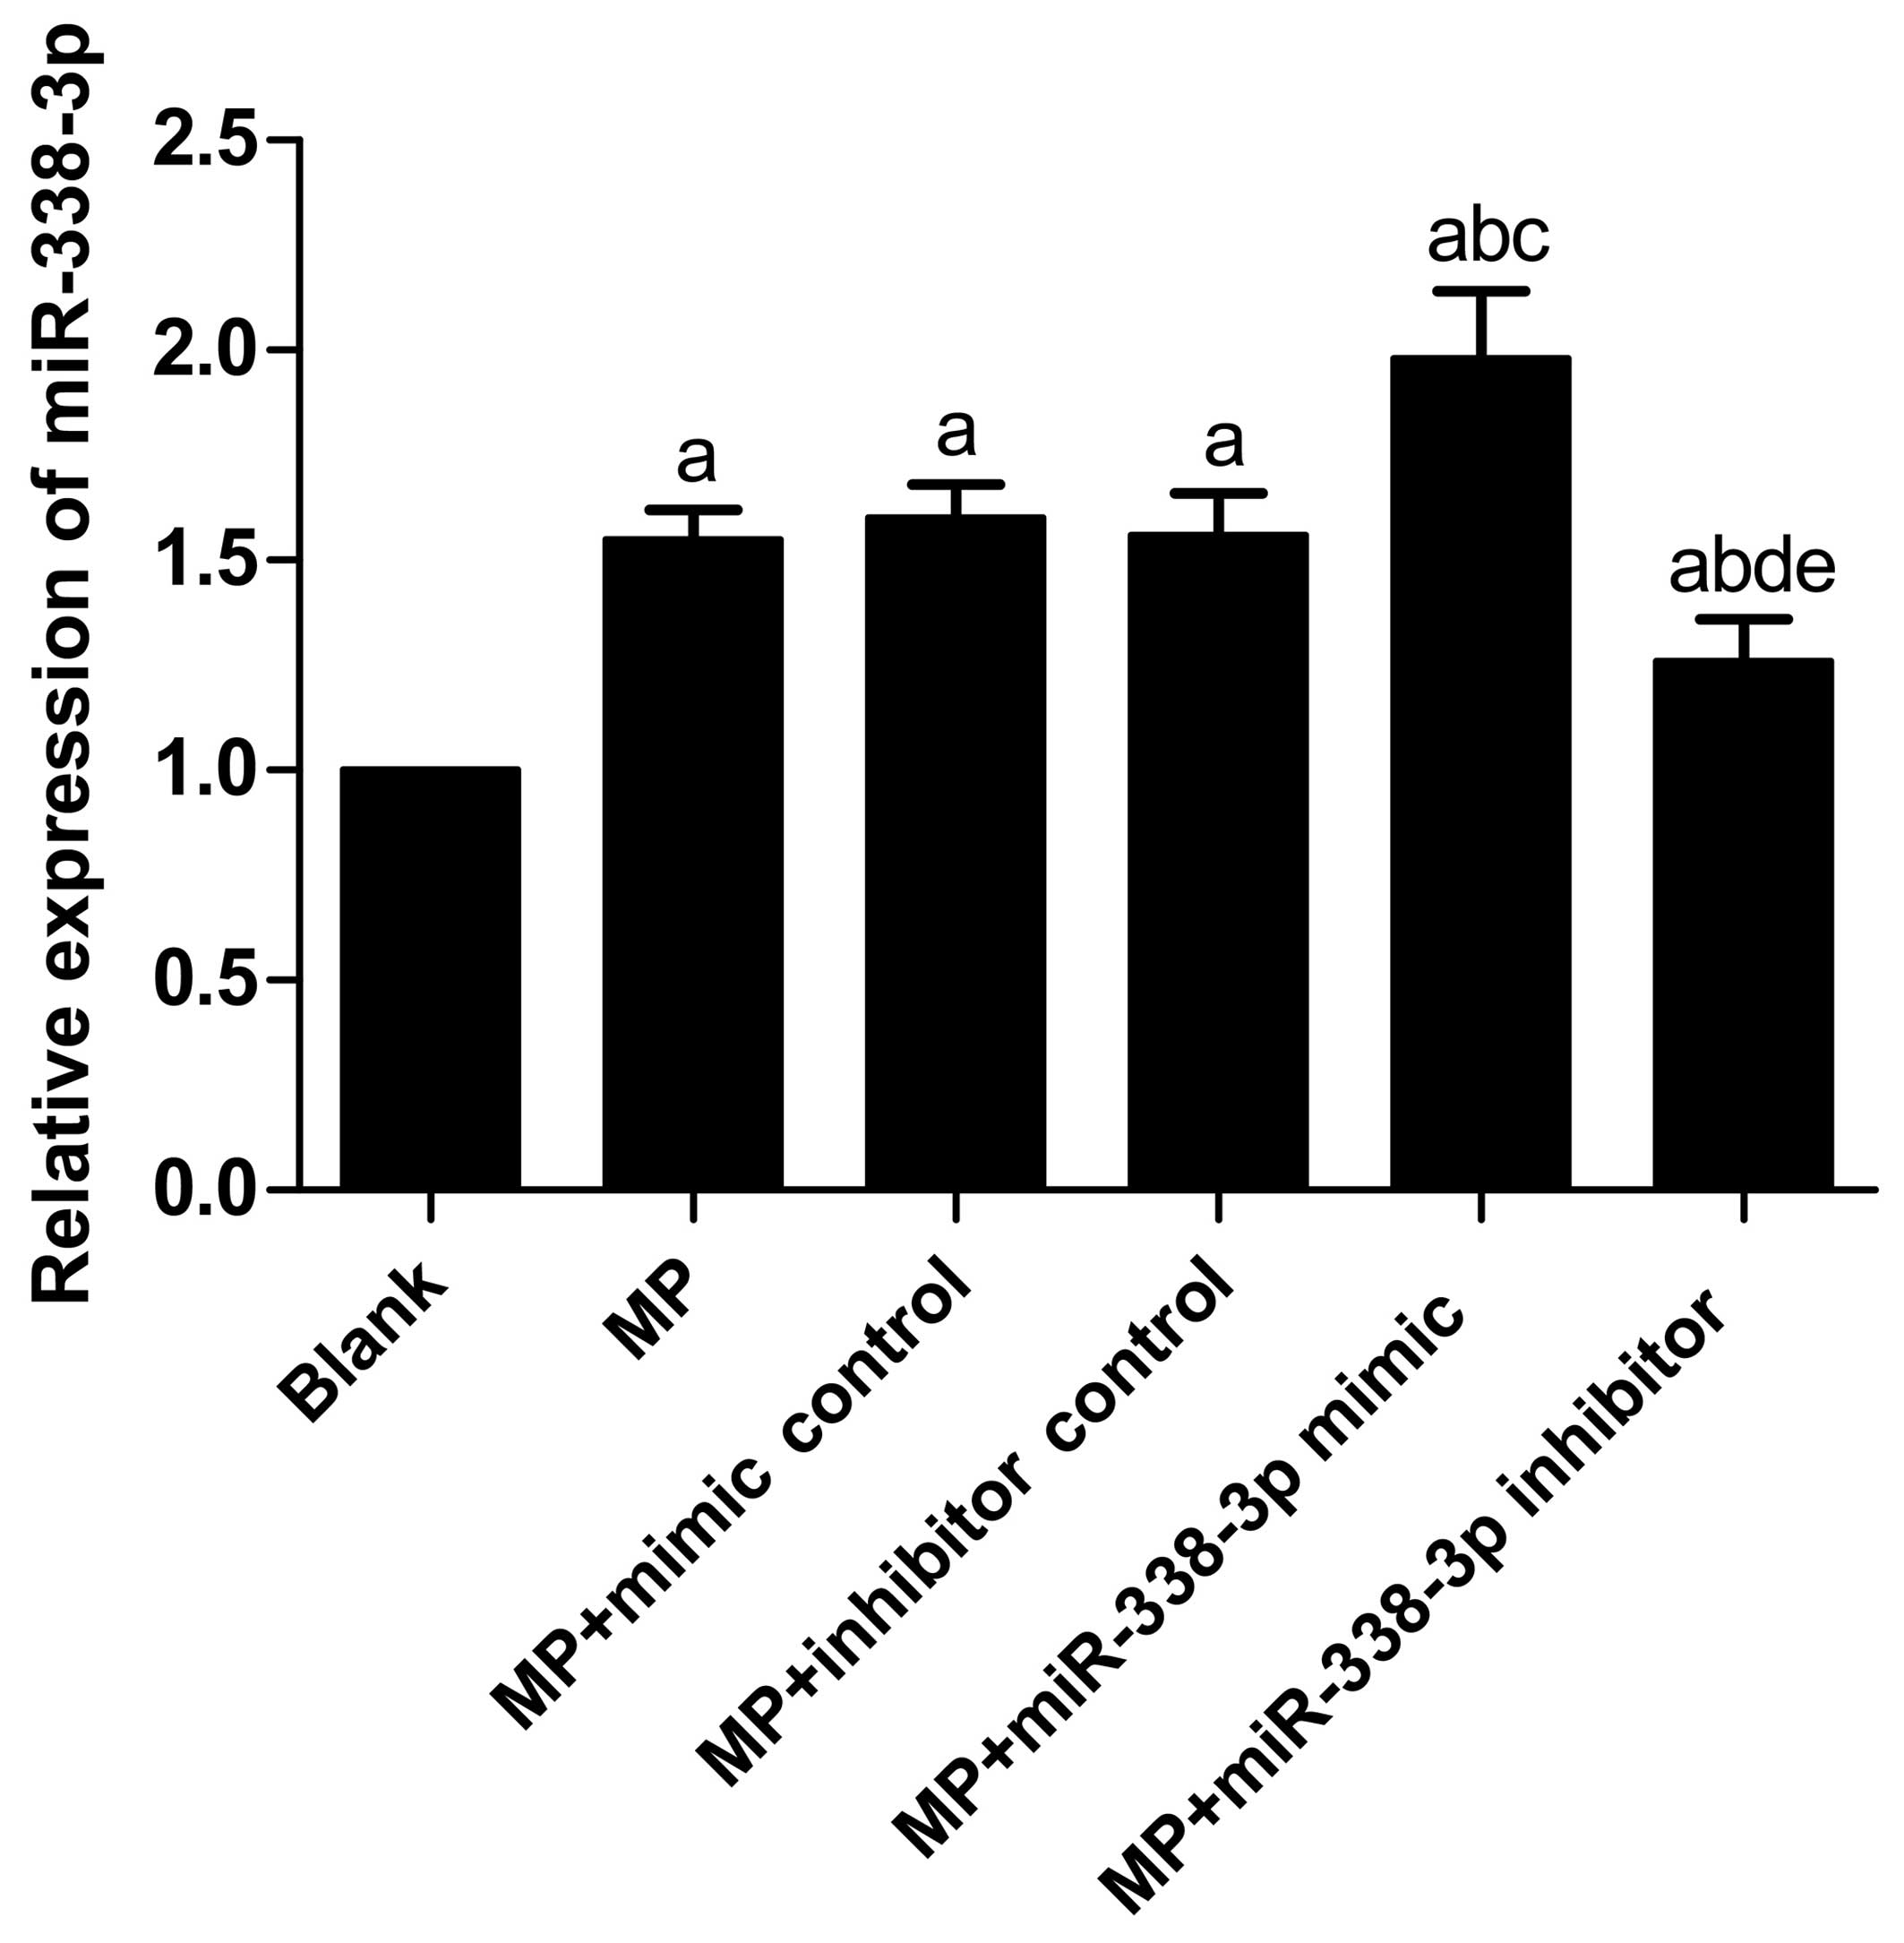
Variations in miR-338-3p expression
levels in MP-treated macrophages
Following treatment with MP, miR-338-3p expression
levels in the MP group (P<0.001), MP+mimic control group
(P<0.001), MP+inhibitor control group (P<0.001),
MP+miR-338-3p mimic group (P<0.001) and MP+miR-338-3p inhibitor
group (P=0.006) increased significantly compared with the blank
(untreated) group (Table III;
Fig. 1). No significant
differences were observed in miR-338-3p expression levels between
the MP group and the MP+mimic control and MP+inhibitor control
groups (P=0.521 and 0.936, respectively). In addition, no
significant differences were observed in miR-338-3p expression
levels between the MP+mimic control group and MP+inhibitor control
group (P=0.574). Compared with the MP+mimic control group, the
miR-338-3p expression level in the MP+miR-338-3p mimic group
increased significantly (P<0.001); compared with the
MP+inhibitor control group, the miR-338-3p expression level in the
MP+miR-338-3p inhibitor group decreased significantly
(P=0.003).
| Table IIIRelative miR-338-3p expression levels
detected by reverse transcription-quantitative polymerase chain
reaction. |
Table III
Relative miR-338-3p expression levels
detected by reverse transcription-quantitative polymerase chain
reaction.
| Group | Relative expression
of miR-338-3p |
|---|
| Blank | 1.00±0.00 |
| MP | 1.55±0.07a |
| MP+mimic
control | 1.60±0.08a |
| MP+inhibitor
control | 1.56±0.10a |
| MP+miR-338-3p
mimic | 1.98±0.16a–c |
| MP+miR-338-3p
inhibitor | 1.26±0.10a,b,d,e |
Apoptotic rate in MP-treated
macrophages
The apoptotic rate in the blank group was
7.70±1.83%; however, the rate the MP group (P<0.001), MP+mimic
control group (P<0.001), MP+inhibitor control group
(P<0.001), MP+miR-338-3p mimics group (P<0.001) and
MP+miR-338-3p inhibitors group (P=0.013) increased significantly
(Fig. 2). The apoptosis rates of
the MP+mimic control group (23.95±3.15%) and MP+inhibitor control
group (24.05±2.90%) were not significantly different from that of
the MP group (23.28±2.43%; P=0.720 and 0.679, respectively). No
significant differences were observed in apoptotic rate between the
MP+mimic control group and MP+inhibitor control group (P=0.956).
Compared with the MP+mimic control group, the apoptotic rate of the
MP+miR-338-3p mimic group increased significantly (35.40±5.22%;
P<0.001); compared with the MP+inhibitor control group, the
apoptotic rate of the MP+miR-338-3p inhibitor group decreased
significantly (13.01±1.02%; P<0.001).
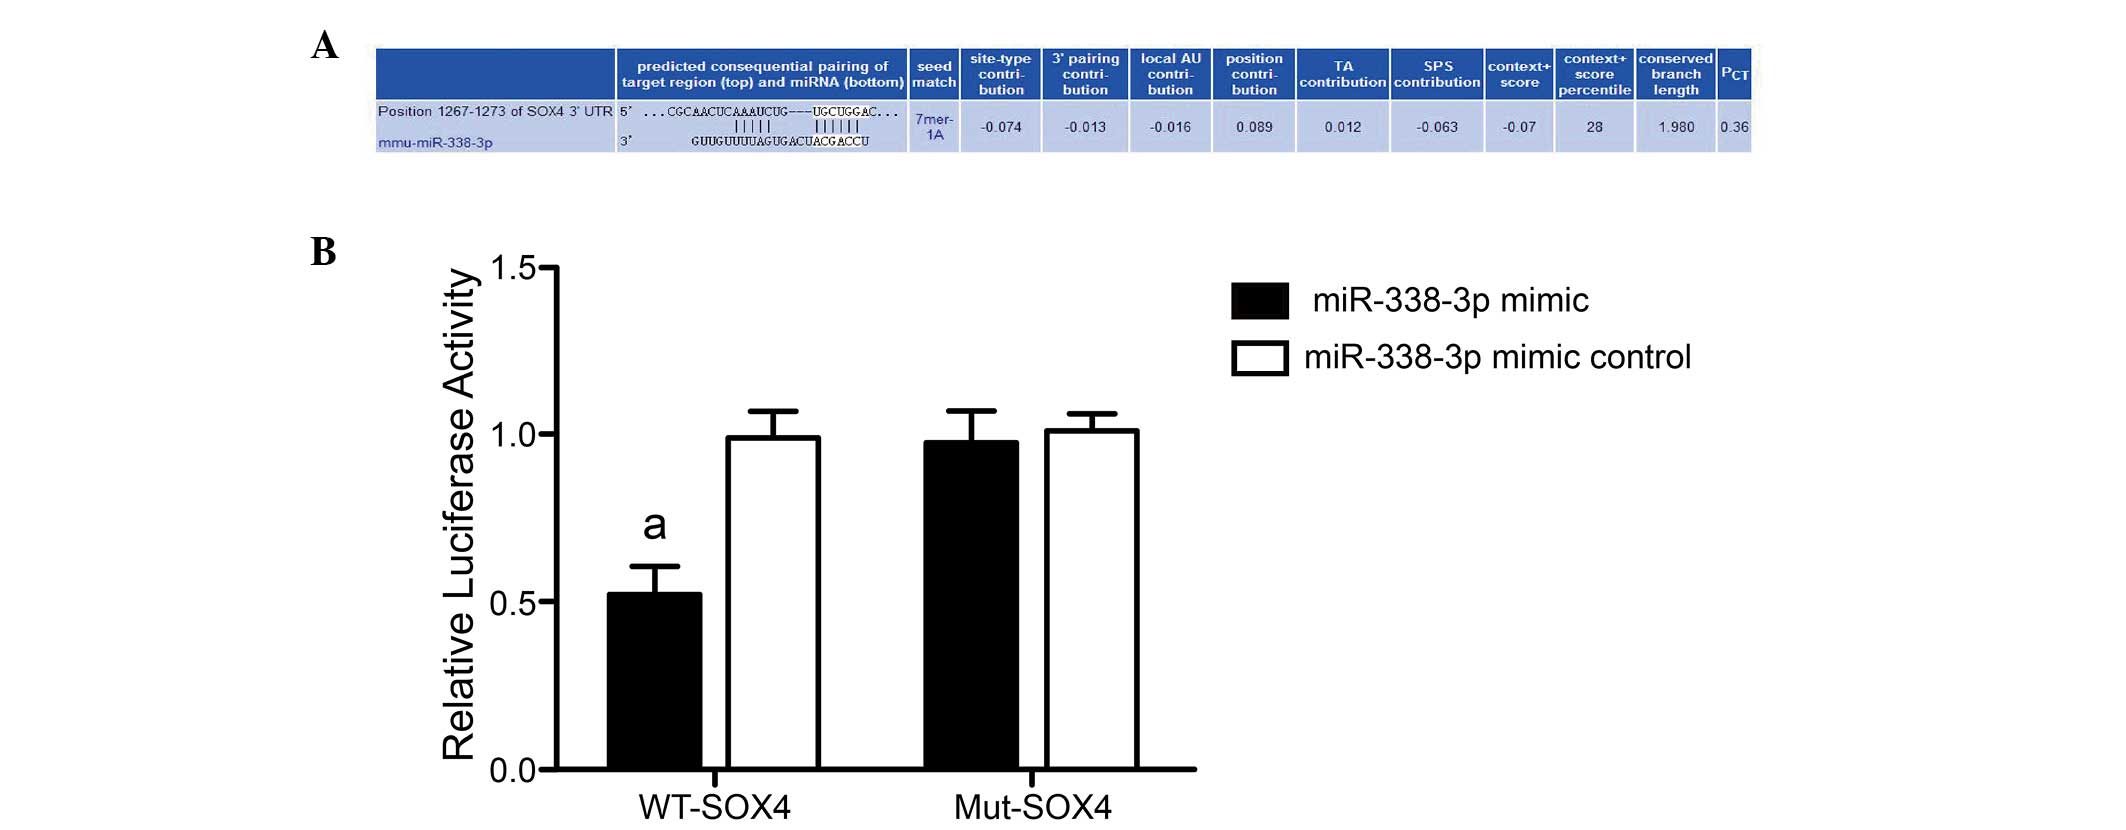
SOX4 was verified as the target gene of
miR-338-3p using a dual-luciferase reporter gene system
Online bioinformatics prediction software
TargetScan, PicTar and microRNA.org
predicted that the 3′-UTR in the SOX4 gene mRNA contained a locus
matching the mmu-miR-338-3p mature sequence, indicating that SOX4
may be the target gene of miR-338-3p (Fig. 3A). A dual-luciferase reporter gene
system was adopted to further verify whether SOX4 was the target
gene on which miR-338-3p directly acted. The luciferase signal of
miR-338-3p mimic and pmirGLO-SOX4-3′-UTR co-transfection group
decreased by 50% compared with the other groups (miR-338-3p mimic
control+WT-SOX4, miR-338-3p mimic+Mut-SOX4 and miR-338-3p mimic
control+Mut-SOX4 groups; P=0.003, 0.002 and 0.003, respectively).
However, when the mutated control pmirGLO-SOX4 mut-3′-UTR was
co-transfected, the luciferase signal did not decrease and no
significant differences occurred among groups regardless of the
expression of miR-338-3p mimic or mimic control (miR-338-3p mimic
control+WT-SOX4 group vs. miR-338-3p mimic+Mut-SOX4 group, P=0.887;
miR-338-3p mimic control+WT-SOX4 group vs. miR-338-3p mimic
control+Mut-SOX4 group, P=0.810; miR-338-3p mimic+Mut-SOX4 group
vs. miR-338-3p mimic control+Mut-SOX4 group, P=0.692) (Fig. 3B). The result demonstrated that
SOX4 expression was inhibited following miR-338-3p binding to the
appropriate site in the 3′-UTR of SOX4. SOX4 may therefore be the
target gene that miR-338-3p directly regulates.
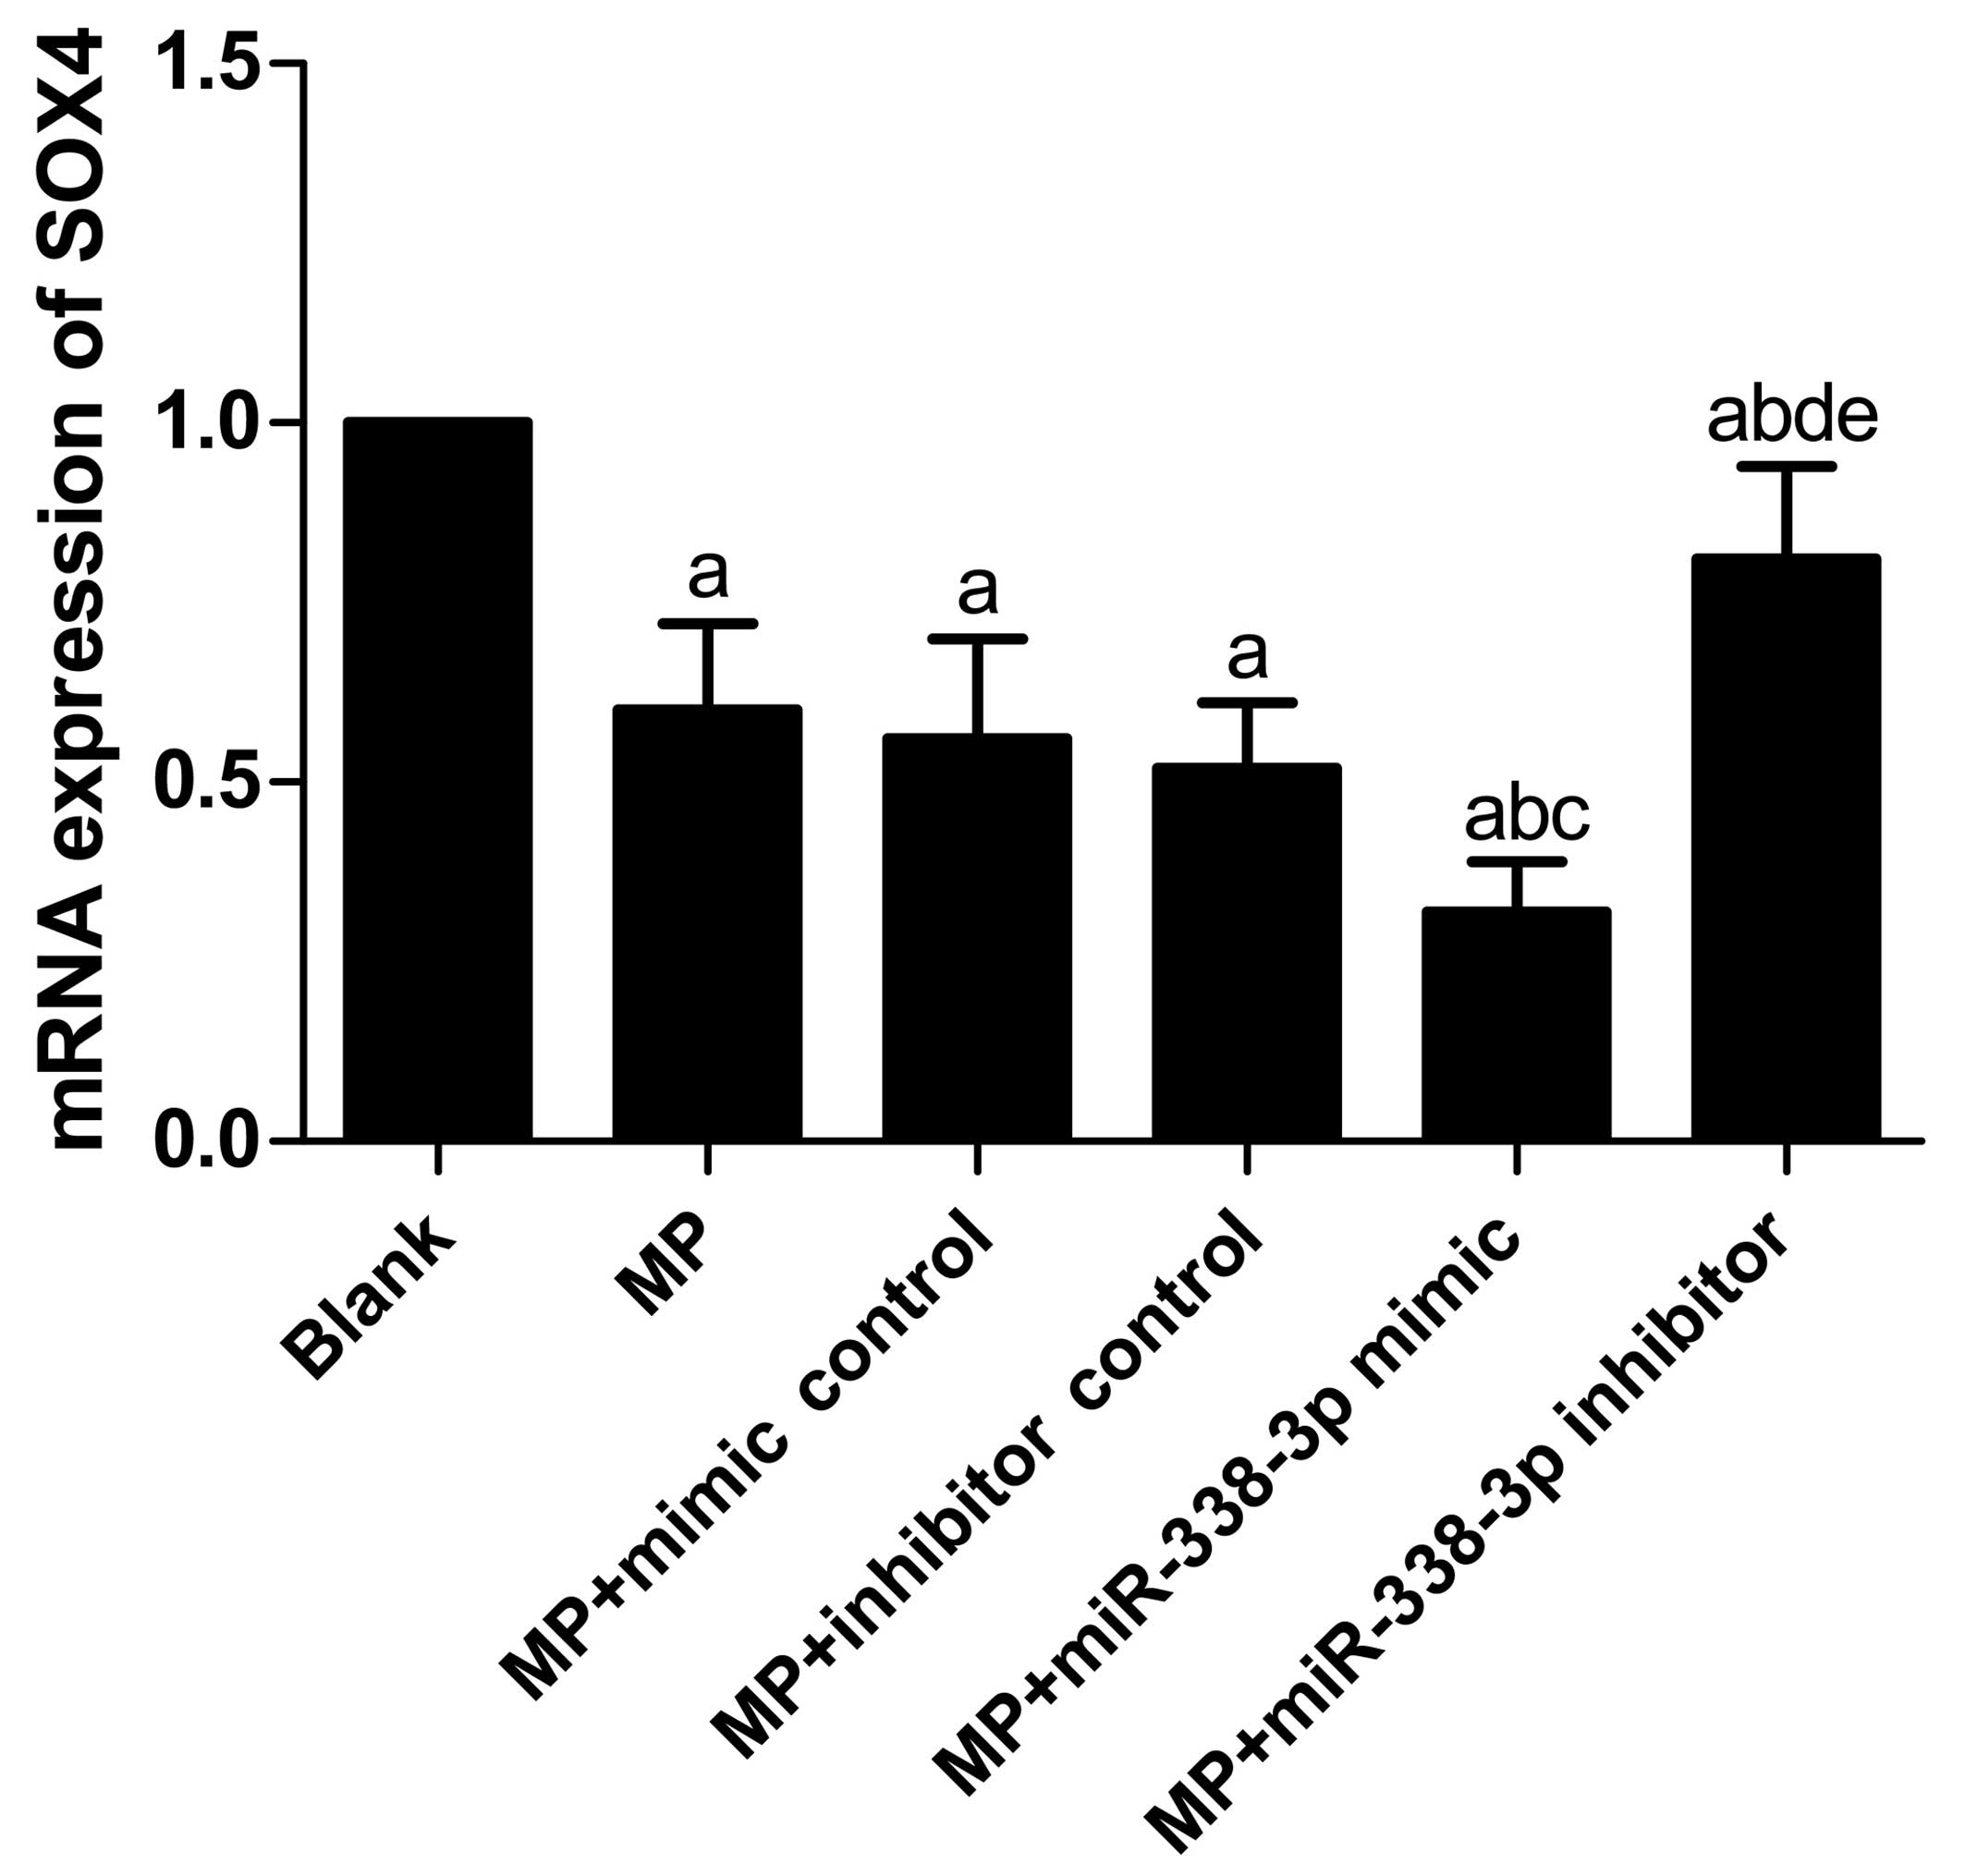
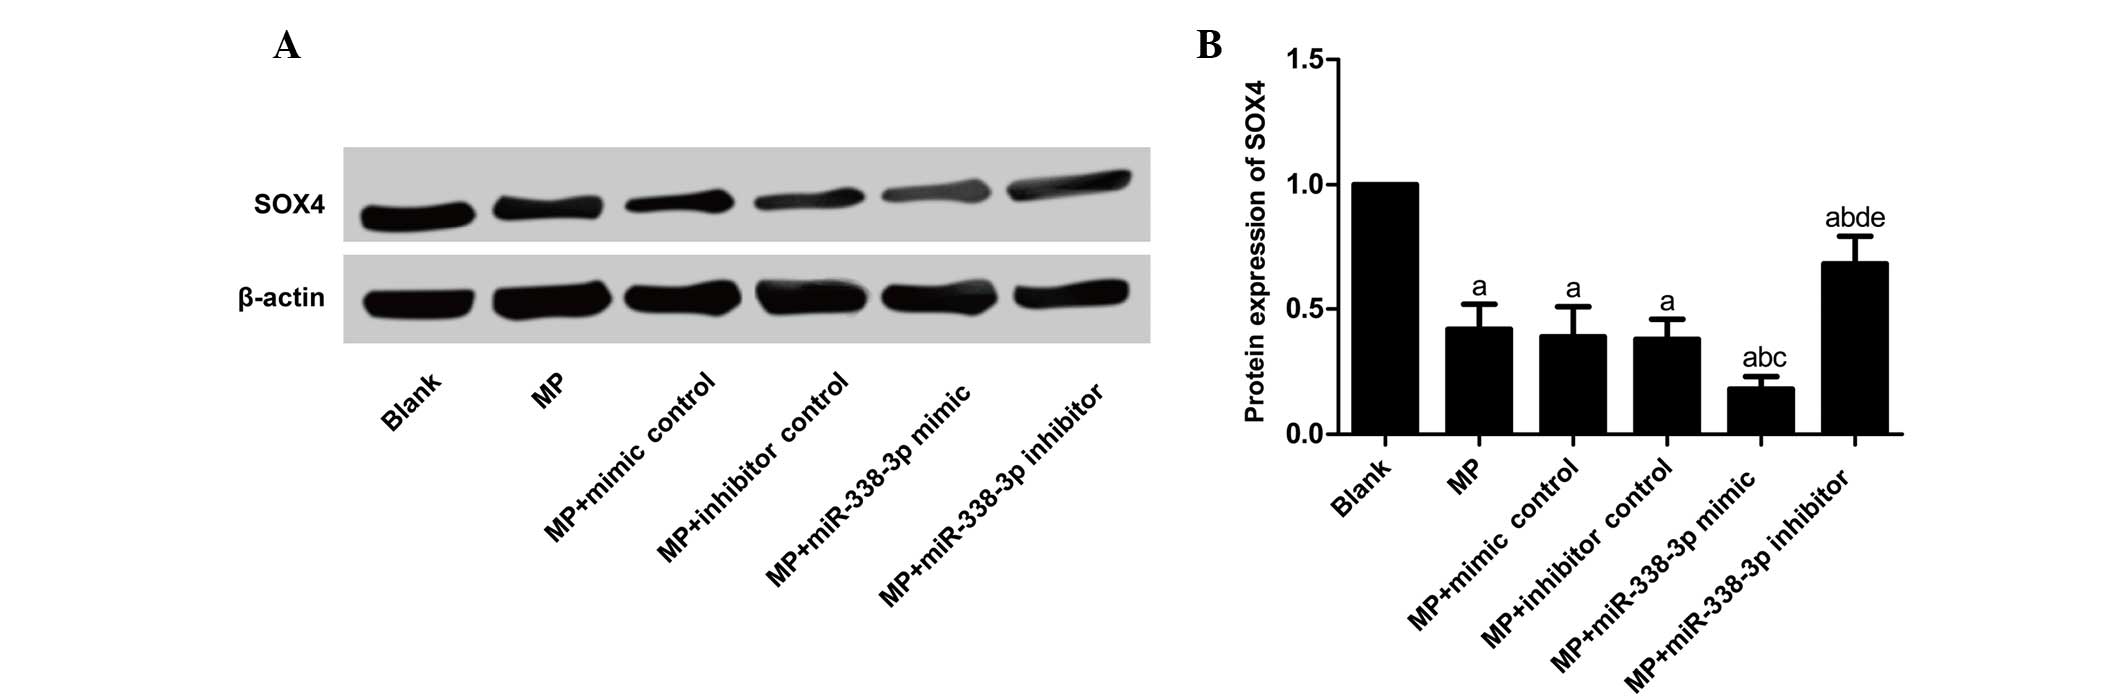
Effects of miR-338-3p on SOX4 mRNA and
protein expression levels in MP-treated macrophages
SOX4 mRNA (Table
IV; Fig. 4) and protein
(Table IV; Fig. 5) expression levels decreased
significantly in the MP group (P<0.001), MP+mimic control group
(P<0.001), MP+inhibitor control group (P<0.001),
MP+miR-338-3p mimics group (P<0.001) and MP+miR-338-3p
inhibitors group (P=0.040 and P<0.001, for mRNA and protein
expression, respectively) compared with the blank group. SOX4 mRNA
and protein expression levels showed no significant differences
between the MP group and the MP+mimic control and MP+inhibitor
control groups (mRNA expression, P=0.616 and 0.361, respectively;
protein expression, P=0.681 and 0.584, respectively). Compared with
the MP+mimic control group, SOX4 mRNA and protein expression levels
in the MP+miR-338-3p mimic group decreased significantly (mRNA
expression, P=0.016; protein expression, P=0.005); compared with
the MP+inhibitor control group, SOX4 mRNA and protein expression
levels in the MP+miR-338-3p inhibitor group increased significantly
(mRNA expression, P=0.011; protein expression, P=0.001).
| Table IVRelative mRNA and protein expression
levels of SOX4 detected by reverse transcription-quantitative
polymerase chain reaction and western blotting. |
Table IV
Relative mRNA and protein expression
levels of SOX4 detected by reverse transcription-quantitative
polymerase chain reaction and western blotting.
| Group | Relative SOX4 mRNA
expression | Relative SOX4
protein expression |
|---|
| Blank | 1.00±0.00 | 1.00±0.00 |
| MP | 0.60±0.12a | 0.42±0.10a |
| MP+mimic
control | 0.56±0.14a | 0.39±0.12a |
| MP+inhibitor
control | 0.52±0.09a | 0.38±0.08a |
| MP+miR-338-3p
mimic | 0.32±0.07a,b | 0.18±0.05a–c |
| MP+miR-338-3p
inhibitor | 0.81±0.13a,c,d,e | 0.68±0.11a,c,d,e |
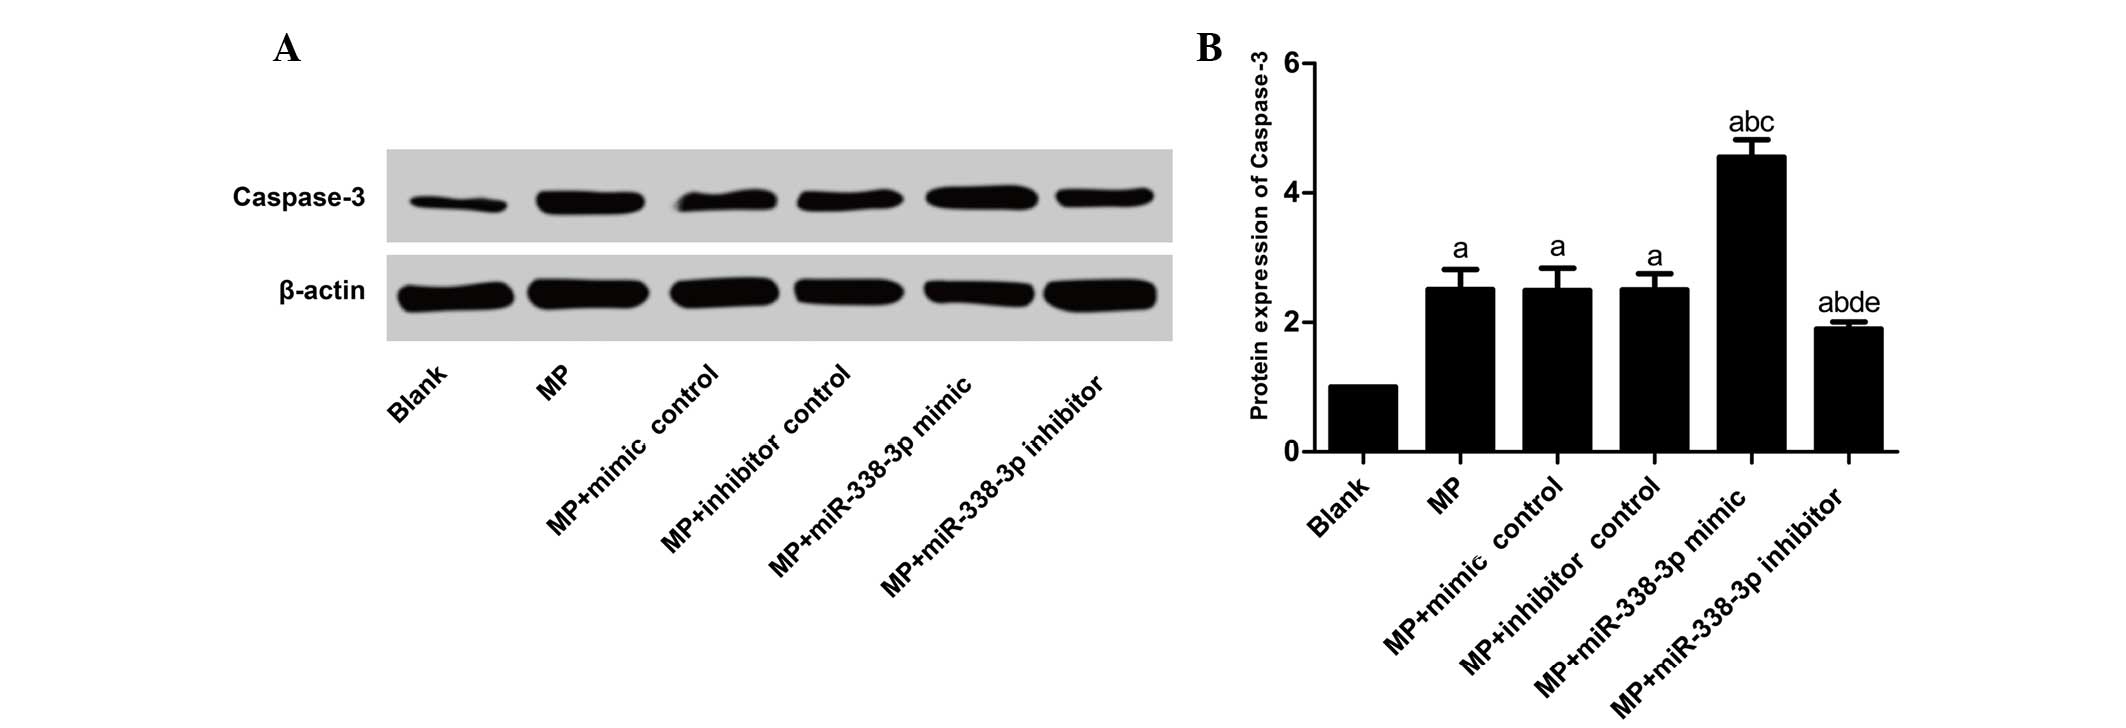
Effects of miR-338-3p on the
apoptosis-associated factor, caspase-3, protein expression levels
in MP-treated macrophages
Caspase-3 protein expression levels (Table V; Fig.
6) in the MP, MP+inhibitor control and MP+mimic control groups
increased significantly compared with the blank group (P<0.001).
No significant differences were observed between the MP group and
the MP+mimic control and MP+inhibitor control groups (P=0.921 and
0.962, respectively), as well as between the MP+mimic control group
and MP+inhibitor control group (P=0.962). Compared with the blank
group, caspase-3 expression levels in the MP+miR-338-3p inhibitor
and MP+miR-338-3p mimic groups increased significantly (P<0.001
and P=0.001, respectively). Compared with the MP+mimics control
group, caspase-3 protein expression levels in the MP+miR-338-3p
mimic group increased significantly (P<0.001); compared with the
MP+inhibitor control group, caspase-3 protein expression levels in
the MP+miR-338-3p inhibitor group decreased significantly
(P=0.012).
| Table VRelative protein expression levels of
caspase-3 detected by western blotting. |
Table V
Relative protein expression levels of
caspase-3 detected by western blotting.
| Group | Relative caspase-3
protein expression |
|---|
| Blank | 0.99±0.12 |
| MP | 2.51±0.31a |
| MP+mimic
control | 2.49±0.35a |
| MP+inhibitor
control | 2.50±0.25a |
| MP+miR-338-3p
mimic | 4.55±0.27a–c |
| MP+miR-338-3p
inhibitor | 1.90±0.11a,b,d,e |
Discussion
Previous studies have demonstrated that MP promotes
apoptosis (11,12). miR-338-3p has been revealed to
suppress signaling pathways, including p38, mitogen-activated
protein kinase and AKT, which additionally suppress the
proliferation and migration of cancer cells (20). Therefore, MP may promote apoptosis
by regulating the expression of miR-338-3p. The aims of the present
study were to investigate the association between MP treatment and
the expression levels of miR-338-3p, define the underlying
mechanism of the effects of miR-338-3p, and investigate whether
miR-338-3p is a potential target molecule for the diagnosis and
treatment of cancer.
In the present study, MP significantly increased the
expression levels of miR-338-3p and enhanced apoptosis. The
apoptosis rate decreased significantly when miR-338-3p was
inhibited. Previous studies have demonstrated that miR-338-3p
promotes apoptosis of cancer cells (26,27).
In the present study, it was demonstrated that miR-338-3p may
target the SOX4 gene and decrease SOX4 mRNA and protein expression
levels. According to a previous study, SOX4 expression levels were
significantly upregulated during cancer (28), which may inhibit apoptosis
(29,30). SOX4 suppresses apoptosis by
inhibiting the expression of caspase-3, which may result in the
proliferation of cancer cells (31). miR-338-3p may suppress the
overexpression of SOX4 and prevent the decrease in caspase-3
expression. Therefore, following MP treatment, the increased
expression levels of miR-338-3p would decrease the expression
levels of SOX4, resulting in an increase in caspase-3 expression
levels and the promotion of apoptosis. In the present study, the
suppression of SOX4 expression by miR-338-3p was prevented by
miR-338-3p inhibitors, resulting in a significant decrease in
protein expression levels of caspase-3. This resulted in a decrease
in the apoptosis rate. Consistent with previous studies, MP
promoted apoptosis in the present study (11–13).
Thus, upregulated expression of miR-338-3p may be a primary
mediator of the therapeutic effect exerted by MP.
On the other hand, a previous study observed that
partial miR expression was easily modulated under the influence of
MP (32); in addition, numerous
miRs have been demonstrated to exhibit increased expression during
addiction (31,33,34).
Therefore, the upregulated expression of miR-338-3p following
MP-treatment may be associated with the effects of addiction. The
detailed underlying mechanism of this effect remains to be
elucidated. However, the side effects associated with MP should not
be ignored, as overuse of MP may result in abnormal apoptosis of
cells, particularly nerve cells (13,35).
Strategies to increase miR-338-3p expression in the absence of MP
may be of potential benefit in cancer treatment (21).
In conclusion, the results of the present study
demonstrate that MP treatment upregulated the expression levels of
miR-338-3p and enhanced its suppression of SOX4 expression, which
resulted in increased expression of caspase-3 and increased
apoptosis. The apoptosis rate decreased when the expression of
miR-338-3p was inhibited. miR-338-3p may be important in MP
treatment of cancer, as a mediator of MP-induced apoptosis. The
upregulation of miR-338-3p expression provides a potential strategy
for the treatment of cancer.
References
|
1
|
Farazi TA, Hoell JI, Morozov P and Tuschl
T: MicroRNAs in human cancer. Adv Exp Med Biol. 774:1–20. 2013.
View Article : Google Scholar : PubMed/NCBI
|
|
2
|
Yu B, Qian T, Wang Y, Zhou S, Ding G, Ding
F and Gu X: miR-182 inhibits Schwann cell proliferation and
migration by targeting FGF9 and NTM, respectively at an early stage
following sciatic nerve injury. Nucleic Acids Res. 40:10356–10365.
2012. View Article : Google Scholar : PubMed/NCBI
|
|
3
|
Rahmann S, Martin M, Schulte JH, Köster J,
Marschall T and Schramm A: Identifying transcriptional miRNA
biomarkers by integrating high-throughput sequencing and real-time
PCR data. Methods. 59:154–163. 2013. View Article : Google Scholar
|
|
4
|
Gurtan AM and Sharp PA: The role of miRNAs
in regulating gene expression networks. J Mol Biol. 425:3582–3600.
2013. View Article : Google Scholar : PubMed/NCBI
|
|
5
|
Kong X, Xu X, Yan Y, Guo F, Li J, Hu Y,
Zhou H and Xun Q: Estrogen regulates the tumour suppressor
MiRNA-30c and its target gene, MTA-1, in endometrial cancer. PLoS
One. 9:e908102014. View Article : Google Scholar : PubMed/NCBI
|
|
6
|
Fiori E, Babicola L, Andolina D, Coassin
A, Pascucci T, Patella L, Han YC, Ventura A and Ventura R:
Neurobehavioral alterations in a genetic murine model of Feingold
Syndrome 2. Behav Genet. 45:547–559. 2015. View Article : Google Scholar : PubMed/NCBI
|
|
7
|
Poliseno L, Salmena L, Zhang J, Carver B,
Haveman WJ and Pandolfi PP: A coding-independent function of gene
and pseudogene mRNAs regulates tumour biology. Nature.
465:1033–1038. 2010. View Article : Google Scholar : PubMed/NCBI
|
|
8
|
Sayed D and Abdellatif M: MicroRNAs in
development and disease. Physiol Rev. 91:827–887. 2011. View Article : Google Scholar : PubMed/NCBI
|
|
9
|
Takahashi RU, Miyazaki H and Ochiya T: The
Roles of MicroRNAs in Breast Cancer. Cancers (Basel). 7:598–616.
2015. View Article : Google Scholar
|
|
10
|
Dahiya N and Atreya CD: MicroRNAs and
Major Blood-borne Infectious Viral Diseases. Microrna. 2:212–218.
2014. View Article : Google Scholar : PubMed/NCBI
|
|
11
|
Bimonte S, Barbieri A, Rea D, Palma G,
Luciano A, Cuomo A, Arra C and Izzo F: Morphine promotes tumor
angiogenesis and increases breast cancer progression. Biomed Res
Int. 2015:1615082015. View Article : Google Scholar : PubMed/NCBI
|
|
12
|
Nomura Y, Kawaraguchi Y, Sugimoto H,
Furuya H and Kawaguchi M: Effects of morphine and fentanyl on
5-fluorouracil sensitivity in human colon cancer HCT116 cells. J
Anesth. 28:298–301. 2014. View Article : Google Scholar
|
|
13
|
Gonzalez-Nunez V, Noriega-Prieto JA and
Rodriguez RE: Morphine modulates cell proliferation through mir133b
&mir128 in the neuroblastoma SH-SY5Y cell line. Biochim Biophys
Acta. 1842:566–572. 2014. View Article : Google Scholar : PubMed/NCBI
|
|
14
|
Zheng H, Zeng Y, Chu J, Kam AY, Loh HH and
Law PY: Modulations of NeuroD activity contribute to the
differential effects of morphine and fentanyl on dendritic spine
stability. J Neurosci. 30:8102–8110. 2010. View Article : Google Scholar : PubMed/NCBI
|
|
15
|
Sanchez-Simon FM, Zhang XX, Loh HH, Law PY
and Rodriguez RE: Morphine regulates dopaminergic neuron
differentiation via miR-133b. Mol Pharmacol. 78:935–942. 2010.
View Article : Google Scholar : PubMed/NCBI
|
|
16
|
Nadeau SE: Opioids for chronic noncancer
pain: To prescribe or not to prescribe-What is the question?
Neurology. 85:646–651. 2015. View Article : Google Scholar : PubMed/NCBI
|
|
17
|
Oosten AW, Oldenmenger WH, Mathijssen RH
and van der Rijt CC: A systematic review of prospective studies
reporting adverse events of commonly used opioids for
Cancer-Related Pain: A call for the use of standardized outcome
measures. J Pain. 16:935–946. 2015. View Article : Google Scholar : PubMed/NCBI
|
|
18
|
Li MC, Yu JH, Yu SS, Chi YY and Xiang YB:
MicroRNA-873 Inhibits Morphine-Induced Macrophage Apoptosis by
Elevating A20 Expression. Pain Med. 16:1993–1999. 2015. View Article : Google Scholar : PubMed/NCBI
|
|
19
|
He Y, Yang C, Kirkmire CM and Wang ZJ:
Regulation of opioid tolerance by let-7 family microRNA targeting
the mu opioid receptor. J Neurosci. 30:10251–10258. 2010.
View Article : Google Scholar : PubMed/NCBI
|
|
20
|
Peng Y, Liu YM, Li LC, Wang LL and Wu XL:
MicroRNA-338 inhibits growth, invasion and metastasis of gastric
cancer by targeting NRP1 expression. PLoS One. 9:e944222014.
View Article : Google Scholar : PubMed/NCBI
|
|
21
|
Guo B, Liu L, Yao J, Ma R, Chang D, Li Z,
Song T and Huang C: miR-338-3p suppresses gastric cancer
progression through a PTEN-AKT axis by targeting P-REX2a. Mol
Cancer Res. 12:313–321. 2014. View Article : Google Scholar : PubMed/NCBI
|
|
22
|
Wood MM and Cousins MJ: Iatrogenic
neurotoxicity in cancer patients. Pain. 39:1–3. 1989. View Article : Google Scholar : PubMed/NCBI
|
|
23
|
Livak KJ and Schmittgen TD: Analysis of
relative gene expression data using real-time quantitative PCR and
the 2(−Delta Delta C(t)) Method. Methods. 25:402–408. 2001.
View Article : Google Scholar
|
|
24
|
Rogler CE, Levoci L, Ader T, Massimi A,
Tchaikovskaya T, Norel R and Rogler LE: MicroRNA-23b cluster
microRNAs regulate transforming growth factor-beta/bone
morphogenetic protein signaling and liver stem cell differentiation
by targeting Smads. Hepatology. 50:575–584. 2009. View Article : Google Scholar : PubMed/NCBI
|
|
25
|
Osnes T, Sandstad O, Skar V, Osnes M and
Kierulf P: Total protein in common duct bile measured by
acetonitrile precipitation and a micro bicinchoninic acid (BCA)
method. Scand J Clin Lad Invest. 53:757–763. 1993. View Article : Google Scholar
|
|
26
|
Li P, Chen X, Su L, Li C, Zhi Q, Yu B,
Sheng H, Wang J, Feng R, Cai Q, et al: Epigenentic silencing of
miR-338-3p contributed to tumorigenicity in gastric cancer by
targeting SSX2IP. PLoS One. 8:e667822013. View Article : Google Scholar
|
|
27
|
Chen X, Pan M, Han L, Lu H, Hao X and Dong
Q: miR-338-3p suppresses neuroblastoma proliferation, invasion and
migration through targeting PREX2a. FEBS Lett. 587:3729–3737. 2013.
View Article : Google Scholar : PubMed/NCBI
|
|
28
|
Gunes S, Yegin Z, Sullu Y, Buyukalpelli R
and Bagci H: SOX4 expression levels in urothelial bladder
carcinoma. Pathol Res Pract. 207:423–427. 2011. View Article : Google Scholar : PubMed/NCBI
|
|
29
|
Zhou Y, Wang X, Huang Y, Chen Y, Zhao G,
Yao Q, Jin C, Huang Y, Liu X and Li G: Down-regulated SOX4
expression suppresses cell proliferation, metastasis and induces
apoptosis in Xuanwei female lung cancer patients. J Cell Biochem.
116:1007–1018. 2015. View Article : Google Scholar : PubMed/NCBI
|
|
30
|
Jang SM, Kang EJ, Kim JW, Kim CH, An JH
and Choi KH: Transcription factor Sox4 is required for
PUMA-mediated apoptosis induced by histone deacetylase inhibitor,
TSA. Biochem Biophys Res Commun. 438:445–451. 2013. View Article : Google Scholar : PubMed/NCBI
|
|
31
|
Liu LW, Lu J, Wang XH, Fu SK, Li Q and Lin
FQ: Neuronal apoptosis in morphine addiction and its molecular
mechanism. Int J Clin Exp Med. 6:540–545. 2013.PubMed/NCBI
|
|
32
|
Li MD and van der Vaart AD: MicroRNAs in
addiction: Adaptation's middlemen? Mol Psychiatry. 16:1159–1168.
2011. View Article : Google Scholar : PubMed/NCBI
|
|
33
|
Dreyer JL: New insights into the roles of
microRNAs in drug addiction and neuroplasticity. Genome Med.
2:922010. View
Article : Google Scholar
|
|
34
|
Hollander JA, Im HI, Amelio AL, Kocerha J,
Bali P, Lu Q, Willoughby D, Wahlestedt C, Conkright MD and Kenny
PJ: Striatal microRNA controls cocaine intake through CREB
signalling. Nature. 466:197–202. 2010. View Article : Google Scholar : PubMed/NCBI
|
|
35
|
Rodríguez RE: Morphine and microRNA
Activity: Is There a Relation with Addiction? Front Genet.
3:2232012. View Article : Google Scholar : PubMed/NCBI
|