Introduction
Photodynamic therapy (PDT) is a method of treatment
that involves selective photosensitization of malignant cells,
usually by means of porphyrins, porphyrin analogs or other agents
with suitable photophysical qualities. The use of photodynamic
therapy results in direct cell damage or induction of cell death
(1). Certain photosensitizers
accumulate in the endothelial cells of vascular tissue. This leads
to the initiation of thrombogenic sites within the vessel and
results in a cascade of responses, including platelet aggregation,
leukocyte adhesion, the release of vasoactive molecules, increases
in vascular permeability and vessel constriction. The first step in
the photodynamic process is associated with the localization of the
photosensitizing agent in subcellular loci. These can be highly
specific or quite broad, and have been reported to include the
endoplasmic reticulum, mitochondria, Golgi, lysosomes and plasma
membranes (2). The majority of
photosensitizers are hydrophobic and are thus attracted to
membranes.
Following incubation with a photosensitizing agent,
cells are exposed to light at a wavelength corresponding to an
absorbance band (most commonly at a longer wavelength of red
visible light 620–690 nm). As a result of a photophysical reaction,
numerous reactive oxygen species (ROS) are released. The singlet
molecular oxygen is the most unstable of all ROS and can
translocate no further than microns from the site of their
formation. Therefore, photodamage can be highly precise. Other ROS
formed downstream from singlet oxygen are able to migrate a further
distance from the primary site (3,4). As
they are highly reactive with cellular components, such as
proteins, lipids and DNA, ROS are a source of cytotoxicity. If the
ROS are not neutralized by cellular detoxifying and antioxidant
enzymes, they may lead to the destruction of the cellular machinery
as a result of oxidative stress (3). The role of autophagy and apoptosis
appears to be crucial at this stage.
Autophagy is a complex 'self-eating' system
involving degradation of dispensable or impaired cellular
constituents by the actions of lysosomes. It primarily functions as
a cell survival, adaptive mechanism in conditions of nutrient
starvation, infections or protein aggregate-induced stress. In
mammalian cells, autophagy is one of the main clearance systems for
ROS-damaged organelles or irreparable oxidized cytosolic proteins.
Data show that ROS can activate autophagy; the consequences vary
from protection to the promotion of autophagic cell death (5).
Three different types of autophagy are identified:
Macroautophagy (MA), microautophagy and chaperone-mediated
autophagy (CMA). Initially, the formation of an isolation membrane
(phagophore) curves around a part of the cytoplasm and forms a
closed double membrane vesicle (autophagosome) (6). During its maturation,
microtubule-associated protein light-chain 3 (LC3-I) is detached
and then linked with phosphatidylethanolamine to form LC3-II, which
is recruited into an autophagosomal membrane. This action is
mediated by the autophagy-related (Atg) proteins Atg7 and Atg3
(7). Autophagosomes fuse with
lysosomes to form autolysosomes. During the degradation of the
intra-autophagosomal components the lipidated LC3-II is also
destroyed. Thus, LC3-II is a hallmark of autophagy (8–10).
In the settings of cancer, autophagy has a double
role depending on the stages of cancer. It can support tumor
suppression (at the early stage of tumorigenesis) or promote tumor
progression (at the advanced stages of tumor) (11). The tumor suppressor mechanism is
probably connected with the upregulation of the class I
phosphatidylininositol 3-kinase (PI3K) pathway in cancer cells and
may correspond with Beclin-1 function, deletion of which is
relatively common in breast, ovarian and prostate cancer (12). Autophagy upregulation upon cellular
detachment from the extracellular matrix also sustains cell
viability in metastasizing cells (12). Knockdown of essential autophagy
genes in tumor cells may potentiate the induction of cell
death.
Materials and methods
Photosensitisation
In all experiments, 3 mM precursor-5-ami-nolevulinic
acid (5-ALA; Sigma-Aldrich, Munich, Germany) was used for PDT, the
dose was established in our previous studies (Ziółkowski P et
al, unpublished data).
The light source at a wavelength of 630+/−20 nm
(obtained with a bandpass filter), was achieved with the Penta
lamps Teclas (Teclas, Lugano, Switzerland). The total light dose
was 4.5 J/cm2 and the fluence rate was 60
mW/cm2, which was applied 4 h after administration of
5-ALA.
Cell cultures
SW620 colon adenocarcinoma cells obtained from the
Institute of Immunology and Experimental Therapy (Wrocław, Poland)
were maintained in DMEM/F12 (Gibco, Thermo Fisher Scientific, Inc.,
Waltham, MA, USA) supplemented with 10% fetal bovine serum (FBS)
and 1% glutamine (GlutaMax, Thermo Fisher Scientific, Inc.) in 5%
CO2 at 37°C and a 95% humidified atmosphere. Cells were
counted in suspensions using a Countess Automated Cell Counter
(Invitrogen, Thermo Fisher Scientific, Inc.) and then seeded at a
density of 5×10⁴ and 4×10⁵ cells per well in
96- and 12-well culture plates (TPP, Trasadingen, Switzerland),
respectively, and cultured for another 48 h. Subsequently medium
was replaced by DMEM/F12 with 5-ALA (3 mM) for 4 h. After
incubation, the medium was replaced with FBS-free DMEM/F12 and
irradiation was performed with red light. After PDT, medium was
changed again to DMEM/F12.
Each experiment was conducted in triplicate and
cells were divided into 4 groups: Cells treated with PDT, cells
treated with precursors only, cells treated with light only or
untreated control cells.
Cell viability assays
Cell proliferation and PDT cytotoxicity were
determined prior to immunocytochemistry and western blot analysis
by a colorimetric assay with
3-(4,5-dimethylthiazol-2-yl)-2,5-diphenyltetrazolium bromide (MTT).
It is based on the reduction of a yellow soluble tetrazole to an
insoluble purple formazan in respiring cells. Cells were plated at
a density of 5×10⁴ cells per well in a 96-well plate and
cultured. Then, control cells and cells incubated with the
precursor photosensitizer were irradiated with light. Following
irradiation (24 h), cells were extensively washed with
phosphate-buffered saline (PBS) and incubated at 37°C for 4 h with
MMT/phenol-red free Dulbecco's modified Eagle's medium (DMEM)/F12
(v/v=1:9) (Gibco, Thermo Fisher Scientific, Inc.). The medium was
removed and 100 µl dimethyl sulfoxide (DMSO, Sigma-Aldrich)
was added to each well for 5 min. The optical absorbance (A) was
estimated at 490 nm using a BioTek ELX800 multi-well reader
(BioTek, Winooski, VT, USA). The absorbance in the control group
was counted as 100% cell viability. The percentage of viable cells
(VC) was evaluated according to: VC (%) = (A of experimental group
/ A of control group) × 100. Cell viability was estimated to be
95%.
Cell cultures and photosensitization
conditions for immunocytochemistry
Cells were plated at a density of 5×10⁴
cells per well in 3-well (each well of 14 mm in diameter),
epoxy-coated, diagnostics glass slides (Menzel-Glaser; Thermo
Fisher Scientific Inc.) and placed into humidified Petri dishes.
The growth and treatment conditions in the following section.
Cell cultures and photosensitization
conditions for western blot analysis
Cells were seeded in plastic 12-well plates
(4×10⁵ cells per well) and incubated with 5-ALA for 4 h
in the medium with 5% FBS without phenol red. Thereafter the medium
was replaced with the medium without serum and phenol red and cells
were exposed to the light source. After irradiation, the medium was
replaced with DMEM/F12. Following the 24-h incubation the medium
was removed by double rinsing with phosphate-buffered saline (PBS)
and the cells were lysed. Following the 24-h incubation western
blot analysis was performed.
Western blotting
Cells were rinsed twice with pre-cooled PBS and
treated with 200 µl/well lysis buffer [4% sodium dodecyl
sulfate (SDS), 0.1 M DTT in 0.1 M Tris/HCl buffer, pH 7.6]
containing protease and phosphatase inhibitors (1% cocktails,
Sigma-Aldrich). Samples were centrifuged at 15,000 × g for 30 min.
The supernatant was collected and the protein concentration was
determined by a spectrophotometer at 280 nm (PicoDrop 2000; Thermo
Fisher Scientific, Inc.). The protein extracts (25 µg) were
separated by 4–12% SDS-polyacrylamide gel electrophoresis
(Invitrogen, Thermo Fisher Scientific Inc.) and transferred to
nitrocellulose membranes (Amersham Hybond; GE Healthcare Life
Sciences, Little Chalfont, USA). The membrane was blocked with PBS
with 0.1% Tween-20 (pH 7.6 with 10% goat serum; Sigma-Aldrich) for
1 h at room temperature. Subsequently, the membranes were incubated
with the primary antibodies: Rabbit polyclonal anti-LC3 diluted
1:350 (cat. no. HPA052484; Sigma-Aldrich); rabbit polyclonal
anti-Atg7 diluted 1:500 (cat. no. sc-33211; Santa Cruz
Biotechnology, Inc., Santa Cruz, CA, USA) and rabbit polyclonal
anti-Beclin-1 diluted 1:250 (cat. no. HPA028949; Sigma-Aldrich),
overnight at 4°C. The membranes were then washed three times with
PBS and incubated with horseradish peroxidase-labeled secondary
goat anti-rabbit antibody (cat. no. sc-2030; Santa Cruz
Biotechnology, Inc.) for 1 h at room temperature and thereafter
washed again three times with PBS. The final color reaction was
detected using enhanced colori-metric western blotting
visualization reagents and the DAB Enhanced Liquid Substrate System
for Immunochemistry (Sigma-Aldrich). The image of the specific
protein bands was documented by Bio-Rad equipment (MolecularImager
Gel Doc TMXR+) and relevant software Image Lab Software v4.1
(Bio-Rad Laboratories, Hercules, CA, USA).
To normalize the loading differences a monoclonal
β-actin antibody against the housekeeping control β-actin was
used.
Immunocytochemistry
Immunocytochemistry was performed using the LSAB+
method (LSAB+ System-HRP; DAKO, Glostrup, Denmark). At indicated
times (0, 4, 8 and 20 h) following light exposure, cells were fixed
in 4% paraformaldehyde at 4°C for 10 min and subsequently washed
with PBS (0.1 M phosphate buffer, pH 7.4; and 0.15 M NaCl). Glass
slides containing cells were incubated with an endogenous
peroxidase blocking buffer and then with a protein blocking buffer.
Next, primary antibodies (anti-Beclin-1, dilution 1:100; anti-LC3,
dilution 1:250; Sigma Aldrich and anti-Atg7, dilution 1:100; from
Santa Cruz Biotechnology, Inc.) were added for overnight incubation
at 4°C. On the following day, the slides were incubated for 15 min
with biotinylated antibody and streptavidin-HRP, respectively. Then
they were twice rinsed with PBS and stained using
3,3′-diaminobenzidine in chromogen solution. Sections were
counterstained with Mayer's hematoxylin and then dehydrated in
graded alcohol, cleared in xylene and mounted with xylene based
mounting medium. For the negative staining control, the primary
antibody was omitted. Images were acquired using a light microscope
fitted with digital camera (Nicon Eclipse 80i with camera
DS-Fil-U2, Amsterdam, Netherlands) at magnifications of ×100 and
×200.
The protein expression of Beclin-1, LC3 and
Atg7-positive cells in the glass slides was defined using the
immunoreactivity score (IRS) as shown in Table I.
 | Table IImmunoreactivity score calculation
method. |
Table I
Immunoreactivity score calculation
method.
Intensity of staining
| Stained cells (%)
| IRS
|
|---|
| Score | Staining | Score | % stained | Score | Reaction |
|---|
| 0 | Negative | 0 | <5 | 0 | Negative |
| 1 | Weak | 1 | 5–25 | 1–2 | Weak |
| 2 | Moderate | 2 | 25–75 | 3–4 | Moderate |
| 3 | Strong | 3 | >75 | 6–9 | Strong |
Statistical analysis
Statistical analysis was performed using multiple
comparisons analysis of variance followed by Tukey's test. The
software used for the analysis was STATISTICA v.10 (StatSoft, Inc.,
Tulsa, OK, USA). P<0.05 was considered to indicate a
statistically significant difference.
Results
Cell viability
A relatively poor cytotoxicity of SW620 cell lines
was observed following PDT. The cell viability estimated by the MTT
test after PDT was 95%.
Immunocytochemistry
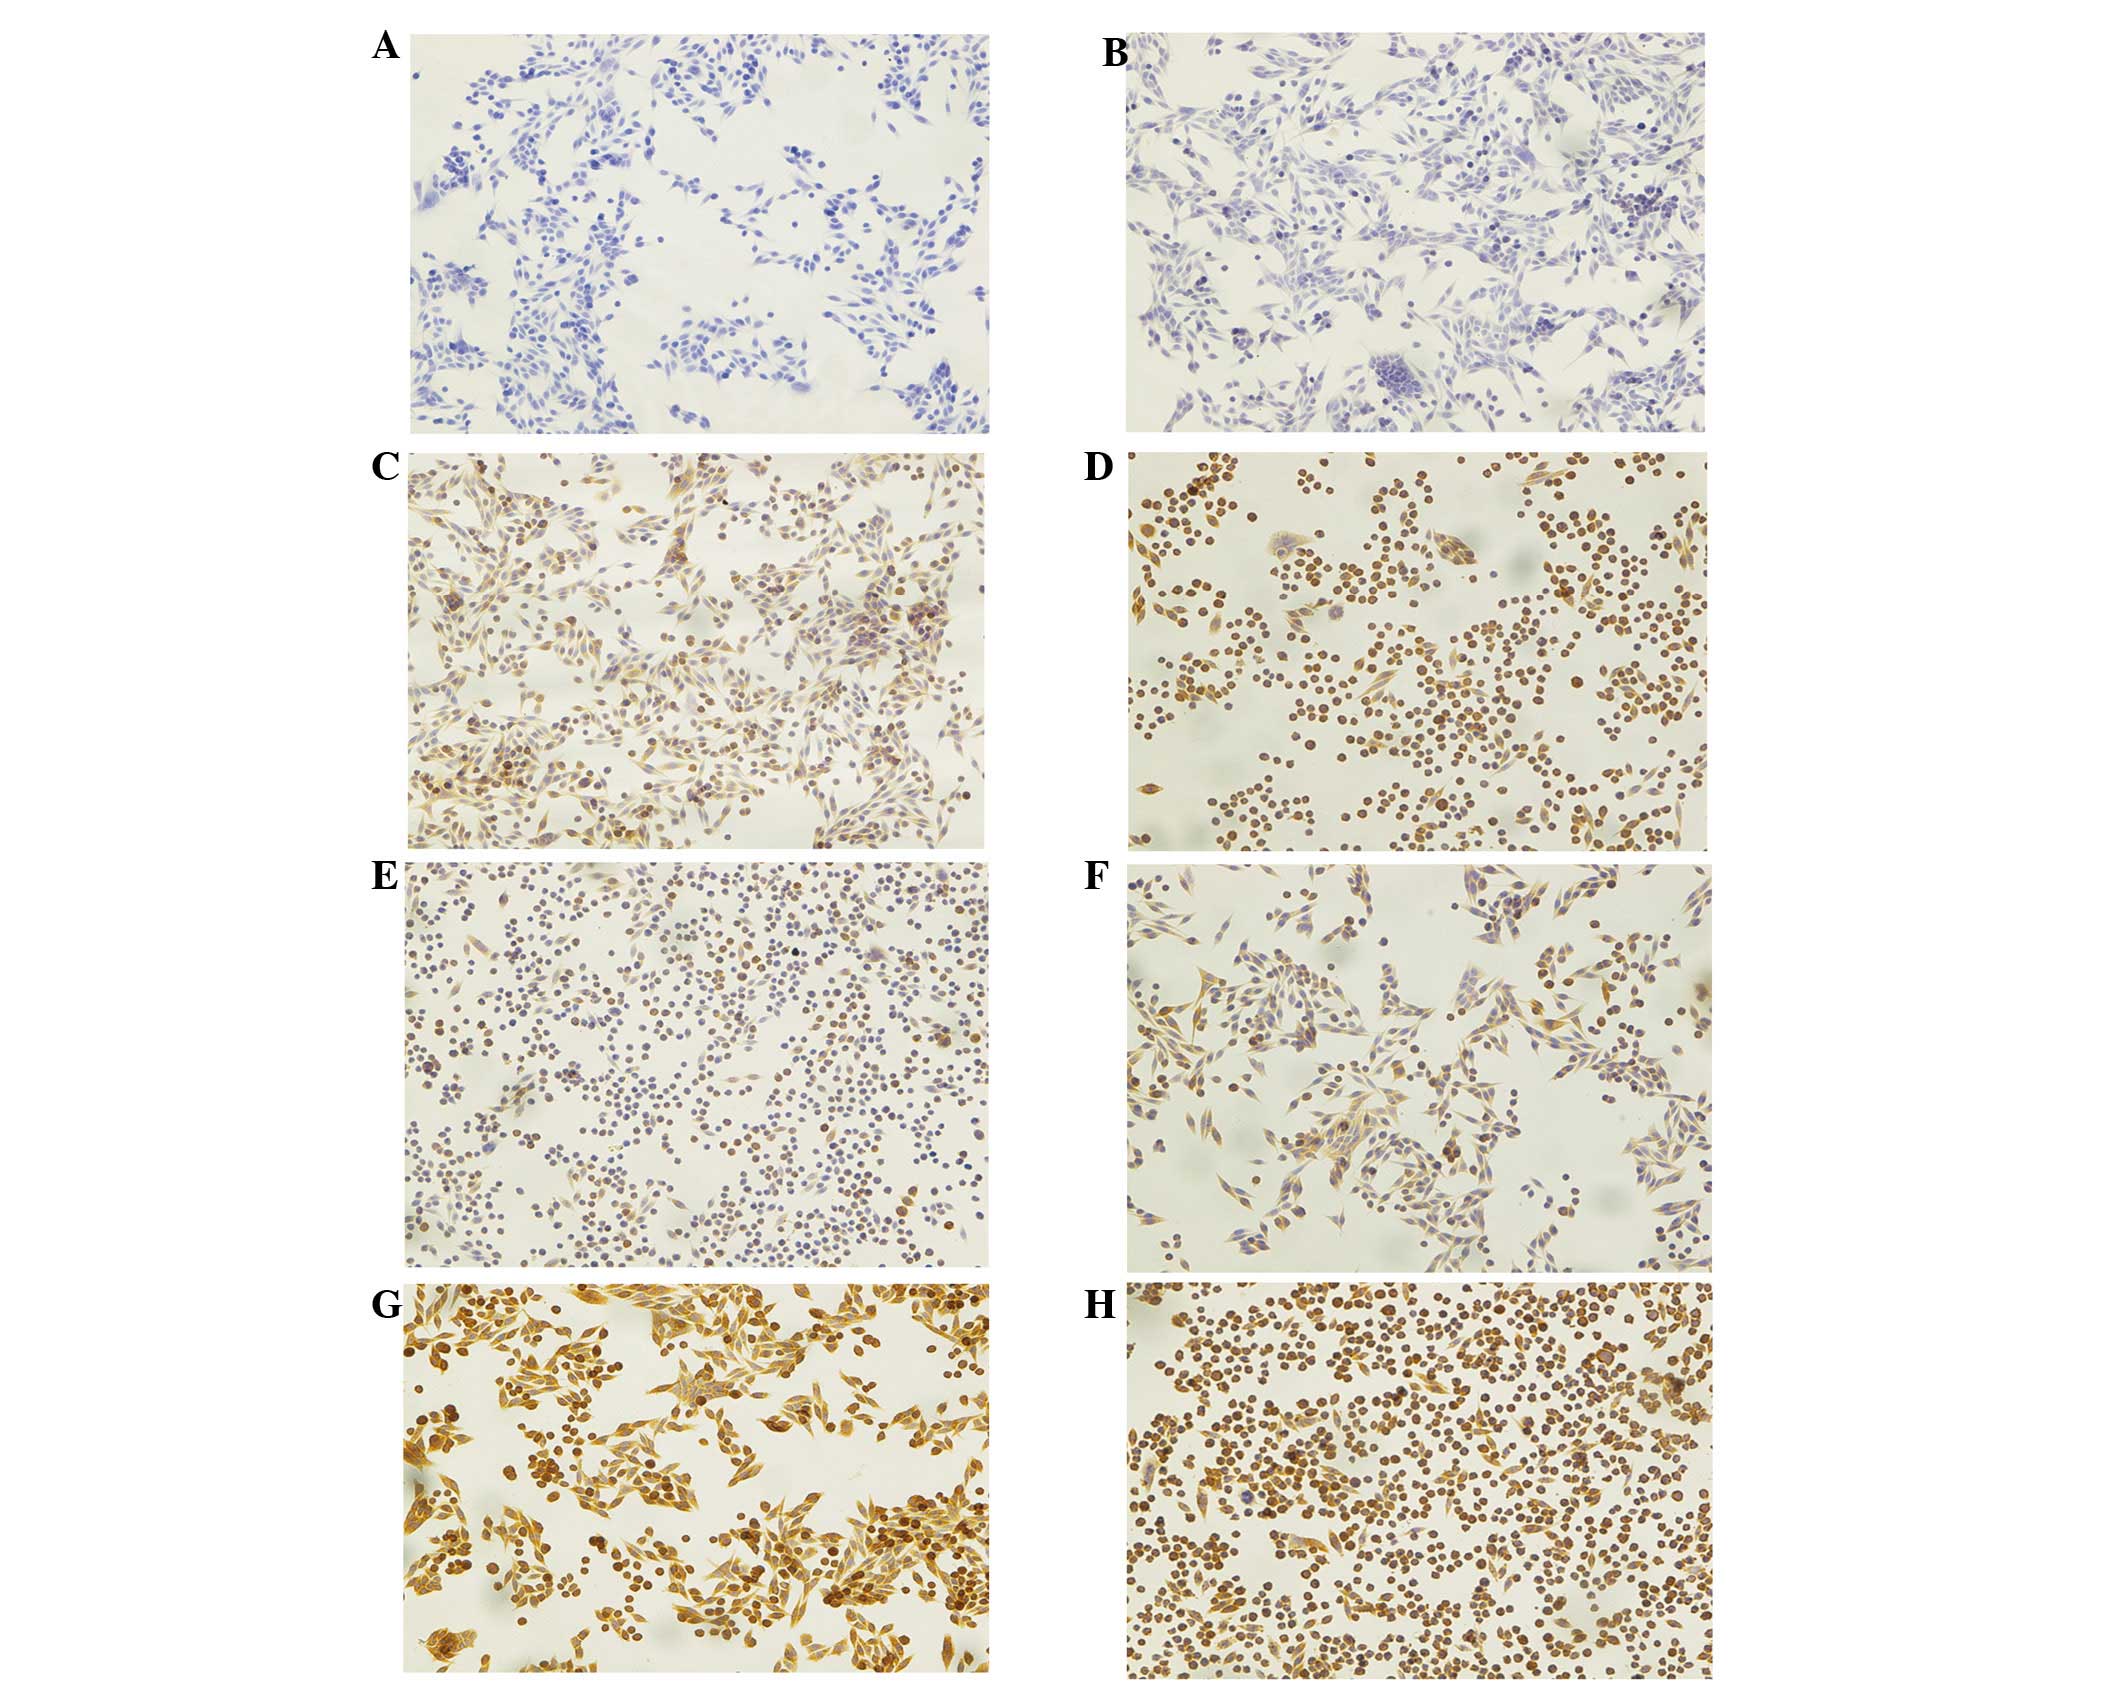
The key finding was that following PDT, three
markers of autophagy were strongly expressed in treated cells, and
this was shown to be greater than that in the control cells. Prior
to application of 5-ALA and irradiation with the light source
Beclin-1 was not identified (IRS=0). Fig. 1A shows cancer cells from the
control group (no 5-ALA, no light), where no staining against
Beclin-1 was observed. Fig. 1B
shows the effect of 5-ALA-PDT at 0 h, directly following treatment
when the expression of Beclin-1 was found to be weak (IRS=1), while
after 4 h it was not identified to change significantly (IRS=3;
P<0.001), (Fig. 1C). Fig. 1D shows that the PDT effects on
Beclin-1 expression were strongest, with diffuse cytoplasmic
staining 8 h after treatment (IRS=6; P<0.001).
PDT also resulted in an increase in the expression
of the LC3 protein, as confirmed by immunocytochemical staining at
different time points. Fig. 1E
shows an effect of PDT on SW620 cells in the control group (no
5-ALA, no light) as the cancer cells present a weak diffuse
cytoplasmic staining (IRS=2). At the first time point directly
after the PDT (0 h) the intensity of staining and number of stained
cells remained the same (IRS=2) (Fig.
1F). At the next time points, 4 and 8 h following PDT, the
intensity of staining and number of stained cells significantly
increased. Fig. 1G and H show the
effects of PDT at 4 (IRS=9) and 8 h (also IRS=9), respectively
(both P<0.001).
The protein expression of Atg7 was also increased
following PDT. Fig. 2A shows the
results of immunocytochemical staining of SW620 cells in the
control group (no 5-ALA, no light). Contrary to Beclin-1 and LC3,
strong expression was observed (IRS=6). Directly after irradiation
at time point 0 h the expression of Atg7 was strong (Fig. 2B), (IRS=9; P<0.01), and remained
strong at 4 h following PDT (IRS=9), (Fig. 2C). Later at 8 h this expression
slightly decreased but it was still strong (IRS=6), (Fig. 2D).
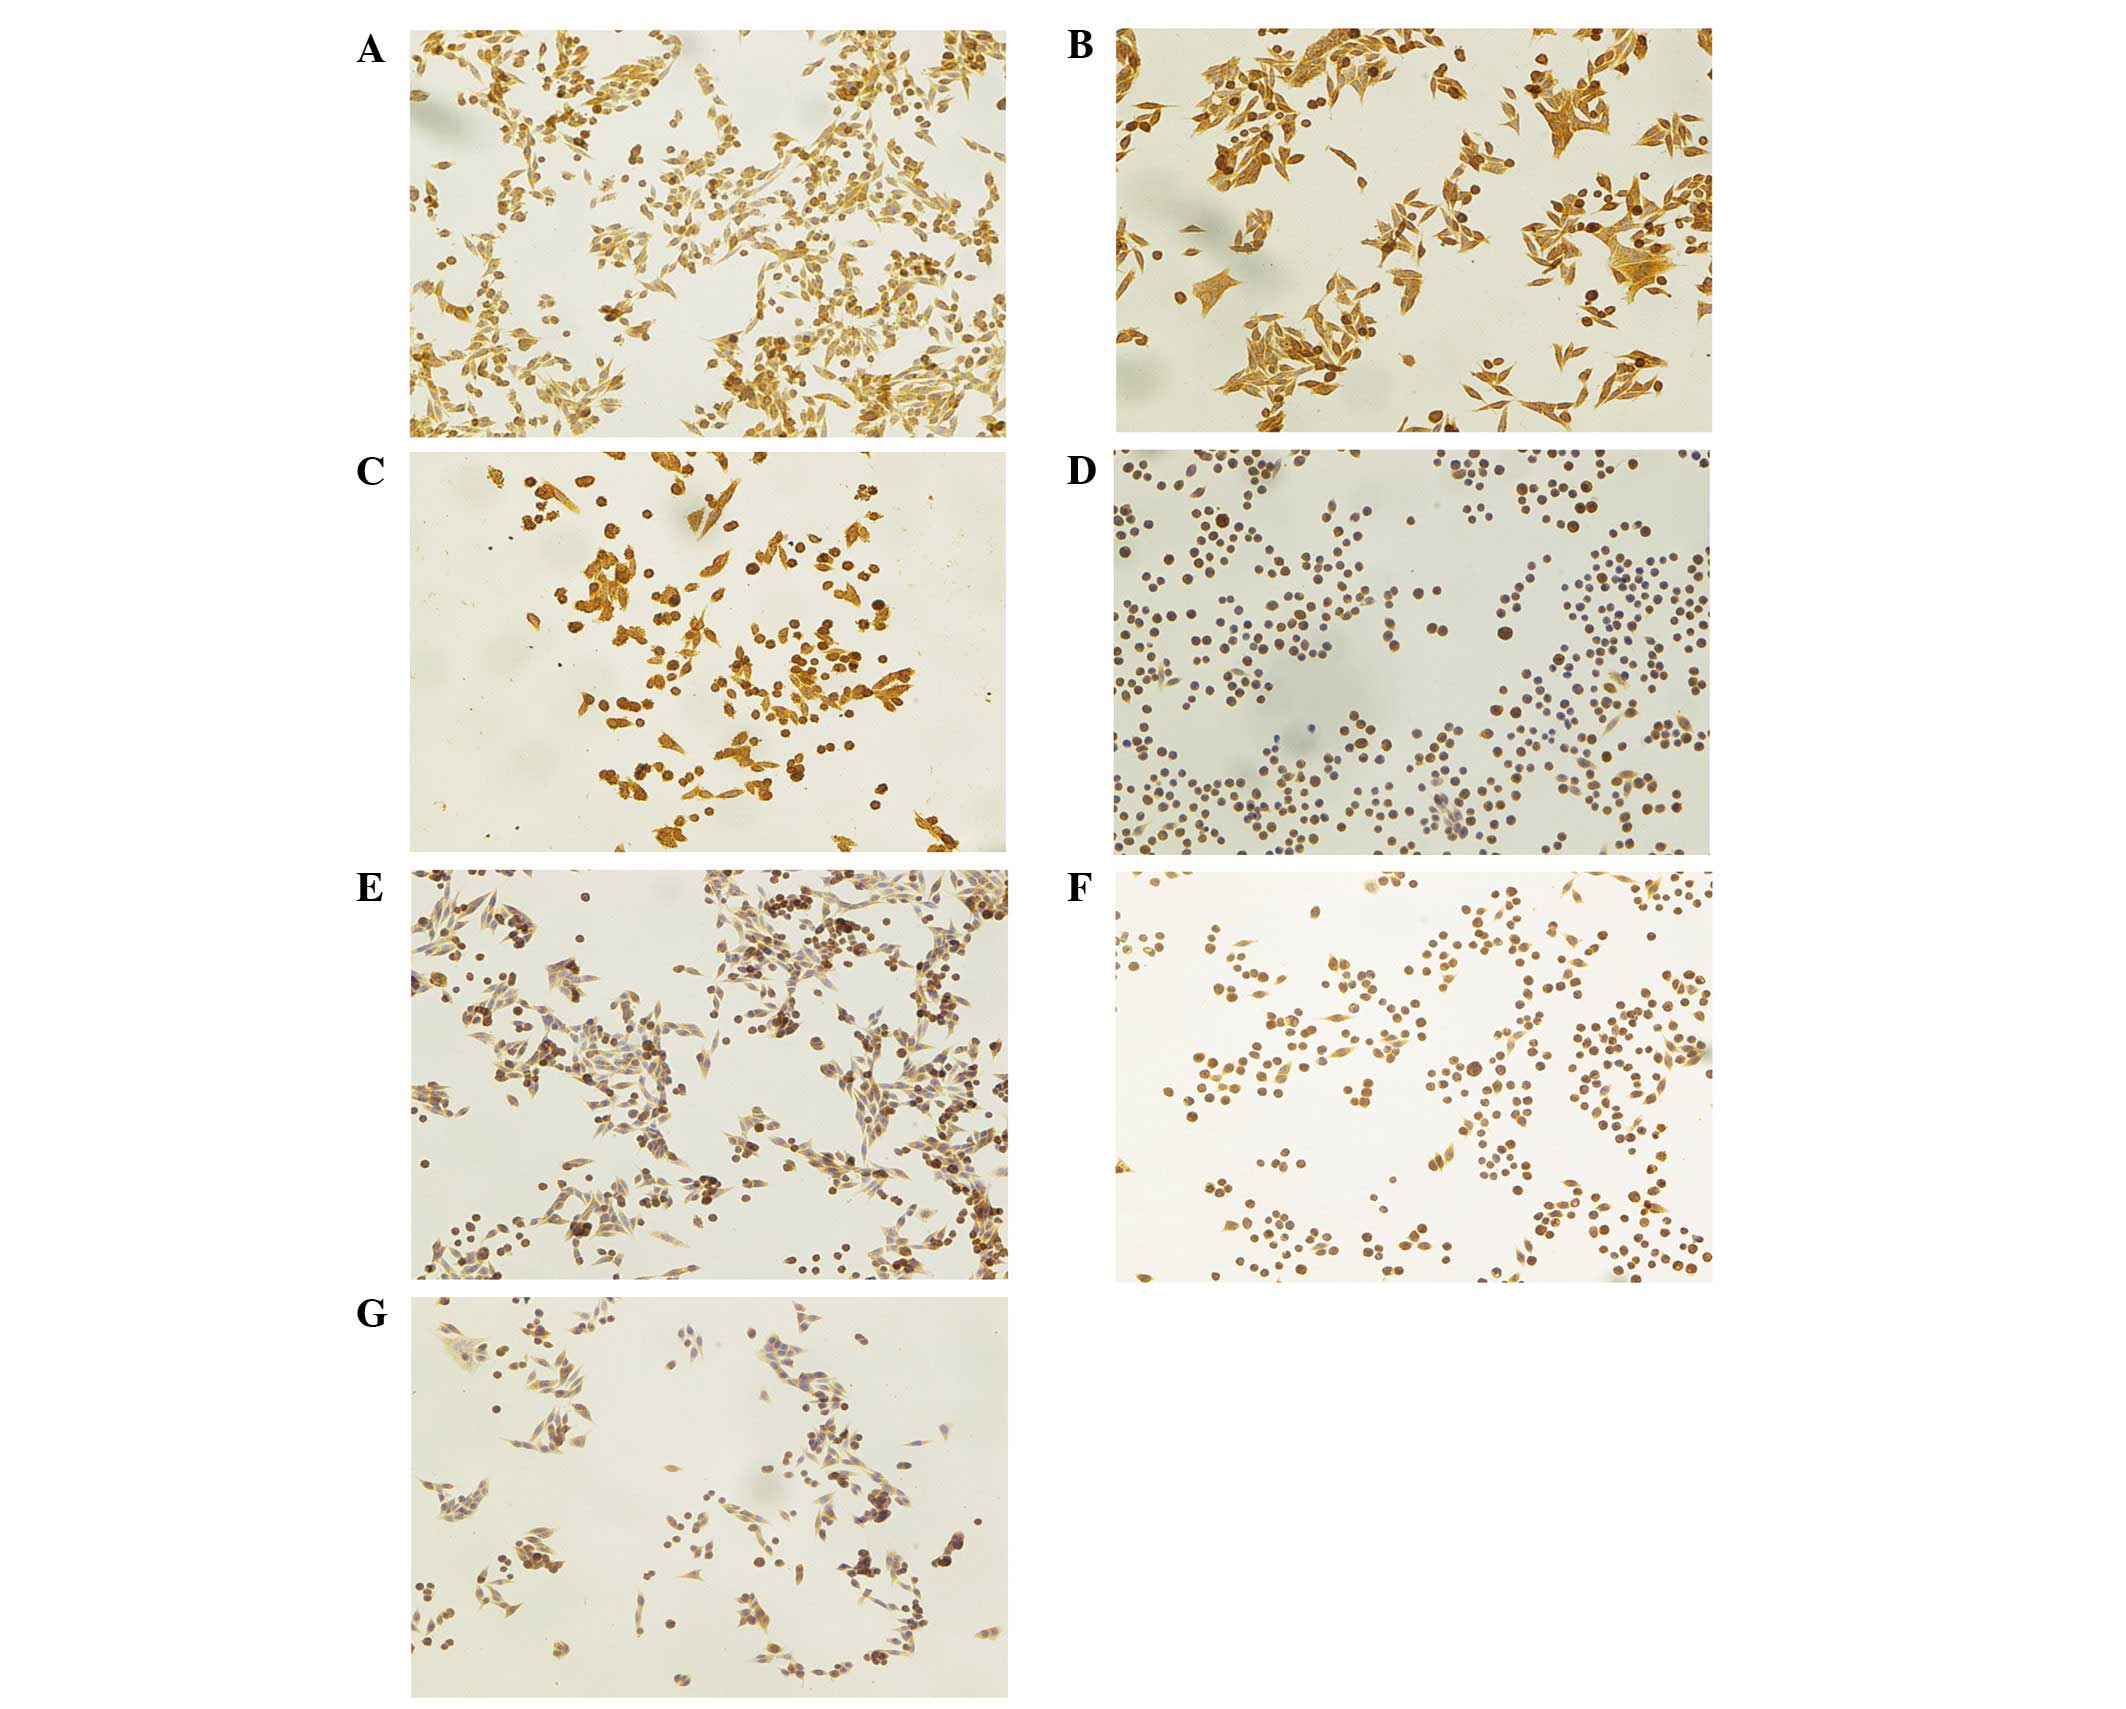 | Figure 2Immunocytochemistry of Atg7, Beclin-1
and LC-3 in SW620 human colon adenocarcinoma cells. (A–D) Atg7
expression. (A) Cells from the control group, neither 5-ALA nor
light was applied. Strong staining was found in cancer cells
(IRS=6). (B) Cells from group treated with 3 mM 5-ALA and 4.5
J/cm2 light. Very strong cytoplasmic staining was found
at 0 h after PDT (IRS=9). (C) Cells treated with PDT (time point 4
h). Very strong, diffuse cytoplasmic staining was found in cancer
cells (IRS=9). (D) Cells treated with PDT (time point 8 h). Strong
diffuse staining in cell cytoplasm was observed in a large number
of cells (IRS=6). (E–G) The results of immunocytochemical staining
in SW620 human colon adenocarcinoma cells against three studied
proteins at 24 h from PDT. (E) Beclin-1 expression. Strong staining
was found in cancer cells (IRS=6), (F) LC-3 expression. Cells show
an intense diffuse staining (IRS=6), (G) Atg7. Moderate cytoplasmic
staining was observed (IRS=4). Hematoxylin counterstained.
Magnification, x200. Atg7, autophagy-related gene 7; LC3, light
chain 3; 5-ALA, 5-aminolevulinic acid; PDT, photodynamic therapy;
IRS, immunoreactivity score. |
After PDT (24 h) strong expression of Beclin-1
protein (IRS=6; P<0.001; Fig.
2E) and LC3 protein (IRS=6; P<0.001); Fig. 2F) was observed although, the
expression of LC3 showed the tendency to decrease. The expression
of Atg7 protein decreased to moderate (Fig. 2G). In addition, the cell population
was markedly decreased following 24 h.
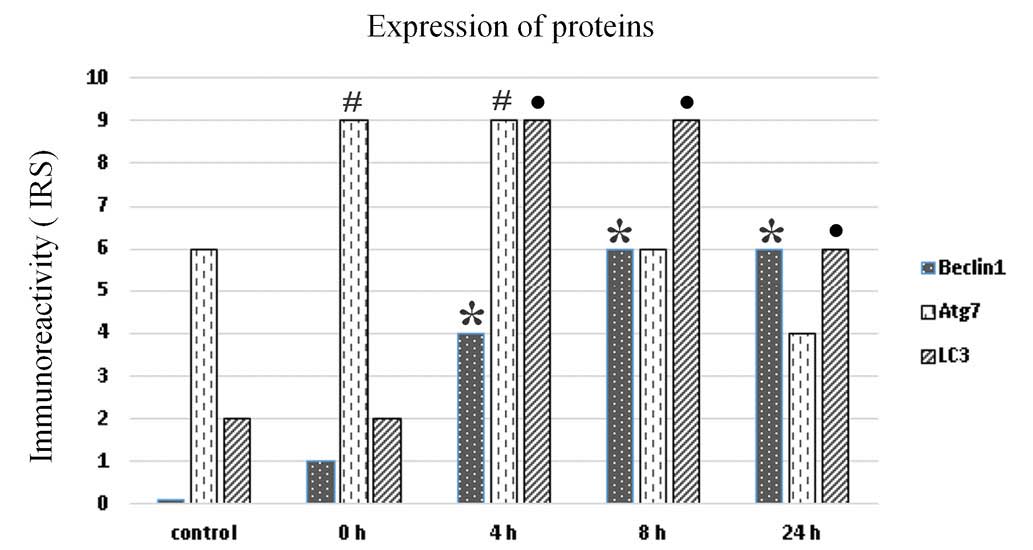
All microscopic sections were additionally evaluated
by two pathologists. The results presented on the bar chart show
the arithmetic mean of the immunoreactivity scores for each protein
at the indicated time point. It was demonstrated that the highest
expression of all autophagy-related proteins was observed from 4 to
8 h and then decreased at 24 h (Fig.
3). The bar chart shows that there was a significant increase
of Beclin-1 expression from 0 to 8 h, which remained stable until
24 h following irradiation (P<0.001). Conversely, Atg7
expression (IRS=9) was high immediately post 5-ALA-PDT and
decreased from 8 h (P<0,001). The LC3 expression was visible at
0 h (IRS=2) and significantly increased at 4 and 8 h (IRS=9)
(P<0.001) (Fig. 3).
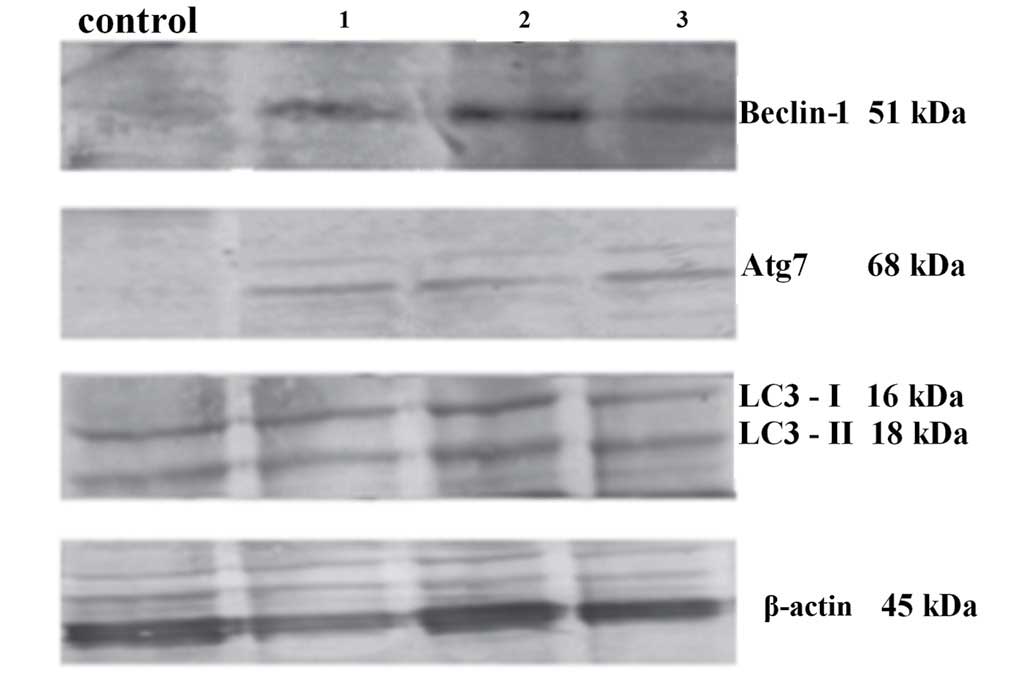
Western blot analysis
Western blot analysis was performed directly
following light exposure (0 h), in order to detect the expression
of Beclin-1 and Atg7, and the conversion of LC3 I to LC3 II,
respectively. β-actin served as an internal control. A marked
difference between samples incubated with 5-ALA only (lane 1),
cells irradiated only (lane 2) and cells treated with 5-ALA-PDT
(lane 3) compared with the control cells, respectively. The
activation of autophagic cell death was strongest in the
5-ALA-PDT-treated SW630 cells (lane 3) (Fig. 4).
Discussion
Although autophagy has been extensively
investigated, little was known regarding its molecular mechanism
until the identification of autophagy-related genes in yeast
(13).
Autophagy is a cardinal cellular mechanism that
involves the degradation and digestion of intracellular
constituents by lysosomes. It is also involved in controlling
inflammation (1–3). Autophagosome formation is controlled
by protein complexes including the coiled-coil myosin-like
BCL2-interacting protein 1 (Beclin-1) complex. The autophagy
process is initiated by the regulation of protein complexes
composed of >30 Atg proteins and autophagic adaptor LC3 protein
(14–20). In the present study the expression
of all the above proteins were investigated in terms of
photodynamic therapy. To the best of our knowledge, this is the
first study to evaluate Beclin-1, Atg7 and LC3 in one PDT-based
experiment at several time points within 24 h of observation.
To date, 30 Atg genes have been identified. The
corresponding gene products comprise the 'core' machinery (21) that coordinates the specific steps
in the autophagic pathway, including two ubiquitin-like conjugation
systems, Atg12 and Atg8 (22–24).
Atg12 is activated by an E1-like enzyme, Atg7 (25), which was one of our main targets
investigated, and finally conjugated to Atg5 in a reaction similar
to ubiquitination. Atg7 can also activate Atg8 thereby
participating in the Atg8 conjugation system. In mammalian cells,
Atg7 is essential for the autophagy conjugation system, formation
of autophagosomes, and starvation-induced degradation of proteins
and organelles (26).
Protection against cell death and sensitization to
other (non-PDT) stressors have been observed when Atg7 was knocked
down. Kessel and Reiners (5) and
Kessel and Arroyo (27) depleted
Atg7 in L1210 murine leukemia cells by short hairpin RNA knockdown,
and noted that the deficient cells were more sensitive than
Atg7-replete cells to the lethal effects of a low PDT dose. This
suggested that autophagy served a survival function in leukemia
L1210 cells. By contrast, other laboratories have reported that
Atg7 knockdown protected against cell death and similarly, it has
been shown that chemical inhibitors of autophagy, 3-methyladenine
(3-MA) and wortmannin, provided greater protection against loss of
viability to apoptosis-deficient than to apoptosis-competent MCF-7
cells.
Another noteworthy difference between observations
made by Xue et al (28) and
those of Kessel and Reiners (5),
is associated with the ability of the cells to generate LC3-II in
response to PDT when expression of Atg7 is deficient. In the
present study, strong immunocytochemical expression of Atg7 was
observed following PDT, which increased to IRS=9 directly after
treatment, and remained stable with a marginal decrease at 24
h.
Beclin-1, the mammalian homolog of Atg6 in yeast, is
a key member of the PI3K initiation complex responsible for
initiating formation of the phagophore and was shown to be induced
by PDT as determined by immunocytochemistry. In the present study a
strong expression of Beclin-1 was observed, which was correlated
with the initiation of autophagy. Beclin-1 binds Vps34 and Vps15 to
form the core of the initiation complex (29), which can interact with other
positive regulators of autophagy, such as Atg14 or can be disrupted
by interaction with Bcl-2 to inhibit autophagy (30). The initiation complex also
interacts with LC3 to increase the autophagic flux and early
autophagosome formation (31). In
the present study, no significant increase in LC3 expression was
identified directly following PDT by means of immunocytochemistry.
However, LC3 expression rapidly increased at 4 h and then remained
high at 8 and 24 h.
ROS are common by-products of the cellular
metabolism and serve as essential signaling mediators in a variety
of processes, including proliferation, senescence, ageing and
carcinogenesis (1). When
overproduced, ROS can directly affect cellular functions by
oxidizing vital molecules that are crucial for cellular integrity,
thereby causing cell death.
Recently, ROS have also emerged as signaling
mediators in MA (32–34), a major lysosomal pathway for 'in
bulk' removal of entire portions of the cytoplasm, including
organelles (5). Although MA can
selectively remove damaged or unnecessary organelles (e.g.
mitochondria, peroxisomes and endoplasmic reticulum), it is
considered an unselective degradation process of soluble cytosolic
proteins or aggregates. By contrast, CMA is a selective pathway for
protein-by-protein removal, based on the recognition of proteins
exposing a KFERQ-related targeting sequence. Furthermore, it has
been shown that CMA is the dominant cytoprotective pathway in PDT,
whereas it is dispensable for ER stress-induced cell death
(35).
In a study by Dewaele et al (32) findings indicated that along with
increased apoptosis, attenuation of MA by 3-MA or Atg5 knockdown
enhanced the accumulation of ROS-damaged proteins in the
photosensitized cells. This strongly suggests that MA participates
in the removal of ROS-damaged cytoplasmic components and by doing
so limits PDT-mediated injury (35). This mechanism could explain
numerous failures of PDT and poor cytotoxicity of SW620 cells
observed in our study.
The immunohistochemical analysis in our study showed
that the level of Beclin-1 gradually increased whereas it remained
unaltered during the time course of other experiments (3). In concordance with the study by
Reiners et al (3) LC3
expression was increased with peak expression at later time points;
24 h (3) or 8 h in the present
study. Notably, not all autophagy-related proteins undergo
photodamage in PDT protocols. An examination of the effects of an
LD90 PDT dose on Beclin-1, Atg5 and Atg7 revealed no significant
photodamage (3). These results
were obtained with L1210 cells and the photosensitizer
benzoporphyrin derivative monoacid ring A, which localizes
preferentially to the mitochondria and does not accumulate in
lysosomes. Likewise, neither Beclin-1 nor Atg5 were photo-damaged
in PDT protocols utilizing hypericin-photosensitized HeLa cells and
mouse embryo fibroblasts (3).
After 24 h, in cultures treated with PDT alone, the
apoptotic cells were no longer observed and surviving cells were
swollen and filled with vesicles (36). A similar effect was observed in the
present study, however a part of the cell population visibly shrunk
after 24 h. As the induction of autophagy is a common response in
PDT protocols, it appears unlikely that proteins responsible for
the assembly of autophagosomes are PDT targets. Indeed, as reported
in a number of studies, key autophagic proteins, such as Beclin-1,
Atg5 and Atg7 appear to be unaffected in PDT protocols employing
endoplasmic reticulum and mitochondrial sensitizers (3).
In conclusion, in the present study it was
demonstrated that autophagy is involved in cell death induced by
5-ALA-PDT. The results showed expression of autophagy-related
proteins shortly following PDT and a significant increase in the
levels of these proteins in the following hours. The role of
autophagy, particularly in PDT remains unclear and further
investigation is required to determine the most effective
parameters of PDT leading to the highest cytotoxic effects on
cancer cells.
References
|
1
|
Dougherty TJ, Gomer CJ, Henderson BW, Jori
G, Kesel D, Korbelik M, Moan J and Peng Q: Photodynamic therapy. J
Natl Cancer Inst. 90:889–905. 1998. View Article : Google Scholar : PubMed/NCBI
|
|
2
|
Kessel D: Correlation between subcellular
localization and photodynamic efficacy. J Porph Phtalo.
8:1009–1014. 2004. View Article : Google Scholar
|
|
3
|
Reiners JJ Jr, Agostinis P, Berg K,
Oleinick NL and Kessel D: Assesing autophagy in the context of
photodynamic therapy. Autophagy. 6:7–18. 2010. View Article : Google Scholar :
|
|
4
|
Castano AP, Demidiva TN and Hamblin MR:
Mechanisms in photodynamic therapy: Part two-cellular signalling,
cell metabolism and modes of cell death. Photodiagnosis Photodyn
Ther. 2:1–23. 2005. View Article : Google Scholar : PubMed/NCBI
|
|
5
|
Kessel D and Reiners JJ Jr: Apoptosis and
autophagy after mitochondrial and endoplasmic reticulum
photodamage. Photochem Photobiol. 83:1024–1028. 2007. View Article : Google Scholar : PubMed/NCBI
|
|
6
|
Yorimitsu T and Klionsky DJ: Autophagy:
Molecular machinery for self-eating. Cell Death Differ. 12(Suppl
2): S1542–S1552. 2005. View Article : Google Scholar
|
|
7
|
Mandelbaum J, Rollins N, Shah P, Bowman D,
Lee JY, Tayber O, Bernard H, LeRoy P, Li P, Koenig E, et al:
Identification of a lung cancer cell line deficient in
atg7-dependent autophagy. Autophagy. 02015. View Article : Google Scholar : PubMed/NCBI
|
|
8
|
Taherbhoy AM, Tait SW, Kaiser SE, Williams
AH, Deng A, Nourse A, Hammel M, Kurinov I, Rock CO, Green DR and
Schulman BA: Atg8 transfer from Atg7 to Atg3: A distinctive E1–E2
architecture and mechanism in the autophagy pathway. Mol Cell.
44:451–461. 2011. View Article : Google Scholar : PubMed/NCBI
|
|
9
|
Klionsky DJ, Abdalla FC, Abeliovich H,
Abraham RT, Acevedo-Arozena A, Adeli K, Agholme L, Agnello M,
Agostinis P, Aguirre-Ghiso JA, et al: Guidelines for the use and
interpretation of assays for monitoring autophagy. Autophagy.
8:445–454. 2012. View Article : Google Scholar : PubMed/NCBI
|
|
10
|
Tanida I, Ueno T and Kominami E: LC3 and
autophagy. Methods Mol Biol. 445:77–88. 2008. View Article : Google Scholar : PubMed/NCBI
|
|
11
|
Brech A, Ahlquist T, Lothe RA and Stenmark
H: Autophagy in tumour suppression and promotion. Mol Oncol.
3:366–375. 2009. View Article : Google Scholar : PubMed/NCBI
|
|
12
|
White E and DiPaola RS: The double-edged
sword of autophagy modulation in cancer. Clin Cancer Res.
15:5308–5316. 2009. View Article : Google Scholar : PubMed/NCBI
|
|
13
|
Tsukada M and Ohsumi Y: Isolation and
characterization of autophagy-defective mutants of Saccharomyces
cerevisiae. FEBS Lett. 333:169–174. 1993. View Article : Google Scholar : PubMed/NCBI
|
|
14
|
Mizushima N, Yoshimori T and Ohsumi Y: The
role of Atg proteins in autophagosome formation. Annu Rev Cell Dev
Biol. 27:107–132. 2011. View Article : Google Scholar : PubMed/NCBI
|
|
15
|
Fimia GM, Stoykova A, Romagnoli A, Giunta
L, Di Bartolomeo S, Nardacci R, Corazzari M, Fuoco C, Ucar A,
Schwartz P, et al: Ambra1 regulates autophagy and development of
the nervous system. Nature. 447:1121–1125. 2007.PubMed/NCBI
|
|
16
|
Itakura E, Kishi C, Inoue K and Mizushima
N: Beclin 1 forms two distinct phosphatidylinositol 3-kinase
complexes with mammalian Atg14 and UVRAG. Mol Biol Cell.
19:5360–5372. 2008. View Article : Google Scholar : PubMed/NCBI
|
|
17
|
Zhong Y, Wang QJ, Li X, Yan Y, Backer JM,
Chait BT, Heintz N and Yue Z: Distinct regulation of autophagic
activity by Atg14L and Rubicon associated with Beclin
1-phosphatidylinositol-3-kinase complex. Nat Cell Biol. 11:468–476.
2009. View
Article : Google Scholar : PubMed/NCBI
|
|
18
|
Hara T, Nakamura K, Matsui M, Yamamoto A,
Nakahara Y, Suzuki-Migishima R, Yokoyama M, Mishima K, Saito I,
Okano H and Mizushima N: Suppression of basal autophagy in neural
cells causes neurodegenerative disease in mice. Nature.
441:885–889. 2006. View Article : Google Scholar : PubMed/NCBI
|
|
19
|
Klionsky DJ and Emr SD: Autophagy as a
regulated pathway of cellular degradation. Science. 290:1717–1721.
2000. View Article : Google Scholar : PubMed/NCBI
|
|
20
|
Kroemer G, Mariño G and Levine B:
Autophagy and the integrated stress response. Mol Cell. 40:280–293.
2010. View Article : Google Scholar : PubMed/NCBI
|
|
21
|
Xie Z and Klionsky DJ: Autophagosome
formation: Core machinery and adaptations. Nat Cell Biol.
9:1102–1109. 2007. View Article : Google Scholar
|
|
22
|
Mizushima N, Noda T, Yoshimori T, Tanaka
Y, Ishii T, George MD, Klionsky DJ, Ohsumi M and Ohsumi Y: A
protein conjugation system essential for autophagy. Nature.
395:395–398. 1998. View
Article : Google Scholar : PubMed/NCBI
|
|
23
|
Ichimura Y, Kirisako T, Takao T, Satomi Y,
Shimonishi Y, Ishihara N, Mizushima N, Tanida I, Kominami E, Ohsumi
M, et al: A ubiquitin-like system mediates protein lipidation.
Nature. 408:488–492. 2000. View
Article : Google Scholar : PubMed/NCBI
|
|
24
|
Ohsumi Y: Molecular dissection of
autophagy: Two ubiquitin-like systems. Nat Rev Mol Cell Biol.
2:211–216. 2001. View
Article : Google Scholar : PubMed/NCBI
|
|
25
|
Tanida I, Tanida-Miyake E, Ueno T and
Kominami E: The human homolog of Saccharomyces cerevisiae Apg7p is
a Protein-activating enzyme for multiple substrates including human
Apg12p, GATE-16, GABARAP, and MAP-LC3. J Biol Chem. 276:1701–1706.
2001. View Article : Google Scholar
|
|
26
|
Komatsu M, Waguri S, Ueno T, Iwata J,
Murata S, Tanida I, Ezaki J, Mizushima N, Ohsumi Y, Uchiyama Y, et
al: Impairment of starvation-induced and constitutive autophagy in
Atg7-deficient mice. J Cell Biol. 169:425–434. 2005. View Article : Google Scholar : PubMed/NCBI
|
|
27
|
Kessel D and Arroyo AS: Apoptotic and
autophagic responses to Bcl-2 inhibition and photodamage. Photochem
Photobiol Sci. 6:1290–1295. 2007. View
Article : Google Scholar : PubMed/NCBI
|
|
28
|
Xue LY, Chiu SM and Oleinick NL:
Photochemical destruction of the Bcl-2 oncoprotein during
photodynamic therapy with the phthalocyanine photosensitizer Pc 4.
Oncogene. 20:3420–3427. 2001. View Article : Google Scholar : PubMed/NCBI
|
|
29
|
Kang R, Zeh HJ, Lotze MT and Tang D: The
Beclin 1 network regulates autophagy and apoptosis. Cell Death
Differ. 18:571–580. 2011. View Article : Google Scholar : PubMed/NCBI
|
|
30
|
Glick D, Barth S and Macleod KF:
Autophagy: Cellular and molecular mechanisms. J Pathol. 221:3–12.
2010. View Article : Google Scholar : PubMed/NCBI
|
|
31
|
Kessel D, Vicente MG and Reiners JJ Jr:
Initiation of apoptosis and autophagy by photodynamic therapy.
Autophagy. 2:289–290. 2006. View Article : Google Scholar : PubMed/NCBI
|
|
32
|
Dewaele M, Martinet W, Rubio N, Verfaillie
T, de Witte PA, Piette J and Agostinis P: Autophagy pathways
activated in response to PDT contribute to cell resistance against
ROS damage. J Cell Mol Med. 15:1402–1414. 2011. View Article : Google Scholar
|
|
33
|
Scherz-Shouval R, Shvets E, Fass E, Shorer
H, Gil L and Elazar Z: Reactive oxygen species are essential for
autophagy and specifically regulate the activity of Atg4. EMBO J.
26:1749–1760. 2007. View Article : Google Scholar : PubMed/NCBI
|
|
34
|
Azad MB, Chen Y and Gibson SB: Regulation
of autophagy by reactive oxygen species (ROS): Implications for
cancer progression and treatment. Antioxid Redox Signal.
11:777–790. 2009. View Article : Google Scholar
|
|
35
|
Chen Y, Azad MB and Gibson SB: Superoxide
is the major reactive oxygen species regulating autophagy. Cell
Death Differ. 16:1040–1052. 2009. View Article : Google Scholar : PubMed/NCBI
|
|
36
|
Song J, Oh Y and Lee JE: miR-Let7A
modulates autophagy induction in LPS-activated microglia. Exp
Neurobiol. 24:117–125. 2015. View Article : Google Scholar : PubMed/NCBI
|