Introduction
It has previously been demonstrated that hypoxia has
diverse effects on human adipose-derived stem cells (ASCs). For
example, 2% hypoxia increases the proliferation and migration of
ASCs via reactive oxygen species (ROS) generation (1–3). ROS
are primarily generated by NADPH oxidase in ASCs, which mediates
proliferation and migration (4).
Hypoxia-generated ROS increase phosphorylation of platelet-derived
growth factor receptor-β, and activation signaling is followed by
Akt and extracellular-regulated kinase (ERK) phosphorylation to
increase the proliferation and migration of ASCs (2,5–7).
Activation of Akt and ERK pathways induces nuclear factor-κB and
ETS domain-containing protein Elk-1 phosphorylation to upregulate
miR-210 (termed ‘hypoxamir’) expression, which downregulates
protein tyrosine phosphatase, non-receptor type 2 to increase the
proliferation and migration of ASCs (8). ROS generation by rotenone and
antimycine was demonstrated to upregulate miR-210 expression, which
resulted in miR-210 being termed ‘ROSmir’ (8). In addition, hypoxia markedly
increases the secretion of vascular endothelial growth factor,
hepatocyte growth factor, and basic fibroblast growth factor (bFGF)
from ASCs, which collectively enhance the wound-healing and
hair-regenerative potential of ASCs (3,9).
Hypoxia also has effects on ASC transdifferentiation. Hypoxia
generates ROS and mediates adipocyte differentiation of ASCs
(10). Hypoxia generally increases
chondrogenic differentiation while inhibiting the osteogenic
differentiation of ASCs (11,12).
As described above, alteration of mitogenic and paracrine effects
of ASCs under hypoxia have been well-studied, however, the effects
on glucose utilization and metabolism during hypoxia in ASCs
requires further elucidation.
Glycolysis is the metabolic pathway that converts
glucose into pyruvate, and the free energy released in this process
is used to form the high-energy compounds, adenosine triphosphate
and NADH. Glycolysis occurs in aerobic and anaerobic conditions,
and anaerobic metabolism has been reported to be beneficial to
maintain the self-renewal of stem cells (13,14).
Stem cells heavily rely on anaerobic glycolysis to increase
survival and proliferation, and stem cell function is also
regulated by bioenergetic signaling pathways, such as the
AMP-activated protein kinase (AMPK) and hypoxia inducible factor
(HIF) pathways (14,15). In addition, differentiation is
accompanied by a shift from anaerobic glycolysis to mitochondrial
respiration, and this metabolic switch of differentiating stem
cells is required to cover the energy demands of organ-specific
differentiating cells (13). It is
reasonable to assume that there is an association between the
self-renewal state of stem cells and the activity of specific
metabolic pathways (16).
ASCs exist in hypoxic microenvironments of adipose
tissue, and ASCs cultured under hypoxia ex vivo (1–5%
oxygen) reportedly have advantages in proliferation, migration and
growth factor secretion over those cultured under normoxia
(1,5,17,18).
Anaerobic metabolism under hypoxia during ex vivo expansion
may be beneficial to ASC self-renewal and proliferation, however,
altered glucose uptake and metabolism of ASCs under hypoxia has not
been fully characterized. Thus, the present study investigated the
altered glucose uptake and lactate production of ASCs under hypoxia
(1% oxygen). In addition, the current study aimed to identify the
molecular mechanisms involved in hypoxia-induced glucose uptake and
lactate production by ASCs.
Materials and methods
Materials and antibodies
Deferoxamine (DFX; a hypoxia-mimic agent), rapamycin
(a mammalian target of rapamycin inhibitor), and sodium oxamate [a
lactate dehydrogenase (LDH) inhibitor] were purchased from
Sigma-Aldrich (Merck Millipore). Compound C (an AMPK inhibitor) was
purchased from EMD Millipore (Billerica, MA, USA). YC-1 (a HIF-1α
inhibitor) was purchased from AG Scientific Inc. (San Diego, CA,
USA). GAPDH and tubulin were purchased from Santa Cruz
Biotechnology, Inc. (Dallas, TX, USA). An antibody against enolase
1 (ENO1; cat. no. 11204-1-AP) was purchased from Proteintech Group,
Inc. (Rosemont, IL, USA). An antibody against HIF-1α (cat. no.
610958) was purchased from BD Biosciences (San Jose, CA, USA).
Antibodies against glucose transporter (GLUT)1 (cat. no. ab652) and
GLUT3 (cat. no. ab15311) were purchased from Abcam (Cambridge,
UK).
Cell culture
ASCs were isolated from lipoaspirates of human
subcutaneous adipose tissue from two females in 2011 and
characterized by flow cytometry using selected cell surface makers
as described previously (19).
Informed consent was obtained from patients at Bundang CHA Hospital
(Sungnam, Korea), and approved by the ethics committee of Chung-Ang
University (no. BD2011-152D; Pocheon, Korea). ASCs were
characterized using cell surface markers, including cluster of
differentiation (CD)34, CD73, CD90, and CD105, and multiple
differentiation states were identified (19). ASCs were cultured in α-minimum
essential medium (α-MEM; Hyclone; GE Healthcare Life Sciences,
Logan, UT, USA) with 10% fetal bovine serum (Gibco; Thermo Fisher
Scientific, Inc.) and 1% penicillin (Gibco; Thermo Fisher
Scientific, Inc.). ASCs were incubated in 5% CO2 and 20% O2
(normoxia) or 1% O2 (hypoxia) with the same percentage N2, at 37°C.
ASCs at passages 4–7 were used in the current study.
Two-dimensional (2D) electrophoresis
and protein identification by mass spectrometry
ASCs under normoxia and hypoxia were used for 2D
electrophoresis. Protein was obtained by scraping in SDS lysis
buffer. Extracts were incubated on ice for 30 min and supernatant
was harvested by centrifugation at 13,400 × g for 10 min.
Subsequently, quantification of protein was measured by Bradford
assay. To analyze in the first dimension, 1 mg protein was
electrofocused on immobilized pH 3–10 nonlinear pH gradient strip
(GE Healthcare Life Sciences, Chalfont, UK). For separation in the
second dimension, isoelectrically focused strips were
electrophoresed on gradient polyacrylamide gels. The relative
abundance of protein spots was quantified by staining the gels with
Coomassie Brilliant Blue followed by scanning with a GS-710 imaging
densitometer (Bio-Rad Laboratories, Inc., Hercules, CA, USA) and
analysis with Melanie 7 image analysis software (GE Healthcare Life
Sciences). Labeled images were analyzed using Adobe Photoshop
(version 7.0) software (Adobe Systems, Inc., San Jose, CA, USA).
For matrix-assisted laser desorption ionization-time of flight
(MALDI-TOF) analysis, tryptic peptides were desalted and purified
using a mixture of Poros R2 and Oligo R3 (Applied Biosystems;
Thermo Fisher Scientific, Inc.). The mass spectrometry (MS) spectra
of peptides were determined by spectrometric analysis using the
4800 MALDITOF/TOF™ Analyzer (Applied Biosystems; Thermo Fisher
Scientific, Inc.). The operating software used was Applied
Biosystems 4000 series Data Explorer version 4.4. At the end of the
macro process, the centroid mass, resolution, height, and
signal/noise ratio were determined for each peak. Data were
converted to a Microsoft Excel file (Microsoft Corporation,
Redmond, WA, USA) and used for a Mascot search (Matrix Science,
Ltd., London, UK; version 2.2.04). For LC-MS/MS analysis, a nano
chip column (150×0.075 mm; Agilent Technologies, Inc., Santa Clara,
CA, USA) was used for peptide separation. Ion spectra were
determined in the information-dependent acquisition mode and
analyzed by Agilent 6530 Accurate-Mass Q-TOF LC-MS system (Agilent
Technologies, Inc.). Mascot (version 2.2.04) was used to identify
peptide sequences present in the protein sequence database of the
National Center for Biotechnology Information (human).
Western blotting
Proteins were isolated with SDS lysis buffer and
quantified using a Bradford assay. Lysates (30 µg) were separated
in 8% or 10% SDS-polyacrylamide gels and transferred to Immobilon-P
membranes (EMD Millipore). Membranes were blocked with 5% skim milk
in Tris-buffered saline containing 0.2% Tween 20 for 30 min at room
temperature and incubated overnight with primary antibodies diluted
in blocking solution at 4°C. Primary antibodies used were anti-ENO
(1:1,000; anti-rabbit IgG; Proteintech Group, Inc.), HIF-1α
(1:1,000; anti-mouse IgG1), GLUT1 (1:1,000; anti-rabbit IgG), GLUT3
(1:1,000; anti-rabbit IgG), GAPDH (1:3,000; anti-mouse IgG; cat.
no. sc-47724; Santa Cruz Biotechnology, Inc.) and tubulin (1:3,000;
anti-mouse IgG; cat. no. sc-5274; Santa Cruz Biotechnology, Inc.).
The membranes were incubated with a horseradish peroxidase
(HRP)-conjugated secondary antibody (1:10,000; anti-mouse IgG, cat.
no. PI-2000; anti-rabbit IgG, cat. no. PI-1000; Vector
Laboratories, Ltd., Peterborough, UK) for 1 h in blocking solution,
and blots were visualized using Immobilon Western Chemiuminescent
HRP Substrate (EMD Millipore).
RNA isolation and reverse
transcription-quantitative polyerase chain reaction (RT-qPCR)
Total RNA was isolated from ASCs using an RNeasy
Mini kit (Qiagen GmbH, Hilden, Germany) and cDNA was synthesized
using a cDNA synthesis kit (Promega Corporation, Madison, WI, USA).
The GLUT1, GLUT3, ENO1, GAPDH, hexokinase 2 (HK2), LDHα and 18S
rRNA cDNA were amplified using SYBR Green PCR Master mix (Takara
Bio, Inc., Otsu, Japan) in a StepOne™ Real-time PCR system (Applied
Biosystems; Thermo Fisher Scientific, Inc.). PCR reactions were
incubated for 2 min at 95°C, followed by 35 cycles of 20 sec at
95°C, 40 sec at 58°C and 1 min at 72°C, with a final step of 5 min
at 72°C. The quantity of each cDNA was normalized by dividing it by
the 18S rRNA level in the corresponding sample. The sequences of
the qPCR primers were as follows: Forward,
5′-TCACTGTGCTCCTGGTTCTG-3′ and reverse, 5′-CTTGTGCTCCTGAGAGATCC-3′
for GLUT1; forward, 5′-ACCGGCTTCCTCATTACCTT-3′ and reverse,
5′-AGGCTCGATGCTGTTCATCT-3′ for GLUT3; forward,
5′-CGTACCGCTTCCTTAGA-3′ and reverse, 5′-GATGACACGAGGCTCAC-3′ for
ENO1; forward, 5′-CGAGATCCCTCCAAAATCAA-3′ and reverse,
5′-TGTGGTCATGAGTCCTTCCA-3′ for GAPDH; forward,
5′-CCAGTTCATTCACATCATCAG-3′ and reverse, 5′-CTTACACGAGGTCACATAGC-3′
for HK2; and forward, 5′-TGGAGTGGAATGAATGTTGC-3′ and reverse,
5′-ATAGCCCAGGATGTGTAGCC-3′ for LDHα.
PCR array
To analyze alterations in the expression of human
nutrient/drug transporters in hypoxia, an Human Drug Transporters
RT2 Profiler™ PCR Array kit (Qiagen GmbH) was used.
Cells were seeded in 60 mm dishes at a density of 2.5×10⁵
cells/dish in α-MEM medium, and total RNA was isolated with an
RNeasy Mini kit (Qiagen GmbH) after 4 h of hypoxic induction. cDNA
was synthesized using Reverse Transcription system (Promega
Corporation), and gene expression was measured using the PCR array
kit according to the manufacturer's protocols.
Lactate production assay
Lactate production was determined using an L-lactate
colorimetric assay kit (cat. no. ab65331; Abcam) according to the
manufacturer's protocols. The lactate standard and samples with
assay buffer were prepared in 96-well plates, and then the reaction
mix and lactate enzyme mix were added to each well. The reaction
mixture was incubated for 30 min at room temperature and optical
density (OD) values at a wavelength of 450 nm were measured with a
microplate reader (Tecan Group AG., Männedorf, Switzerland). All
lactate production measurements were measured in triplicate.
Glucose uptake assay
Glucose uptake was measured using a glucose uptake
colorimetric assay kit (cat. no. ab-136955; Abcam) according to the
manufacturer's protocols. Cells were washed and resuspended in
Krebs-Ringer-Phosphate-Hepes buffer containing 20 mM HEPES, 5 mM
KH2PO4, 1 mM MgSO4, 1 mM CaCl2, 136 mM NaCl and 4.7 mM
KCl, pH 7.4. Glucose standards and samples with assay buffer were
prepared in 96-well plates, and the enzyme and amplification
reaction mixture was added to each well. The reaction solution was
incubated for 30 min at 37°C, and OD values at a wavelength of 412
nm were measured with a microplate reader (Tecan Group AG). All
glucose uptake measurements were performed in triplicate.
Statistical analysis
Means and standard deviations were analyzed using
Microsoft Excel software. Comparisons between two groups were
conducted using Student's t-test. P<0.01 was considered
to indicate a statistically significant difference.
Results
2D proteomic analysis under
hypoxia
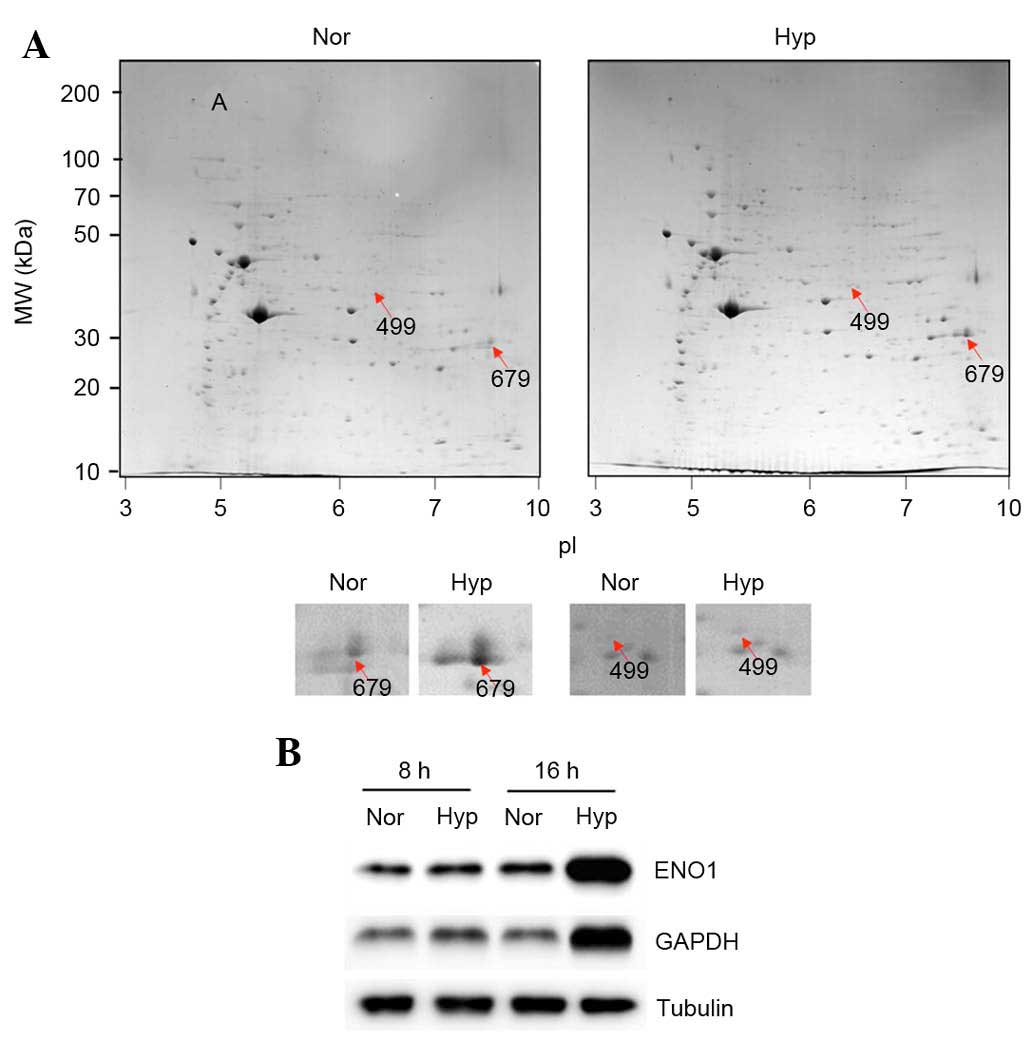
2D gel electrophoresis for proteomic analysis was
performed. Hypoxia (1%) increased the expression of 19 proteins
(>2-fold) and decreased the expression of 41 proteins
(<2-fold) as demonstrated by Coomassie Brilliant Blue staining
(Fig. 1A). The 19 upregulated
proteins were identified using LC-MS/MS and it was observed that
the following proteins were upregulated under hypoxia (Table I): collagen α-1(I) chain
preproprotein; chain A, moesin FERM domain bound to Ebp50
C-terminal peptide; chain C, structure of UDP-glucose dehydrogenase
V132 deletion; dystrophia myotonica-protein kinase isoform B,
partial; HLA-B associated transcript 1 variant; GDP dissociation
inhibitor 2, isoform CRA-a; ENO1; chain C, ornithine
aminotransferase mutant Y85i; proteasome (prosome, macropain) 26S
subunit, non-ATPase, 13, isoform CRA-a; NADH dehydrogenase
(ubiquinone) 1 α subcomplex subunit 10, mitochondrial; GAPDH;
guanine nucleotide-binding protein subunit β-2-like 1; Rho
GDP-dissociation inhibitor 1; trabeculin-α; peroxiredoxin 1,
isoform CRA-b, partial; and peptidylprolyl isomerase A. However,
the 42 downregulated were not identified. Of the upregulated
proteins, ENO1 (499; Fig. 1A) and
GAPDH (679; Fig. 1A) are directly
involved in glycolysis, and their upregulation was examined using
western blotting. As expected, it was observed that 1% hypoxia
upregulated the protein expression levels of GAPDH and ENO1 in ASCs
(Fig. 1B; after 8 and 16 h under
hypoxia).
 | Table I.List of upregulated proteins
identified in the two-dimensional proteomic screen. |
Table I.
List of upregulated proteins
identified in the two-dimensional proteomic screen.
| Spot no. | Protein name
(P<0.05) | Normoxia (%
vol) | Hypoxia (%
vol) | H/N ratio |
|---|
|
54 | Collagen alpha-1(I)
chain preproprotein | 0.038 | 0.078 | 2.0 |
|
220 | Chain A, moesin
FERM domain bound to Ebp50 C-terminal peptide | 0.079 | 0.175 | 2.2 |
|
384 | Chain C, structure
of UDP-glucose dehydrogenase V132 deletion | 0.070 | 0.137 | 2.0 |
|
460 | Dystrophia
myotonica-protein kinase isoform B, partial | 0.018 | 0.038 | 2.1 |
|
471 | HLA-B associated
transcript 1 variant | 0.025 | 0.049 | 2.0 |
|
483 | GDP dissociation
inhibitor 2, isoform CRA_a | 0.039 | 0.081 | 2.0 |
|
499 | Enolase 1 | 0.021 | 0.077 | 3.7 |
|
553 | Chain C, ornithine
aminotransferase mutant Y85i | 0.094 | 0.301 | 3.2 |
|
629 | Proteasome
(prosome, macropain) 26S subunit, non-ATPase, 13, isoform
CRA_a | 0.034 | 0.098 | 2.9 |
|
658 | NADH dehydrogenase
(ubiquinone) 1 α subcomplex subunit 10, mitochondrial | 0.048 | 0.094 | 2.0 |
|
679 |
Glyceraldehyde-3-phosphate
dehydrogenase | 0.844 | 1.946 | 2.3 |
|
791 | Guanine
nucleotide-binding protein subunit β-2-like 1 | 0.128 | 0.310 | 2.4 |
|
882 | Rho
GDP-dissociation inhibitor 1 | 0.089 | 0.192 | 2.2 |
|
975 | Trabeculin-α | 0.111 | 0.226 | 2.0 |
| 1004 | Peroxiredoxin 1,
isoform CRA_b, partial | 0.089 | 0.294 | 3.3 |
| 1114 | Peptidylprolyl
isomerase A (cyclophilin A) | 0.239 | 0.564 | 2.4 |
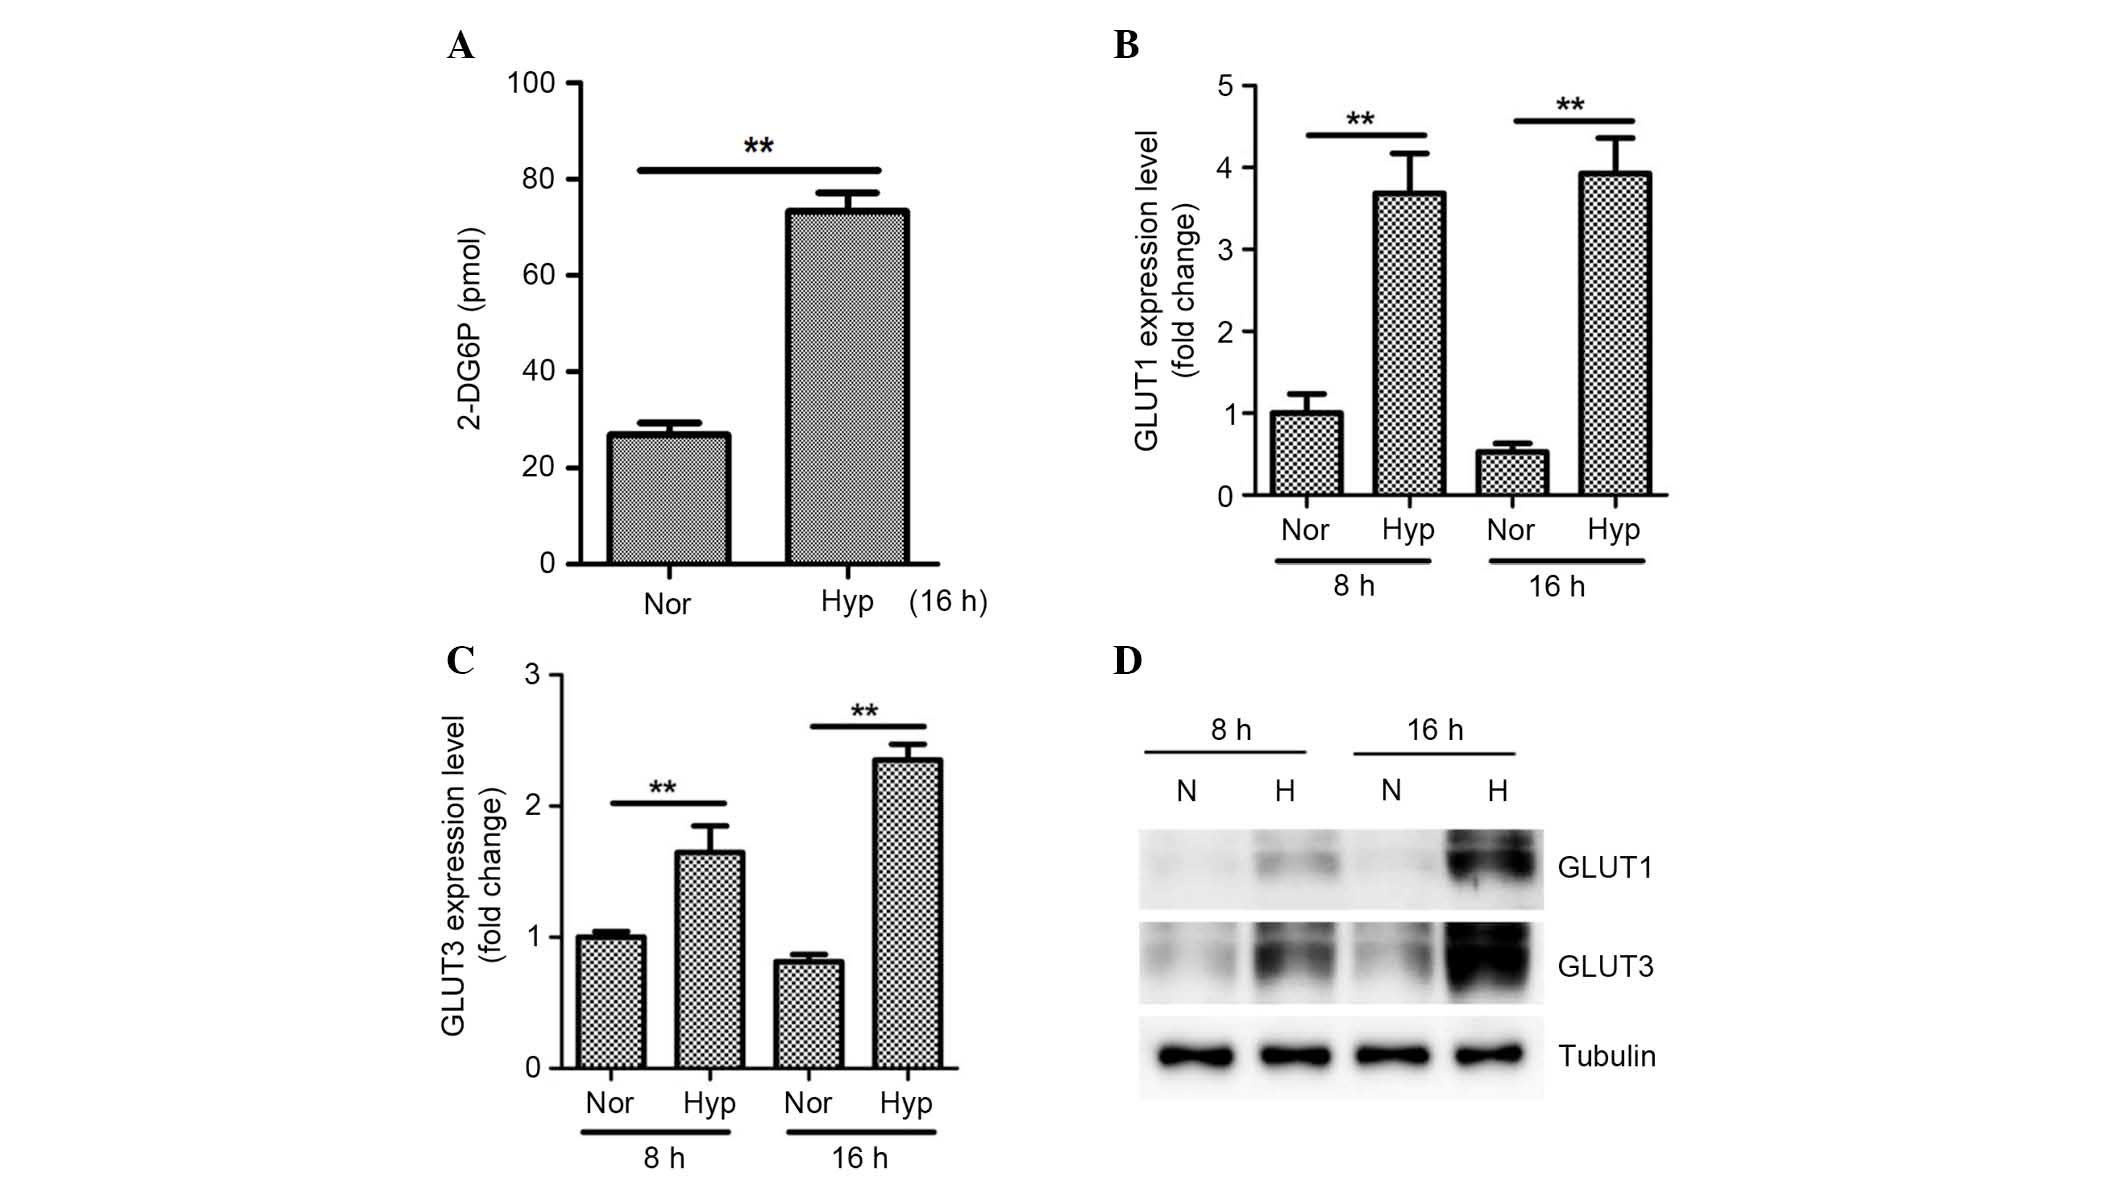
Hypoxia induces lactate production and
glycolytic enzyme expression in ASCs
As ENO1 and GAPDH protein expression were
significantly upregulated under hypoxia, lactate production was
also measured. Hypoxia significantly increased lactate production
by ASCs at 16 h (Fig. 2A;
P<0.01). In addition, the mRNA expression levels of other
glycolytic enzymes in ASCs were measured. As presented in Fig. 2B, hypoxia for 8 and 16 h
significantly increased the mRNA expression levels of the GAPDH,
ENO1, HK2 and LDHα genes as determined by qPCR analysis
(P<0.01).
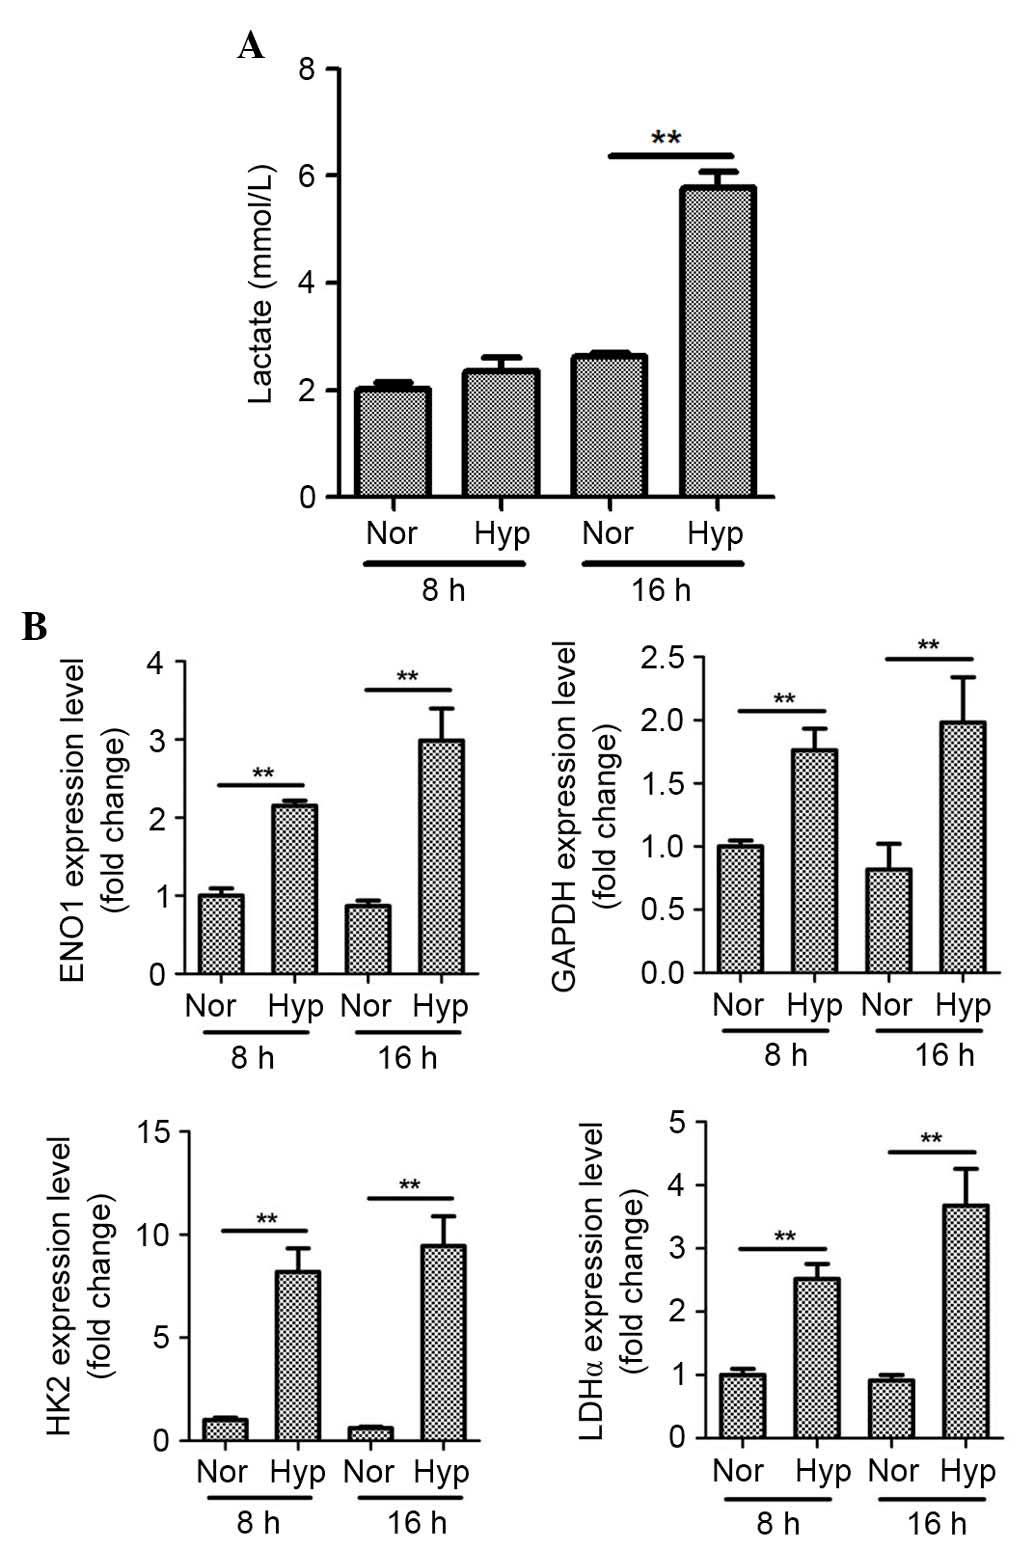 | Figure 2.Hypoxia induces lactate production and
expression of glycolytic enzyme mRNAs in ASCs. (A) Hypoxia (1%)
significantly increased lactate production by ASCs at 16 h. (B)
Hypoxia significantly increased the mRNA levels of GAPDH, ENO1,
HK2, and LDHα at 8 and 16 h as determined by quantitative
polymerase chain reaction analysis. n=3, **P<0.01. Nor,
normoxia; Hyp, hypoxia; ASCs, adipose-derived stem cells; ENO1,
enolase 1; HK2, hexokinase 2; LDHα, lactate dehydrogenase α. |
DFX (50 µM), a pharmacological mimic of hypoxia,
also significantly increased lactate production by ASCs at 16 h
(Fig. 3A; P<0.01). Similarly to
1% hypoxia, treatment with chemical hypoxia (at 8 and 16 h)
significantly upregulated mRNA expression levels of GAPDH, ENO1,
HK2, and LDHα genes in ASCs (Fig.
3B; P<0.01).
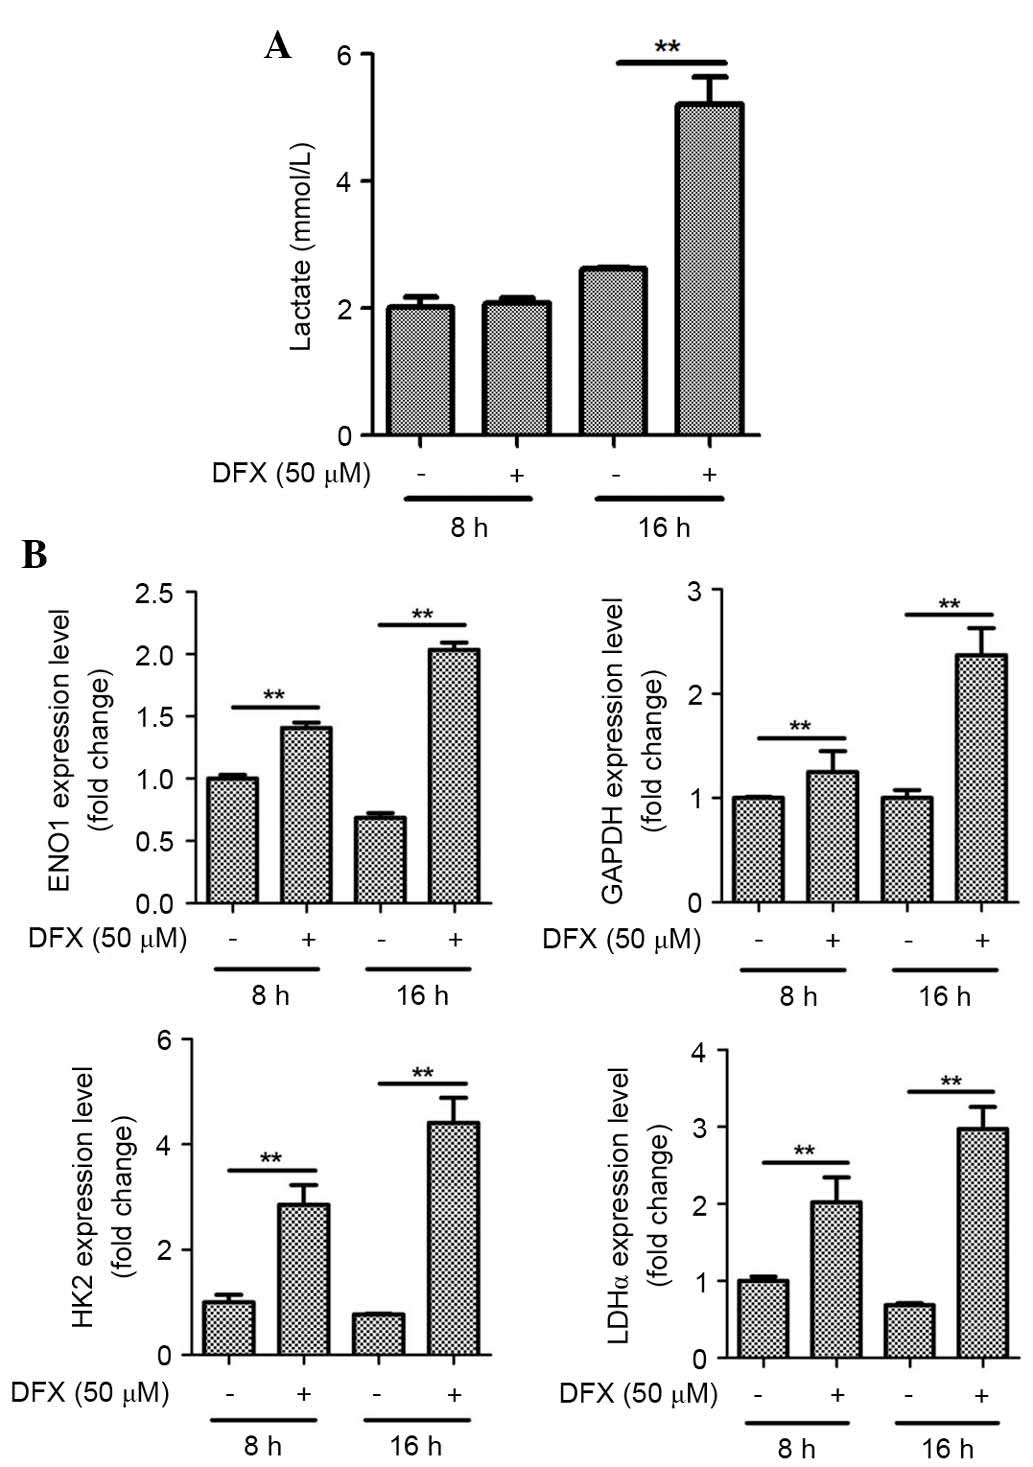 | Figure 3.Hypoxia mimic also induces lactate
production and mRNA expression of glycolytic enzymes in ASCs. (A)
DFX (50 µM), a pharmacological mimetic of hypoxia, increased
lactate production by ASCs. (B) DFX also upregulated the mRNA
expression of GAPDH, ENO1, HK2, and LDHα in ASCs. n=3, **P<0.01.
DFX, deferoxamine; ASCs, adipose-derived stem cells; ENO1, enolase
1; HK2, hexokinase 2; LDHα, lactate dehydrogenase α. |
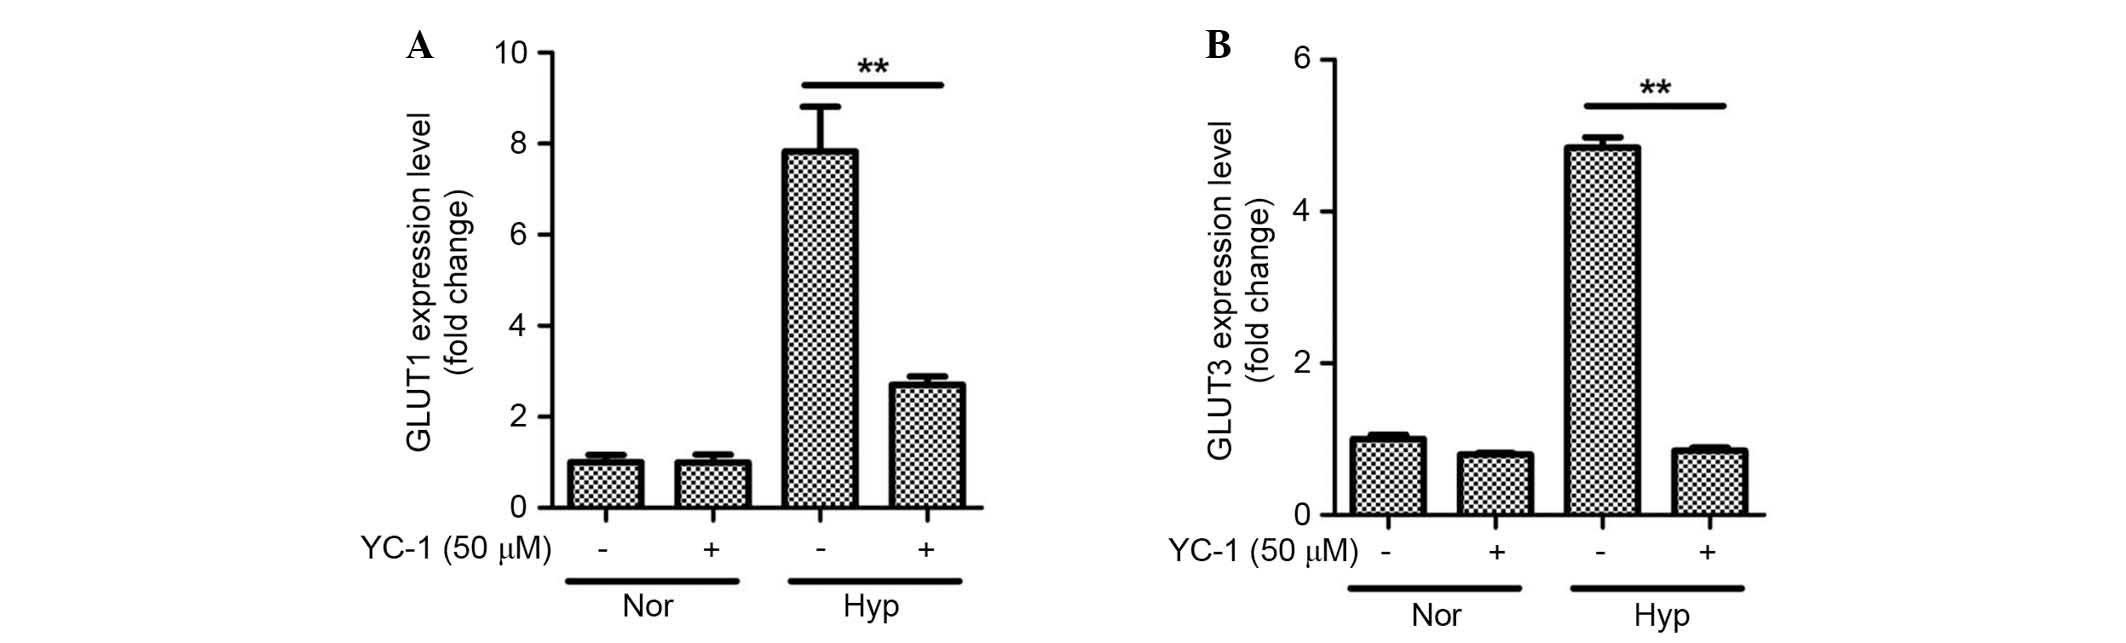
HIF-1α was involved in hypoxia-induced
lactate production and glycolytic enzyme expression
As HIF-1α has been reported to mediate the
functional alterations of ASCs under hypoxia (1,3,20),
the current study measured HIF-1α induction using western blotting.
As expected, HIF-1α was induced under hypoxia (Fig. 4A). Conversely, inhibitors of the
HIF-1α signaling pathway (50 µM YC-1 treatment) attenuated the
induction of HIF-1α.
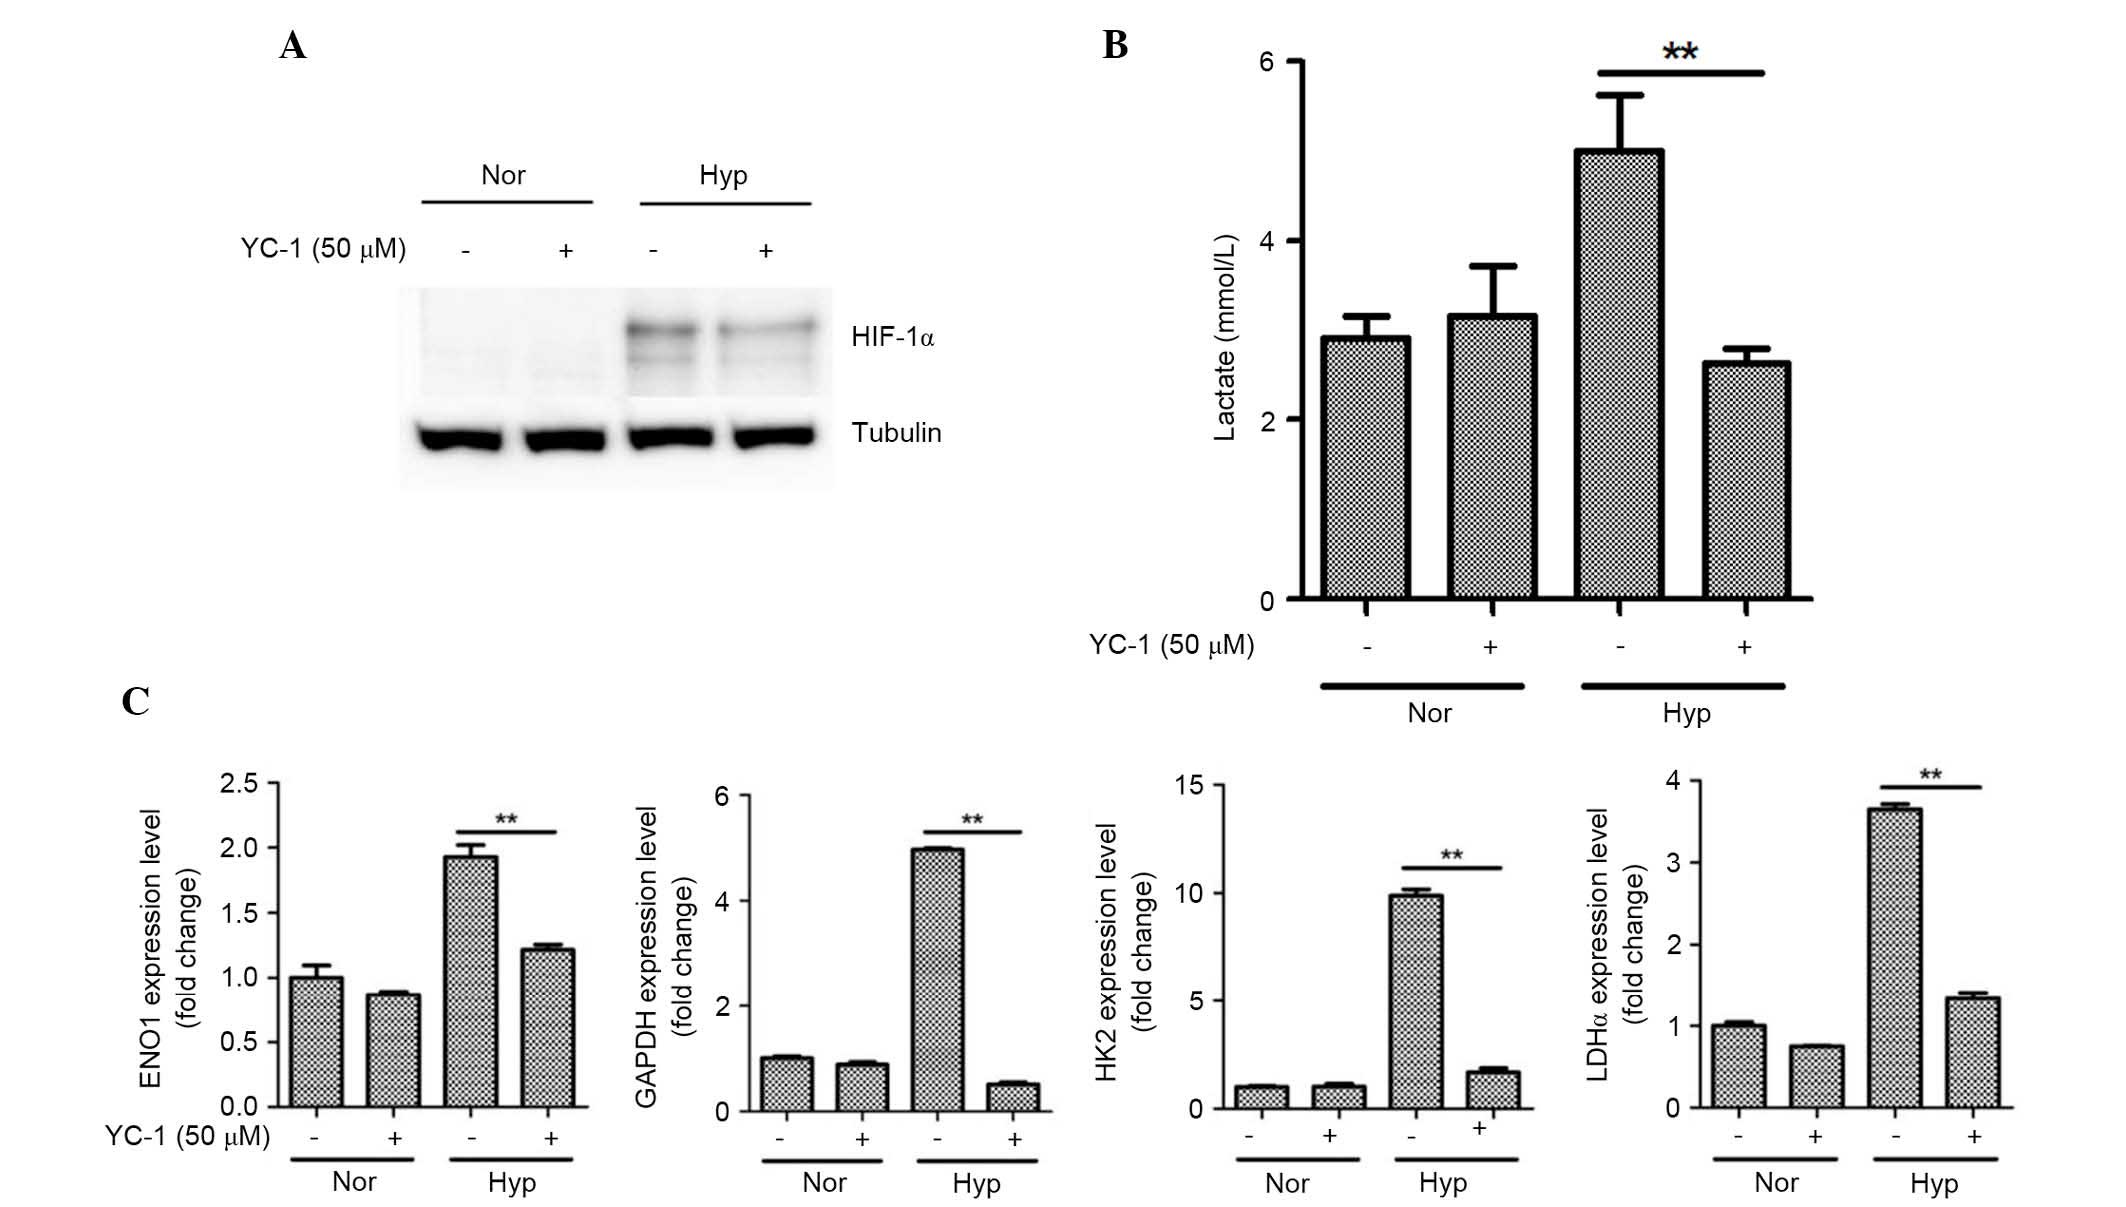 | Figure 4.HIF-1α is involved in lactate
production and mRNA expression of glycolytic enzymes in ASCs. (A)
Hypoxia (1%) stabilized the HIF-1α expression, however, YC-1
reduced the HIF-1α protein expression levels as demonstrated by
western blotting. (B) YC-1 inhibited lactate production under
hypoxia. (C) YC-1 also attenuated the hypoxia-induced mRNA level of
GAPDH, ENO1, HK2, and LDHα at 16 h in ASCs. n=3, **P<0.01. Nor,
normoxia; Hyp, hypoxia; HIF-1α, hypoxia-inducible factor 1-α; ASCs,
adipose-derived stem cells; ENO1, enolase 1; HK2, hexokinase 2;
LDHα, lactate dehydrogenase α. |
The involvement of the HIF-1α signaling pathway in
lactate production was further investigated using pharmacological
inhibition studies. As expected, YC-1 (50 µM) significantly
attenuated hypoxia-induced lactate production at 16 h under hypoxia
(Fig. 4B; P<0.01). In addition,
the altered mRNA expression levels of glycolytic enzymes were
measured. YC-1 also attenuated the induction of mRNA expression of
GAPDH, ENO1, HK2, and LDHα at 16 h under hypoxia in ASCs (Fig. 4C; P<0.01).
Hypoxia increases glucose uptake in
ASCs
As glycolysis pathways are induced under hypoxia,
the present study examined whether or not hypoxia increases glucose
uptake in ASCs. The altered expression of nutrient/drug
transporters in ASCs was examined using an RT2 Profiler
PCR array. Hypoxia significantly upregulated solute carrier family
2 (SLC2) member 1 (GLUT1) expression (data not shown). Thus,
enhanced glucose uptake by ASCs was measured using a glucose uptake
assay kit and it was demonstrated that 1% hypoxia significantly
increased glucose uptake (Fig. 5A;
P<0.01). In addition to GLUT1, other SLC2 family members (the
GLUT genes) have been reported to mediate glucose uptake in various
cells (21,22), and so alterations of expression of
other SLC2 family members in ASCs was also examined. As presented
in Fig. 5 and Table II, hypoxia significantly
upregulated the mRNA expression levels of GLUT1 (Fig. 5B; P<0.01), GLUT3 (Fig. 5C; P<0.01), and GLUT5 of ASCs as
determined by qPCR. However, as GLUT5 predominantly mediates
fructose transport, it was assumed that GLUT1 and GLUT3 largely
mediate hypoxia-increased glucose uptake in ASCs. The present study
also confirmed the increased protein expression of GLUT1 and GLUT3
under hypoxia by western blotting (Fig. 5D).
| Table II.GLUT expression under hypoxic
conditions. |
Table II.
GLUT expression under hypoxic
conditions.
| GLUT isoform | Normoxia 8 h
(Cq±SD) | Hypoxia 8 h
(Cq±SD) | Normoxia 16 h
(Cq±SD) | Hypoxia 16 h
(Cq±SD) |
|---|
| Glut1 |
27.82±0.19 |
26.23±0.20 |
28.59±0.31 |
25.98±0.03 |
| Glut2 |
28.74±0.2 |
29.59±0.15 |
29.87±0.32 |
30.1±0.27 |
| Glut3 |
24.3±0.11 |
23.36±0.09 |
24.52±.14 |
23.12±0.04 |
| Glut4 |
30.77±0.06 |
31.2±0.28 |
31.4±0.43 |
31.98±0.18 |
| Glut5 |
30.62±0.25 |
28.71±0.22 |
30.81±0.13 |
26.65±0.13 |
| Glut8 |
27.04±0.01 |
27.35±0.1 |
27.09±0.15 |
27.05±0.03 |
| Glut12 |
28.92±0.11 |
29.6±0.03 |
29.5±0.1 |
29.68±0.08 |
HIF-1α is involved in hypoxia-induced
GLUT expression
It was further examined whether or not HIF-1α
mediates GLUT expression. As expected, YC-1 inhibited the
expression of GLUT1 (Fig. 6A;
P<0.01) and GLUT3 (Fig. 6B;
P<0.01) under hypoxic conditions in ASCs. These results indicate
that the HIF-1α is involved in hypoxia-induced glucose uptake by
ASCs.
Discussion
The present study primarily investigated the altered
glucose uptake and metabolism of ASCs under hypoxia. In addition,
the current study aimed to identify the underlying molecular
mechanisms involved in the hypoxia-induced glucose uptake and
lactate production of ASCs. As determined by proteomic analysis and
western blotting, GAPDH and ENO1 expression levels were upregulated
under hypoxia. In addition, lactate production was significantly
increased, and the mRNA levels of glycolytic enzymes were elevated.
The underlying mechanism involved in the upregulation of these
genes was investigated, and it was observed that HIF-1α protein
expression levels were increased. Pharmacological inhibitors of
HIF-1α significantly attenuate hypoxia-induced lactate production
and glycolytic enzyme expression. As glycolytic pathways are
induced under hypoxia, the present study investigated whether or
not hypoxia increases glucose uptake in ASCs. As expected, hypoxia
significantly increased glucose uptake in ASCs. The mRNA expression
levels of glucose transporters were measured in ASCs under hypoxia,
and it was demonstrated that GLUT1 and GLUT3 expression were
upregulated, as determined by qPCR and western blotting. It was
also observed that pharmacological inhibition of HIF-1α
significantly attenuated hypoxia-induced GLUT1 and GLUT3
expression. These results indicate that hypoxia increases glucose
uptake via GLUT1 and GLUT3 upregulation, and induces the anaerobic
metabolism of ASCs via GAPDH, ENO1, HK2 and LDHα.
Proteomic analysis has been used to investigate the
underlying molecular mechanisms of proliferation and
differentiation of mesenchymal stem cells (MSCs). Using a 2D
electrophoretic analysis, Roche et al (23) reported that the intracellular
proteins of bone marrow-derived MSCs and ASCs are similar, and that
these two cell types are interchangeable with respect to use in
cell-based therapy. A comparative secretome analysis of MSCs
demonstrated that during osteogenesis, calcium
homeostasis-associated proteins are upregulated, whereas, stem cell
proliferation-associated proteins and other lineage-associated
proteins are downregulated (24).
Zeng et al (25)
investigated the effects of chemical hypoxia induced by cobalt
chloride on human umbilical cord MSCs and observed that
peroxiredoxin 1 was downregulated, whereas, ENO1 and synaptic
vesicle membrane protein VAT-1 homolog were upregulated. The
present study examined glucose uptake and metabolism under hypoxia
using 2D proteomic analysis, and observed that physical hypoxia (1%
oxygen) significantly upregulated GAPDH and ENO1 expression to
induce the glycolytic pathway in ASCs.
GAPDH is regarded as a housekeeping gene, and is
widely used as a reference gene in RT-PCR and qPCR. Accordingly,
the mRNA expression levels of certain growth factors were measured
under hypoxia and their expression was compared using GAPDH as a
reference gene. Although the cycle of quantification value of GAPDH
under hypoxia was not different from that under normoxia in
previous studies (2% oxygen, serum-free, at 4 h) (4,8), 1%
hypoxia in fetal bovine serum (usually at 16 h) in the present
study significantly increased the expression level of GAPDH mRNA in
ASCs. Although GAPDH has long been used as a default reference gene
in quantitative mRNA profiling experiments, its expression
reportedly varies in response to HIF-1α in a range of
pathophysiological environments, including inflammation, oxidative
stress, hyperinsulinemia and hypoxia (26–28).
Thus, GAPDH is an unreliable housekeeping gene for normalizing gene
expression under hypoxia, and should be replaced by alternative
validated reference genes (26,28).
GAPDH should be used with caution as a reference gene in
hypoxia-associated experiments.
A preliminary study investigated the altered
expression of nutrient/drug transporters under hypoxia using an
RT2 Profiler PCR array. In addition to its effect on
SLC2A1 (GLUT1) mRNA levels, 1% hypoxia increased solute carrier
family 22 member 1 (SLC22A1; also termed organic cation transporter
1) mRNA expression levels (2-fold increase). However, SLC22A1
expression did not change in qPCR analysis in a preliminary study.
Although nutrient/drug transporters may have diverse effects on
ASCs, their physiological or functional roles have not been fully
investigated. We previously demonstrated that vitamin C treatment
increases the proliferation of and enhances the hair-regenerative
potential of ASCs via a sodium-dependent vitamin C transporter
(6). The present study
demonstrated that hypoxia upregulated GLUT1 and GLUT3 expression,
which increased glucose uptake by ASCs, thereby inducing their
proliferation. van Dijk et al (29) also reported that breast cancer
resistance protein protects ASCs against ischemic damage. Although
studies regarding nutrient/drug transporters in stem cell research
are in their early stages, the functional role of nutrient/drug
transporters in ASCs may be notable.
GLUT is a membrane protein that facilitates the
transport of glucose across cell membranes. GLUT contains 12
membrane-spanning helices, and, to date, 13 members of the
GLUT/SLC2 family have been identified (30–32).
Tissue expression, substrate specificity, and transport kinetics of
GLUT differ in physiological conditions. Notably, hypoxia has been
reported to alter the expression of specific isoforms of GLUT, and
also to alter glucose metabolism in various types of cell (33). For example, the hypoxia-responsive
proteins GLUT1 and GLUT3 function as glucose sensors in
chondrocytes, and their expression levels are upregulated by HIF-1α
(33). Hypoxic preconditioning
also stimulates glucose uptake and metabolism of rat bone
marrow-derived MSCs, via upregulation of the expression of HIF-1α
and GLUT1 (34). In addition to
hypoxia, bFGF also induces HIF-1α, and regulates glucose metabolism
via GLUT1 induction in adipocytes (35). The present study demonstrated that
hypoxia significantly induces GLUT1 and GLUT3 to increase the
proliferation of ASCs.
In conclusion, the current study investigated the
altered glucose uptake and metabolism of ASCs under hypoxia, and
identified the underlying signaling pathways and molecular
mechanisms. The results of the present study indicate that hypoxia
increases glucose uptake via GLUT1 and GLUT3 upregulation, and
induces lactate production via GAPDH, ENO1, HK2 and LDHα.
Furthermore, HIF-1α signaling pathways are involved in this altered
glucose uptake and metabolism in ASCs. Thus, anaerobic metabolism
under hypoxia favors the proliferation of ASCs.
Acknowledgements
The present study was supported by the National
Research Foundation, funded by the Korean government (grant no.
2014054836) and Chung-Ang University Research Grants in 2015.
References
|
1
|
Chung HM, Won CH and Sung JH: Responses of
adipose-derived stem cells during hypoxia: Enhanced
skin-regenerative potential. Expert Opin Biol Ther. 9:1499–1508.
2009. View Article : Google Scholar : PubMed/NCBI
|
|
2
|
Kim JH, Park SH, Park SG, Choi JS, Xia Y
and Sung JH: The pivotal role of reactive oxygen species generation
in the hypoxia-induced stimulation of adipose-derived stem cells.
Stem Cells Dev. 20:1753–1761. 2011. View Article : Google Scholar : PubMed/NCBI
|
|
3
|
Lee EY, Xia Y, Kim WS, Kim MH, Kim TH, Kim
KJ, Park BS and Sung JH: Hypoxia-enhanced wound-healing function of
adipose-derived stem cells: Increase in stem cell proliferation and
up-regulation of VEGF and bFGF. Wound Repair Regen. 17:540–547.
2009. View Article : Google Scholar : PubMed/NCBI
|
|
4
|
Kim JH, Song SY, Park SG, Song SU, Xia Y
and Sung JH: Primary involvement of NADPH oxidase 4 in
hypoxia-induced generation of reactive oxygen species in
adipose-derived stem cells. Stem Cells Dev. 21:2212–2221. 2012.
View Article : Google Scholar : PubMed/NCBI
|
|
5
|
Kang S, Kim SM and Sung JH: Cellular and
molecular stimulation of adipose-derived stem cells under hypoxia.
Cell Biol Int. 38:553–562. 2014. View Article : Google Scholar : PubMed/NCBI
|
|
6
|
Kim JH, Kim WK, Sung YK, Kwack MH, Song
SY, Choi JS, Park SG, Yi T, Lee HJ, Kim DD, et al: The molecular
mechanism underlying the proliferating and preconditioning effect
of vitamin C on adipose-derived stem cells. Stem Cells Dev.
23:1364–1376. 2014. View Article : Google Scholar : PubMed/NCBI
|
|
7
|
Hye Kim J, Gyu Park S, Kim WK, Song SU and
Sung JH: Functional regulation of adipose-derived stem cells by
PDGF-D. Stem Cells. 33:542–556. 2015. View Article : Google Scholar : PubMed/NCBI
|
|
8
|
Kim JH, Park SG, Song SY, Kim JK and Sung
JH: Reactive oxygen species-responsive miR-210 regulates
proliferation and migration of adipose-derived stem cells via
PTPN2. Cell Death Dis. 4:e5882013. View Article : Google Scholar : PubMed/NCBI
|
|
9
|
Park BS, Kim WS, Choi JS, Kim HK, Won JH,
Ohkubo F and Fukuoka H: Hair growth stimulated by conditioned
medium of adipose-derived stem cells is enhanced by hypoxia:
Evidence of increased growth factor secretion. Biomed Res.
31:27–34. 2010. View Article : Google Scholar : PubMed/NCBI
|
|
10
|
Kim JH, Kim SH, Song SY, Kim WS, Song SU,
Yi T, Jeon MS, Chung HM, Xia Y and Sung JH: Hypoxia induces
adipocyte differentiation of adipose-derived stem cells by
triggering reactive oxygen species generation. Cell Biol Int.
38:32–40. 2014. View Article : Google Scholar : PubMed/NCBI
|
|
11
|
Hsu SH, Chen CT and Wei YH: Inhibitory
effects of hypoxia on metabolic switch and osteogenic
differentiation of human mesenchymal stem cells. Stem cells.
31:2779–2788. 2013. View Article : Google Scholar : PubMed/NCBI
|
|
12
|
Meretoja VV, Dahlin RL, Wright S, Kasper
FK and Mikos AG: The effect of hypoxia on the chondrogenic
differentiation of co-cultured articular chondrocytes and
mesenchymal stem cells in scaffolds. Biomaterials. 34:4266–4273.
2013. View Article : Google Scholar : PubMed/NCBI
|
|
13
|
Gaspar JA, Doss MX, Hengstler JG, Cadenas
C, Hescheler J and Sachinidis A: Unique metabolic features of stem
cells, cardiomyocytes, and their progenitors. Circ Res.
114:1346–1360. 2014. View Article : Google Scholar : PubMed/NCBI
|
|
14
|
Ito K and Suda T: Metabolic requirements
for the maintenance of self-renewing stem cells. Nat Rev Mol Cell
Biol. 15:243–256. 2014. View
Article : Google Scholar : PubMed/NCBI
|
|
15
|
Dong Q, Yang Y, Song L, Qian H and Xu Z:
Atorvastatin prevents mesenchymal stem cells from hypoxia and
serum-free injury through activating AMP-activated protein kinase.
Int J Cardiol. 153:311–316. 2011. View Article : Google Scholar : PubMed/NCBI
|
|
16
|
Suda T, Takubo K and Semenza GL: Metabolic
regulation of hematopoietic stem cells in the hypoxic niche. Cell
Stem Cell. 9:298–310. 2011. View Article : Google Scholar : PubMed/NCBI
|
|
17
|
Mohyeldin A, Garzon-Muvdi T and
Quinones-Hinojosa A: Oxygen in stem cell biology: A critical
component of the stem cell niche. Cell Stem Cell. 7:150–161. 2010.
View Article : Google Scholar : PubMed/NCBI
|
|
18
|
Buravkova LB, Rylova YV, Andreeva ER,
Kulikov AV, Pogodina MV, Zhivotovsky B and Gogvadze V: Low ATP
level is sufficient to maintain the uncommitted state of
multipotent mesenchymal stem cells. Biochim Biophys Acta.
1830:4418–4425. 2013. View Article : Google Scholar : PubMed/NCBI
|
|
19
|
Yi T, Kim WK, Choi JS, Song SY, Han J, Kim
JH, Kim WS, Park SG, Lee HJ, Cho YK, et al: Isolation of
adipose-derived stem cells by using a subfractionation culturing
method. Expert Opin Biol Ther. 14:1551–1560. 2014. View Article : Google Scholar : PubMed/NCBI
|
|
20
|
Gao W, Qiao X, Ma S and Cui L:
Adipose-derived stem cells accelerate neovascularization in
ischaemic diabetic skin flap via expression of hypoxia-inducible
factor-1α. J Cell Mol Med. 15:2575–2585. 2011. View Article : Google Scholar : PubMed/NCBI
|
|
21
|
Ren BF, Deng LF, Wang J, Zhu YP, Wei L and
Zhou Q: Hypoxia regulation of facilitated glucose transporter-1 and
glucose transporter-3 in mouse chondrocytes mediated by HIF-1alpha.
Joint Bone Spine. 75:176–181. 2008. View Article : Google Scholar : PubMed/NCBI
|
|
22
|
Vannucci SJ, Reinhart R, Maher F, Bondy
CA, Lee WH, Vannucci RC and Simpson IA: Alterations in GLUT1 and
GLUT3 glucose transporter gene expression following unilateral
hypoxia-ischemia in the immature rat brain. Brain Res Dev Brain
Res. 107:255–264. 1998. View Article : Google Scholar : PubMed/NCBI
|
|
23
|
Roche S, Delorme B, Oostendorp RA, Barbet
R, Caton D, Noel D, Boumediene K, Papadaki HA, Cousin B, Crozet C,
et al: Comparative proteomic analysis of human mesenchymal and
embryonic stem cells: Towards the definition of a mesenchymal stem
cell proteomic signature. Proteomics. 9:223–232. 2009. View Article : Google Scholar : PubMed/NCBI
|
|
24
|
Kim JM, Kim J, Kim YH, Kim KT, Ryu SH, Lee
TG and Suh PG: Comparative secretome analysis of human bone
marrow-derived mesenchymal stem cells during osteogenesis. J Cell
Physiol. 228:216–224. 2013. View Article : Google Scholar : PubMed/NCBI
|
|
25
|
Zeng HL, Zhong Q, Jia HT, Qing YL, Bu QQ,
Han XA and Liu HW: Differential proteomic analysis in human
umbilical cord mesenchymal stem cells induced by cobalt chloride.
Zhonghua Xue Ye Xue Za Zhi. 32:739–743. 2011.(In Chinese).
PubMed/NCBI
|
|
26
|
Tan SC, Carr CA, Yeoh KK, Schofield CJ,
Davies KE and Clarke K: Identification of valid housekeeping genes
for quantitative RT-PCR analysis of cardiosphere-derived cells
preconditioned under hypoxia or with prolyl-4-hydroxylase
inhibitors. Mol Biol Rep. 39:4857–4867. 2012. View Article : Google Scholar : PubMed/NCBI
|
|
27
|
Chiche J, Pommier S, Beneteau M, Mondragón
L, Meynet O, Zunino B, Mouchotte A, Verhoeyen E, Guyot M, Pagès G,
et al: GAPDH enhances the aggressiveness and the vascularization of
non-Hodgkin's B lymphomas via NF-kB-dependent induction of HIF-1α.
Leukemia. 29:1163–1176. 2015. View Article : Google Scholar : PubMed/NCBI
|
|
28
|
Cummings M, Sarveswaran J,
Homer-Vanniasinkam S, Burke D and Orsi NM:
Glyceraldehyde-3-phosphate dehydrogenase is an inappropriate
housekeeping gene for normalising gene expression in sepsis.
Inflammation. 37:1889–1894. 2014. View Article : Google Scholar : PubMed/NCBI
|
|
29
|
van Dijk A, Naaijkens BA, Jurgens WJ,
Oerlemans R, Scheffer GL, Kassies J, Aznou J, Brouwer M, van Rossum
AC, Schuurhuis GJ, et al: The multidrug resistance protein breast
cancer resistance protein (BCRP) protects adipose-derived stem
cells against ischemic damage. Cell Biol Toxicol. 28:303–315. 2012.
View Article : Google Scholar : PubMed/NCBI
|
|
30
|
Gould GW and Holman GD: The glucose
transporter family: Structure, function and tissue-specific
expression. Biochem J. 295:329–341. 1993. View Article : Google Scholar : PubMed/NCBI
|
|
31
|
Mueckler M: Family of glucose-transporter
genes. Implications for glucose homeostasis and diabetes. Diabetes.
39:6–11. 1990. View Article : Google Scholar : PubMed/NCBI
|
|
32
|
Olson AL and Pessin JE: Structure,
function, and regulation of the mammalian facilitative glucose
transporter gene family. Annu Rev Nutr. 16:235–256. 1996.
View Article : Google Scholar : PubMed/NCBI
|
|
33
|
Mobasheri A, Richardson S, Mobasheri R,
Shakibaei M and Hoyland JA: Hypoxia inducible factor-1 and
facilitative glucose transporters GLUT1 and GLUT3: Putative
molecular components of the oxygen and glucose sensing apparatus in
articular chondrocytes. Histol Histopathol. 20:1327–1338.
2005.PubMed/NCBI
|
|
34
|
Zhu H, Chen X and Deng L: Effects of
hypoxic preconditioning on glucose metabolism of rat bone marrow
mesenchymal stem cells. Zhongguo Xiu Fu Chong Jian Wai Ke Za Zhi.
25:1004–1007. 2011.(In Chinese). PubMed/NCBI
|
|
35
|
Kihira Y, Yamano N, Izawa-Ishizawa Y,
Ishizawa K, Ikeda Y, Tsuchiya K, Tamaki T and Tomita S: Basic
fibroblast growth factor regulates glucose metabolism through
glucose transporter 1 induced by hypoxia-inducible factor-1alpha in
adipocytes. Int J Biochem Cell Biol. 43:1602–1611. 2011. View Article : Google Scholar : PubMed/NCBI
|