Introduction
Rheumatoid arthritis (RA), an inflammatory disorder
of the joints, is characterized by chronic synovitis, progressive
erosions and cartilage destruction, resulting in deformed and
painful joints and loss of joint function (1). RA affects 0.5–1% of adults worldwide
with 5–50 out of every 100,000 people diagnosed with the condition
annually, and it also has a greater incidence in females and
elderly populations (2). If
untreated, RA may result in joint damage, disability and a reduced
quality of life, and additionally cardiovascular diseases and other
comorbidities (3,4). The exact etiology of the condition
remains to be elucidated; however, certain studies suggest that RA
is associated with the overproduction of proinflammatory cytokines,
that prevent the maintenance of immunological homeostasis, and that
the cytokine milieu is responsible for the persistent immunological
responses that are central to the pathogenesis of RA (5,6). In
addition, an imbalance between the adaptive and innate immune
systems often contributes to the excessive immune responses
observed in RA (7). As a result,
activation and recruitment of immune cells into the joints,
particularly lymphocytes and monocytes, are characteristic of RA
(8).
Regulatory T cells (Treg) are a lymphocyte
subpopulation that is important in cell-mediated immunity (9). The activation of Tregs is mediated by
underlying mechanisms involving central and peripheral lymphoid
organs (10). Soluble programmed
death-1 (sPD-1), an immunoregulatory molecule member of the
immunoglobulin superfamily expressed in Tregs, is important in
downregulating the immune system (11). sPD-1 is a 55-kDa transmembrane
protein with 24% amino acid homology to cytotoxic T-lymphocyte
antigen 4 (CTLA-4) (6). Recent
studies have suggested that sPD-1 may be key to disease activity in
human RA (5,12). Consistent with this, a previous
study observed that sPD-1 expression levels are high in synovial
Tregs and macrophages from RA patients (13). Although the role of sPD-1 in Tregs
in patients with RA has been extensively studied, the underlying
mechanisms and its implications for RA remain to be elucidated
(14). In the current study, sPD-1
expression levels were investigated in peripheral blood Tregs from
RA patients and healthy controls and the effect of sPD-1 in RA
progression was assessed by alteration of its expression in Tregs,
via the use of small interfering RNA (siRNA).
Materials and methods
Patients
The present study was conducted between October 2012
and May 2014 on a population of RA patients (n=82) admitted to the
Pharmaceutical Department, The First People's Hospital of Jining
(Jining, China). Patients recruited to the study were carefully
evaluated to confirm they met the specific diagnostic criteria
required for RA (15). The study
subjects consisted of 35 female and 47 male RA patients, with a
mean age of 55±2.5 years and a disease duration range of 4–20
months. The patients had been recently diagnosed with the condition
or had not undergone treatment with corticosteroids or
immunosuppressive therapy within the previous year. Patients
suffering from other autoimmune diseases, malignant tumors, acute
or chronic pathogen infection or who had a history of allergies
were excluded. Within the study period, a total of 90 healthy
volunteers, 48 males and 42 females, with a mean age of 53±3.5
years, were enrolled as the healthy control (HC) group. Subjects
with other autoimmune diseases, a history of allergies or recent
history of infectious disease were excluded from the HC group. The
RA group and the HC group demonstrated no statistically significant
differences in age or gender. Following approval by the ethics
committee of The First People's Hospital of Jining, written
informed consent was obtained from each subject; the study
conformed to the Declaration of Helsinki (16).
Collection of blood samples
Following an overnight fast of 10–12 h, a volume of
10 ml of venous blood was obtained from all subjects. EDTA (5 ml)
served as an anticoagulant, and blood samples were stored at −70°C
until further use.
Extraction of peripheral blood
mononuclear cells (PBMCs)
Peripheral venous blood (2 ml) was collected in
vials containing EDTA, and was diluted with an equal volume of PBS.
The diluted blood was carefully layered onto 2 ml Ficoll solution
(density, 1.007; pH, 6.5–7.5; Ficoll separation solution:diluted
blood, 1:2 ratio; Shanghai No. 2 Reagent Factory, Shanghai, China),
ensuring that the interphase was not disturbed. Following
centrifugation in a swing bucket rotor at 626 × g at room
temperature for 20 min, the mixture separated into three layers,
and a milky turbid cell layer was obtained at the Ficoll-blood
interphase. The cell layer was carefully withdrawn using a Pasteur
pipette, transferred into a new centrifuge tube, diluted 1:5 with
PBS and centrifuged at in a swing bucket rotor 352 × g at
room temperature for 5 min. The supernatant was discarded and the
PBS wash was repeated once. The isolated PBMCs were resuspended in
PBS, and the cell concentration was adjusted to
1×10⁶/ml.
Fluorescence staining and flow
cytometry
The prepared PBMC suspension was vortexed, and 100
ml was added into flow tubes. A mixture containing 100 ml
fluorescein isothiocyanate (FITC)-conjugated anti-cluster of
differentiation (CD) 4 (cat. no. 11-0040-81) and 20 ml
phycoerythrin (PE)-conjugated anti-CD25 antibodies (cat. no.
12-0390-80; both from Shanghai Xin Le Bio Technology Co., Ltd.,
Shanghai, China) was added into each tube and incubated in the dark
at 4°C for 30 min. The mixture was washed once using 2 ml flow
cytometry staining buffer (Guangzhou Sagene Biotech Co., Ltd.,
Guangzhou, China) or cold PBS, and centrifuged in a swing bucket
rotor at 352 × g at room temperature for 5 min. The
supernatant was discarded and 20 ml rat anti-human forkhead box
protein 3 (FOXP3; clone, PCH101) antibody (cat. no. 12-4776-42;
Shanghai Xin Le Bio Technology Co., Ltd.) was added, and to the HC
group 20 ml IgG2a isotype negative control antibody (cat. no.
12-4321-83; Shanghai Xin Le Bio Technology Co., Ltd.) was added.
The incubation was performed in fresh membrane rupture buffer
(Shanghai Yes Service Biotech, Inc., Shanghai, China) in the dark
at 4°C for 30 min. The samples were washed with 2 ml membrane
permeabilization buffer (Shanghai Yes Service Biotech, Inc.) twice
and resuspended in 500 ml flow cytometry staining buffer. A total
of 1,000 cells were acquired from each sample on a flow cytometer
and the results were analyzed with CXP software version 10.0.7
(Beckman Coulter, Inc., CA, USA). The percentage of
CD4+CD25−FOXP3+ cells present
within the total CD4+ population was calculated.
Isolation and purification of
Tregs
PBMCs from the study subjects, obtained by Ficoll
density gradient separation, were used for the positive selection
of human CD4+CD25− Tregs with the Easy Sep
Human CD4+ T cell Enrichment kit (Stemcell Technologies,
Inc., Vancouver, BC, Canada). PBS containing 2% fetal calf serum
(FCS; Shanghai Yes Service Biotech, Inc.) and 1 mol/l EDTA was used
as isolation and purification buffer. The cell concentration was
adjusted to 1×10⁸/ml with isolation and purification
buffer, and ~2×10⁸ cells were added per tube. An
antibody cocktail (10 µl/ml) was added into polystyrene tubes and
incubated at room temperature for 15 min. Magnetic beads (5 µl/ml)
were added into the tubes, mixed and incubated at room temperature
for 10 min. The polystyrene tubes were vortexed, and inserted into
a magnet and incubated at room temperature for 5 min. The solution
in the tube was discarded, carefully retaining the magnetic beads.
The solution volume was adjusted to 2.5 ml with buffer, mixed to
wash the beads, inserted into the magnet again and incubated at
room temperature for 5 min. PBS (3 ml) was added into the
polystyrene tubes and centrifuged in a swing bucket rotor at 1,500
× g, at room temperature for 5 min. Following removal of the
supernatant, purified cells were obtained and an aliquot of the
cells was stained with anti-CD4-FITC and anti-CD25-PE. The purity
was determined as >90% via flow cytometry.
Transfection of siRNA-sPD-1
PBMCs from RA patients were divided into two groups:
One group was seeded in a 96-well culture plate containing complete
medium with 5×10³ CD4+CD25− Tregs
(90 µl) per well. The second group was seeded in a 96-well culture
plate following mixing with enhanced virus reagent (Engreen
Biosystem Co., Ltd., Auckland, New Zealand) with 5×10³
CD4+CD25− Tregs (90 µl) per well. Four
transfection groups, with three different concentration gradients
of multiplicity of infection (MOI) in each group were set up. To
estimate the optimal MOI, siRNA (5′-GATATTTGCTGTCTTTATA-3′) and
lentiviral vectors with meaningless sequences (Shanghai Genechem
Co., Ltd., Shanghai, China) at three different concentrations
(lx108, 1×10⁷ and lx106 TU/ml)
were prepared and added into corresponding wells. Diluted polybrene
solution (Shanghai Yeasen Biotechnology Co. Ltd. Shanghai, China)
was added. Following continuous culture for 12 h, fresh medium was
added and fluorescence expression was observed four days following
infection. The MOI of 10 led to a highly efficient infection in
CD4+CD25− Tregs. Based on this result, an MOI
of 10 was used for siRNA expression experiments. Accordingly,
4×10⁶ cells were inoculated in a culture flask in RPMI
1640 culture medium (Shanghai Yes Service Biotech, Inc.) containing
10% FCS and incubated at 37°C, 5% CO2. Cells were
divided into 3 groups: i) Untreated CD4+CD25−
Tregs (untreated group), ii) CD4+CD25− Tregs
expressing siRNA-sPD-1 (siRNA-sPD-1 group) and iii)
CD4+CD25− Tregs expressing meaningless
sequence (scramble group). The cells were infected at MOI 10 for a
total of 72 h. Cells were collected for protein quantification by
western blotting, and the remainder were stored at −20°C until
further use.
Western blotting to determine sPD-1
protein expression levels following transfection
Total protein was extracted using a Total Protein
Extraction kit (cat. no. LS1030; Promega Corporation, Madison, WI,
USA) according to the manufacturer's protocol. The proteins were
blotted sodium dodecyl sulfate polyacrylamide gel electrophoresis
(SDS-PAGE), the concentration of separation gel was 15% and the
concentration of spacer gel was 5%. Next, the proteins were
transferred to nitrocellulose filter (NC filter) with the condition
of 150 mA at 4°C for 3 h. The filter membrane was placed into a
mouse anti-GST mAb antibody (cat. no. 136700; 1:1,000; Shanghai Xin
Le Bio Technology Co., Ltd.) which was diluted by 2% skim milk
powder (prepared by TBS Tween-20). The filter membrane was then
incubated with horseradish peroxidase-goat anti-mouse IgG (cat. no
400002-500; 1:1,000; Shanghai Xin Le Bio Technology Co., Ltd.) was
used for testing. Enhancedchemiluminescence (ECL), using an
EasyBlot ECL kit (cat. no. 36222ES60; Shanghai Yeasen Biotechnology
Co., Ltd.) was used for developing, and the reaction was terminated
when the target band had clear staining. Bicinchoninic acid (BCA)
method was used to prepare standard protein solution, and β-actin
was regarded as internal reference with the molecular weight of 43
kD. Quantity One software version 4.31 (Bio-Rad Laboratories, Inc.,
Hercules, CA, USA) was used to detect the ratio of the protein
expressions of western blot and the grey value of internal
reference band and was used to quantify the total protein (17).
Flow cytometry for CTLA-4 and FOXP3
expression
Cells (1×10⁵/well) from the untreated,
siRNA-sPD-1 and scramble groups were seeded onto a 96-well plate
coated with 1 µg/ml anti-CD3 (cat. no. 04-460; Shanghai Xin Le Bio
Technology Co., Ltd.) and 1 µg/ml anti-CD28 (cat. no. 13-0281-81;
Shanghai Xin Le Bio Technology Co., Ltd.) and adjusted to a final
volume of 200 µl per well with RPMI 1640 containing 10% FCS. The
cells were cultured in a 37°C, 5% CO2 incubator and
collected after 24 h. Cells were washed with precooled PBS,
resuspended in 100 µl PBS, and anti-rat CD152-FITC (cat. no.
359-020)/CTLA-4-FITC (cat. no. 1790-02; Shanghai Xin Le Bio
Technology Co., Ltd.) antibodies were added, and incubated at 4°C
in the dark for 30 min. Cells were washed once with precooled PBS,
resuspended in 1 ml fixed/penetration working solution (Shanghai
Xin Le Bio Technology Co., Ltd.) per 106 cells, and
incubated at 4°C in the dark for 2 h. Subsequently, cells were
washed twice with 2 ml 1X membrane rupture buffer, resuspended in
PBS and detected by flow cytometry. FITC-IgG (1:1,000, cat. no.
5267919001) and FITC-IgG2α (1:1,000, cat. no. 1079-02) isotype
control antibodies (Shanghai Yes Service Biotech, Inc.) served as
negative controls.
Thiazolyl blue (MTT) assay
CD4+CD25− Tregs were
co-cultured with CD4+CD25− T cells at 1:1.
The CD4+CD25− T cells were set as a blank
control group. All cells were cultured with RPMI 1640 containing
10% FCS. Cells were seeded in a 96-well culture plate at
1×10⁵ cells (final volume, 200 µl) per well. Cells were
activated by 1 µg/ml anti-CD3 and 1 µg/ml anti-CD28 coated onto the
96-well plate. The remaining wells in the 96-well plate were filled
with 200 µl sterile PBS. MTT absorptiometry (Shanghai Xin Le Bio
Technology Co., Ltd.; cat. no. M6494) was performed. After 24 h of
incubation, the cells were washed with PBS, and 20 µl MTT solution
(5 mg/ml) was added to the cells. After another 24 h of incubation,
the supernatant was absorbed, and then added with 150 µl dimethyl
sulfoxide (Shanghai Yes Service Biotech, Inc.; cat. no.
WAK-DMSO-70), and the optical density (OD) values, at a wavelength
of 540 nm, were examined by KHB-ST-360 type microplate reader
(Shanghai Kehua Bio-Engineering Co., Ltd., Shanghai, China) the
following day.
Enzyme-linked immunosorbent assay
(ELISA)
Cells from the untreated, siRNA-sPD-1 and scramble
groups were seeded in 96-well plates coated with 1 µg/ml anti-CD3
(cat. no. 05121-25-5; Shanghai Yes Service Biotech, Inc.) and 1
µg/ml anti-CD28 (cat. no. 10311-25-500; Shanghai Yes Service
Biotech, Inc.), and incubated in a 37°C, 5% CO2
incubator. After 24 h, the supernatant from each group was
collected and stored at −80°C for detection of interleukin (IL)-10,
transforming growth factor-β TGF-β), IL-4 and interferon-γ (IFN-γ)
levels. Cells obtained from the three groups were used to detect
the activity of nuclear factor of activated T cells (NFAT) with
nucleoprotein extracted using the NE-PER nuclear and cytoplasmic
extract kit (cat. no. 78833; Shanghai Maibio Biotech Co., Ltd,
Shanghai, China) and detected by luminex ELISA test kit (cat. no.
40-50016; Luminex Corporation, Shanghai, China) according to the
manufacturer's protocol. OD values at a wavelength of 450 nm were
recorded.
Statistical analysis
Statistical analysis was conducted using SPSS
software version 20.0 (IBM SPSS, Armonk, NY, USA). Data are
presented as the mean ± standard deviation. The data of each group
were normally distributed. The comparison of independent samples
between two groups was conducted using a unpaired Student's t-test,
and comparison of data among multiple groups was performed using
one-way analysis of variance. The least significant difference test
was used in the pairwise comparison. Pearson correlation analysis
was performed for the correlation between sPD-1 and
CD4+CD25−FOXP3+/CD4+.
P<0.05 was considered to indicate a statistically significant
difference.
Results
Peripheral blood CD4, CD25, FOXP3 and
sPD-1 expression
The percentage of peripheral blood
CD4+CD25−FOXP3+ cells of the total
CD4+ population in the RA group was significantly
reduced compared with the HC group (5.87±1.20 vs. 6.70±1.45%;
P<0.001; Fig. 1A). The RA group
had significantly greater sPD-1 levels compared with the HC group
(2.04±0.14 vs. 1.05±0.12; P<0.001; Fig. 1B). The expression of sPD-1 was
negatively correlated with
CD4+CD25−FOXP3+/CD4+
cells (r=−0.855; P<0.001; Fig. 1C).
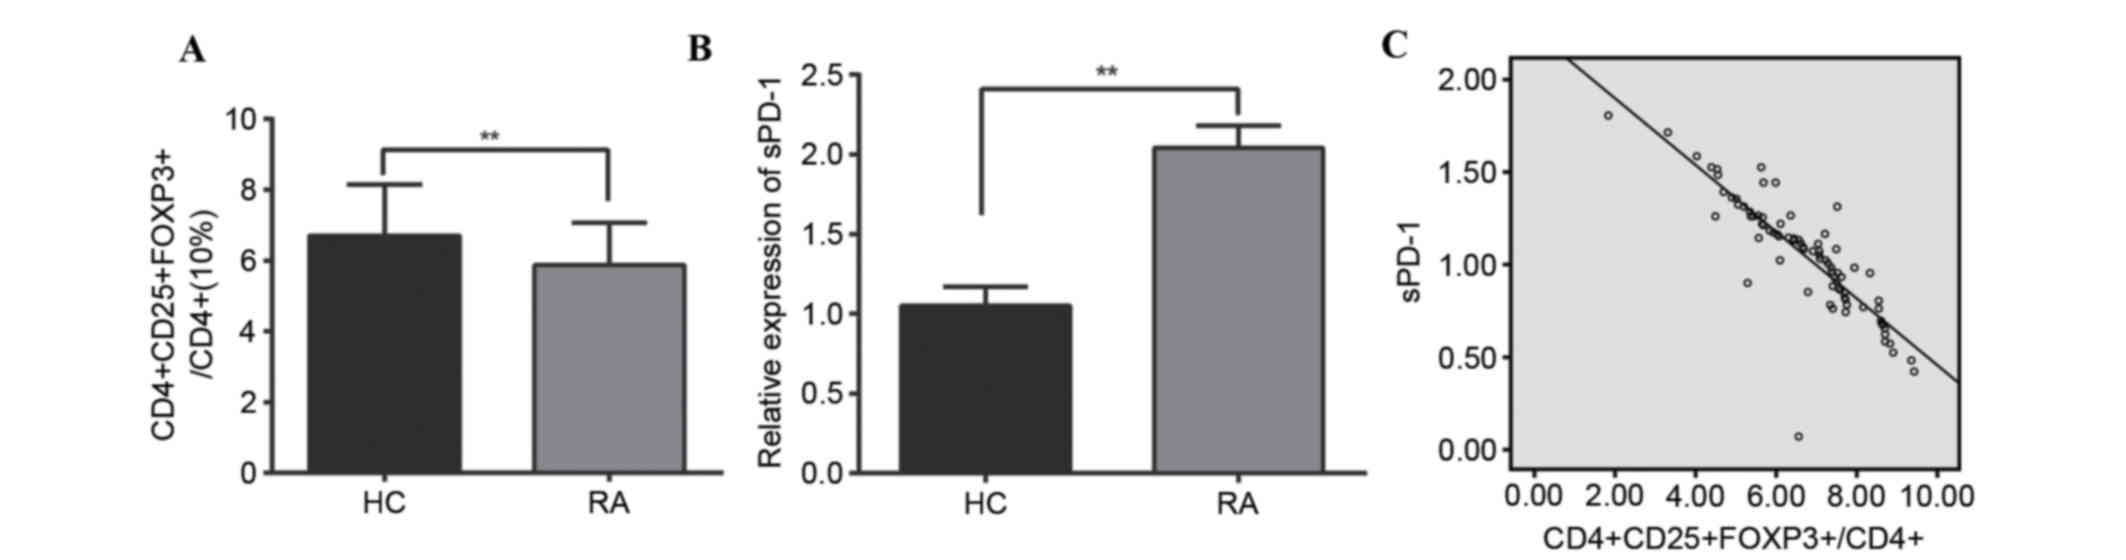 | Figure 1.Peripheral blood CD4, CD25, FOXP3 and
sPD-1 expression in RA patients and HC. (A)
CD4+CD25−FOXP3+ cells in
peripheral blood, as a % of total CD4+ cells. (B) sPD-1
expression in peripheral blood. (C) Scatter plot revealing the
expression levels of CD4, CD25, and FOXP3, and sPD-1 are negatively
correlated. **P<0.001 compared with the RA and the HC group. CD,
cluster of differentiation; FOXP3, forkhead/winged helix
transcription factor p3; sPD-1, soluble programmed death-1; RA,
rheumatoid arthritis; HC, healthy control. |
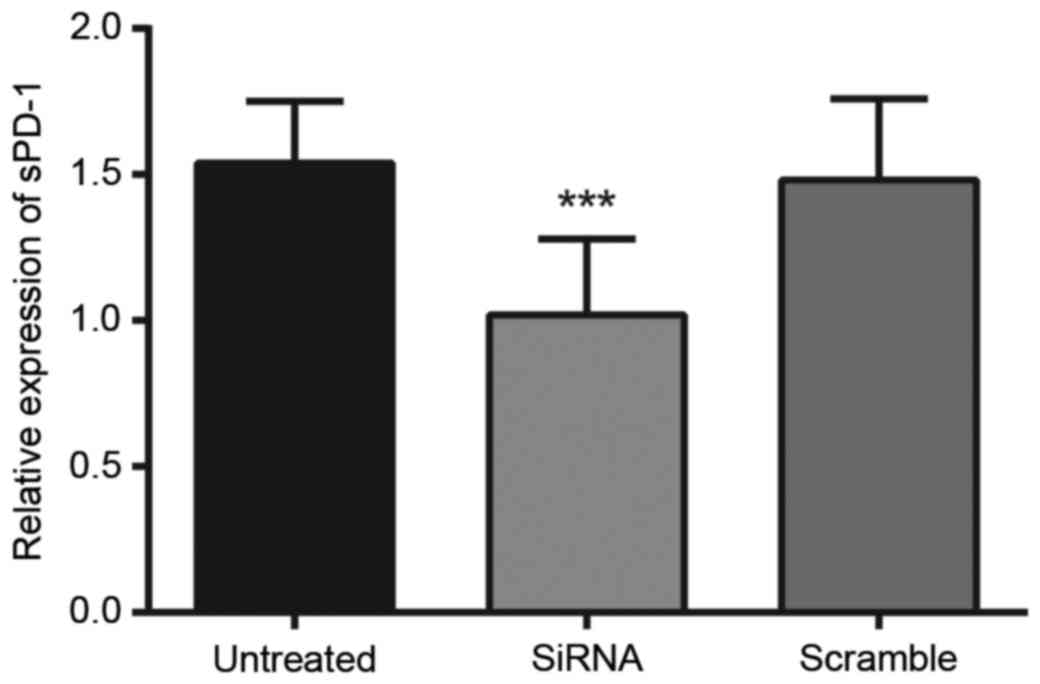
Protein expression levels of sPD-1 in
Tregs following transfection
The protein expression levels of sPD-1 in Tregs were
detected by western blotting, as presented in Fig. 2. The protein expression levels of
sPD-1 within Tregs in the untreated, siRNA-sPD-1 and scramble
groups were 1.54±0.16, 1.02±0.11 and 1.51±0.18, respectively. The
protein expression levels of sPD-1 in the siRNA-sPD-1 group
(1.02±0.11) were significantly reduced compared with the untreated
(1.54±0.16) and scramble (1.51±0.18) groups (P<0.0001). No
differences in sPD-1 protein expression levels were observed
between the untreated and scramble groups (P>0.05).
Effect of sPD-1 siRNA on CTLA-4 and
FOXP3 expression
The expression of the transcription factors CTLA-4
and FOXP3 in Tregs was detected by flow cytometry (Table I). A total of 24 h following
combined stimulation with anti-CD3/CD28, the mean fluorescence
intensity of CTLA-4 and FOXP3 in the siRNA-sPD-1 group was
significantly reduced compared with untreated and scramble groups
(all P<0.001). The results indicated that sPD-1 expression in
CD4+CD25− Treg increased the expression of
CTLA-4 and FOXP3.
 | Table I.Comparison of transcription factor
CTLA-4 and FOXP3 expression in CD4+CD25−
Tregs between untreated, siRNA-sPD-1 and scramble groups. |
Table I.
Comparison of transcription factor
CTLA-4 and FOXP3 expression in CD4+CD25−
Tregs between untreated, siRNA-sPD-1 and scramble groups.
|
| Group |
|---|
|
|
|
|---|
| Marker | Untreated | siRNA-sPD-1 | Scramble |
|---|
| CTLA-4 |
81.06±4.54a | 32.75±4.53 |
79.59±5.58a |
| FOXP3 |
58.36±2.45a | 27.24±1.87 |
57.85±2.26a |
Effect of sPD-1 on the
immunosuppressive activity of CD4+CD25−
Tregs
MTT results demonstrated that, under anti-CD3/CD28
activation, compared with the normal
CD4+CD25− T group, OD540 values in
the untreated and scramble groups reduced significantly (0.48±0.01,
0.35±0.04 and 0.34±0.03, respectively; all P<0.001). Following
the silencing of sPD-1 in CD4+CD25− Tregs
with siRNA, the OD540 value in the siRNA-sPD-1 group was
upregulated in comparison with the untreated and scramble groups
(0.51±0.15; P<0.001). Therefore, CD4+CD25−
Tregs inhibited the proliferation of effector T cells; however, the
immunosuppressive activity of CD4+CD25− Tregs
was weakened by siRNA-mediated silencing of sPD-1 (Table II).
| Table II.Effect of sPD-1 on
CD4+CD25− Treg-mediated immunosuppression of
effector T cells. |
Table II.
Effect of sPD-1 on
CD4+CD25− Treg-mediated immunosuppression of
effector T cells.
| Group | OD540 nm
value |
|---|
| Normal
CD4+CD25− T | 0.49±0.04 |
| Untreated |
0.35±0.04a |
| siRNA-sPD-1 |
0.48±0.05b |
| Scramble |
0.34±0.03a |
IL-10 and TGF-β levels, as assessed by
ELISA
IL-10 and TGF-β levels in the
CD4+CD25− Treg supernatant were detected via
ELISA (Fig. 3). ELISA results
indicated that 24 h following stimulation with anti-CD3/CD28, IL-10
levels in the untreated, siRNA-sPD-1 and scramble groups were
9.86±0.87, 6.12±0.58 and 9.75±0.85 pg/ml, respectively, whereas
TGF-β levels in the untreated, siRNA-sPD-1 and scramble groups were
68.24±9.54, 32.75±6.23 and 67.10±9.10 pg/ml, respectively. IL-10
and TGF-β levels in the CD4+CD25− Treg
supernatant in the siRNA-sPD-1 group were therefore reduced
compared with the untreated and scramble groups (P<0.001),
indicating that sPD-1 expression in CD4+CD25−
Treg influences the production of IL-10 and TGF-β.
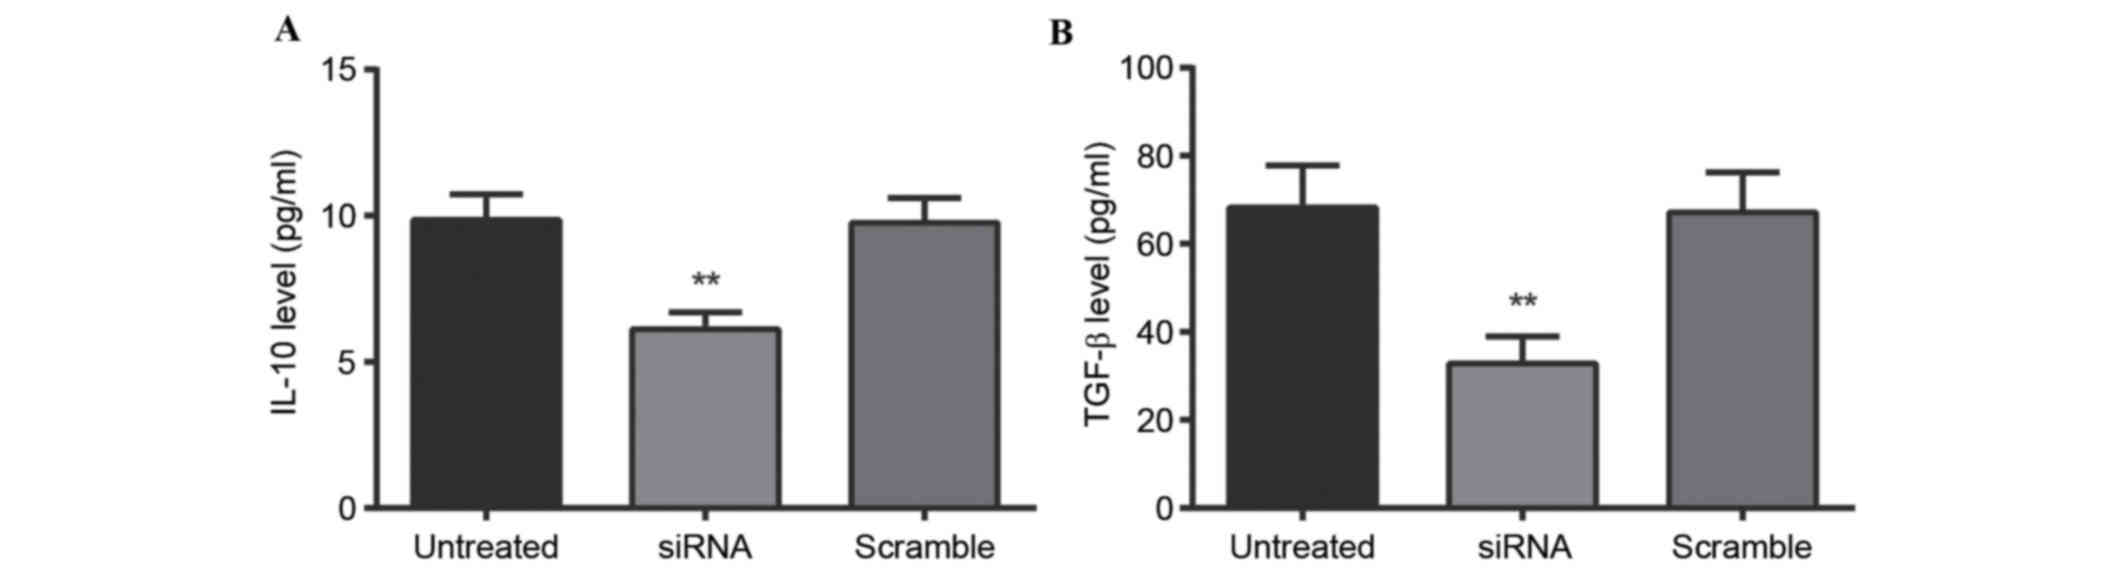 | Figure 3.Effect of sPD-1 expression on the
level of cell factors. (A) IL-10 and (B) TGF-β levels in the
CD4+CD25− Treg supernatant of untreated,
siRNA-sPD-1 and scramble groups were detected by ELISA. IL-10 and
TGF-β expression levels in the siRNA-sPD-1 group were significantly
reduced compared with the untreated and scramble groups. Untreated
group, CD4+CD25- Tregs; siRNA-sPD-1 group, CD4+CD25- Tregs
transfected with siRNA-sPD-1; scramble group, CD4+CD25- Tregs
transfected with meaningless sequence. **P<0.001 vs. untreated
and scramble groups. sPD-1, soluble programmed death-1; IL-10,
interleukin-10; TGF-β, transforming growth factor β; CD, cluster of
differentiation; Treg, regulatory T cells; siRNA, small interfering
RNA. |
Effect of sPD-1 on the IFN-γ/IL-4
concentration ratio
IFN-γ and IL-4 levels in the
CD4+CD25−
Treg/CD4+CD25− T effector co-culture
supernatant were detected via ELISA (Fig. 4). Compared with the normal
CD4+CD25− T group, the IFN-γ/IL-4
concentration ratio in the co-culture supernatant from the
untreated (0.52±0.08 vs. 0.06±0.03; P<0.001) and scramble groups
(0.52±0.08 vs. 0.05±0.02; P<0.001) reduced significantly. The
IFN-γ/IL-4 concentration ratio in the siRNA-sPD-1 group was
upregulated compared with the untreated group (0.54±0.06 vs.
0.06±0.02; P<0.001), suggesting a weakened polarization of T
cells towards the T helper (Th)2 phenotype, and an enhanced
polarization of T cells towards the Th1 phenotype. Therefore,
downregulation of sPD-1 expression in
CD4+CD25− Tregs increased the IFN-γ/IL-4
concentration ratio, indicating that sPD-1 may be involved in
CD4+CD25− Treg-mediated Th2 polarization.
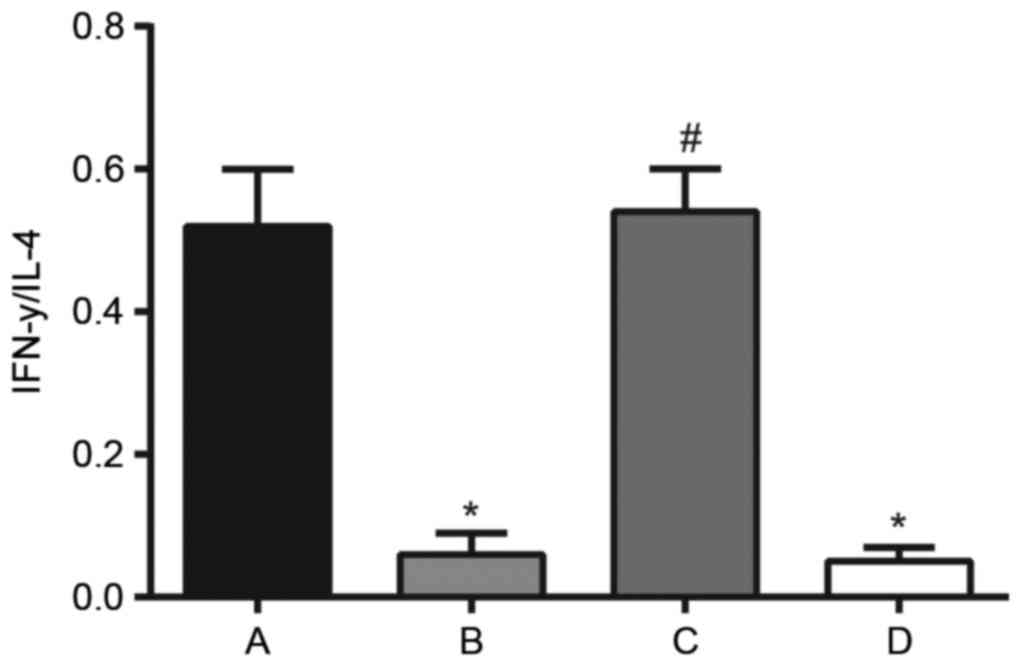 | Figure 4.Effect of sPD-1 on IFN-γ/IL-4
concentration ratio and CD4+CD25−
Treg-mediated Th2 polarization in the Treg/CD4+CD25- T effector
co-culture supernatant, as detected by ELISA. A, normal CD4+CD25- T
cell; B, untreated; C, siRNA-sPD-1; and D, scramble groups.
Compared with the normal CD4+CD25- T cell group, the IFN-γ/IL-4
concentration ratio in the co-culture supernatant in the untreated
and scramble groups reduced significantly. Following siRNA
silencing of sPD-1 in CD4+CD25- Tregs, the IFN-γ/IL-4 concentration
ratio was upregulated compared with the untreated group. Untreated
group, CD4+CD25- Tregs; siRNA-sPD-1 group, CD4+CD25- Tregs
transfected with siRNA-sPD-1; scramble group, CD4+CD25- Tregs
transfected with meaningless sequence. *P<0.001 vs. normal
CD4+CD25- T group; #P<0.001 vs. untreated group.
sPD-1, soluble programmed death-1; IFN-γ, interferon-γ; IL-4,
interleukin-4; CD cluster of differentiation; Treg, regulatory T
cells; Th, T helper; siRNA, small interfering RNAs. |
Effect of sPD-1 on NF-AT activity in T
cells
The activity of NF-AT in T cells in the
CD4+CD25−
Treg/CD4+CD25− T effector co-culture
supernatant was detected via ELISA (Fig. 5). In comparison with the normal
CD4+CD25− T group, NF-AT activity decreased
in the untreated (0.17±0.02 vs. 0.11±0.02; P<0.001) and scramble
groups (0.17±0.02 vs. 0.11±0.01; P<0.001), whereas NF-AT
activity increased significantly in the siRNA-sPD-1 group compared
with the untreated group (0.18±0.04 vs. 0.11±0.02; P<0.001),
suggesting that sPD-1 expression reduced the activity of NF-AT in
CD4+CD25− T cells. Thus, sPD-1 may affect
CD4+CD25− Treg-mediated suppression of NF-AT
activity in effector T cells, influencing their immunosuppressive
function.
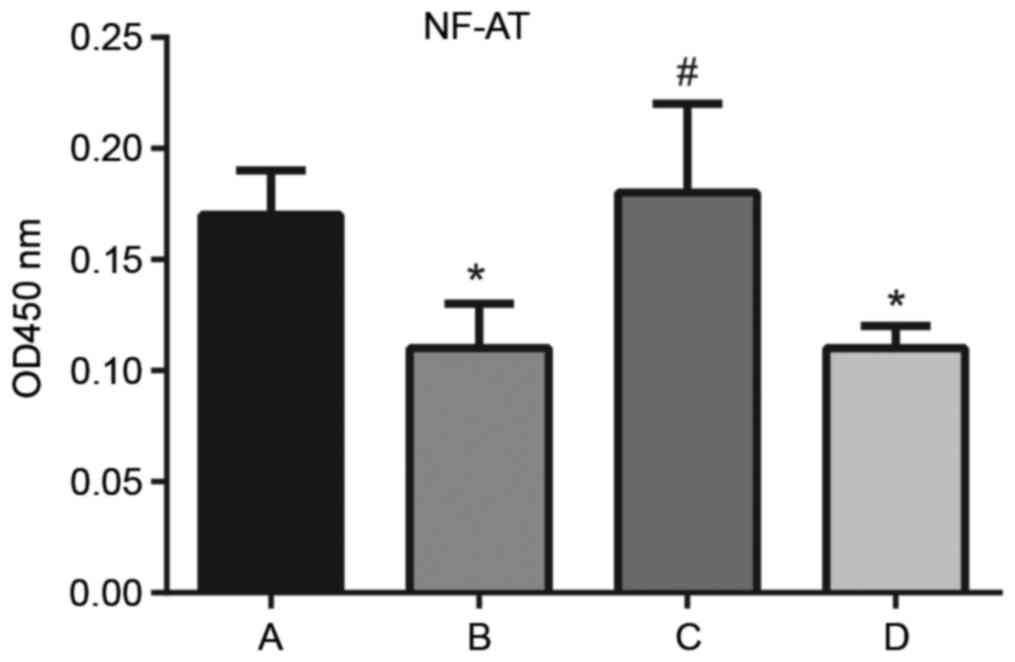 | Figure 5.Effect of sPD-1 on the activity of
NF-AT in T cells in the Treg/CD4+CD25− T
effector co-culture supernatant. The activity of NF-AT in normal
CD4+CD25- T cells, and untreated, siRNA-sPD-1 and scramble groups
was detected by ELISA. A, normal CD4+CD25- T cell; B, untreated; C,
siRNA-sPD-1; and D, scramble groups. NF-AT activity decreased in
untreated and scramble groups; however, significantly increased in
the siRNA-sPD-1 group compared with the untreated and scramble
groups. Untreated group, CD4+CD25- Tregs; siRNA-sPD-1 group,
CD4+CD25- Tregs transfected with siRNA-sPD-1; scramble group,
CD4+CD25- Tregs transfected with meaningless sequence. *P<0.001
vs. normal CD4+CD25- T cell group; #P<0.001 vs.
untreated group. sPD-1, soluble programmed death-1; NF-AT, nuclear
factor of activated T cells; Treg, regulatory T cells; CD, cluster
of differentiation; siRNA, small interfering RNA. |
Discussion
Previous studies support a key role for Tregs in RA
pathogenesis, and the involvement of the sPD-1 signaling pathway in
peripheral tolerance by inhibition of Tregs at the level of
synovial tissue (5,18,19).
In humans, a role for sPD-1 in the regulation of immunologic
self-tolerance and autoimmunity was suggested by the observed
associations between PD-1 gene polymorphisms and autoimmune
diseases, including systemic lupus erythematosus, RA, type 1
diabetes mellitus, and multiple sclerosis (13,20,21).
The present study aimed to investigate the role of sPD-1 in RA and
to identify the function of sPD-1 in Tregs from RA patients.
The present study investigated the expression of
sPD-1 in RA patients and identified that sPD-1 expression was
significantly increased in peripheral blood
CD4+CD25− Tregs in RA patients, indicating
that sPD-1 may be involved in the regulation of Treg effector
function at the site of inflammation. Furthermore, the data
revealed that following siRNA-mediated silencing of sPD-1
expression in CD4+CD25− Tregs, the
proliferation of Tregs was significantly inhibited following siRNA
transfection and the immunosuppressive activity of
CD4+CD25− Tregs was weakened, suggesting that
sPD-1 promotes the immunosuppressive activity of Tregs. sPD-1, as a
co-signaling molecule and a co-inhibitor, is involved in directing,
modulating and fine-tuning Treg receptor signals, leading to
suppression of Treg activation (22). Spatio-temporal expression of sPD-1
may negatively control the priming, growth, differentiation and
functional maturation of a Treg response (23). In RA patients, sPD-1 was
upregulated in Tregs, and these Tregs may become ‘exhausted’, with
progressive loss of effector function and proliferative capacity,
resulting in decreased proliferation, cytokine production,
cytolytic activity and a reduction in viral load (13). The important role of sPD-1 in
downregulating the immune system is accomplished by preventing the
activation of Tregs, which in turn reduces autoimmunity and
promotes self-tolerance associated with the increased risk of RA
(6). A recent study by Greisen
et al (5) revealed that
increased sPD-1 expression may be associated with early RA disease
activity and radiographic progression, suggesting an important role
of sPD-1 in mediating inflammatory as well as radiographic disease
progression.
In addition, the present study observed that
following silencing of sPD-1 in CD4+CD25−
Tregs with siRNA, the expression levels of CTLA-4, Foxp3, IL-10 and
TGF-β all decreased, whereas the activity of NF-AT increased,
implying that sPD-1 expression may regulate Treg responses through
influencing the expression levels of CTLA-4, FOXP3, IL-10 and
TGF-β, as well as NF-AT activity. A previous study by Fife et
al (24) reported that sPD-1
and CTLA-4 inhibit T cells in RA through different mechanisms, and
CTLA-4 acts by recruiting protein phosphatase 2. A previous study
demonstrated that FOXP3, a member of the forkhead/winged-helix
family of transcriptional regulators, is important in
distinguishing Tregs from recently activated, non-regulatory
CD4+CD25− T cells and is a specific marker of
CD4+CD25− Tregs (25). Jiao et al (26) reported an accumulation of
FOXP3-expressing Tregs in RA, and this recruitment may be dependent
on the distinct chemokine receptors expressed on Tregs. Heo et
al (19) demonstrated that
overexpressed IL-10 is detected in autoimmune disease patients and
that it may be useful in the treatment of autoimmune diseases. In
addition, TGF-β may be involved in ingress of inflammatory cells
into the rheumatoid joint, which is associated with the
pathogenesis of RA (27). Checker
et al (28) indicated that
potent anti-inflammatory activity in RA is mediated via suppression
of NF-AT activity, which is consistent with the results of the
present study.
In conclusion, the results of the present study
demonstrated that sPD-1 is upregulated in
CD4+CD25− Tregs isolated from the PBMCs of RA
patients. The immunosuppressive activity of
CD4+CD25− Tregs was weakened following sPD-1
silencing, the expression levels of CTLA-4, FOXP3, IL-10 and TGF-β
decreased and the IFN-γ/IL-4 concentration ratio and the activity
of NF-AT increased. The data from the present study suggested a
potential novel mechanism underlying the pathogenesis of RA and may
subsequently provide a novel target for its treatment.
References
|
1
|
Wang CH, Yao H, Chen LN, Jia JF, Wang L,
Dai JY, Zheng ZH, Chen ZN and Zhu P: CD147 induces angiogenesis
through a vascular endothelial growth factor and hypoxia-inducible
transcription factor 1α-mediated pathway in rheumatoid arthritis.
Arthritis Rheum. 64:1818–1827. 2012. View Article : Google Scholar : PubMed/NCBI
|
|
2
|
Scott DL, Wolfe F and Huizinga TW:
Rheumatoid arthritis. Lancet. 376:1094–1108. 2010. View Article : Google Scholar : PubMed/NCBI
|
|
3
|
Kingsley G, Scott IC and Scott DL: Quality
of life and the outcome of established rheumatoid arthritis. Best
Pract Res Clin Rheumatol. 25:585–606. 2011. View Article : Google Scholar : PubMed/NCBI
|
|
4
|
Kerola AM, Kauppi MJ, Nieminen T,
Rantalaiho V, Kautiainen H, Kerola T, Virta LJ, Pohjolainen T and
Puolakka K: Psychiatric and cardiovascular comorbidities as causes
of long-term work disability among individuals with recent-onset
rheumatoid arthritis. Scand J Rheumatol. 44:87–92. 2015. View Article : Google Scholar : PubMed/NCBI
|
|
5
|
Greisen SR, Rasmussen TK,
Stengaard-Pedersen K, Hetland ML, Hørslev-Petersen K, Hvid M and
Deleuran B: Increased soluble programmed death-1 (sPD-1) is
associated with disease activity and radiographic progression in
early rheumatoid arthritis. Scand J Rheumatol. 43:101–108. 2014.
View Article : Google Scholar : PubMed/NCBI
|
|
6
|
Li S, Liao W, Chen M, Shan S, Song Y,
Zhang S, Song H and Yuan Z: Expression of programmed death-1 (PD-1)
on CD4+ and CD8+ T cells in rheumatoid arthritis. Inflammation.
37:116–121. 2014. View Article : Google Scholar : PubMed/NCBI
|
|
7
|
Lin YT, Wang CT, Gershwin ME and Chiang
BL: The pathogenesis of oligoarticular/polyarticular vs systemic
juvenile idiopathic arthritis. Autoimmun Rev. 10:482–489. 2011.
View Article : Google Scholar : PubMed/NCBI
|
|
8
|
Coffey G, DeGuzman F, Inagaki M, Pak Y,
Delaney SM, Ives D, Betz A, Jia ZJ, Pandey A, Baker D, et al:
Specific inhibition of spleen tyrosine kinase suppresses leukocyte
immune function and inflammation in animal models of rheumatoid
arthritis. J Pharmacol Exp Ther. 340:350–359. 2012. View Article : Google Scholar : PubMed/NCBI
|
|
9
|
Porter DL, Levine BL, Kalos M, Bagg A and
June CH: Chimeric antigen receptor-modified T cells in chronic
lymphoid leukemia. N Engl J Med. 365:725–733. 2011. View Article : Google Scholar : PubMed/NCBI
|
|
10
|
Arpaia N, Campbell C, Fan X, Dikiy S, van
der Veeken J, deRoos P, Liu H, Cross JR, Pfeffer K, Coffer PJ and
Rudensky AY: Metabolites produced by commensal bacteria promote
peripheral regulatory T-cell generation. Nature. 504:451–455. 2013.
View Article : Google Scholar : PubMed/NCBI
|
|
11
|
Haile ST, Dalal SP, Clements V, Tamada K
and Ostrand-Rosenberg S: Soluble CD80 restores T cell activation
and overcomes tumor cell programmed death ligand 1-mediated immune
suppression. J Immunol. 191:2829–2836. 2013. View Article : Google Scholar : PubMed/NCBI
|
|
12
|
Ceeraz S, Hall C, Choy EH, Spencer J and
Corrigall VM: Defective CD8+CD28+ regulatory T cell suppressor
function in rheumatoid arthritis is restored by tumour necrosis
factor inhibitor therapy. Clin Exp Immunol. 174:18–26. 2013.
View Article : Google Scholar : PubMed/NCBI
|
|
13
|
Dai S, Jia R, Zhang X, Fang Q and Huang L:
The PD-1/PD-Ls pathway and autoimmune diseases. Cell Immunol.
290:72–79. 2014. View Article : Google Scholar : PubMed/NCBI
|
|
14
|
Bertsias GK, Nakou M, Choulaki C,
Raptopoulou A, Papadimitraki E, Goulielmos G, Kritikos H,
Sidiropoulos P, Tzardi M, Kardassis D, et al: Genetic, immunologic,
and immunohistochemical analysis of the programmed death
1/programmed death ligand 1 pathway in human systemic lupus
erythematosus. Arthritis Rheum. 60:207–218. 2009. View Article : Google Scholar : PubMed/NCBI
|
|
15
|
Kay J and Upchurch KS: ACR/EULAR 2010
rheumatoid arthritis classification criteria. Rheumatology
(Oxford). 51:(Suppl 6). vi5–9. 2012.PubMed/NCBI
|
|
16
|
MPN, . World medical association publishes
the revised declaration of Helsinki. Natl Med J India.
27:562014.
|
|
17
|
Kralj JG, Munson MS and Ross D: Total
protein quantitation using the bicinchoninic acid assay and
gradient elution moving boundary electrophoresis. Electrophoresis.
35:1887–1892. 2014. View Article : Google Scholar : PubMed/NCBI
|
|
18
|
Boissier MC, Assier E, Biton J, Denys A,
Falgarone G and Bessis N: Regulatory T cells (Treg) in rheumatoid
arthritis. Joint Bone Spine. 76:10–14. 2009. View Article : Google Scholar : PubMed/NCBI
|
|
19
|
Heo YJ, Joo YB, Oh HJ, Park MK, Heo YM,
Cho ML, Kwok SK, Ju JH, Park KS, Cho SG, et al: IL-10 suppresses
Th17 cells and promotes regulatory T cells in the CD4+ T cell
population of rheumatoid arthritis patients. Immunol Lett.
127:150–156. 2010. View Article : Google Scholar : PubMed/NCBI
|
|
20
|
Woo SR, Turnis ME, Goldberg MV, Bankoti J,
Selby M, Nirschl CJ, Bettini ML, Gravano DM, Vogel P, Liu CL, et
al: Immune inhibitory molecules LAG-3 and PD-1 synergistically
regulate T-cell function to promote tumoral immune escape. Cancer
Res. 72:917–927. 2012. View Article : Google Scholar : PubMed/NCBI
|
|
21
|
Pedoeem A, Azoulay-Alfaguter I, Strazza M,
Silverman GJ and Mor A: Programmed death-1 pathway in cancer and
autoimmunity. Clin Immunol. 153:145–152. 2014. View Article : Google Scholar : PubMed/NCBI
|
|
22
|
Curran MA, Montalvo W, Yagita H and
Allison JP: PD-1 and CTLA-4 combination blockade expands
infiltrating T cells and reduces regulatory T and myeloid cells
within B16 melanoma tumors. Proc Natl Acad Sci USA. 107:4275–4280.
2010. View Article : Google Scholar : PubMed/NCBI
|
|
23
|
Pen JJ, Keersmaecker BD, Heirman C,
Corthals J, Liechtenstein T, Escors D, Thielemans K and Breckpot K:
Interference with PD-L1/PD-1 co-stimulation during antigen
presentation enhances the multifunctionality of antigen-specific T
cells. Gene Ther. 21:262–271. 2014. View Article : Google Scholar : PubMed/NCBI
|
|
24
|
Fife BT, Pauken KE, Eagar TN, Obu T, Wu J,
Tang Q, Azuma M, Krummel MF and Bluestone JA: Interactions between
PD-1 and PD-L1 promote tolerance by blocking the TCR-induced stop
signal. Nat Immunol. 10:1185–1192. 2009. View Article : Google Scholar : PubMed/NCBI
|
|
25
|
Shen LS, Wang J, Shen DF, Yuan XL, Dong P,
Li MX, Xue J, Zhang FM, Ge HL and Xu D: CD4(+)CD25(+)CD127(low/−)
regulatory T cells express Foxp3 and suppress effector T cell
proliferation and contribute to gastric cancers progression. Clin
Immunol. 131:109–118. 2009. View Article : Google Scholar : PubMed/NCBI
|
|
26
|
Jiao Z, Wang W, Jia R, Li J, You H, Chen L
and Wang Y: Accumulation of FoxP3-expressing CD4+CD25+ T cells with
distinct chemokine receptors in synovial fluid of patients with
active rheumatoid arthritis. Scand J Rheumatol. 36:428–433. 2007.
View Article : Google Scholar : PubMed/NCBI
|
|
27
|
Rico MC, Rough JJ, Del Carpio-Cano FE,
Kunapuli SP and Cadena RA DeLa: The axis of thrombospondin-1,
transforming growth factor beta and connective tissue growth
factor: An emerging therapeutic target in rheumatoid arthritis.
Curr Vasc Pharmacol. 8:338–343. 2010. View Article : Google Scholar : PubMed/NCBI
|
|
28
|
Checker R, Sandur SK, Sharma D, Patwardhan
RS, Jayakumar S, Kohli V, Sethi G, Aggarwal BB and Sainis KB:
Potent anti-inflammatory activity of ursolic acid, a triterpenoid
antioxidant, is mediated through suppression of NF-κB, AP-1 and
NF-AT. PloS One. 7:e313182012. View Article : Google Scholar : PubMed/NCBI
|