Introduction
Ulcerative colitis (UC) is a chronic non-specific
inflammatory bowel disease (IBD) that most commonly afflicts people
living in Western countries. Its clinical manifestations
predominantly include repeated diarrhea, mucus, blood and pus in
feces, and abdominal pain. In recent years, the incidence of UC has
significantly increased in China (1). Numerous factors are involved in the
pathogenesis of UC, leading to the World Health Organization (WHO)
including UC in the list of modern diseases that are most difficult
to treat (2). The etiology and
pathogenesis of UC remain to be elucidated. Multiple factors,
including intestinal flora disorders, autoimmune dysfunction,
genetic mutations, infectious diseases and neuropsychological
disorders, are involved in the development of UC (3). Among these, intestinal flora
disorders and autoimmune dysfunction have been most investigated.
As patients with UC develop intestinal flora disorders, probiotics
maybe used to restore the balance of flora, thereby reducing
intestinal inflammation (4).
Bifidobacterium and Lactobacillus are two types of
probiotics that are extensively observed in the human intestine.
Previous studies have reported that these probiotics have
anti-inflammatory and immunomodulatory activities (5), however, the exact mechanisms
underlying the action of these probiotics remain to be elucidated.
In normal flora, Bifidobacterium and Lactobacillus
directly exert antibacterial effects on pathogenic Gram-positive
and Gram-negative bacteria by producing bacteriocins and toxic
acidic substances (6,7). In a previous study, it was
demonstrated that VSL#3 probiotic capsules improved the function of
the colonic barrier and protected the intestinal epithelial
integrity of interleukin (IL)-10-deficient rats (8). Certain Lactobacillus strains
also upregulate the expression of mucin 3, and enhance the
intestinal mucus layer, thereby improving colonic barrier function
in humans (9). Toll-like receptors
(TLRs), which are type I transmembrane proteins homologous to the
Drosophila Toll protein, are pivotal in eliciting an immune
response to microbial infection (10). Increased expression of TLR4 has
been demonstrated in UC animal models, while the inhibition of TLR
activity alleviated UC-induced inflammation (11). Thus, the present study proposes
that intestinal flora may be inducing an abnormal immune response
and should be modulated to inhibit the development of abnormal
immune responses via certain mechanisms. The present study examined
the mRNA expression levels of TLR4/TLR2 and determined the
concentration of tumor necrosis factor-α (TNF-α) and IL-1β in the
intestinal mucosa of UC rats treated with Golden bifid. Results
were then compared with the intervention group, which contained UC
rats treated with TLR4 monoclonal antibody (TLR4mAb), and the model
group, which contained untreated UC rats. Thus, in order to provide
a further theoretical basis for the use of probiotics in UC
treatment, the present study investigated the underlying mechanisms
via which probiotics inhibit TLR expression.
Materials and methods
Experimental animal grouping
A total of 40 specific pathogen free-grade
Sprague-Dawley rats (male and female; 2 months of age; weight,
280–320g; free access to food and water; temperature, 22–25°C;
humidity, 50–70%; 12 h light/dark cycle), were purchased from the
Laboratory Animal Center of Xinjiang Medical University (Xinjiang,
China). The present study was approved by the Animal Ethics
Committee of the First Affiliated Hospital of Xinjiang Medical
University. Rats were randomly assigned to one of the following
four groups (n=10): i) Group I, normal control group, ii) group II,
the model group, iii) group III, the Golden bifid treatment group,
and iv) group IV, the TLR4mAb intervention group. The rats were
maintained in a clean-grade room at constant temperature and fed
ad libitum.
Reagents
2,4,6-trinitrobenzene sulfonic acid (TNBS) was
purchased from Sigma-Aldrich (Merck Millipore, Darmstadt, Germany).
Purified anti-mouse TLR4, CD284 (TLR4mAb; cat. no. 117602) was
obtained from BioLegend, Inc. (San Diego, CA, USA). Golden bifid
was purchased from Inner Mongolia Shuangqi Pharmaceutical Co., Ltd.
(Hohhot, China). TRIzol reagent was obtained from Invitrogen
(Thermo Fisher Scientific, Inc., Waltham, MA, USA). TLR4 and TLR2
primers were synthesized by Sangon Biotech Co., Ltd (Shanghai,
China). First Strand cDNA Synthesis kit was purchased from Thermo
Fisher Scientific, Inc. Synergy Brands SYBR Green PCR kit was
purchased from Qiagen GmbH (Hilden, Germany). Taq PCR Master mix
(2X) were purchased from Beijing Biomad Biological Gene Technology
Co., Ltd. (Beijing, China). SYBR® Premix Ex Taq™ (2X)
was purchased from Takara Bio, Inc. (Otsu, Japan). Loading buffer
wash (6X) was purchased from Tiangen Biotech Co., Ltd. (Beijing,
China). Agarose was purchased from Shanghai Generay Biotech Co.,
Ltd. (Shanghai, China) and Golden View nucleotide dye was purchased
from Beijing Biomad Biological Gene Technology Co., Ltd.
UC model establishment and method of
administration
Following acclimatization of the experimental rats
in a clean-grade room for seven days, the animal model for the
present study was developed. Prior to the development of the model,
rats were not provided with food for 24 h. They were anesthetized
by injection of a 1-fold diluted mixture of ketamine (100
mg/2 ml), diazepam (10 mg/2 ml), and atropine
(0.5 mg/ml) in the abdomen; at a fixed dose of 0.75 ml/100 g.
Experimental reagents were subsequently injected into the rats via
an 8 Fr pediatric catheter, which was inserted at ~8 cm into the
rat anus. Rats from groups II, III, and IV were injected with 1:1
mixture of 5% TNBS and 50% ethanol at a dose of 0.4 ml/100 g, while
those from group I were injected with saline (0.4 ml/100 g).
Following injection, the rats were lifted by their tails for ~10
min to prevent the outflow of reagents. Following establishment of
the animal model, group III rats were fed Golden bifid via a gavage
(2 ml/day, 1.0 ×10⁹CFU) for seven days, while the other
groups were administered saline via gavage. Group IV rats were
abdominally injected with TLR4mAb (10 µg) (12); four times over 8 days. The rats
from the other three groups were injected with saline. After 8
days, the rats were weighed and their abdominal cavity was opened
following terminal anesthesia [a 1-fold diluted mixture of ketamine
(100 mg/2 ml), diazepam (10 mg/2 ml), and
atropine (0.5 mg/ml) in the abdomen; at a fixed dose of 0.75 ml/100
g]. The entire colon of each rat was exposed (excluding rats that
has succumbed to natural death; or were close to death, i.e.
inability to or extreme reluctance to stand up for 24 h, one in
group II, two in group III and one in group IV), and 5 ml blood
samples were taken from the abdominal aorta.
Symptom observation and scoring
Following establishment of the animal model, the rat
feces were collected daily. The general status of the rats was also
observed, including activity, fur, food intake, and weight, in
addition to stool, blood and occult blood in stool. Furthermore,
the number of incidence cases were recorded and scored using the
disease activity index (DAI) proposed by Cooper et al
(13).
Histopathological observation and
scoring (HPS)
Approximately 1 cm of the colon exhibiting clear
ulcers, congestion, and edema was sampled. The sample was first
rinsed in pre-cooled saline and then fixed in 4% paraformaldehyde
for 72 hat room temperature and embedded in paraffin. Subsequently,
the sample was cut into 5 µm sections, which were de-waxed in
xylene and dehydrated in ethanol: Xylene I (15 min), xylene II (10
min), and a graded series of 100, 95, and 80% ethanol (5 sec each).
These sections were rinsed with water for 2 min. Subsequently, the
sections were stained with hematoxylin (4 min) and rinsed in water,
differentiated in HCl/ethanol (2 sec) and blued in water (2 min).
These sections were stained with eosin (3 min) and rinsed in water,
prior to finally being dehydrated in an ascending ethanol series
(80, 95, 95 and 100% ethanol, 5 sec each). The dehydrated sections
were made transparent using xylene I and xylene II (5 sec each).
Finally, they were mounted with neutral gum in a hood. Following
drying, the colonic mucosal tissue injuries and lesions were
observed under a light microscope and scored using the scoring
method proposed by Cooper et al (13). The remaining colon samples were
frozen in liquid nitrogen and preserved at −80°C for further
use.
Immunohistochemical staining and
results interpretation
Subsequent to embedding and sectioning (4 µm) as
described above, immunohistochemical examination was performed
using a two-step method. Sections were de-waxed and dehydrated in a
series of graded solvents, xylene I (15 min), xylene II (10 min),
and 100, 95, 95, and 80% ethanol (5 sec each). The sections were
then rinsed with water (2 min) and endogenous peroxidases were
removed with 3% hydrogen peroxide at room temperature (10 min).
Subsequently, the sections were washed with water (2 min) and
phosphate-buffered saline (PBS; 2 min). Antigen retrieval was then
conducted and the sections were placed in a 0.01 M citrate antigen
retrieval solution and microwaved for 10 min (thawing temperature,
92–98°C). Following this, the sections were cooled to room
temperature and rinsed in water and PBS, each for 2 min. The
sections were incubated with rabbit anti-TLR4 polyclonal antibody
(diluted in PBS, 1:150) at 37°C for 60 min. Subsequently, the
sections were washed three times with PBS, for 2 min each time.
These sections were incubated with goat anti-rabbit horseradish
peroxidase-conjugated IgG secondary antibody (cat. no. PV-6001;
OriGene Technologies, Inc. Beijing China), diluted in PBS (1:500),
at 37°C for 25 min and subsequently washed with PBS. These sections
were stained with a freshly prepared diaminobenzidine solution and
observed under a light microscope (x100). The coloring process was
conducted for 3–10 min, prior to the use of distilled water to
terminate the reaction. The sections were re-stained with
hematoxylin (4 min) and rinsed in water (2 min). They were again
differentiated in HCL/ethanol (2 sec) and blued in water (1 min).
Finally, the sections were dehydrated using an ascending ethanol
series (80, 95, 95 and 100% ethanol, 5 sec each). They were made
transparent with xylene I and xylene II (5 sec each), and mounted
with neutral gum on a microscope for observation. PBS served as the
negative control, while cells with a brown-stained membrane and/or
cytoplasm were defined as positive. Based on the semi-quantitative
scoring criteria proposed by Fromowitz et al (14), the positive staining percentages of
<5, 5–25, 26–50, 51–75 and >75% were scored as 0, 1, 2, 3 and
4, respectively. Non-stained, light-yellow, brown, and dark-brown
cells were scored as 0, 1, 2, and 3, respectively. The total score
was calculated by adding the scores obtained using these two
indicators. In each section, an average of five randomly selected
fields were used for statistical analysis.
RNA extraction and purification
Colon tissue (50 mg) was ground in liquid nitrogen
placed in a 1.5 ml Eppendorf (EP) tube and vortexed for 15 sec.
This tissue was then maintained at room temperature for 15 min. The
cells were then lysed and RNA was extracted in TRIzol/chloroform
(1:0.2 by volume). Subsequently, the tube was kept at room
temperature for 5 min and then centrifuged at 4°C, 4,834 × g
for 15 min. The resulting supernatant was then transferred to
another 1.5 ml EP tube containing isopropanol (TRIzol:isopropanol,
1:0.5). The tube was vortexed and placed at −20°C for 20–30 min,
prior to centrifugation at 4°C, 4,834 × g for 10 min.
Following centrifugation, the supernatant was aspirated and
discarded, and the RNA precipitate was added to 1 ml of pre-cooled
75% diethylpyrocarbonate (DEPC)-treated ethanol. The solution was
vortexed for 30 sec and centrifuged at 4°C, 4,834 × g for 10
min. The supernatant was discarded again, and the RNA precipitate
was dried for 5–10 min. Subsequently, it was dissolved in
DEPC-treated water (50–100 µl), followed by vortexing and
centrifuging (4°C, 1,888 × g, 5 min). The concentration of
the extracted RNA (2 µl) was then measured using a
UV-spectrophotometer. If the concentration was too high, RNA was
diluted with DEPC-treated water. The optical density
(OD)260/OD280 was controlled between 1.8–2.0,
and the RNA was stored at −80°C for further use.
Reverse transcription-quantitative
polymerase chain reaction (RT-qPCR) amplification
Primers for reverse transcription were designed and
synthesized by Sangon Biotech Co. Ltd (Shanghai, China). β-actin
served as the internal reference (Table I). cDNA was synthesized from the
total RNA (1.5 g) according to the manufacturer's protocol of the
First Strand cDNA Synthesis kit (Thermo Fisher Scientific, Inc.).
The cDNA was amplified by PCR for 35 cycles (the reaction system
and conditions are listed in Tables
II and III). The
amplification product was electrophoresed using 2% agarose gel (110
V, 100 mA, 35 min). This was observed under a Bio-Rad Gel Doc 2000
gel imager (Bio-Rad Laboratories, Inc., Hercules, CA, USA) to check
primer specificity.
 | Table I.Primer sequences. |
Table I.
Primer sequences.
| Gene | PCR amplification
fragment length (bp) | Primer sequence
(5′→3′) |
|---|
| β-actin | 231 | F:
5′-ACTGCCCTGGCTCCTAGCA-3′ |
|
|
| R:
5′-GCCAGGATAGAGCCACCAATC-3′ |
| TLR4 | 100 | F:
5′-GCATCATCTTCATTGTCCTTGAGA-3′ |
|
|
| R:
5′-CTCCCACTCGAGGTAGGTGTTT-3′ |
| TLR2 | 285 | F:
5′-CGCTTCCTGAACTTGTCC-3′ |
|
|
| R:
5′-GGTTGTCACCTGCTTCCA-3′ |
| Table II.PCR amplification system. |
Table II.
PCR amplification system.
| Agent | Volume (µl) |
|---|
| 2X Taq PCR Master
Mix | 10 |
| P-f (10
pmol/µl) | 0.3 |
| P-r (10
pmol/µl) | 0.3 |
| DNA template | 2.0 |
|
ddH2O | 7.4 |
| Table III.PCR reaction conditions. |
Table III.
PCR reaction conditions.
| Procedure | Temperature
(°C) | Duration |
|---|
|
Pre-denaturation | 94 | 3 min |
| Denaturation 35
cycles | 94 | 30 sec |
| Annealing | 56.8, 62.3 and 57.5
for β-actin, TLR4 and TLR2, respectively | 30 sec |
| Elongation | 72 | 1 min |
| Renaturation | 72 | 5 min |
Standard preparation
The brightest band observed under ultraviolet light
was cut. The target gene and internal reference were purified and
recovered using the manufacturer's protocols in the GeneJET DNA
recovery kit (Thermo Fisher Scientific, Inc.). The concentration
and absorbance value of recovered DNA were measured and the DNA was
preserved at −20°C for further use. The standard was amplified by
RT-PCR for 40 cycles (the reaction system and conditions are listed
in Tables IV and V). The temperature was increased from 65
to 95°C at a temperature transition rate of 0.5°C/sec. The iCycler
Optical System Interface software (version 2.0; Bio-Rad
Laboratories, Inc.) was used to read the fluorescence data, which
was then used to calculate the Cq value. Thus, the
standard and amplified melting curves were obtained.
| Table IV.RT-qPCR reaction system. |
Table IV.
RT-qPCR reaction system.
| Agent | Volume (µl) |
|---|
| 2X SYBR®
Premix Ex Taq™ | 10 |
| P-f (10
pmol/µl) | 0.3 |
| P-r (10
pmol/µl) | 0.3 |
| DNA template | 2.0 |
|
ddH2O | 7.4 |
| Table V.RT-qPCR reaction conditions. |
Table V.
RT-qPCR reaction conditions.
| Procedure | Temperature
(°C) | Duration |
|---|
| Pre-denaturation 35
cycles | 95 | 3 min |
| Denaturation | 95 | 10 sec |
| Annealing | 56.8, 62.3 and 57.5
for β-actin, TLR4 and TLR2 respectively | 30 sec |
| Elongation | 65 | 1 min |
| Renaturation | 72 | 5 min |
RT-qPCR of target genes
The β-actin, TLR4, and TLR2 genes of each sample
were amplified by RT-qPCR. Each measurement was performed in
triplicate. The standard and double distilled H2O was
introduced as calibration and negative control for each gene.
Details of the primers, reaction volume and thermocycling
conditions are presented in Tables
I, IV and V. The RT-qPCR product specificity was
assessed by observing whether the melting curve had a single peak.
Quantitative results of each sample were measured using the
2-∆∆Cq method by PCR amplifier (15).
ELISA examination and
quantification
Blood samples were kept at room temperature for 2 h.
These samples were then centrifuged at 33 × g for 20 min.
Following centrifugation, the supernatant solution was collected.
Serially diluted standard solutions (100 µl) were added to 7 wells
(TNF-α successively diluted to 500, 250, 62.5, 31.2, 15.6 and 7.8
pg/ml; and IL-1β successively diluted to 400, 200, 100, 50, 25,
12.5 and 6.25 pg/ml. Water (100 µl) served as the blank solution,
while samples were added to the other wells (100 µl). Each sample
was replicated twice. The 96-well plate was covered and incubated
at 37°C for 2 h after discarding the liquid. Following addition of
100 µl of detection reagent A, (working solution, prepared prior to
use), the plate was again incubated at 37°C for 1 h. The liquid was
discarded, and the wells were washed three times using 350 µl of
washing solution. The wells were then dried by tapping them on
absorbent paper. Subsequently, 100 µl of detection reagent B was
added (working solution, prepared prior to use) to the wells, which
were then incubated at 37°C for 30 min. Finally, the wells were
washed and dried and the substrate solution (90 µl) was added to
each well and the 96-well plate was developed in a dark room at
37°C. The development of the wells took place over 15–25 min.
Notably, the first 3–4 standard wells exhibited a gradient of blue
intensity, while the last 3–4 wells did not exhibit any such
gradient, the development was terminated by adding 50 µl of
termination solution (H2SO4). The color of
the wells turned from blue to yellow following addition of this
solution. Subsequent to ensuring there were no water droplets at
the bottom of the ELISA plate or bubbles in the wells, the OD value
was measured at 450 nm using a microplate reader. A 7-point plot
was obtained by subtracting the OD value of blank solution from the
OD values of the standard or each sample. The mean OD value of
repeated wells was used for calculation. The standard curve was
plotted using the standard concentrations as the ordinate (or
logarithmic scale) and the corresponding OD values as the abscissa
(or logarithmic scale). The actual concentration of each sample was
calculated using the CurveExpert software 1.30 (Wuhan Boster
Biological Technology, Ltd., Wuhan, China).
Statistical analysis
Statistical analysis was performed using the SPSS
17.0 software (SPSS, Inc., Chicago, IL, USA). Data are presented as
the mean ± standard deviation. Inter-group comparisons were made by
one-way analysis of variance. P<0.05 was considered to indicate
a statistically significant difference.
Results
General status and DAI scoring
DAI scoring is presented in Table VI. The rats from group I were
active, exhibiting smooth fur, normal food intake, continuous
weight gain, and normal stool. On the second day after the
development of the animal model, rats from group II developed a
sickly disposition exhibiting less vigorous movement, rough fur,
decreased appetite, and increased stool frequency. Of the ten rats,
two passed visibly bloody stool, whilst four tested positive for
fecal occult blood. Only two rats passed loose stool, one rat died.
All the rats of group II exhibited significant weight loss, and
their DAI score was significantly higher than that of the group I
rats (P=0.000). Rats of groups III and IV also demonstrated similar
symptoms two days after establishment of the animal model. Prior to
succumbing to the UC, one rat of group III and two rats of group IV
passed bloody stool, while the remaining rats passed either pasty
or loose stool, two rats of group III and one rat of group IV died.
All the rats of groups III and IV had varying degrees of weight
loss, however, their DAI scores were not significantly different
from each other (P=0.631). However, compared with group II rats,
the symptoms of rats belonging to groups III (P=0.016) and IV
(P=0.028) were alleviated, and the difference between their
symptoms was observed to be statistically significant.
| Table VI.DAI and HPS scores of each group. |
Table VI.
DAI and HPS scores of each group.
| Group | DAI | HPS |
|---|
| Control | 0 | 0 |
| Model |
8.05±1.97a |
14.55±0.86a |
| Golden bifid |
4.73±1.04a,b |
9.97±1.58a,b |
| TLR4mAb |
5.08±2.18a,b |
10.11±2.11a,b |
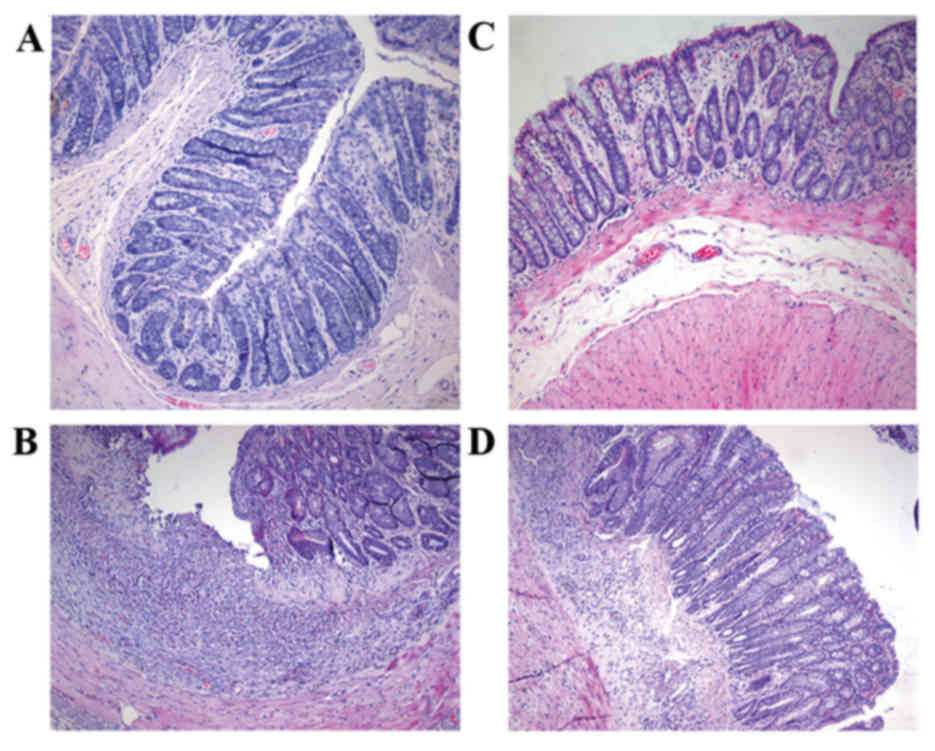
Pathological observation and HPS
scoring
Under a light microscope, it was observed that the
intestinal epithelial cells of group I rats were intact; the
sections indicated that closely arranged glands were enriched by
goblet cells. Few neutrophils or lymphocytes were scattered in the
lamina propria. In group II rats, the intestinal epithelial cells
were either markedly damaged or were absent, the mucosa was eroded
and the glands appeared to be damaged and disordered. The goblet
cells were either notably reduced or absent. The neutrophils and
lymphocytes had markedly infiltrated the lamina propria and crypt
abscesses were clearly formed. Congestion was also observed, along
with the expansion of capillaries in these sections (Fig. 1). The HPS score of the model rats
was significantly higher than that of the control (P=0.000).
Compared with the rats of groups I and II, the tissue damage in
rats belonging to groups III and IV was less intense. The HPS
scores of rats belonging to groups III (P=0.035) and IV (P=0.047)
were significantly lower than that of the model rats however these
HPS scores did not indicate a significant difference from each
other (P=0.88; Table VI).
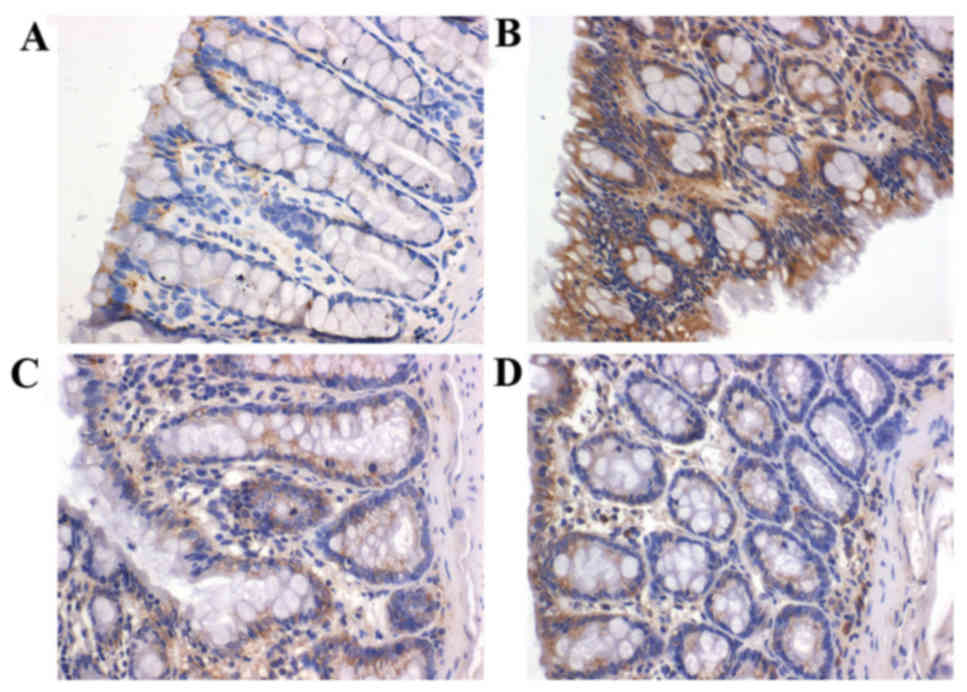
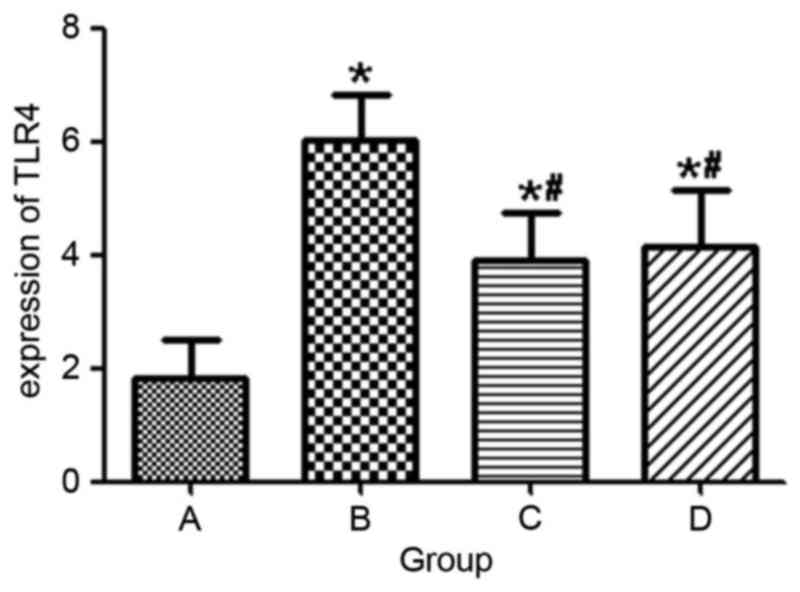
TLR4 expression in each group
In group II rats, strong expression of TLR4
(indicated by brown granules) was exhibited in the cytoplasm and
the mucosal and submucosal membrane of inflammatory cells,
including neutrophils, plasma cells and monocytes. TLR4 was also
strongly expressed in the lamina propria and the perivascular
areas. However, in group I rats, TLR4 was weakly expressed in the
mucosa and submucosa (Fig. 2).
Compared with group I rats, TLR4 expression was significantly
greater in group II rats (P=0.001). Rats of group III (P=0.042) and
IV (P=0.048) indicated significantly decreased expression of TLR4
(Fig. 3).
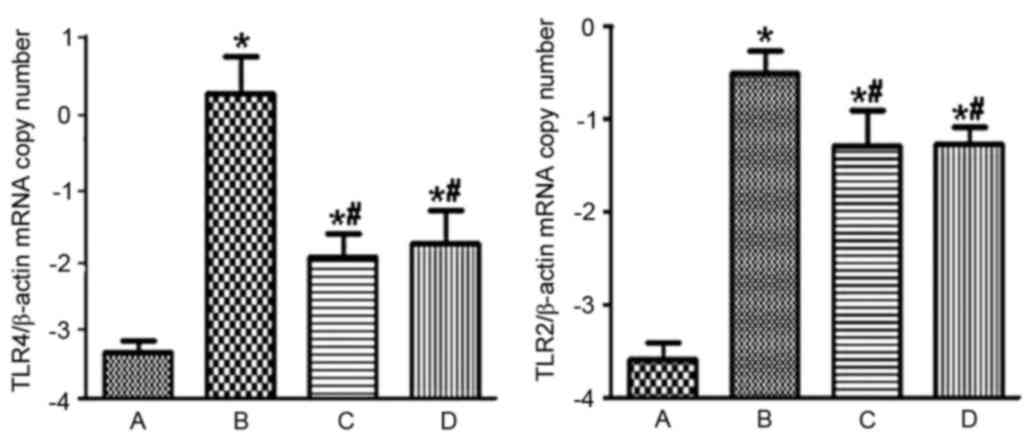
mRNA expression levels of TLR4 and
TLR2
RT-PCR demonstrated that the mRNA expression levels
ofTLR4 in groups I, II, III and IV were 0.00057±0.00023, 1.58±1.00,
0.018±0.015, and 0.037±0.027, respectively. Furthermore, the mRNA
expression levels of TLR2 in groups I, II, III and IV were
0.00038±0.00018, 0.42±0.17, 0.027±0.019, and 0.020±0.007,
respectively. When compared with rats of group I, rats of group II
demonstrated significantly increased mRNA expression levels of TLR4
and TLR2 (P=0.000; Fig. 4).
Compared with groups II, groups III (P=0.000) and IV (P=0.000)
indicated significantly decreased mRNA expression levels of TLR4
and TLR2 (Fig. 4). However, the
mRNA levels of TLR4 (P=0.898) and TLR2 (P=0.963) in groups III and
IV were not significantly different from each other.
Serum concentration of TNF-α and
IL-1β
Compared with rats in group I, rats in group II
exhibited a significantly higher concentration of serum TNF-α
(P=0.032) and IL-1β (P=0.023) Compared to group II, rats of groups
III (P=0.041, 0.048) and IV (P=0.045, 0.049) were observed to have
varying levels of decrease in their serum TNF-α and IL-1β
concentration (Table VII).
| Table VII.Serum concentration of TNF-α and
IL-1β in each group. |
Table VII.
Serum concentration of TNF-α and
IL-1β in each group.
| Group | TNF-α | IL-1β |
|---|
| Control | 17.36±3.85 | 11.64±3.50 |
| Model |
29.42±7.51a |
23.05±4.52a |
| Golden bifid |
22.98±5.22a,b |
16.37±4.22a,b |
| TLR4mAb |
24.18±4.62a,b |
16.78±5.89a,b |
Discussion
UC is a chronic and recurrent IBD that primarily
affects the rectum and colon. The etiology and pathogenesis of UC
remain to be elucidated, however, there have been several
advancements in the study of intestinal microecology and
immunology, suggesting that intestinal flora disorder and abnormal
immune response are characteristic symptoms of UC. Bullock et
al (16) reported that
compared with UC patients in remission, patients with acute UC
demonstrated continuous inflammation and intestinal flora disorder.
These patients had significantly reduced amounts of beneficial
bacteria, however, there was widespread proliferation of
opportunistic and harmful bacteria in the gut. A recent study has
demonstrated hat when probiotics are administered along with
conventional treatment to patients with mild and moderate UC, there
is a notable improvement in their condition (17). Under the combined effect of
probiotics and conventional treatment, the proportion of patients
with disease activity decreased by 50%, which was higher than that
of patients receiving placebo and conventional treatment. In order
to provide a theoretical basis for the clinical use of probiotics,
the underlying mechanisms via which probiotics inhibit inflammation
first require elucidation. Golden bifid is a preparation containing
three prominent probiotics, Bifidobacteriumlongum,
Lactobacillus bulgaricus and Streptococcus
thermophilus. Golden bifid alleviates intestinal inflammation
by releasing these live bacteria into the intestine, thereby
increasing the number of beneficial or opportunistic bacteria that
promote intestinal flora. Sang et al (18) used gavage to administer
heat-inactivated probiotic VSL#3 to UC rats for seven days. The
inactivated probiotic VSL#3 elicited anti-inflammatory activity in
the dextran sodium sulfate-induced acute UC rat model. The
probiotic VSL#3 downregulated the expression of IL-6, IL-23, and
TGF-β in rat colonic tissues. In addition, a previous study
described how Bifidobacterium and Lactobacillus were
administered via gavage to UC rats (19). It was observed that these probiotic
species reduced the expression of TLR4 in colonic rat tissues.
Presently, it has been suggested that TLRs are
closely associated with the development of UC (20–22).
TLR, a pattern recognition receptor, is a protein of the natural
immune system. TLRs are widely expressed on cell membranes in cells
that are involved in the innate and the specific immune system,
indicating their importance as part of the defense mechanism of the
body. TLRs first recognize the pathogen associated molecular
patterns (PAMPs) and trigger a series of cascades to activate
nuclear factor-κB and mitogen activated protein kinase P38, which
subsequently induce the release of various cytokines, including
IL-6, IL-1, IL-8, IL-10, IL-12, TNF-α, nitric oxide synthase, and
B7 molecules. Thus, TLRs aggravate inflammatory reactions (23,24).
Haller et al (25) has
reported that peptidoglycans and lipopolysaccharides of bacteria
may act as PAMPs to interact with TLR2 and TLR4, respectively. In
addition to being inflammatory mediators, particularly in abnormal
release of cytokines, TLRs also increase mucosal damage and disease
progression (26). During the
development of IBD, TNFs function beyond their pro-inflammatory
activity to activate endothelial cells and induce the release of
chemokines. Furthermore, they recruit neutrophils, resulting in
mucosal lesions and edema. They activate coagulation and
participate in the formation of granuloma (27). TNF-α is an important cytokine that
causes mucosal inflammation during the development of UC. A
previous study has reported that TNF-α enhances the expression of
TLR-4-myeloid differentiation 2 complex in intestinal epithelial
cells, thus increasing sensitivity of the host to LPS (28). This series of events aggravates the
progression of UC. Canto et al (29) has demonstrated that compared with
remission patients or healthy controls, 48% patients with active
IBD exhibited significantly increased TNF-α expression. IL-1β is
another inflammatory factor that is highly expressed in patients
with UC. Rachmilewitz et al (30) has reported that in patients with
acute UC, the expression of IL-1β in lesions was three-fold that
observed in normal sites. As the intestinal barrier is severely
damaged in patients with UC, bacterial products can easily pass
from the intestine into the intestinal mucosa, triggering a series
of inflammatory reactions by the immune cells.
The findings of the present study are in agreement
with the results of Hausmann et al (31). In the present study, UC model rats
exhibited significantly increased expression of TLR4 and TLR2, when
compared with the healthy control group, indicating that TLR4 and
TLR2 are important in the pathogenesis of UC. Compared with rats of
group II, rats of groups III and IV exhibit significantly lower
levels of pathological inflammation and expression of TLR4 and
TLR2. However, the differences in the pathological inflammation or
TLR4/TLR2 expression were not significant when comparing these
parameters amongst rats of groups III and IV, indicating that
Golden bifid had a strong inhibitory effect on the expression of
TLR4 and TLR2. Furthermore, such an effect was comparable to that
of TLR4mAb. Compared with the control group, rats of group II had a
significantly greater concentration of TNF-α and IL-1β in their
serum samples. This indicates that TNF-α and IL-1β are associated
with the development of UC in rats. By contrast, compared to group
II, the rats of groups III and IV exhibited a markedly lower
concentration of TNF-α and IL-1β; however, there was no
statistically significant difference in the concentration of TNF-α
and IL-1β levels among groups III and IV. These results indicate
that probiotics regulate the balance of intestinal flora, thus
decreasing the occurrence of abnormal immune responses to bacterial
antigens. Furthermore, probiotics either alleviate or inhibit
further inflammation by suppressing the expression of TLR4. Thus,
probiotics prevent the occurrence of TLR4-mediated cascades, which
are otherwise induced by these inflammatory reactions.
In conclusion, the present study suggests that
abnormal intestinal immune responses are associated with the
development of UC. Thus, probiotics regulate the balance of
intestinal flora and inhibit TLR-mediated immune response, thus
alleviating the pathogenesis of intestinal inflammatory
reactions.
Acknowledgements
The present study was supported by the Xinjiang
Uyghur Autonomous Region Natural Science Foundation (grant no.
2013211A092).
References
|
1
|
Zeng Z, Zhu Z, Yang Y, Ruan W, Peng X, Su
Y, Peng L, Chen J, Yin Q, Zhao C, et al: Incidence and clinical
characteristics of inflammatory bowel disease in a developed region
of Guangdong Province, China: A prospective population-based study.
J Gastroenterol Hepatol. 28:1148–1153. 2013. View Article : Google Scholar : PubMed/NCBI
|
|
2
|
Sprong RC, Schonewille AJ and van der Meer
R: Dietary cheese whey protein protects rats against mild dextran
sulfate sodium-induced colitis: Role of mucin and microbiota. J
Dairy Sci. 93:1364–1371. 2010. View Article : Google Scholar : PubMed/NCBI
|
|
3
|
Schirbel A and Fiocchi C: Inflammatory
bowel disease: Established and evolving considerations on its
etiopathogenesis and therapy. J Dig Dis. 11:266–276. 2010.
View Article : Google Scholar : PubMed/NCBI
|
|
4
|
Nagasaki A, Takahashi H, Iinuma M,
Uchiyama T, Watanabe S, Koide T, Tokoro C, Inamori M, Abe Y and
Nakajima A: Ulcerative colitis with multidrug-resistant Pseudomonas
aeruginosa infection successfully treated with bifidobacterium.
Digestion. 81:204–205. 2010. View Article : Google Scholar : PubMed/NCBI
|
|
5
|
Wang LS, Li YX, Zhu HM, Zhu ZS and Ma XD:
Influence of bifidobacterium DNA on PKC and NF-kappaB in murine
macrophages. Xi Bao Yu Fen Zi Mian Yi Xue Za Zhi. 23:11–13.
2007.(In Chinese). PubMed/NCBI
|
|
6
|
Servin AL: Antagonistic activities of
lactobacilli and bifidobacteria against microbial pathogens. FEMS
Microbiol Rev. 28:405–440. 2004. View Article : Google Scholar : PubMed/NCBI
|
|
7
|
Collado MC, Surono IS, Meriluoto J and
Salminen S: Potential probiotic characteristics of Lactobacillus
and Enterococcus strains isolated from traditional dadih fermented
milk against pathogen intestinal colonization. J Food Prot.
70:700–705. 2007. View Article : Google Scholar : PubMed/NCBI
|
|
8
|
Madsen KL: Inflammatory bowel disease:
Lessons from the IL-10 gene-deficient mouse. Clin Invest Med.
24:250–257. 2001.PubMed/NCBI
|
|
9
|
Mack DR, Ahrne S, Hyde L, Wei S and
Hollingsworth MA: Extracellular MUC3 mucin secretion follows
adherence of Lactobacillus strains to intestinal epithelial cells
in vitro. Gut. 52:827–833. 2003. View Article : Google Scholar : PubMed/NCBI
|
|
10
|
Frolova L, Drastich P, Rossmann P,
Klimesova K and Tlaskalova-Hogenova H: Expression of Toll-like
receptor 2 (TLR2), TLR4, and CD14 in biopsy samples of patients
with inflammatory bowel diseases: Upregulated expression of TLR2 in
terminal ileum of patients with ulcerative colitis. J Histochem
Cytochem. 56:267–274. 2008. View Article : Google Scholar : PubMed/NCBI
|
|
11
|
Liu Y, Zhang Z, Wang L, Li J, Dong L, Yue
W, Chen J, Sun X, Zhong L and Sun D: TLR4 monoclonal antibody
blockade suppresses dextran-sulfate-sodium-induced colitis in mice.
J Gastroenterol Hepatol. 25:209–214. 2010. View Article : Google Scholar : PubMed/NCBI
|
|
12
|
Fort MM, Mozaffarian A, Stöver AG, Jda S
Correia, Johnson DA, Crane RT, Ulevitch RJ, Persing DH,
Bielefeldt-Ohmann H, Probst P, et al: A synthetic TLR4 antagonist
has anti-inflammatory effects in two murine models of inflammatory
bowel disease. J Immunol. 174:6416–6423. 2005. View Article : Google Scholar : PubMed/NCBI
|
|
13
|
Cooper HS, Murthy SN, Shah RS and
Sedergran DJ: Clinicopathologic study of dextran sulfate sodium
experimental murine colitis. Lab Invest. 69:238–249.
1993.PubMed/NCBI
|
|
14
|
Fromowitz FB, Viola MV, Chao S, Oravez S,
Mishriki Y, Finkel G, Grimson R and Lundy J: ras p21 expression in
the progression of breast cancer. Hum Pathol. 18:1268–1275. 1987.
View Article : Google Scholar : PubMed/NCBI
|
|
15
|
Livak KJ and Schmittgen TD: Analysis of
relative gene expression data using real-time quantitative PCR and
the 2(−Delta Delta C(T)) method. Method. 25:402–408. 2001.
View Article : Google Scholar
|
|
16
|
Bullock NR, Booth JC and Gibson GR:
Comparative composition of bacteria in the human intestinal
microflora during remission and active ulcerative colitis. Curr
Issues Intest Microbiol. 5:59–64. 2004.PubMed/NCBI
|
|
17
|
Mardini HE and Grigorian AY: Probiotic mix
VSL#3 is effective adjunctive therapy for mild to moderately active
ulcerative colitis: A meta-analysis. Inflamm Bowel Dis.
20:1562–1567. 2014. View Article : Google Scholar : PubMed/NCBI
|
|
18
|
Sang LX, Chang B, Dai C, Gao N, Liu WX and
Jiang M: Heat-killed VSL#3 ameliorates dextran sulfate sodium
(DSS)-induced acute experimental colitis in rats. Int J Mol Sci.
15:15–28. 2013. View Article : Google Scholar : PubMed/NCBI
|
|
19
|
Yang X, Fu Y, Liu J and Ren HY: Impact of
probiotics on toll-like receptor 4 expression in an experimental
model of ulcerative colitis. J Huazhong Univ Sci Technolog Med Sci.
33:661–665. 2013. View Article : Google Scholar : PubMed/NCBI
|
|
20
|
Cario E: Toll-like receptors in
inflammatory bowel diseases: A decade later. Inflamm Bowel Dis.
16:1583–1597. 2010. View Article : Google Scholar : PubMed/NCBI
|
|
21
|
Østvik AE, Granlund AV, Torp SH, Flatberg
A, Beisvåg V, Waldum HL, Flo TH, Espevik T, Damås JK and Sandvik
AK: Expression of Toll-like receptor-3 is enhanced in active
inflammatory bowel disease and mediates the excessive release of
lipocalin 2. Clin Exp Immunol. 173:502–511. 2013. View Article : Google Scholar : PubMed/NCBI
|
|
22
|
Borrello S, Nicolo C, Delogu G, Pandolfi F
and Ria F: TLR2: A crossroads between infections and autoimmunity?
Int J Immunopathol Pharmacol. 24:549–556. 2011. View Article : Google Scholar : PubMed/NCBI
|
|
23
|
D'Incà R, Barollo M, Scarpa M, Grillo AR,
Brun P, Vettorato MG, Castagliuolo I and Sturniolo GC: Rectal
administration of Lactobacillus casei DG modifies flora composition
and Toll-like receptor expression in colonic mucosa of patients
with mild ulcerative colitis. Dig Dis Sci. 56:1178–1187. 2011.
View Article : Google Scholar : PubMed/NCBI
|
|
24
|
Roberts-Thomson IC, Fon J, Uylaki W,
Cummins AG and Barry S: Cells, cytokines and inflammatory bowel
disease: A clinical perspective. Expert Rev Gastroenterol Hepatol.
5:703–716. 2011. View Article : Google Scholar : PubMed/NCBI
|
|
25
|
Haller D, Russo MP, Sartor RB and Jobin C:
IKK beta and phosphatidylinositol 3-kinase/Akt participate in
non-pathogenic Gram-negative enteric bacteria-induced RelA
phosphorylation and NF-kappa B activation in both primary and
intestinal epithelial cell lines. J Biol Chem. 277:38168–38178.
2002. View Article : Google Scholar : PubMed/NCBI
|
|
26
|
Khor B, Gardet A and Xavier RJ: Genetics
and pathogenesis of inflammatory bowel disease. Nature.
474:307–317. 2011. View Article : Google Scholar : PubMed/NCBI
|
|
27
|
Van Deventer SJ: Tumour necrosis factor
and Crohn's disease. Gut. 40:443–448. 1997. View Article : Google Scholar : PubMed/NCBI
|
|
28
|
Suzuki M, Hisamatsu T and Podolsky DK:
Gamma interferon augments the intracellular pathway for
lipopolysaccharide (LPS) recognition in human intestinal epithelial
cells through coordinated up-regulation of LPS uptake and
expression of the intracellular Toll-like receptor 4-MD-2 complex.
Infect Immun. 71:3503–3511. 2003. View Article : Google Scholar : PubMed/NCBI
|
|
29
|
Cantó E, Ricart E, Monfort D,
González-Juan D, Balanzó J, Rodríguez-Sánchez JL and Vidal S: TNF
alpha production to TLR2 ligands in active IBD patients. Clin
Immunol. 119:156–165. 2006. View Article : Google Scholar : PubMed/NCBI
|
|
30
|
Rachmilewitz D, Karmeli F, Shteingart S,
Lee J, Takabayashi K and Raz E: Immunostimulatory oligonucleotides
inhibit colonic proinflammatory cytokine production in ulcerative
colitis. Inflamm Bowel Dis. 12:339–345. 2006. View Article : Google Scholar : PubMed/NCBI
|
|
31
|
Hausmann M, Kiessling S, Mestermann S,
Webb G, Spöttl T, Andus T, Schölmerich J, Herfarth H, Ray K, Falk W
and Rogler G: Toll-like receptors 2 and 4 are up-regulated during
intestinal inflammation. Gastroenterology. 122:1987–2000. 2002.
View Article : Google Scholar : PubMed/NCBI
|