Introduction
Intervertebral disc (IVD) degeneration, also termed
degenerative disc disorder or degenerative disc disease, is a
pathological process that may induce acute or chronic lower back
pain (1,2). Lower back pain is one of the primary
health problems in developed countries (3). The risk factors for disc degeneration
include genetic inheritance and environmental risk factors,
including smoking cigarettes and repetitive and high mechanical
loading (4). IVD degeneration is a
rapidly progressing disease without an effective therapeutic method
(5). Therefore, it is necessary to
explore the mechanisms of IVD degeneration in order to be able to
develop a novel treatment scheme.
IVD degeneration and the underlying molecular
mechanisms have been previously investigated. The aggrecanases ADAM
metallopeptidase with thrombospondin type 1 motif (ADAMTS)-1, -4,
-5, -9 and -15 may promote extracellular matrix (ECM) alterations
during IVD degeneration, and may be used for preventing IVD
degeneration and its morbidity (6). In disc cells, reduced expression of
SRY-type high mobility group box 9 (SOX9) may be associated
with disc degeneration and disc ageing via inhibition of type II
collagen expression (7). The
growth differentiation factor-5 (GDF-5) cDNA and the
recombinant GDF-5 protein may promote the expression of ECM
protein-coding genes in mouse IVD cells (8). Previous studies have detected
overexpressed tumor necrosis factor α (TNF-α) and
interleukin (IL)-1 in aged and degenerative IVDs obtained
from human and animal models (9,10).
IL-1 has been identified to be involved in IVD degeneration
via directly inhibiting matrix synthesis and promoting matrix
degradation (11,12). Cytokines of IL-1 and
TNF-α may be associated with the pathogenesis of IVD
degeneration; however, IL-1 may have a greater contribution
to IVD degeneration and may be a more suitable therapeutic target
for the disease (13).
In 2013, Markova et al (14) established a rat disc organ culture
model that mimicked IVD degeneration via culturing rat IVDs in the
presence of IL-1β, TNF-α and serum-limiting conditions. They
obtained 1036 differentially expressed genes (DEGs) between
experimental and control groups following gene expression analysis
for microarray data. The present study used the data from Markova
et al (14) and the DEGs
between degenerated and normal nucleus pulposus cells were
identified, and their possible functions were predicted using
enrichment analysis. Additionally, protein-protein interaction
(PPI) networks were visualized and module analysis was conducted to
screen for key genes in degenerated nucleus pulposus cells.
Materials and methods
Microarray data
Microarray data obtained from GSE42611 (http://www.ncbi.nlm.nih.gov/geo/query/acc.cgi?acc=GSE42611),
which was downloaded from the database of Gene Expression Omnibus
(GEO), were sequenced on the platform of GPL6247 Affymetrix Rat
Gene 1.0 ST Array [transcript (gene) version]. GSE42611 included 4
nucleus pulposus samples isolated from degenerated IVDs and 4
nucleus pulposus samples separated from normal IVDs. The procedure
that had been used to obtain the rat lumbar disc specimens (n=4
specimens/group) was as follows, according to the method of
Ponnappan et al (8): Whole
lumbar IVDs with endplates had been dissected and preserved in
organ culture. Lumbar discs in the experimental group had been
cultivated in Dulbecco's modified Eagle's medium (DMEM) containing
100 ng/ml TNF-α, 10 ng/ml IL-1β, 50 µg/ml L-ascorbate, 40 mM NaCl,
1% fetal bovine serum (FBS), antibiotics and antimycotics. Lumbar
discs in the control group had been cultured in DMEM containing 50
µg/ml L-ascorbate, 40 mM NaCl, 10% FBS and antibiotics without
cytokines. The discs had been cultured for a total of 10 days
(14). GSE42611 used in this study
was downloaded from a public database; therefore, patient consent
or ethics committee approval were not required.
Data preprocessing and DEGs
screening
GSE42611 was downloaded and the microarray data was
preprocessed using the Affy package (15) in R. The process of data
preprocessing included background correction, quantile
normalization, summarization and probe ID to gene symbol
transformation. Linear models for microarray data in the limma
package (16) in R were used to
analyze the DEGs between degenerated and normal nucleus pulposus
cells. P-values of the DEGs were calculated separately and adjusted
using the t-test method and the Benjamini & Hochberg method
(17). P<0.05 and
|log2 fold-change (FC)|>1 were used as the
thresholds.
Functional and pathway enrichment
analysis
The Database for Annotation, Visualization and
Integrated Discovery (DAVID; david.abcc.ncifcrf.gov) software was used to interpret
functions of extensive genes obtained from previous genome studies
(18). The Gene Ontology database
(GO; www.geneontology.org) contained
structured ontologies or vocabularies that depict basic
characteristics of genes and gene products (19). The Kyoto Encyclopedia of Genes and
Genomes database (KEGG; www.genome.jp/kegg/) synthesizes information of
biological systems from genomic, chemical and systemic functional
aspects (20). Using the DAVID
software, functional and pathway enrichment analyses were conducted
separately, for upregulated and downregulated genes. P≤0.05 and
>2 enriched genes were set as the thresholds.
PPI network construction and module
analysis
The Search Tool for the Retrieval of Interacting
Genes (STRING; string-db.org) database provide
comprehensive and easily accessible interaction information derived
from experiments and predictions (21). Cytoscape software (www.cytoscape.org) was used to integrate
high-throughput expression data and biomolecular interaction
networks into a unified framework (22). The PPIs obtained for the DEGs were
searched using the STRING database (21), with the required confidence
(combined score) >0.4 as the threshold. Using Cytoscape software
version 2.8 (22), the PPIs were
used to established a PPI network. In the network, the proteins
were termed nodes and the number of edges involved were their
degrees. Finally, the MCODE plug-in (23) in Cytoscape was used to perform
module analysis of the PPI networks. The parameters were set at the
default thresholds.
Results
DEG analysis
P<0.05 and |log2FC|>1 were set as
thresholds and the DEGs between degenerated and normal nucleus
pulposus cells were analyzed. There were 558 DEGs identified in the
degenerated nucleus pulposus cells compared with normal nucleus
pulposus cells, including 253 upregulated and 305 downregulated
genes. There were more downregulated genes compared with
upregulated genes.
Functional and pathway enrichment
analysis
The upregulated genes in the degenerated nucleus
pulposus cells were significantly enriched in 255 GO terms and 9
KEGG pathways. The top 10 functions are presented in Table IA, including response to wounding
(P=2.35×10⁻⁸), inflammatory response
(P=5.99×10⁻⁸) and response to organic substance
(P=1.56×10⁻⁷).
 | Table I.The top 10 enriched functions for the
differentially expressed genes in the degenerated nucleus pulposus
cells |
Table I.
The top 10 enriched functions for the
differentially expressed genes in the degenerated nucleus pulposus
cells
| A, Top 10 functions
enriched for the upregulated genes in the degenerated nucleus
pulposus cells |
|---|
|
|---|
| ID | Description | P-value | Number of
genes | Gene |
|---|
| GO:0009611 | Response to
wounding |
2.35×10⁻⁸ | 24 | KNG1, CXCL1,
NFKBIZ, IL6, GIP, KNG2, OLR1, C3, CXCL3, KNG1L1, CXCL2, CLU, HP,
GLI3, TIMP1, SOD2, ORM1, CASP4, HIF1A, CCL20, PTGES, HMOX1, JAK2,
TFPI2 |
| GO:0006954 | Inflammatory
response |
5.99×10⁻⁸ | 17 | KNG1, CXCL1,
NFKBIZ, IL6, KNG2, OLR1, C3, CXCL3, CXCL2, KNG1L1, HP, ORM1, CASP4,
HIF1A, CCL20, PTGES, HMOX1 |
| GO:0010033 | Response to organic
substance |
1.56×10⁻⁷ | 35 | FOSL2, OSMR,
IL6ST, TLR2, NFKBIA, HP, GNG12, MMP3, GLI3, TIMP1, GCH1, IRAK3,
PTGES, HMOX1, CSF2RB, ANGPT1, PPP3CA, SKIL, PIK3R3, NR1H3, IL6,
SGK1, GIP, BCKDHB, MMP14, CYP7B1, HIF1A, ATP2A2, ABCB1B, CXCL16,
JAK2, CTSC, PTPN1, CAR4, STEAP2 |
| GO:0006952 | Defense
response |
1.68×10⁻⁷ | 22 | KNG1, CXCL1,
NFKBIZ, IL6, KNG2, OLR1, FGR, C3, CXCL3, KNG1L1, CXCL2, TLR2, HP,
GCH1, ORM1, CASP4, HIF1A, CCL20, PTGES, CXCL16, HMOX1,
NOS2 |
| GO:0042311 | Vasodilation |
2.48×10⁻⁶ | 7 | KNG1, EDNRB,
KNG2, KNG1L1, ITGA1, SOD2, GCH1 |
| GO:0034097 | Response to
cytokine stimulus |
3.62×10⁻⁶ | 11 | IRAK3, IL6,
FOSL2, OSMR, IL6ST, PTGES, CXCL16, SKIL, MMP3, TIMP1, GCH1 |
| GO:0009719 | Response to
endogenous stimulus |
4.73×10⁻⁶ | 24 | SGK1, IL6,
FOSL2, GIP, BCKDHB, TLR2, HP, GNG12, MMP14, MMP3, GLI3, TIMP1,
HIF1A, ATP2A2, ABCB1B, HMOX1, ANGPT1, JAK2, PTPN1, PPP3CA, PIK3R3,
STEAP2, CAR4, NR1H3 |
| GO:0009725 | Response to hormone
stimulus |
8.64×10⁻⁶ | 22 | SGK1, IL6,
FOSL2, GIP, BCKDHB, TLR2, HP, GNG12, MMP14, GLI3, TIMP1, HIF1A,
ATP2A2, ABCB1B, HMOX1, ANGPT1, JAK2, PTPN1, STEAP2, CAR4, PIK3R3,
NR1H3 |
| GO:0055066 | Di-, tri-valent
inorganic cation homeostasis |
1.15×10⁻⁵ | 14 | KNG1, IL6ST,
HEXB, SOD2, SLC11A2, EDNRB, HIF1A, MT1A, ATP2A2, HMOX1, MT2A, PKD2,
JAK2, CP |
| GO:0055080 | Cation
homeostasis |
1.82×10⁻⁵ | 15 | KNG1, SGK1,
IL6ST, HEXB, SOD2, SLC11A2, EDNRB, HIF1A, MT1A, ATP2A2, HMOX1,
MT2A, PKD2, JAK2, CP |
|
| B, Top 10 enriched
functions for the downregulated genes in the degenerated nucleus
pulposus cells |
|
| ID | Description | P-value | Number of
genes | Gene |
|
| GO:0000279 | M phase |
9.18×10⁻¹² | 21 | KIF11, MKI67,
SGOL2, DLGAP5, HAUS1, NUF2, NUSAP1, CENPF, BIRC5, NDC80, CEP55,
TACC3, CCNB1, KIF2C, PLK1, TUBB5, BUB1B, MNS1, SKA3, STMN1,
CDCA3 |
| GO:0048545 | Response to steroid
hormone stimulus |
2.95×10⁻⁹ | 23 | SOCS2, AIF1,
CRYAB, IL1RN, TGFB3, IGF1, BIRC5, AQP1, MMP2, ADIPOQ, TIMP3, H19,
CCND1, KRT19, CD36,SERPINF1, ADM, AVPR1A, FABP4, RARA, COL1A1,
CD24, CCNA2 |
| GO:0009628 | Response to abiotic
stimulus |
1.09×10⁻⁸ | 26 | RBP4, APOBEC1,
GCLC, AIF1, LXN, IL18, COL3A1, MMP2, CXCL12, TIMP3, KRT8, THBS1,
COL11A1, MYOF, PTPRC, CRYAB, ATP1A3, IGF1, SNAI2, CCND1, CD36, ADM,
FYN, AVPR1A, TGFB1I1, COL1A1 |
| GO:0022610 | Biological
adhesion |
1.23×10⁻⁸ | 28 | IBSP, COL3A1,
LMO7, KITLG, ITGBL1, FAT3, CD93, COMP, ACAN, COL12A1, TNN, CD4,
EMB, CD24, THBS1, COL11A1, THBS4, PTPRC, ACTN1, ITGA4, PCDH18,
THY1, OMD, COL14A1, CD36, PECAM1, DSC2, CDH11 |
| GO:0007155 | Cell adhesion |
1.23×10⁻⁸ | 28 | IBSP, COL3A1,
LMO7, KITLG, ITGBL1, FAT3, CD93, COMP, ACAN, COL12A1, TNN, CD4,
EMB, CD24, THBS1, COL11A1, THBS4, PTPRC, ACTN1, ITGA4, PCDH18,
THY1, OMD, COL14A1, CD36, PECAM1, DSC2, CDH11 |
| GO:0051301 | Cell division |
2.09×10⁻⁸ | 16 | RBP4, HAUS1,
NUF2, NUSAP1, BIRC5, CEP55, CCNB1, CCND1, CCNB2, PLK1, BUB1B, SKA3,
TOP2A, CCNA2, ASPM, CDCA3 |
| GO:0022402 | Cell cycle
process |
2.49×10⁻⁸ | 24 | GAS2L3, KIF11,
MKI67, SGOL2, DLGAP5, HAUS1, NUF2, NUSAP1, CENPF, BIRC5, NDC80,
CEP55, TACC3, CDKN3, CCNB1, KIF2C, CCND1, PLK1, TUBB5, BUB1B, MNS1,
SKA3, STMN1, CDCA3 |
| GO:0030199 | Collagen fibril
organization |
4.36×10⁻⁸ | 8 | COL3A1, COL1A2,
ACAN, COL1A1, COL11A1, COL5A2, SERPINH1, DPT |
| GO:0007049 | Cell cycle |
4.42×10⁻⁸ | 27 | GAS2L3, S100A6,
HAUS1, CEP55, KIF2C, TUBB5, MNS1, SKA3, CCNA2, CDCA3, KIF11, MKI67,
SGOL2, DLGAP5, NUF2, CENPF, NUSAP1, BIRC5, NDC80, TACC3, CDKN3,
CCNB1, CCND1, CCNB2, PLK1, BUB1B, STMN1 |
The downregulated genes in the degenerated nucleus
pulposus cells were significantly enriched in 263 GO terms and 10
KEGG pathways. The top 10 functions included M phase
(P=9.18×10⁻¹²), cell cycle phase
(P=2.81×10⁻¹⁰) and response to steroid hormone stimulus
(P=2.95×10⁻⁹; Table
IB).
Additionally, the upregulated genes were
significantly enriched in cytokine-cytokine receptor interaction
(P=2.86×10⁻⁴), apoptosis (P=3.95×10⁻⁴) and
chemokine (P=1.60×10⁻³; Table IIA) signaling pathways.
| Table II.Enriched pathways for the
differentially expressed genes in the degenerated nucleus pulposus
cells. |
Table II.
Enriched pathways for the
differentially expressed genes in the degenerated nucleus pulposus
cells.
| A, Pathways
enriched for the upregulated genes |
|---|
|
|---|
| ID | Description | P-value | Number of
genes | Gene |
|---|
| rno04060 | Cytokine-cytokine
receptor interaction |
2.86×10⁻⁴ | 12 | TNFRSF9, IL6,
ZCCHC2, IL23R, TNFSF11, OSMR, IL6ST, CXCL16, MET, CXCL2, CSF2RB,
IL13RA1 |
| rno04210 | Apoptosis |
3.95×10⁻⁴ | 8 | CFLAR, IRAK3,
CSF2RB, NFKBIA, NFKB1, PPP3CA, BIRC3, PIK3R3 |
| rno04062 | Chemokine signaling
pathway |
1.60×10⁻³ | 10 | CXCL1, FGR,
CCL20, CXCL16, CXCL2, NFKBIA, JAK2, NFKB1, GNG12, PIK3R3 |
| rno04621 | NOD-like receptor
signaling pathway |
3.04×10⁻³ | 6 | CXCL1, IL6,
CXCL2, NFKBIA, NFKB1, BIRC3 |
| rno04630 | Jak-STAT signaling
pathway |
6.77×10⁻³ | 8 | IL6, IL23R,
OSMR, IL6ST, CSF2RB, JAK2, PIK3R3, IL13RA1 |
| rno04620 | Toll-like receptor
signaling pathway |
1.45×10⁻² | 6 | IL6, MAP3K8,
TLR2, NFKBIA, NFKB1, PIK3R3 |
| rno05200 | Pathways in
cancer |
3.02×10⁻² | 11 | IL6, HIF1A,
EPAS1, MET, NFKBIA, NFKB1, NOS2, RUNX1, BIRC3, PIK3R3,
GLI3 |
| rno00230 | Purine
metabolism |
3.71×10⁻² | 7 | XDH, GDA, PDE7A,
PDE4B, PDE10A, AMPD3, NT5E |
| rno05222 | Small cell lung
cancer |
4.41×10⁻² | 5 | NFKBIA, NFKB1,
NOS2, BIRC3, PIK3R3 |
|
| B, Pathways
enriched for the downregulated genes |
|
| rno04512 | ECM-receptor
interaction |
1.17×10⁻¹¹ | 16 | IBSP, COL3A1,
ITGA4, COL5A2, HMMR, CD36, COMP, COL6A3, COL1A2, COL6A2, COL6A1,
TNN, COL1A1, THBS1, COL11A1, THBS4 |
| rno04510 | Focal adhesion |
1.90×10⁻⁹ | 20 | IBSP, COL3A1,
IGF1, ACTN1, ITGA4, COL5A2, CCND1, FYN, COMP, VEGFA, COL6A3,
COL1A2, COL6A2, COL6A1, TNN, COL1A1, THBS1, COL11A1, FIGF,
THBS4 |
| rno04640 | Hematopoietic cell
lineage |
3.12×10⁻³ | 7 | CD36, KITLG,
CD4, ANPEP, CD24, ITGA4, CSF1R |
| rno05200 | Pathways in
cancer |
5.58×10⁻³ | 14 | FGF7, TGFB3,
EGLN3, KITLG, IGF1, BIRC5, FZD4, MMP2, CCND1, VEGFA, RARA, FGF1,
FIGF, CSF1R |
| rno04670 | Leukocyte
transendothelial migration |
1.97×10⁻² | 7 | CYBB, PECAM1,
ACTN1, ITGA4, MMP2, CXCL12, THY1 |
| rno05219 | Bladder cancer |
2.86×10⁻² | 4 | CCND1, VEGFA,
MMP2, FIGF |
| rno04110 | Cell cycle |
2.93×10⁻² | 7 | CCNB1, CCND1,
CCNB2, PLK1, TGFB3, BUB1B, CCNA2 |
| rno04115 | p53 signaling
pathway |
3.38×10⁻² | 5 | CCNB1, CCND1,
CCNB2, SERPINE1, IGF1 |
| rno04610 | Complement and
coagulation cascades |
4.07×10⁻² | 5 | C1QA, C3AR1,
C5AR1, MASP1, SERPINE1 |
| rno03320 | PPAR signaling
pathway |
4.25×10⁻² | 5 | LPL, CD36,
FABP4, ADIPOQ, PLTP |
The pathways enriched for the downregulated genes
included ECM-receptor interaction [P=1.17×10⁻¹¹,
involving thrombospondin 1 (THBS1)], focal adhesion
(P=1.90×10⁻⁹) and hematopoietic cell lineage
(P=3.12×10⁻³; Table
IIB).
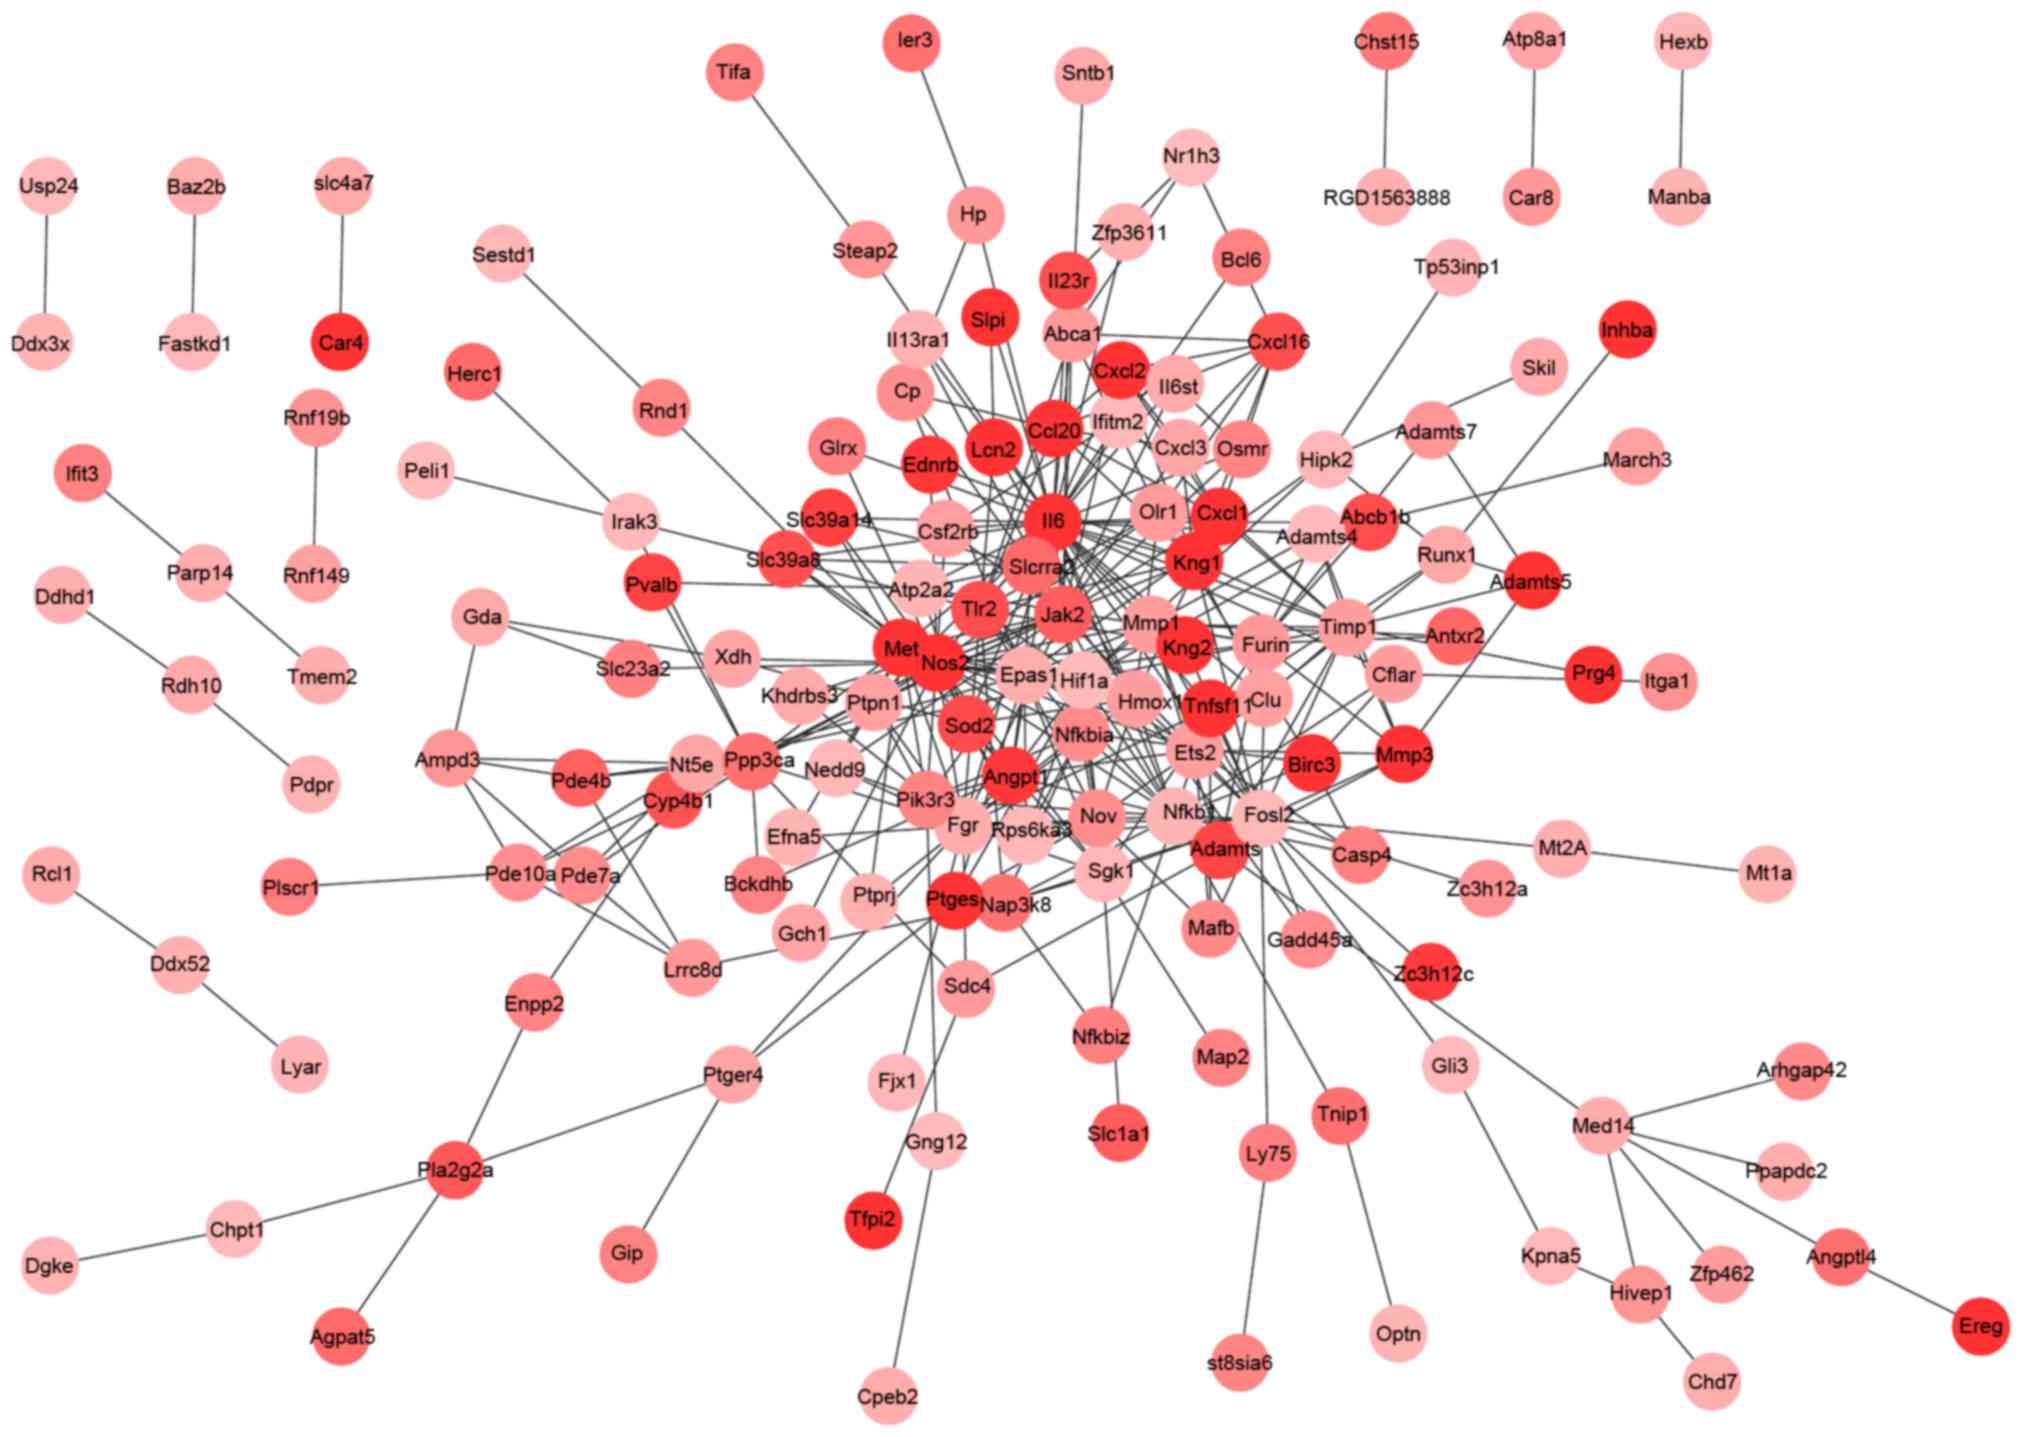
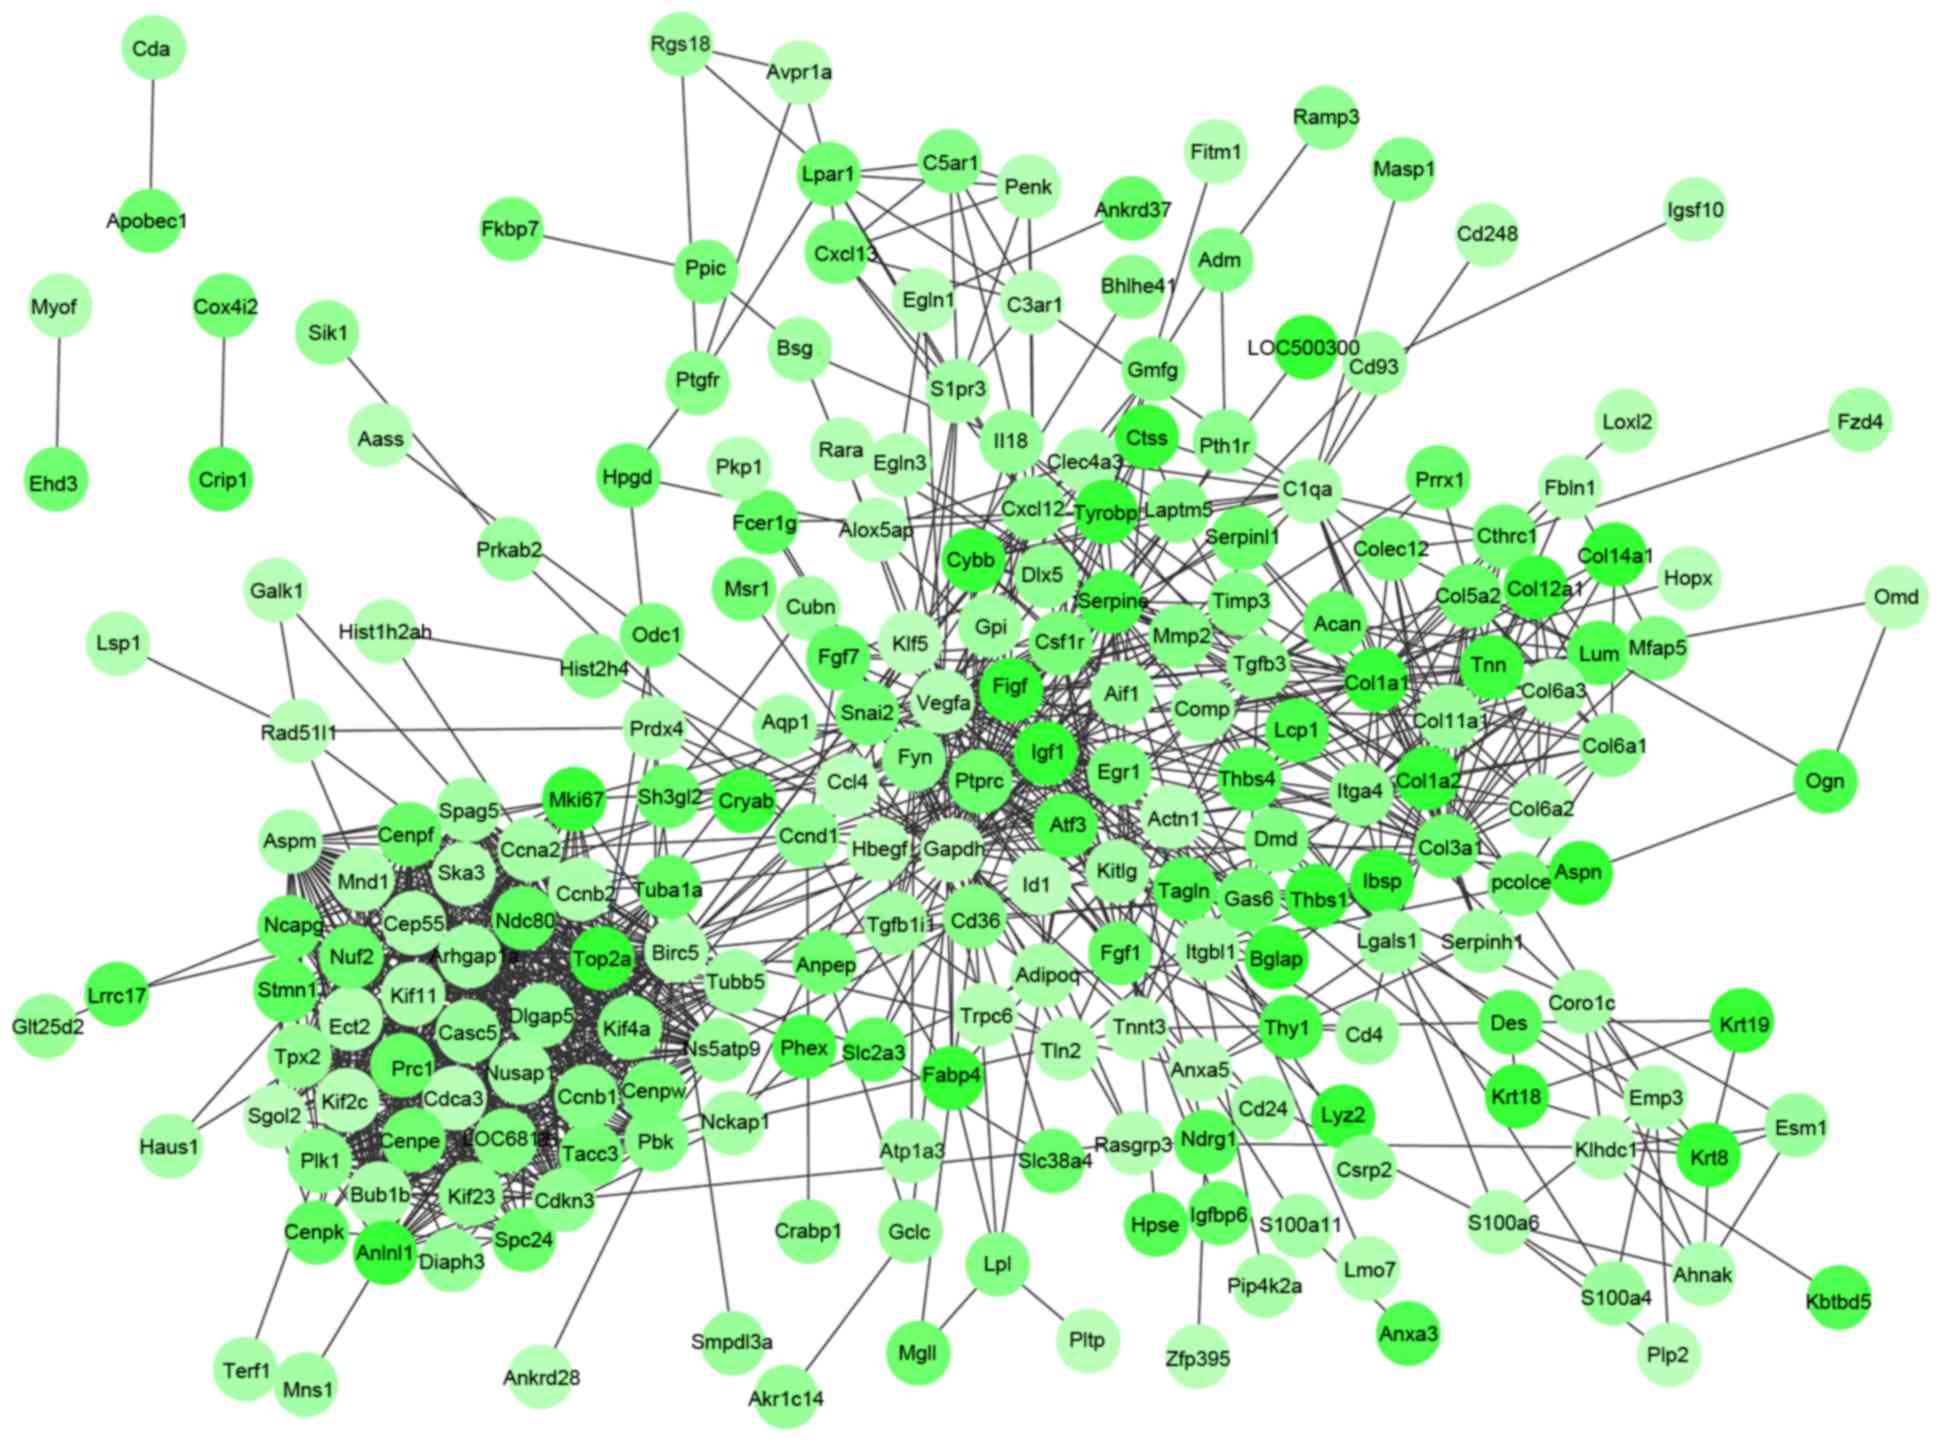
PPI network construction and module
analysis
PPI networks were constructed by Cytoscape software
following a PPI search of the DEGs. The PPI networks for the
upregulated (Fig. 1) and the
downregulated (Fig. 2) genes
separately had 360 and 1,112 interactions. Notably, IL-6
(degree=39) in the PPI network for the upregulated genes and
vascular endothelial growth factor A (VEGFA; degree=37) in the PPI
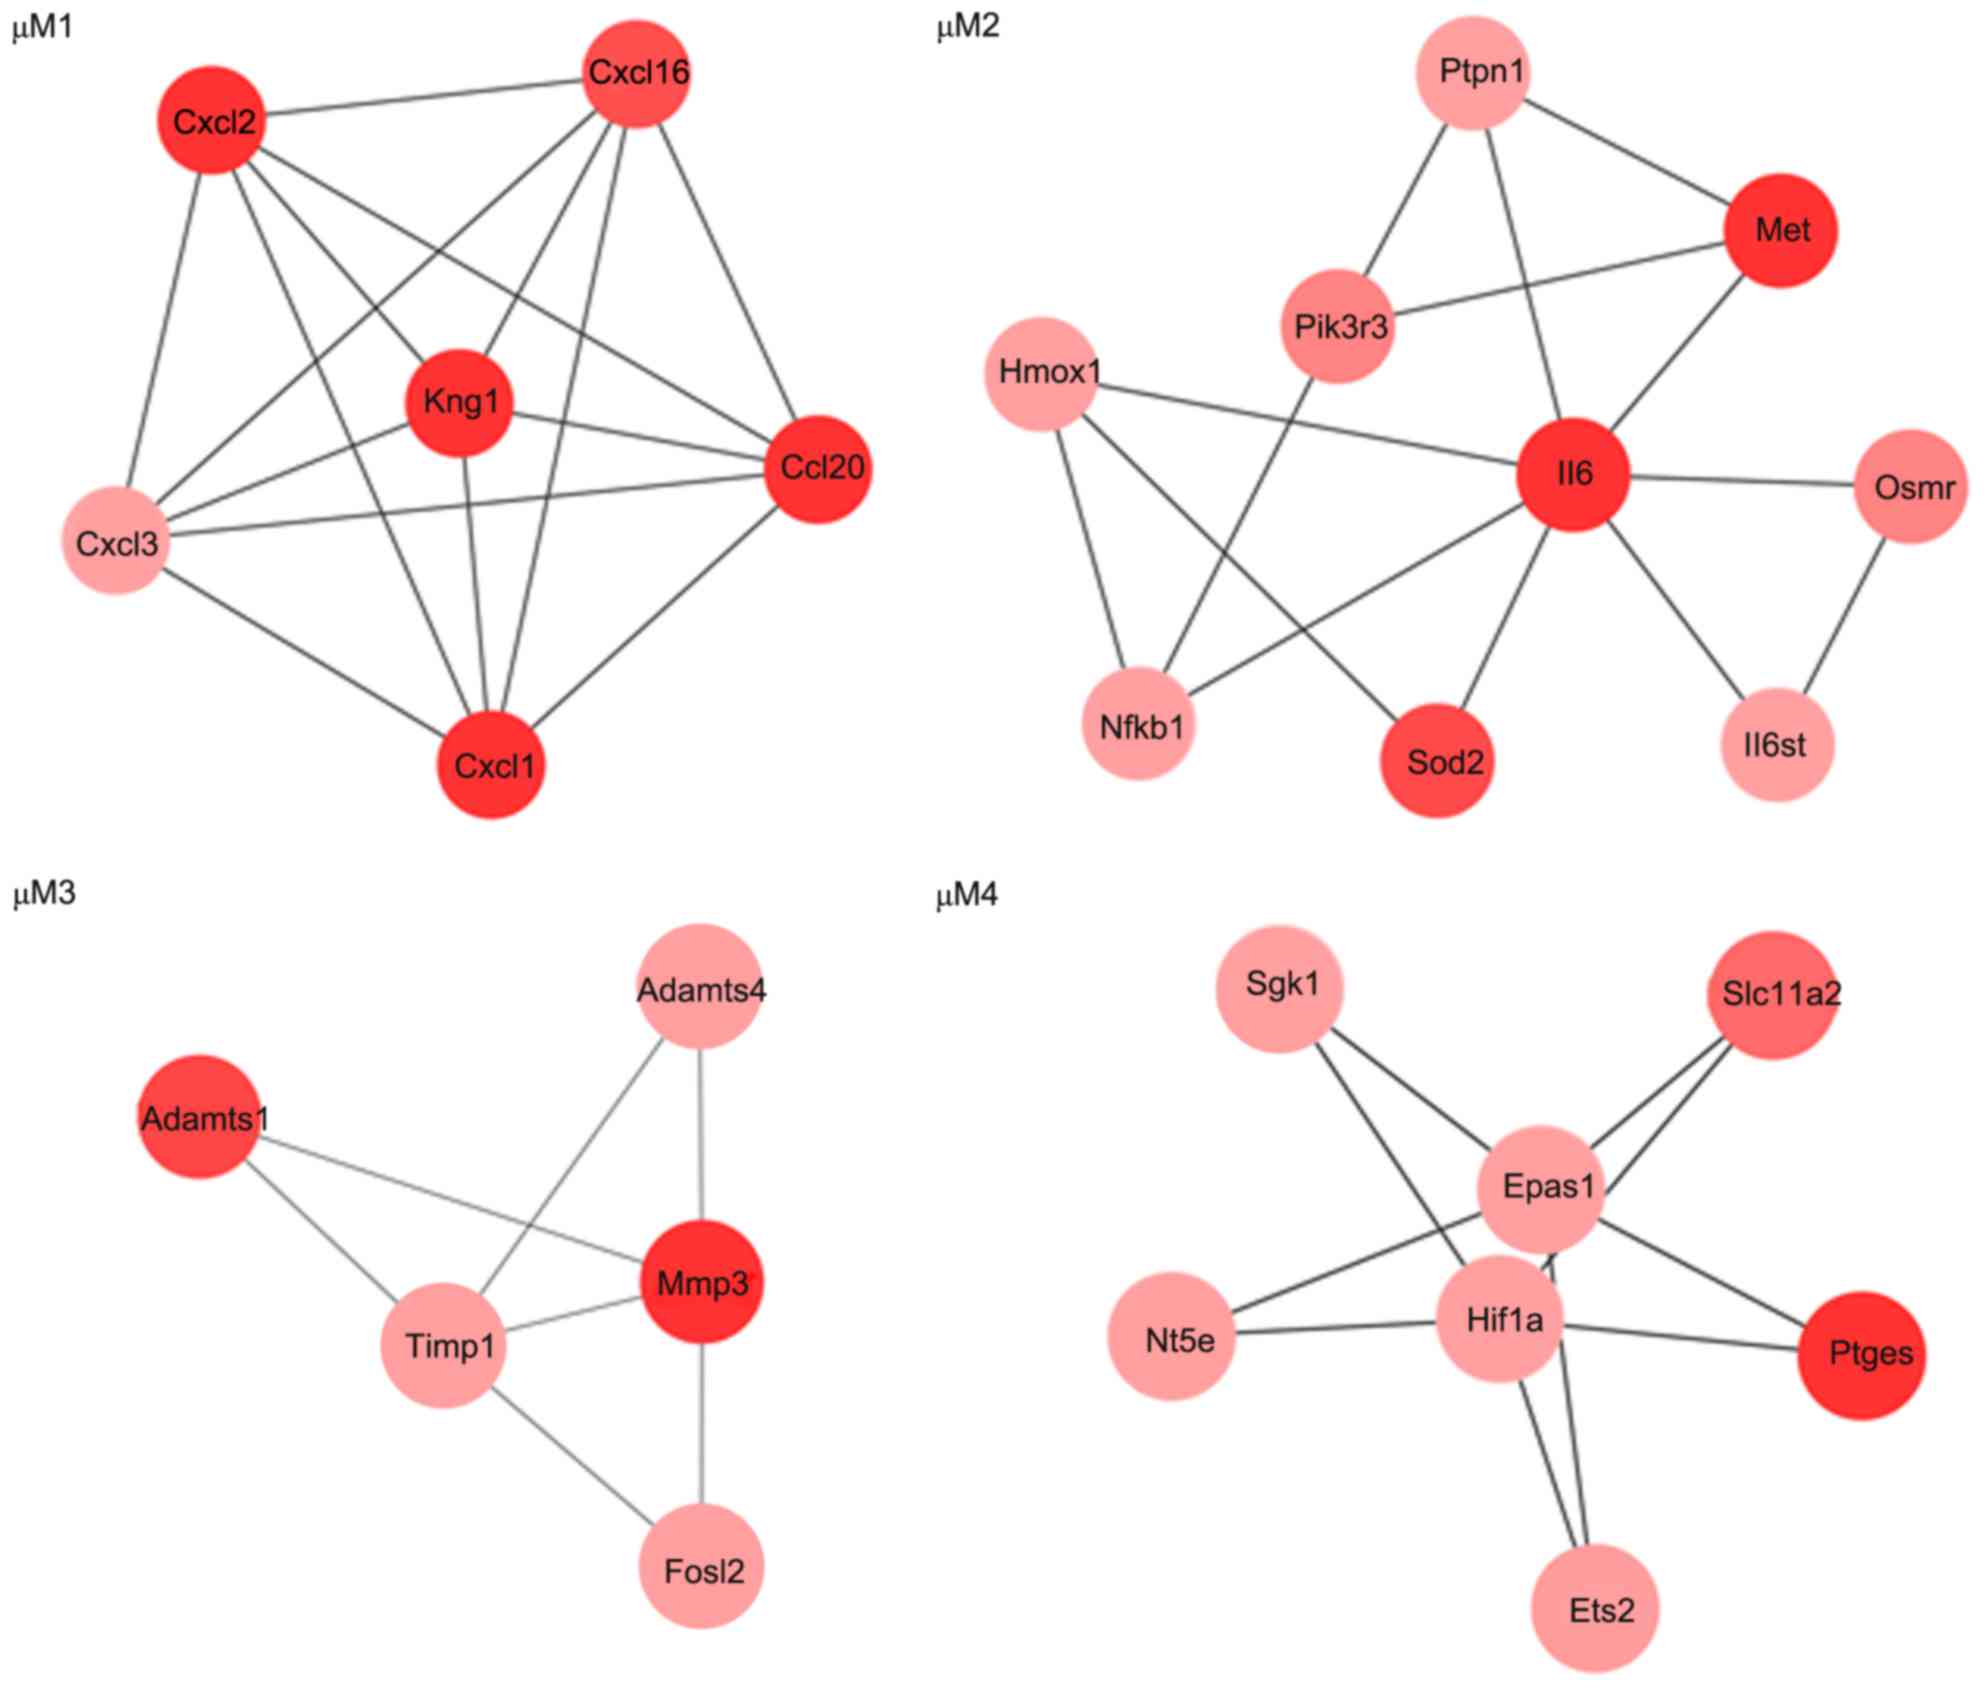
network for the downregulated genes had higher degrees. Using the
MCODE plug-in in Cytoscape, four modules (µM1, µM2, µM3 and µM4)
were identified from the PPI network for the upregulated genes
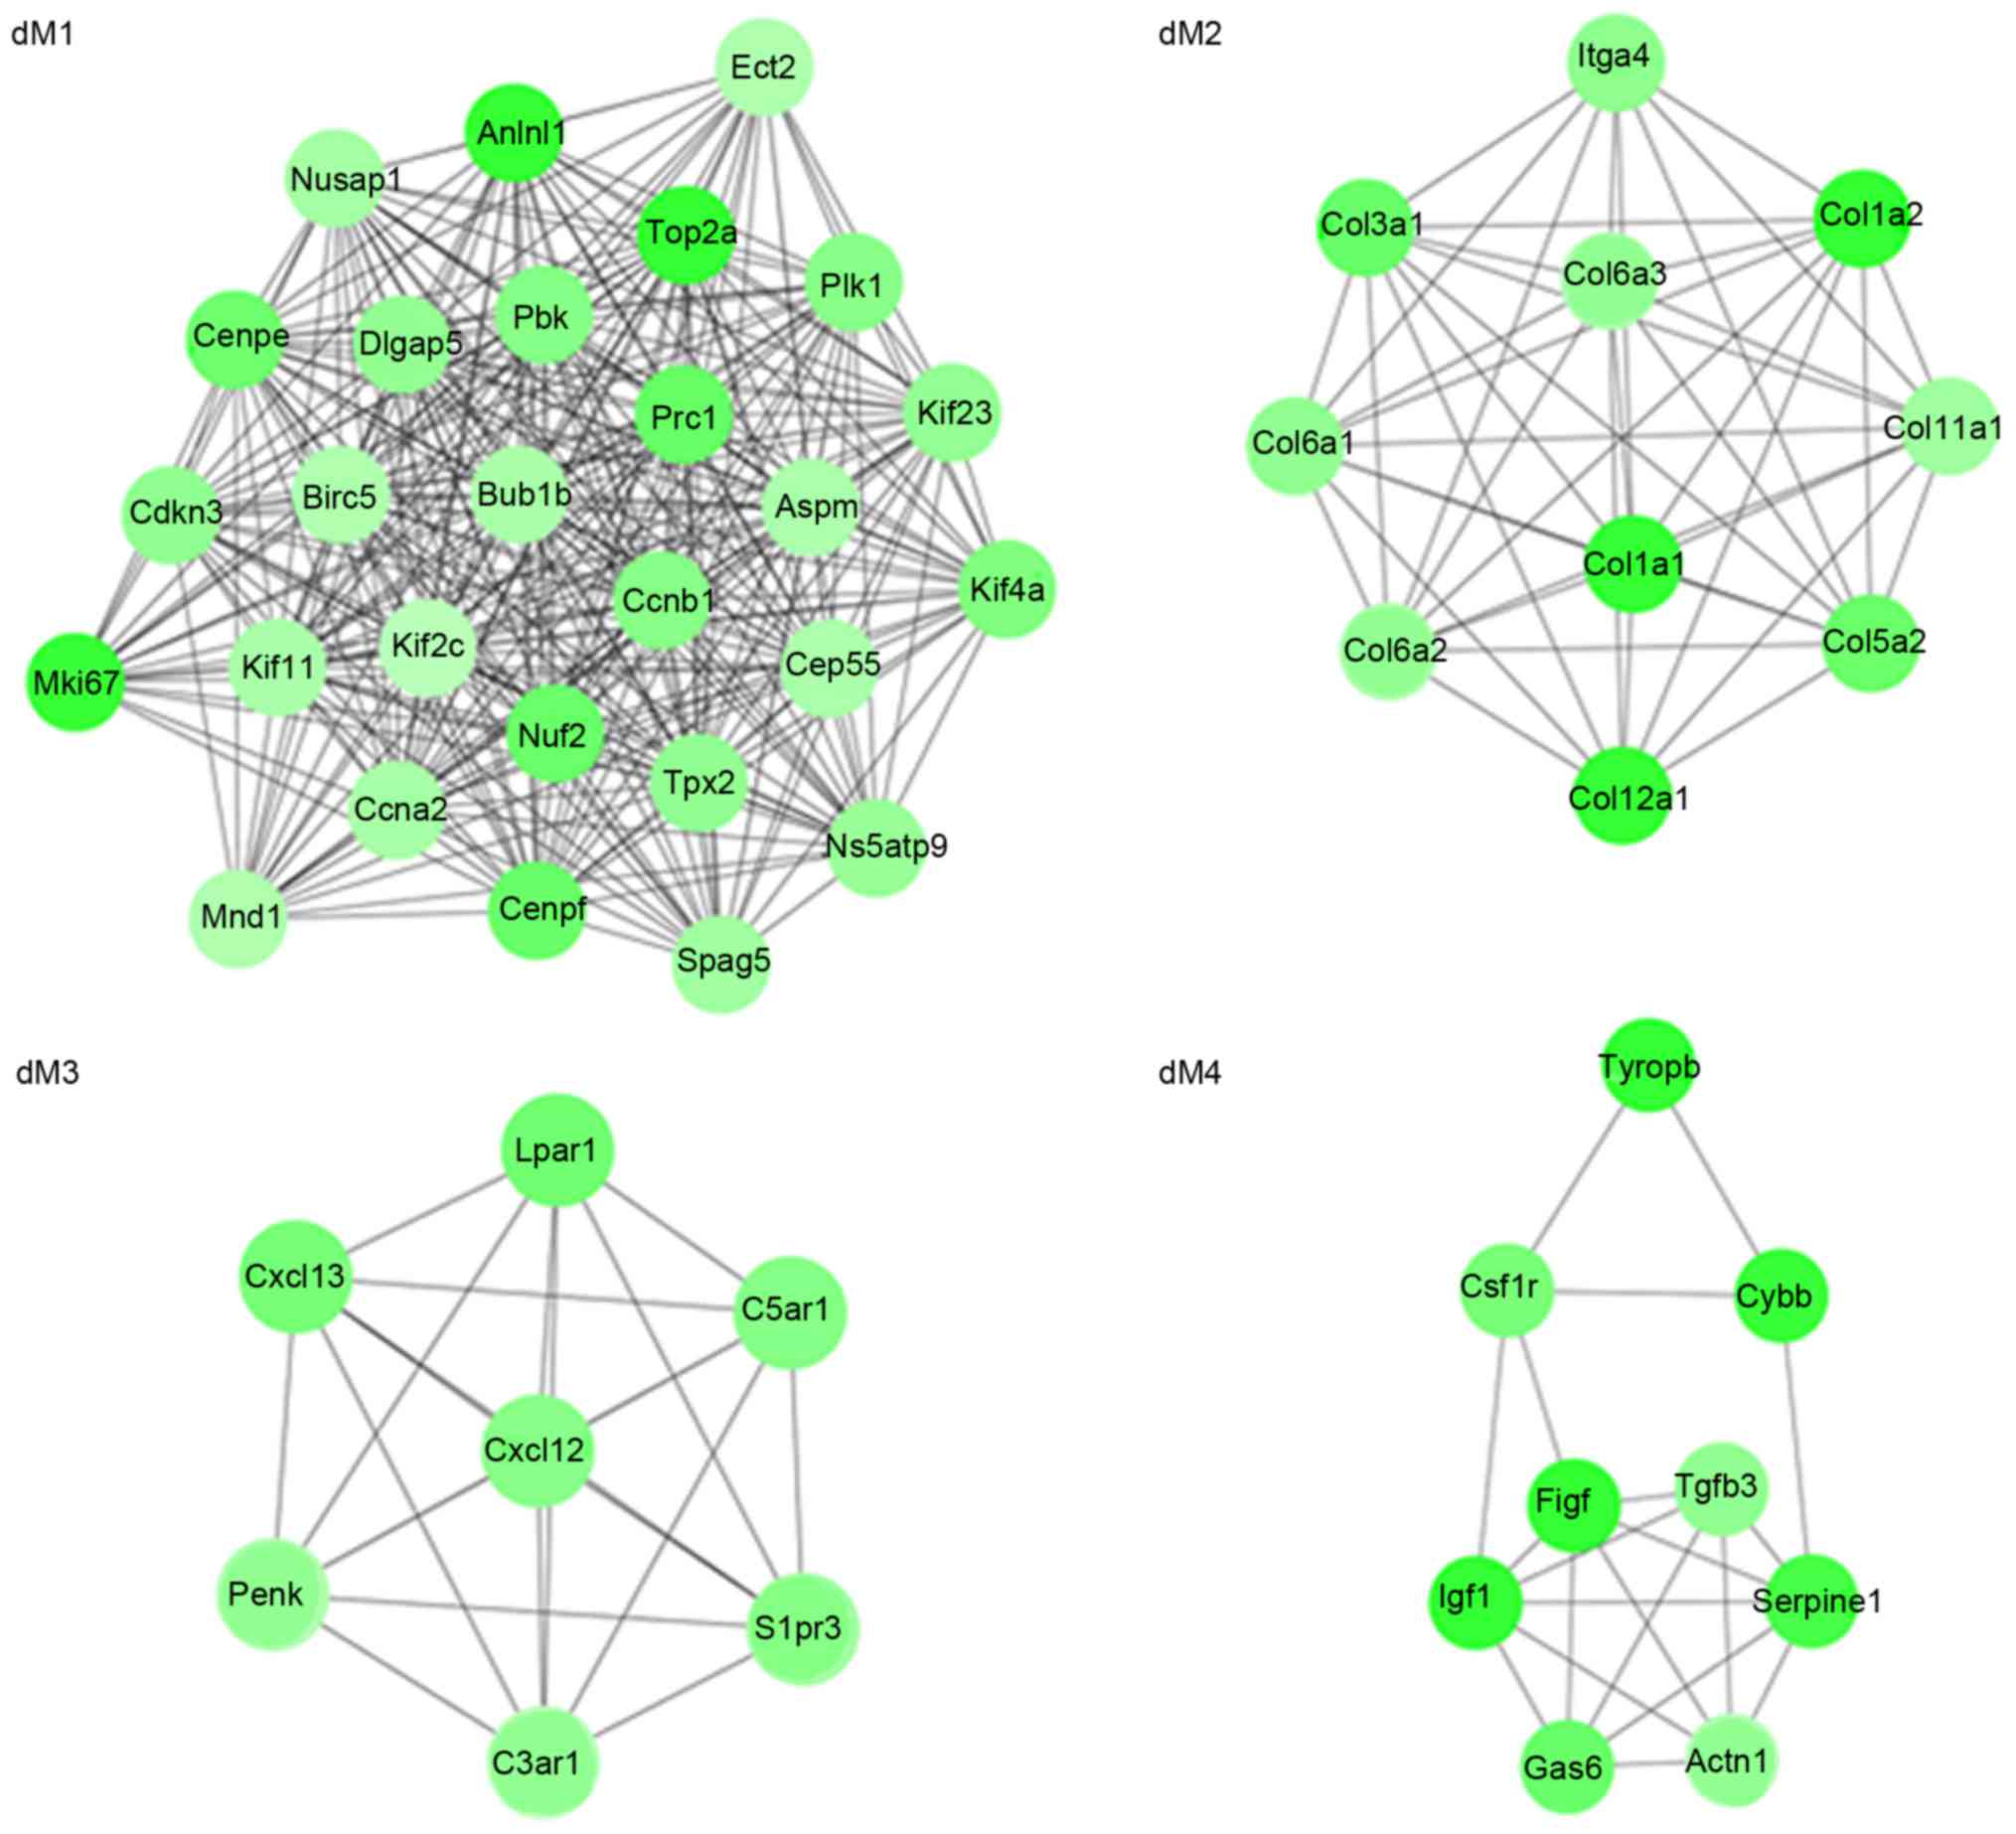
(Fig. 3). Meanwhile, four modules
(dM1, dM2, dM3 and dM4) were identified from the PPI network for
the downregulated genes (Fig. 4).
It is of note that collagen, type I, α1 (COL1A1), COL1A2, COL3A1,
COL5A2, COL6A1, COL6A2, COL6A3, COL11A1, COL12A1 and integrin α4
(ITGA4) may interact with each other in the dM2 module.
The top 5 functions enriched for the upregulated
genes in modules included taxis (µM1; P=1.03×10⁻⁸),
response to organic substance (µM2; P=1.21×10⁻⁴),
response to cytokine stimulus (µM3; P=5.04×10⁻⁴) and
chemical homeostasis (µM4, P=1.22×10⁻³; Table IIIA). The pathways enriched for
the upregulated genes in modules included the chemokine signaling
pathway (µM1; P=1.10×10⁻⁴) and the Jak-STAT signaling
pathway (µM2; P=7.69 ×10⁻⁴; Table IIIB). Additionally, the top 5
functions enriched for the downregulated genes in modules, included
M phase (dM1; P=2.70×10⁻¹⁶), extracellular matrix
organization (dM2; P=1.79×10⁻⁷, including COL3A1,
COL1A2, COL1A1, COL11A1 and COL5A2),
G-protein coupled receptor protein signaling pathway (dM3;
P=7.27×10⁻⁴) and wound healing (dM4; P=1.56
×10−4; Table IVA). The
pathways enriched for the downregulated genes in modules included
cell cycle (dM1; P=4.40×10⁻⁵), ECM-receptor interaction
(dM2; P=1.37×10⁻¹⁵, including COL3A1,
COL6A3, COL1A2, COL6A2, COL6A1,
ITGA4, COL1A1, COL11A1 and COL5A2) and
neuroactive ligand-receptor interaction (dM3;
P=9.49×10⁻⁴; Table
IVB).
| Table III.Top 5 functions and pathways enriched
for the upregulated genes in µM1, µM2, µM3 and µM4 modules. |
Table III.
Top 5 functions and pathways enriched
for the upregulated genes in µM1, µM2, µM3 and µM4 modules.
| A, Top 5 functions
enriched for the upregulated genes in µM1, µM2, µM3 and µM4
modules |
|
| Module | ID | Description | P-value | Number of
genes | Gene |
|---|
| µM1 | GO:0042330 | Taxis |
1.03×10⁻⁸ | 5 | CXCL1, CCL20,
CXCL16, CXCL3, CXCL2 |
|
| GO:0006935 | Chemotaxis |
1.03×10⁻⁸ | 5 | CXCL1, CCL20,
CXCL16, CXCL3, CXCL2 |
|
| GO:0006952 | Defense
response |
3.82×10⁻⁸ | 6 | KNG1, CXCL1,
CCL20, CXCL16, CXCL3, CXCL2 |
|
| GO:0007626 | Locomotory
behavior |
4.20×10⁻⁷ | 5 | CXCL1, CCL20,
CXCL16, CXCL3, CXCL2 |
|
| GO:0006954 | Inflammatory
response |
4.97×10⁻⁷ | 5 | KNG1, CXCL1,
CCL20, CXCL3, CXCL2 |
| µM2 | GO:0010033 | Response to organic
substance |
1.21×10⁻⁴ | 6 | IL6, OSMR,
IL6ST, HMOX1, PTPN1, PIK3R3 |
|
| GO:0042127 | Regulation of cell
proliferation |
5.31×10⁻⁴ | 5 | IL6, OSMR,
IL6ST, HMOX1, SOD2 |
|
| GO:0010035 | Response to
inorganic substance |
5.55×10⁻⁴ | 4 | IL6, HMOX1,
NFKB1, SOD2 |
|
| GO:0007167 | Enzyme-linked
receptor protein signaling pathway |
6.31×10⁻⁴ | 4 | IL6ST, MET,
PTPN1, PIK3R3 |
|
| GO:0031667 | Response to
nutrient levels |
6.44×10⁻⁴ | 4 | IL6, IL6ST,
HMOX1, SOD2 |
| µM3 | GO:0034097 | Response to
cytokine stimulus |
5.04×10⁻⁴ | 3 | FOSL2, MMP3,
TIMP1 |
|
| GO:0009719 | Response to
endogenous stimulus |
1.26×10⁻² | 3 | FOSL2, MMP3,
TIMP1 |
|
| GO:0006508 | Proteolysis |
2.26×10⁻² | 3 | ADAMTS1, MMP3,
ADAMTS4 |
|
| GO:0010033 | Response to organic
substance |
3.18×10⁻² | 3 | FOSL2, MMP3,
TIMP1 |
|
| GO:0007568 | Aging |
4.87×10⁻² | 2 | FOSL2,
TIMP1 |
| µM4 | GO:0048878 | Chemical
homeostasis |
1.22×10⁻³ | 4 | SLC11A2, SGK1,
HIF1A, EPAS1 |
|
| GO:0043619 | Regulation of
transcription from RNA polymerase II promoter in response to
oxidative stress |
2.48×10⁻³ | 2 | HIF1A,
EPAS1 |
|
| GO:0043618 | Regulation of
transcription from RNA polymerase II promoter in response to
stress |
2.97×10⁻³ | 2 | HIF1A,
EPAS1 |
|
| GO:0043620 | Regulation of
transcription in response to stress |
2.97×10⁻³ | 2 | HIF1A,
EPAS1 |
|
| GO:0042592 | Homeostatic
process |
3.58×10⁻³ | 4 | SLC11A2, SGK1,
HIF1A, EPAS1 |
|
| B, Pathways
enriched for the upregulated genes in µM1 and µM2 modules |
|
| Module | ID | Description | P-value | Number of
genes | Gene |
|
| µM1 | rno04062 | Chemokine signaling
pathway |
1.10×10⁻⁴ | 4 | CXCL1, CCL20,
CXCL16, CXCL2 |
|
| rno04621 | NOD-like receptor
signaling pathway |
4.36×10⁻² | 2 | CXCL1,
CXCL2 |
| µM2 | rno04630 | Jak-STAT signaling
pathway |
7.69×10⁻⁴ | 4 | IL6, OSMR,
IL6ST, PIK3R3 |
| µM2 | rno04060 | Cytokine-cytokine
receptor interaction |
2.12×10⁻³ | 4 | IL6, OSMR,
IL6ST, MET |
|
| rno04620 | Toll-like receptor
signaling pathway |
6.74×10⁻³ | 3 | IL6, NFKB1,
PIK3R3 |
|
| rno05200 | Pathways in
cancer |
8.17×10⁻³ | 4 | IL6, MET, NFKB1,
PIK3R3 |
| Table IV.Top 5 functions and pathways enriched
for the downregulated genes in dM1, dM2, dM3 and dM4 modules. |
Table IV.
Top 5 functions and pathways enriched
for the downregulated genes in dM1, dM2, dM3 and dM4 modules.
| A, Top 5 functions
enriched for the downregulated genes |
|---|
|
|---|
| Module | ID | Description | P-value | Number of
genes | Gene |
|---|
| dM1 | GO:0000279 | M phase |
2.70×10⁻¹⁶ | 12 | CCNB1, KIF2C,
KIF11, MKI67, PLK1, DLGAP5, NUF2, NUSAP1, BUB1B, CENPF, BIRC5,
CEP55 |
|
| GO:0007049 | Cell cycle |
6.52×10⁻¹⁵ | 14 | KIF11, MKI67,
DLGAP5, NUF2, NUSAP1, CENPF, BIRC5, CEP55, CDKN3, CCNB1, KIF2C,
PLK1, BUB1B, CCNA2 |
|
| GO:0022403 | Cell cycle
phase |
7.11×10⁻¹⁵ | 12 | CCNB1, KIF2C,
KIF11, MKI67, PLK1, DLGAP5, NUF2, NUSAP1, BUB1B, CENPF, BIRC5,
CEP55 |
|
| GO:0022402 | Cell cycle
process |
1.48×10⁻¹⁴ | 13 | KIF11, MKI67,
DLGAP5, NUF2, NUSAP1, CENPF, BIRC5, CEP55, CDKN3, CCNB1, KIF2C,
PLK1, BUB1B |
|
| GO:0000087 | M phase of mitotic
cell cycle |
1.70×10⁻¹⁴ | 10 | CCNB1, KIF11,
PLK1, DLGAP5, NUF2, NUSAP1, BUB1B, CENPF, BIRC5, CEP55 |
| dM2 | GO:0030199 | Collagen fibril
organization |
5.72×10⁻¹⁰ | 5 | COL3A1, COL1A2,
COL1A1, COL11A1, COL5A2 |
|
| GO:0030198 | Extracellular
matrix organization |
1.79×10⁻⁷ | 5 | COL3A1, COL1A2,
COL1A1, COL11A1, COL5A2 |
|
| GO:0043588 | Skin
development |
6.89×10⁻⁷ | 4 | COL3A1, COL1A2,
COL1A1, COL5A2 |
|
| GO:0043062 | Extracellular
structure organization |
1.10×10⁻⁶ | 5 | COL3A1, COL1A2,
COL1A1, COL11A1, COL5A2 |
|
| GO:0001501 | Skeletal system
development |
1.45×10⁻⁵ | 5 | COL3A1, COL1A2,
COL1A1, COL11A1, COL5A2 |
| dM3 | GO:0007186 | G-protein coupled
receptor protein signaling pathway |
7.27×10⁻⁴ | 6 | S1PR3, C3AR1,
C5AR1, PENK, LPAR1, CXCL12 |
|
| GO:0007610 | Behavior |
7.91×10⁻⁴ | 4 | C3AR1, C5AR1,
PENK, CXCL12 |
|
| GO:0002430 | Complement receptor
mediated signaling pathway |
9.92×10⁻⁴ | 2 | C3AR1,
C5AR1 |
|
| GO:0007204 | Elevation of
cytosolic calciumion concentration |
1.03×10⁻³ | 3 | C3AR1, C5AR1,
LPAR1 |
|
| GO:0051480 | Cytosolic calcium
ion homeostasis |
1.29×10⁻³ | 3 | C3AR1, C5AR1,
LPAR1 |
| dM4 | GO:0042060 | Wound healing |
1.56×10⁻⁴ | 4 | SERPINE1, TGFB3,
IGF1, GAS6 |
|
| GO:0040007 | Growth |
2.91×10⁻⁴ | 4 | SERPINE1, TGFB3,
IGF1, GAS6 |
|
| GO:0042246 | Tissue
regeneration |
3.74×10⁻⁴ | 3 | SERPINE1, IGF1,
GAS6 |
|
| GO:0007167 | enzyme linked
receptor protein signaling pathway |
6.31×10⁻⁴ | 4 | TGFB3, IGF1,
FIGF, CSF1R |
|
| GO:0051094 | Positive regulation
of developmental process |
8.57×10⁻⁴ | 4 | TGFB3, IGF1,
FIGF, CSF1R |
| dM1 | rno04110 | Cell cycle | 4.40×10⁻⁵ | 4 | CCNB1, PLK1, BUB1B,
CCNA2 |
|
| rno04914 |
Progesterone-mediated oocyte
maturation | 1.41×10⁻³ | 3 | CCNB1, PLK1,
CCNA2 |
|
| B, Pathways
enriched for the downregulated genes |
|---|
|
| Module | ID | Description | P-value | Number of
genes | Gene |
|
| dM2 | rno04512 | ECM-receptor
interaction |
1.37×10⁻¹⁵ | 9 | COL3A1, COL6A3,
COL1A2, COL6A2, COL6A1, ITGA4, COL1A1, COL11A1, COL5A2 |
|
| rno04510 | Focal adhesion |
1.91×10⁻¹² | 9 | COL3A1, COL6A3,
COL1A2, COL6A2, COL6A1, ITGA4, COL1A1, COL11A1, COL5A2 |
| dM3 | rno04080 | Neuroactive
ligand-receptor interaction |
9.49×10⁻⁴ | 4 | S1PR3, C3AR1,
C5AR1, LPAR1 |
| dM4 | rno05200 | Pathways in
cancer |
5.33×10⁻³ | 4 | TGFB3, IGF1,
FIGF, CSF1R |
|
| rno04510 | Focal adhesion |
2.26×10⁻² | 3 | IGF1, ACTN1,
FIGF |
Discussion
The present study identified a total of 558 DEGs in
degenerated nucleus pulposus cells compared with normal nucleus
pulposus cells, including 253 upregulated and 305 downregulated
genes. Using the MCODE plug-in in Cytoscape, four modules (µM1,
µ0M2, µM3 and µM4) were identified from the PPI network for the
upregulated genes. Additionally, four modules (dM1, dM2, dM3 and
dM4) were identified from the PPI network for the downregulated
genes.
A previous study demonstrated that genetic
variations of IL-6 may be associated with IVD degeneration,
accompanied by sciatica (24).
VEGFA was overexpressed in the nucleus pulposus and affects
the survival of nucleus pulposus cells in an autocrine/paracrine
manner (25). Injuries of IVDs may
lead to increased VEGF levels, indicating that VEGF may be
associated with discogenic back pain (26). Under co-culture conditions, VEGF
induction may contribute to neo-vascularization of IVD tissue and
may function in the resorption of herniated discs (27). The findings of the present study
indicated that IL-6 (degree=39) in the PPI network for the
upregulated genes and VEGFA (degree=37) in the PPI network for the
downregulated genes had higher degrees. Therefore, IL6 and
VEGFA may be key genes involved in IVD degeneration. A
previous study observed the immunolocalization of THBS in human IVD
(28). THBS1 and
THBS2 are promising susceptibility genes in lumbar-disc
herniation (LDH) that mediate the expression levels of matrix
metalloproteinases (MMPs) 2 and 9, which are critical effectors of
ECM remodeling (29). Mice with
THBS1 or THBS2 deficiency exhibit abnormal spine
curvature (30). Pathway
enrichment performed in the present study revealed that
downregulated THBS1 was enriched in ECM-receptor
interactions, suggesting that THBS1 may have an important
role in IVD degeneration.
The sequence variation of the regulatory region of
COL1A1 is closely associated with lumbar disc disease (LDD)
in young military recruits who are newly diagnosed (31). Ribosomal protein L8, ribosomal
protein S16 and ribosomal protein S23 have been identified to
contribute to protein synthesis, and COL3A1 was involved in
skeletal system processes in disc degeneration (DD), indicating
that they may be used for diagnosis and therapy of DD (32). Polymorphisms of the COL9 and
COL11 genes contribute to the progression of degenerative
lumbar spinal stenosis (33).
COL11A1 expression level was reduced in the IVD of patients
with LDH and it had a negative association with the severity of
disc degeneration in patients with LDH (34). In the dM2 module identified by the
present study, COL1A1, COL1A2, COL3A1, COL5A2, COL6A1, COL6A2,
COL6A3, COL11A1, COL12A1 and ITGA4 may interact with each other.
Functional enrichment indicated that collagen genes were enriched
in ECM organization. Therefore, collagen genes may contribute to
the progression of IVD degeneration. Additionally, ITGA4 may
also be implicated in IVD degeneration via interaction with
collagen genes.
In conclusion, the present study investigated the
underlying mechanisms of IVD degeneration via bioinformatics
analysis. A total 558 DEGs were screened in the degenerated nucleus
pulposus cells. IL6, VEGFA, THBS1,
ITGA4 and collagen genes may be involved in the progression
of IVD degeneration. These results suggested that the manipulation
of these genes and their products may have potential as a novel
therapeutic strategy for the treatment of patients with IVD.
However, these findings were obtained by bioinformatics prediction
and require further confirmation via further experimental
studies.
Acknowledgements
The present study was supported by the Shandong
Province Pharmaceutical Technology Development Program (grant no.
2015-261), the Projects of Medical and Health Technology
Development Program in Shandong Province, China (grant no.
2014WS0502), the Taishan Medical University Cultivate High-level
Task Projects (grant no. 2014GCC02) and the Projects of Health
Science and Technology Association in Shandong Province, China
(grant no. 2016BJ0009).
References
|
1
|
Sakai D, Mochida J, Yamamoto Y, Nomura T,
Okuma M, Nishimura K, Nakai T, Ando K and Hotta T: Transplantation
of mesenchymal stem cells embedded in Atelocollagen gel to the
intervertebral disc: A potential therapeutic model for disc
degeneratio. Biomaterials. 24:3531–3541. 2003. View Article : Google Scholar : PubMed/NCBI
|
|
2
|
Le Maitre CL, Pockert A, Buttle DJ,
Freemont AJ and Hoyland JA: Matrix synthesis and degradation in
human intervertebral disc degeneration. Biochem Soc Trans.
35:652–655. 2007. View Article : Google Scholar : PubMed/NCBI
|
|
3
|
Richardson SM, Walker RV, Parker S, Rhodes
NP, Hunt JA, Freemont AJ and Hoyland JA: Intervertebral disc
cell-mediated mesenchymal stem cell differentiation. Stem Cells.
24:707–716. 2006. View Article : Google Scholar : PubMed/NCBI
|
|
4
|
Battié MC, Videman T and Parent E: Lumbar
disc degeneration: Epidemiology and genetic influences. Spine.
29:2679–2690. 2004. View Article : Google Scholar : PubMed/NCBI
|
|
5
|
Sakai D, Mochida J, Iwashina T, Hiyama A,
Omi H, Imai M, Nakai T, Ando K and Hotta T: Regenerative effects of
transplanting mesenchymal stem cells embedded in atelocollagen to
the degenerated intervertebral disc. Biomaterials. 27:335–345.
2006. View Article : Google Scholar : PubMed/NCBI
|
|
6
|
Pockert AJ, Richardson SM, Le Maitre CL,
Lyon M, Deakin JA, Buttle DJ, Freemont AJ and Hoyland JA: Modified
expression of the ADAMTS enzymes and tissue inhibitor of
metalloproteinases 3 during human intervertebral disc degeneration.
Arthritis Rheum. 60:482–491. 2009. View Article : Google Scholar : PubMed/NCBI
|
|
7
|
Gruber HE, Norton HJ, Ingram JA and Hanley
EN Jr: The SOX9 transcription factor in the human disc: Decreased
immunolocalization with age and disc degeneration. Spine (Phila Pa
1976). 30:625–630. 2005. View Article : Google Scholar : PubMed/NCBI
|
|
8
|
Ponnappan RK, Markova DZ, Antonio PJ,
Murray HB, Vaccaro AR, Shapiro IM, Anderson DG, Albert TJ and
Risbud MV: An organ culture system to model early degenerative
changes of the intervertebral disc. Arthritis Res Ther.
13:R1712011. View
Article : Google Scholar : PubMed/NCBI
|
|
9
|
Weiler C, Nerlich AG, Bachmeier BE and
Boos N: Expression and distribution of tumor necrosis factor alpha
in human lumbar intervertebral discs: A study in surgical specimen
and autopsy controls. Spine (Phila Pa 1976). 30:44–54. 2005.
View Article : Google Scholar : PubMed/NCBI
|
|
10
|
Bachmeier BE, Nerlich AG, Weiler C,
Paesold G, Jochum M and Boos N: Analysis of tissue distribution of
TNF-alpha, TNF-alpha-receptors and the activating
TNF-alpha-converting enzyme suggests activation of the TNF-alpha
system in the aging intervertebral disc. Ann N Y Acad Sci.
1096:44–54. 2007. View Article : Google Scholar : PubMed/NCBI
|
|
11
|
Le Maitre CL, Freemont AJ and Hoyland JA:
The role of interleukin-1 in the pathogenesis of human
intervertebral disc degeneration. Arthritis Res Ther. 7:R732–R745.
2005. View
Article : Google Scholar : PubMed/NCBI
|
|
12
|
Hoyland J, Le Maitre C and Freemont A:
Investigation of the role of IL-1 and TNF in matrix degradation in
the intervertebral disc. Rheumatology (Oxford). 47:809–814. 2008.
View Article : Google Scholar : PubMed/NCBI
|
|
13
|
Le Maitre CL, Hoyland JA and Freemont AJ:
Catabolic cytokine expression in degenerate and herniated human
intervertebral discs: IL-1beta and TNFalpha expression profile.
Arthritis Res Ther. 9:R772007. View
Article : Google Scholar : PubMed/NCBI
|
|
14
|
Markova DZ, Kepler CK, Addya S, Murray HB,
Vaccaro AR, Shapiro IM, Anderson DG, Albert TJ and Risbud MV: An
organ culture system to model early degenerative changes of the
intervertebral disc II: Profiling global gene expression changes.
Arthritis Res Ther. 15:R1212013. View
Article : Google Scholar : PubMed/NCBI
|
|
15
|
Gautier L, Cope L, Bolstad BM and Irizarry
RA: affy-analysis of Affymetrix GeneChip data at the probe level.
Bioinformatics. 20:307–315. 2004. View Article : Google Scholar : PubMed/NCBI
|
|
16
|
Smyth GK: Limma: Linear Models for
Microarray Data. Bioinformatics and Computational Biology Solutions
Using R and Bioconductor Springer. 397–420. 2005. View Article : Google Scholar
|
|
17
|
Benjamini Y and Hochberg Y: Controlling
the false discovery rate: A practical and powerful approach to
multiple testing. J Royal Statistical Soci. 57:289–300. 1995.
|
|
18
|
Huang DW, Sherman BT, Tan Q, Kir J, Liu D,
Bryant D, Guo Y, Stephens R, Baseler MW, Lane HC and Lempicki RA:
DAVID bioinformatics resources: Expanded annotation database and
novel algorithms to better extract biology from large gene lists.
Nucleic Acids Res. 35:W169–W175. 2007. View Article : Google Scholar : PubMed/NCBI
|
|
19
|
Carbon S, Ireland A, Mungall CJ, Shu S,
Marshall B and Lewis S: AmiGO Hub; Web Presence Working Group:
AmiGO: Online access to ontology and annotation data.
Bioinformatics. 25:288–289. 2009. View Article : Google Scholar : PubMed/NCBI
|
|
20
|
Kanehisa M, Araki M, Goto S, Hattori M,
Hirakawa M, Itoh M, Katayama T, Kawashima S, Okuda S, Tokimatsu T
and Yamanishi Y: KEGG for linking genomes to life and the
environment. Nucleic Acids Res. 36:(Database issue). D480–D484.
2008. View Article : Google Scholar : PubMed/NCBI
|
|
21
|
Szklarczyk D, Franceschini A, Kuhn M,
Simonovic M, Roth A, Minguez P, Doerks T, Stark M, Muller J, Bork
P, et al: The STRING database in 2011: Functional interaction
networks of proteins, globally integrated and scored. Nucleic Acids
Res. 39:(Database issue). D561–D568. 2011. View Article : Google Scholar : PubMed/NCBI
|
|
22
|
Shannon P, Markiel A, Ozier O, Baliga NS,
Wang JT, Ramage D, Amin N, Schwikowski B and Ideker T: Cytoscape: A
software environment for integrated models of biomolecular
interaction networks. Genome Res. 13:2498–2504. 2003. View Article : Google Scholar : PubMed/NCBI
|
|
23
|
Bader GD and Hogue CW: An automated method
for finding molecular complexes in large protein interaction
networks. BMC bioinformatics. 4:22003. View Article : Google Scholar : PubMed/NCBI
|
|
24
|
Noponen-Hietala N, Virtanen I, Karttunen
R, Schwenke S, Jakkula E, Li H, Merikivi R, Barral S, Ott J,
Karppinen J and Ala-Kokko L: Genetic variations in IL6 associate
with intervertebral disc disease characterized by sciatica. Pain.
114:186–194. 2005. View Article : Google Scholar : PubMed/NCBI
|
|
25
|
Fujita N, Imai J, Suzuki T, Yamada M,
Ninomiya K, Miyamoto K, Iwasaki R, Morioka H, Matsumoto M, Chiba K,
et al: Vascular endothelial growth factor-A is a survival factor
for nucleus pulposus cells in the intervertebral disc. Biochem
Biophys Res Commun. 372:367–372. 2008. View Article : Google Scholar : PubMed/NCBI
|
|
26
|
Sato J, Sakuma Y, Yamauchi K, Orita S,
Kubota G, Oikawa Y, Inage K, Sainoh T, Fujimoto K, Takahashi K, et
al: Elevated VEGF in degenerative intervertebral discs in rats with
injured intervertebral discs of the caudal vertebrae. Global Spine
J. 4:po. 165. 2014. View Article : Google Scholar
|
|
27
|
Haro H, Kato T, Komori H, Osada M and
Shinomiya K: Vascular endothelial growth factor (VEGF)-induced
angiogenesis in herniated disc resorption. J Orthop Res.
20:409–415. 2002. View Article : Google Scholar : PubMed/NCBI
|
|
28
|
Gruber HE, Ingram JA and Hanley EN Jr:
Immunolocalization of thrombospondin in the human and sand rat
intervertebral disc. Spine (Phila Pa 1976). 31:2556–2561. 2006.
View Article : Google Scholar : PubMed/NCBI
|
|
29
|
Hirose Y, Chiba K, Karasugi T, Nakajima M,
Kawaguchi Y, Mikami Y, Furuichi T, Mio F, Miyake A, Miyamoto T, et
al: A functional polymorphism in THBS2 that affects alternative
splicing and MMP binding is associated with lumbar-disc herniation.
Am J Med Genet. 82:1122–1129. 2008.
|
|
30
|
Lawler J, Sunday M, Thibert V, Duquette M,
George EL, Rayburn H and Hynes RO: Thrombospondin-1 is required for
normal murine pulmonary homeostasis and its absence causes
pneumonia. J Clin Invest. 101:982–992. 1998. View Article : Google Scholar : PubMed/NCBI
|
|
31
|
Tilkeridis C, Bei T, Garantziotis S and
Stratakis CA: Association of a COL1A1 polymorphism with lumbar disc
disease in young military recruits. J Med Genet. 42:e442005.
View Article : Google Scholar : PubMed/NCBI
|
|
32
|
Yang Z, Chen X, Zhang Q, Cai B, Chen K,
Chen Z, Bai Y, Shi Z and Li M: Dysregulated COL3A1 and RPL8, RPS16,
and RPS23 in disc degeneration revealed by bioinformatics methods.
Spine (Phila Pa 1976). 40:E745–E751. 2015. View Article : Google Scholar : PubMed/NCBI
|
|
33
|
Noponen-Hietala N, Kyllönen E, Männikkö M,
Ilkko E, Karppinen J, Ott J and Ala-Kokko L: Sequence variations in
the collagen IX and XI genes are associated with degenerative
lumbar spinal stenosis. Ann Rheum Dis. 62:1208–1214. 2003.
View Article : Google Scholar : PubMed/NCBI
|
|
34
|
Mio F, Chiba K, Hirose Y, Kawaguchi Y,
Mikami Y, Oya T, Mori M, Kamata M, Matsumoto M, Ozaki K, et al: A
functional polymorphism in COL11A1, which encodes the alpha 1 chain
of type XI collagen, is associated with susceptibility to lumbar
disc herniation. Am J Med Genet. 81:1271–1277. 2007.
|