Introduction
Non-alcoholic fatty liver disease (NAFLD) is
characterized by excessive fat accumulation in the liver of
patients without a history of alcohol abuse. NAFLD is classified
into simple steatosis and non-alcoholic steatohepatitis (NASH). In
patients with NASH, in addition to steatosis, additional
intralobular inflammation and hepatocellular ballooning are
observed, frequently with progressive fibrosis (1). Over time, NASH may progress to liver
cirrhosis and hepatocellular carcinoma (2–4). It
is recognized that the increased prevalence of obesity and
metabolic syndrome is paralleled by an increase in NAFLD (5,6), as
up to 80% of obese subjects suffer from NAFLD (7). Worldwide, approximately 20% of all
adults have NAFLD and 2–3% suffer from NASH (8).
ADAMTS13 (a disintegrin and metalloproteinase with
thrombospondin type-1 motif, member 13) is a proteinase that
specifically cleaves multimeric von Willebrand factor (VWF),
thereby preventing accumulation of ultralarge VWF multimers and
subsequent platelet clumping and formation of microthrombi that
disturb the microcirculation and impair oxygen supply to organs
(9). ADAMTS13 is predominantly
produced by stellate cells in the liver (10), of which proliferation contributes
to steatohepatitis and fibrosis. This is compatible with enhanced
ADAMTS13 antigen and activity levels observed in rats suffering
from diet-induced steatosis and fibrosis (11). Several previous studies have,
however, reported conflicting data on a potential functional role
of ADAMTS13 in the pathogenesis of liver diseases [reviewed in
(12)]. A beneficial effect of
ADAMTS13 activity was observed on liver disease severity, and
increased ADAMTS13 activity was associated with an improved
prognosis of liver cirrhosis (13), alcoholic hepatitis (14) and hepatic veno-occlusive disease
(15). In contrast, a detrimental
effect of ADAMTS13 was reported on hepatocellular carcinoma risk in
patients suffering from chronic liver disease (16). Thus, it remains unclear whether
NASH is associated with increased or decreased levels of ADAMTS13,
nor whether ADAMTS13 serves a functional role in its development.
In order to resolve these apparent contradictions, we have
subjected wild-type and Adamts13 deficient mice to a
steatosis-inducing diet.
Materials and methods
Animal model
Male (n=2) and female (n=2) heterozygous
Adamts13+/− mice were provided by Professor David
Ginsburg (Howard Hughes Medical Institute, University of Michigan,
Ann Arbor, MI, USA) and were crossed to generate Adamts13
deficient (Adamts13−/−) and wild-type (WT)
littermates (genetic background, C57Bl6/Jx129X1/SvxCASA/RK). Male
Adamts13−/− (n=20) and WT (n=10) mice were used
and genotyped as previously described (17,18).
The mice were kept from the age of 5 weeks in individual
micro-isolation cages on a 12 h day/night cycle and fed for 4 weeks
with a lipogenic diet devoid of methionine and choline (MCD;
#02960034; MP Biomedicals, Illkirch Cedex, France) or the MCD diet
supplemented with 3 g/kg DL-methionine and 2 g/kg choline chloride
(control diet; MCC; #02960414; MP Biomedicals) (n=10 or 5 for
Adamts13−/− or WT mice on each diet,
respectively). The starting weight of the mice was 26.4±0.8 g or
27.0±1.0 g for WT mice on MCD or MCC diets, respectively, and
26.0±0.5 g or 25.4±0.7 g for Adamts13−/− mice on
MCD or MCC diets, respectively. Water was available ad
libitum, room temperature and relative humidity were 23°C and
26%, respectively. Body weight and food intake were measured at
weekly intervals. At the end of the diet, following fasting for 6
h, blood was taken from the tail of unanesthetized mice for
determination of blood glucose concentrations using the Accu-chek
Performa meter and blood glucose test strips (Roche Diagnostics,
Basel, Switzerland). At the end of the experiment, the mice were
sedated with 60 mg/kg pentobarbital (Nembutal; Ceva Santé Animale,
Libourne, France) and blood was taken from the retro-orbital sinus
on trisodium citrate (0.01 M), prior to sacrifice by cervical
dislocation. Platelets were counted (Cell Dyn 3200R; Abbott
Diagnostics, Illinois, USA). Livers, subcutaneous (SC) and gonadal
(GN) adipose tissues were removed and weighed. Portions were used
for RNA or protein extraction or were fixed in 4% formaldehyde for
histological analysis.
All animal experiments were approved by the
University of Leuven Ethical Committee (P158-2011) and performed in
accordance with the National Institutes of Health Guide for the
Care and Use of Laboratory Animals (19) and the EU Directive 2010/63/EU for
animal experiments.
Metabolic and inflammatory
parameters
Total, high density lipoprotein (HDL) and low
density lipoprotein (LDL) cholesterol, triglycerides, alkaline
phosphatases, alanine aminotransferase (ALT) and aspartate
aminotransaminase (AST) levels in plasma were evaluated using
routine clinical assays. Insulin levels in plasma were determined
by ELISA (Ultrasensitive Mouse Insulin ELISA 10-1249-01; Mercodia
AB, Uppsala, Sweden). The homeostasis model assessment of insulin
resistance (HOMA-IR) was determined using the formula: [Fasting
plasma insulin (ng/ml)x fasting blood glucose (mg/dl)]/405. Liver
tissue extracts were prepared by adding alcoholic KOH (30%) to a
sample of 30 mg. Samples were incubated overnight at 55°C to digest
the tissue, and 1 M MgCl2 was added to the digested
sample (1:1 vol/vol), mixed well, incubated on ice for 10 min and
centrifuged for 30 min at 13,523 × g and room temperature. The
supernatant was analyzed using the Triglycerides FS* kit (DiaSys
Diagnostic Systems GmbH, Holzheim, Germany).
Histological and microscopic
analysis
Liver samples were fixed in 4% buffered formaldehyde
and embedded in paraffin. Sections (4 µm) were stained with
hematoxylin-eosin (H&E) or Picrosirius Red to assess steatosis
or fibrosis, respectively. All liver biopsies were analyzed by an
expert liver pathologist, blinded to the genotype and diet.
Steatosis and fibrosis were diagnosed and semiquantitatively scored
according to the NASH-Clinical Research Network criteria (20,21).
Hepatocyte ballooning was classified as 0 (none), 1 (few) or 2
(numerous cells/prominent ballooning). Foci of lobular inflammation
were scored as 0 (no foci), 1 (<2 foci per ×200 field), 2 (2–4
foci per ×200 field) and 3 (>4 foci per ×200 field). Fibrosis
was scored as stage F0 (no fibrosis), stage F1a (mild, zone 3,
perisinusoidal fibrosis), stage F1b (moderate, zone 3,
perisinusoidal fibrosis), stage F1c (portal/periportal fibrosis),
stage F2 (perisinusoidal and portal/periportal fibrosis), stage F3
(bridging fibrosis) and stage F4 (cirrhosis). Severity of the
disease was assessed using the NAFLD activity score (NAS) as the
unweighted sum of scores of steatosis, hepatocyte ballooning and
lobular inflammation (22).
Percentage of fibrosis was quantitated by morphometry from
digitalized Picrosirius Red stained sections (23).
RNA extraction and expression
analysis
RNA extraction from livers was performed using the
RNeasy Mini kit (Qiagen, Basel, Switzerland) according to the
manufacturer's protocol. A total of 10 ng/µl RNA was reverse
transcribed into cDNA using the Multiscribe™ Reverse Transcriptase
kit (Life Technologies; Thermo Fisher Scientific, Inc., Waltham,
MA, USA), according to the manufacturer's protocol. Reverse
transcription-quantitative polymerase chain reaction was completed
in the ABI 7500 Fast Sequence detector (Life Technologies; Thermo
Fisher Scientific, Inc.) to detect the markers listed in Table I. Thermocycling conditions were as
follows: Fast mode run of 40 cycles of 20 sec at 95°C, 3 sec at
95°C and 30 sec at 60°C. The reaction mixture contained 5 µl TaqMan
Fast Universal PCR Master Mix (2X; Life Technologies; Thermo Fisher
Scientific, Inc.), 0.5 µl TaqMan Gene Expression assay (see
Table I; Life Technologies; Thermo
Fisher Scientific, Inc.) and 2 µl cDNA diluted with RNase-free
water to a total volume of 10 µl. For ADAMTS13 expression, probe
(0.2 µl; 1:10 diluted probe; Life Technologies; Thermo Fisher
Scientific, Inc.), and forward and reverse primers (0.3 µl; 1:10
diluted primer; Life Technologies; Thermo Fisher Scientific, Inc.)
were used instead of TaqMan Gene Expression assays. The sequences
of the probe, and forward and reverse primers for ADAMTS13
expression were as follows: Forward primer, GGAGCCCAAGGATGTGTGTCTT;
reverse primer, TCTCTGGAGGTGAGAGGGAGGAT; and probe, 6FAM (reporter
dye) CTTGGCCACCATGCT MGBNFQ (non-fluorescent quencher with maximum
sensitivity). Analyses were performed using the ∆∆Cq method
(24) using the 7500 System SDS
software (Life Technologies; Thermo Fisher Scientific, Inc.).
Normalization was conducted to correct for fluctuations caused by
sample differences. Fold changes for MCD diet fed mice were
calculated as 2−∆∆Cq relative to the MCC diet. β-actin
was used as the housekeeping gene.
 | Table I.Markers detected by reverse
transcription-quantitative polymerase chain reaction using TaqMan
gene expression assays. |
Table I.
Markers detected by reverse
transcription-quantitative polymerase chain reaction using TaqMan
gene expression assays.
| Gene | Assay |
|---|
| F4/80 | Mm00802529_m1 |
| TNF-α | Mm00443258_m1 |
| MCP-1 | Mm00441242_m1 |
| IL-6 | Mm0446190_m1 |
| Arginase | Mm00475988_m1 |
| Mannose
receptor | Mm00485148_m1 |
| FAS | Mm01253300_g1 |
| CD36 | Mm00432403_m1 |
| PPAR-α | Mm00440939_m1 |
| TIMP-1 | Mm0441818_m1 |
| PAI-1 | Mm0435860_m1 |
| α-SMA | Mm00725412_s1 |
| Col1a1 | Mm00801666_g1 |
| TGF-β | Mm01178820_m1 |
| β-actin | Mm01205647_g1 |
VWF and ADAMTS13 antigen levels
Murine VWF and ADAMTS13 antigen levels in the plasma
were measured using ELISA assays made in the Laboratory for
Thrombosis Research (Department of Chemistry, University of Leuven
Kulak Campus, Kortrijk, Belgium), as previously described (25,26).
Statistical analysis
Data are presented as the means ± standard error of.
Statistical significance between groups was analyzed with the
non-parametric Mann-Whitney U test. Analysis of the data was
performed using Prism, version 6 (GraphPad Software, Inc., San
Diego, CA, USA). P<0.05 was considered to indicate a
statistically significant difference.
Results
The effects of the MCD diet were determined on body
weight and liver function in WT and Adamts13−/−
mice (Fig. 1). Feeding WT and
Adamts13−/− mice with the MCD diet for 4 weeks,
as compared with the control MCC diet, resulted in rapid and
progressive weight loss for the two genotypes (Fig. 1A). Food intake was comparable for
WT and Adamts13−/− mice kept on MCC (3.3 vs. 3.0
g/mouse/day) or on MCD diet (2.4 vs. 2.2 g/mouse/day). At the end
of the diets, total body weight was comparable for WT and
Adamts13−/− mice on the MCC (30.0±1.4 vs.
27.4±0.6 g) and MCD diets (17.2±0.4 vs. 17±0.4 g). As predicted,
the SC and GN fat mass levels were significantly reduced for in
each genotype comparing the MCD and MCC diets (Fig. 1B and C).
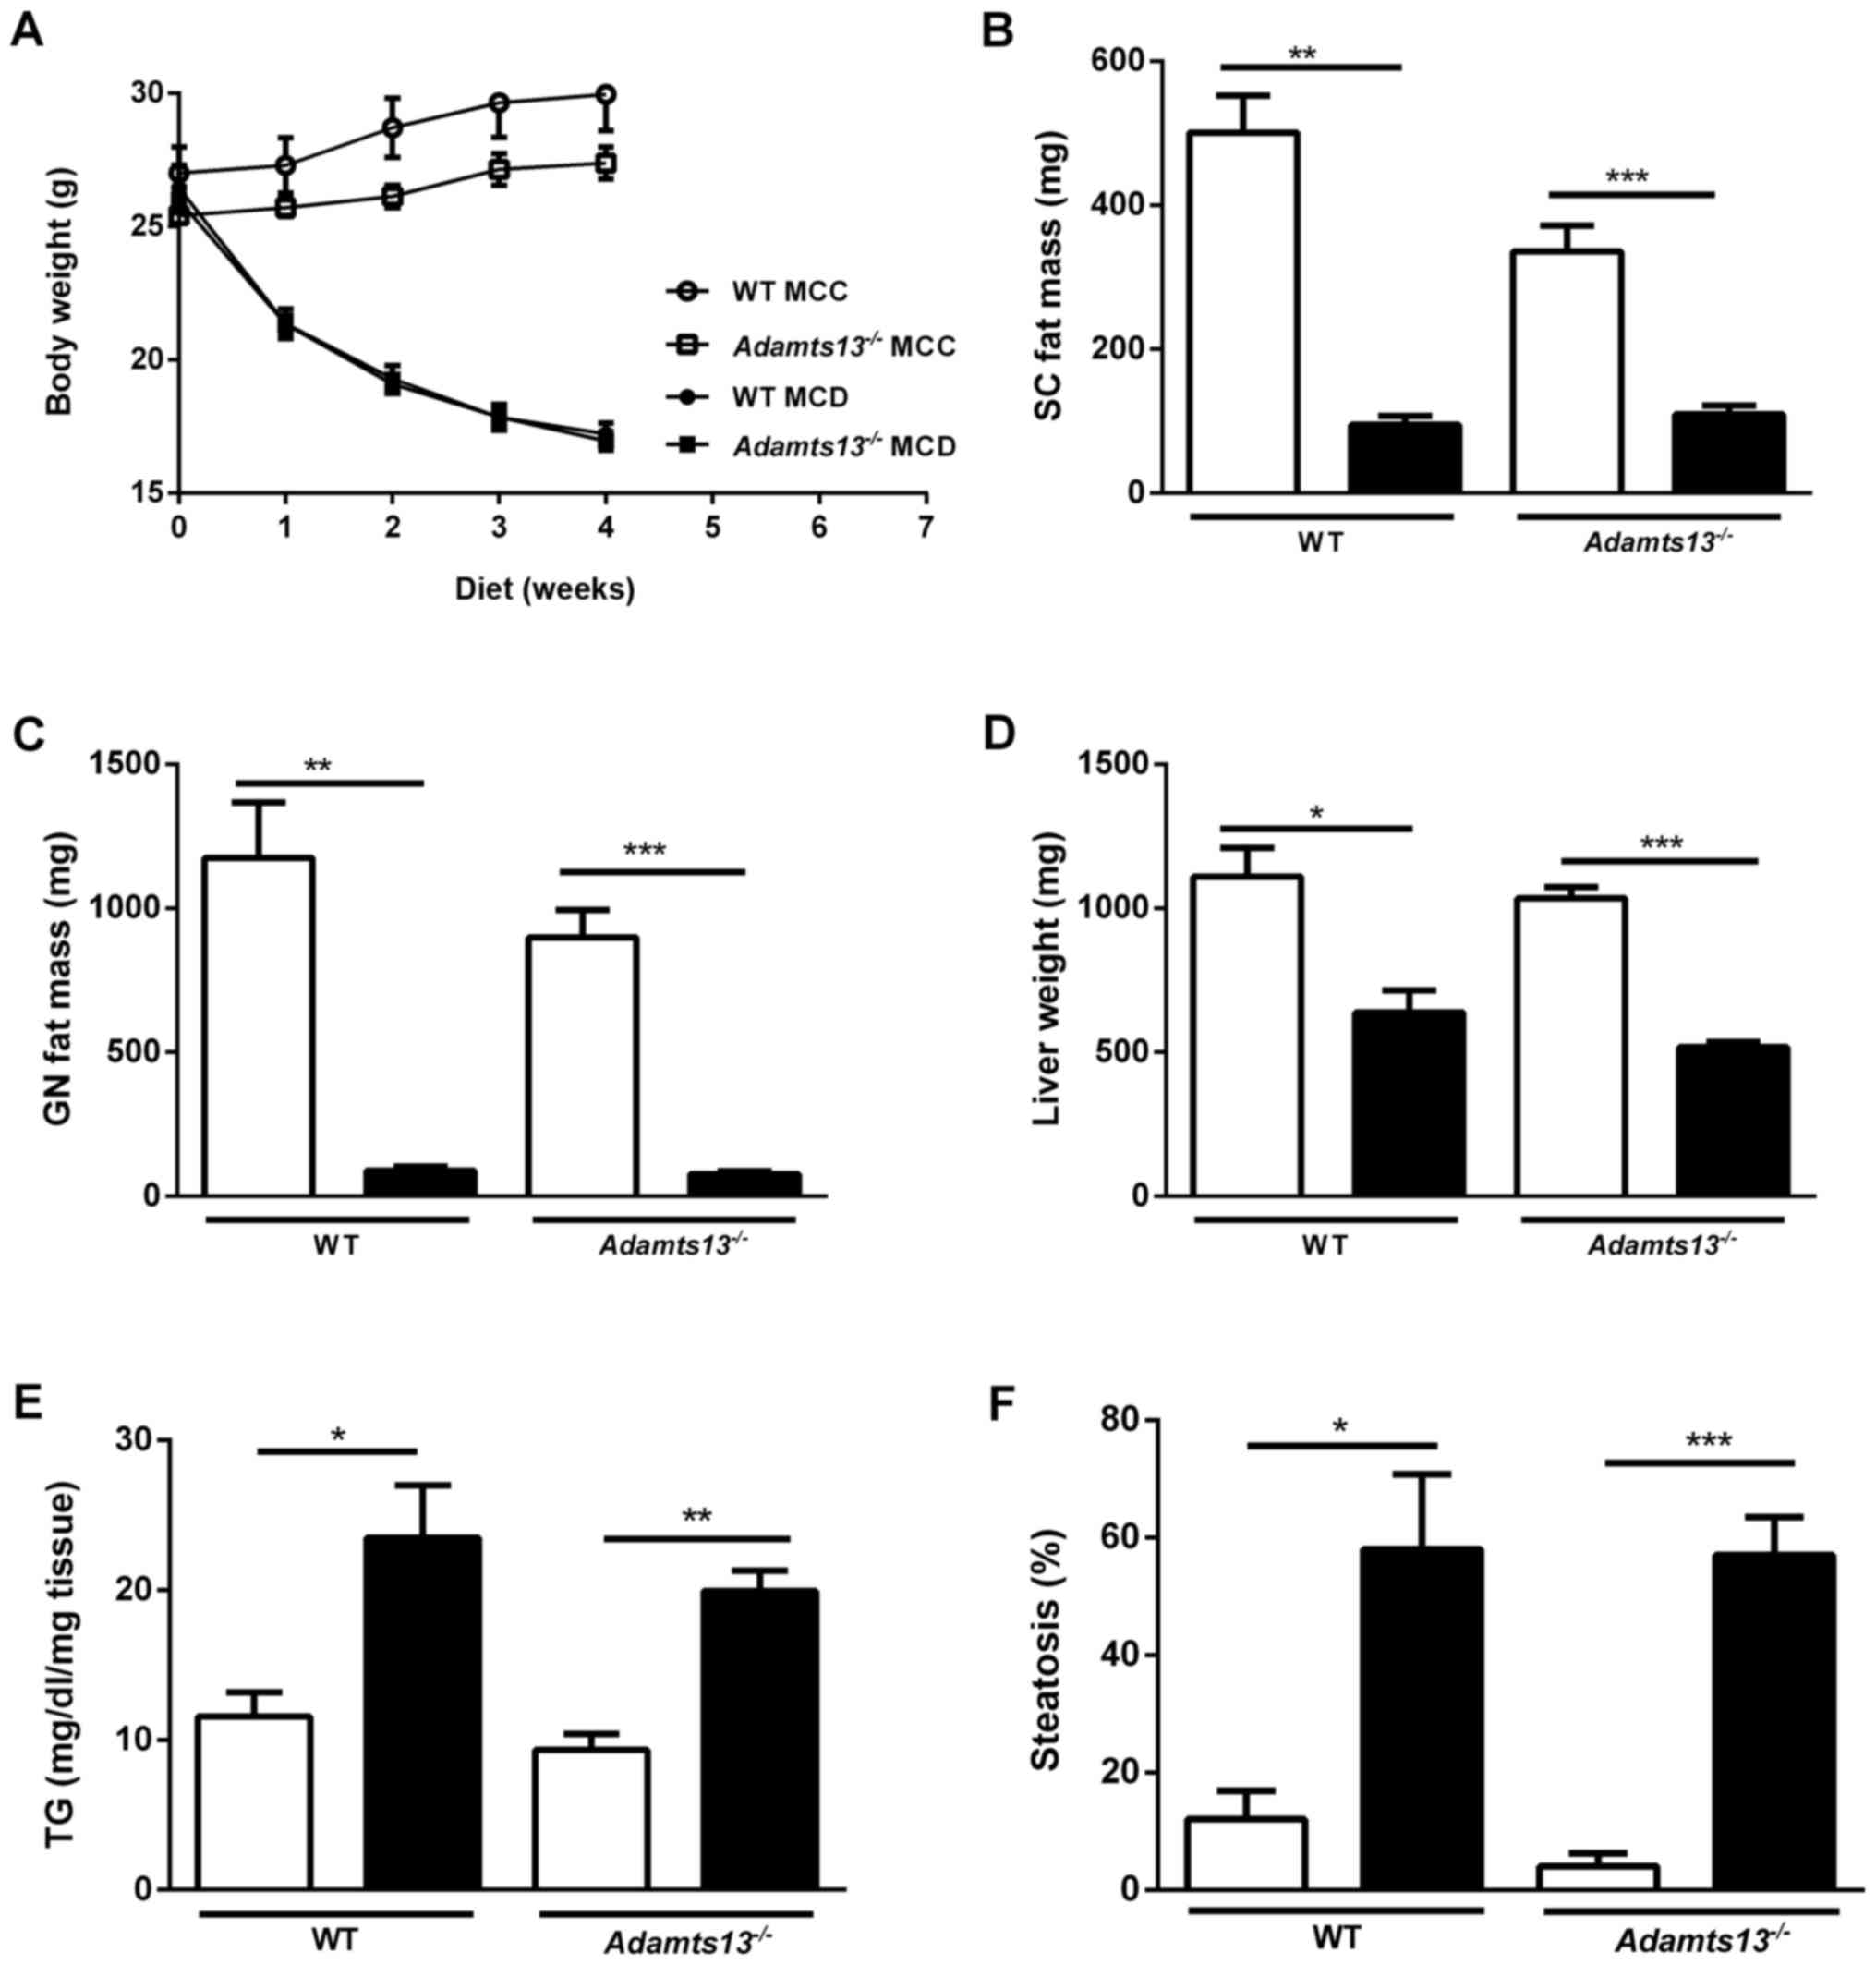 | Figure 1.Effect of MCD and MCC diets on body
weight and liver of WT and Adamts13−/− mice. (A) Body
weight evolution and weight of (B) SC fat, (C) GN fat and (D) liver
of mice kept on MCD (black symbols and bars) or MCC (white symbols
and bars) diets for 4 weeks. (E) Liver TG levels and (F)
quantitation of liver steatosis. Data are presented as the mean ±
standard error of 10 (Adamts13−/−) or 5 (WT) experiments
for each diet. *P<0.05, **P<0.01 and ***P<0.001 MCD vs.
MCC. MCD, methionine and choline deficient diet; MCC, control diet;
WT, wild-type; Adamts13−/−, a disintegrin and
metalloproteinase with thrombospondin type-1 motif, member 13
deficient; SC, subcutaneous; GN, gonadal; TG, triglyceride. |
For WT mice, plasma ADAMTS13 antigen levels were not
significantly different between the MCC and MCD diets (183±12 vs.
205±17% of pooled plasma), and relative expression of
Adamts13 mRNA in the liver was also comparable on the two
diets (0.91±0.07 vs. 1.0±0.05). VWF antigen levels were comparable
for the genotypes on either diet (Table II). However, platelet counts were
significantly lower for Adamts13−/− fed the MCD
when compared with MCC, however this was not observed in WT mice
(Table II). Analysis of plasma
metabolic parameters (Table II)
identified for MCD vs. MCC diets for the two genotypes: i) Lower
glucose levels; ii) lower total and HDL cholesterol levels; iii)
higher LDL cholesterol levels (P<0.05 for
Adamts13−/− mice only); and iv) comparable
triglyceride levels. Insulin levels were markedly lower in MCD vs.
MCC diet (significant for the Adamts13−/− mice
due to small sample sizes for WT mice), and were reduced for
Adamts13−/− vs. WT mice on MCC. Thus, HOMA-IR
identified higher insulin sensitivity for
Adamts13−/− mice on the MCC diet (Table II).
| Table II.Plasma levels of metabolic
parameters, liver enzymes, endogenous VWF and platelet count of WT
and Adamts13−/− mice kept on MCC or MCD diets for
4 weeks. |
Table II.
Plasma levels of metabolic
parameters, liver enzymes, endogenous VWF and platelet count of WT
and Adamts13−/− mice kept on MCC or MCD diets for
4 weeks.
|
| WT |
Adamts13−/− |
|---|
|
|
|
|
|---|
| Parameter | MCC | MCD | MCC | MCD |
|---|
| Glucose
(mg/dl) | 194±20.4 |
94±8.98a | 177±6.09 |
93±3.86b |
| Insulin
(ng/ml) | 0.58±0.12 | 0.17±0.07 |
0.26±0.06c |
0.05±0.01d |
| HOMA-IR | 0.30±0.06 |
0.05±0.02d |
0.12±0.03c |
0.01±0.002a |
| Triglycerides
(mg/dl) | 45±4.6 | 36±0.95 | 35±1.7 | 31±1.0c |
| Cholesterol
(mg/dl) | 89±14 | 31±5d | 84±5 | 30±1e |
| HDL cholesterol
(mg/dl) | 82±13 | 22±2d | 75±4c | 17±1e |
| LDL cholesterol
(mg/dl) | 1.5±1.5 | 7.5±0.9 | 3.8±0.9 |
7.0±0.9d |
| Alkaline
phosphatases (U/l) | 63±7.6 | 76±12 | 56±3.2 | 77±3.0d |
| AST (U/l) | 58±13 |
185±62.0d | 78±12 |
173±14.4e |
| ALT (U/l) | 22±2.0 |
193±53.4a | 39±9.0 |
227±24.0b |
| Platelet count
(x103/µl) | 917±84.3 | 752±117 | 829±25 | 565±65a |
| mVWF (% to
NMP) | 302±2.53 | 250±38.9 | 247±40.3 | 168±37.5 |
Total liver weight was reduced upon MCD feeding,
however was not affected by the genotype (Fig. 1D). The liver enzymes AST and ALT
were markedly higher in MCD fed as compared with MCC fed mice,
however were not different between genotypes (Table II). Liver triglyceride levels were
additionally enhanced upon MCD feeding, however were not affected
by the genotype (Fig. 1E).
The effects of the MCD diet were determined on
steatohepatitis in WT and Adamts13−/− mice
(Fig. 2). H&E staining of
liver sections identified more pronounced steatosis in MCD as
compared with MCC fed mice of both genotypes (Fig. 2A), as confirmed by quantitative
analysis (Fig. 1F). Further
histological analysis of liver sections identified that following 4
weeks of MCC diet, WT (3/5 with score 1) and
Adamts13−/− (3/10 with score 1) mice exhibited
only mild steatosis, whereas they all scored 0 for hepatocyte
ballooning, lobular inflammation and fibrosis (Fig. 2A and Table III). However, following MCD
feeding, WT and Adamts13−/− mice presented with
histological abnormalities with markedly enhanced scores for
steatosis, ballooning, lobular inflammation and NAS without,
however, significant differences between genotypes (Fig. 2C). In addition, fibrosis stage and
score were deteriorated in MCD vs. MCC fed mice, however no clear
effect of genotype was observed (Fig.
2B and Table III).
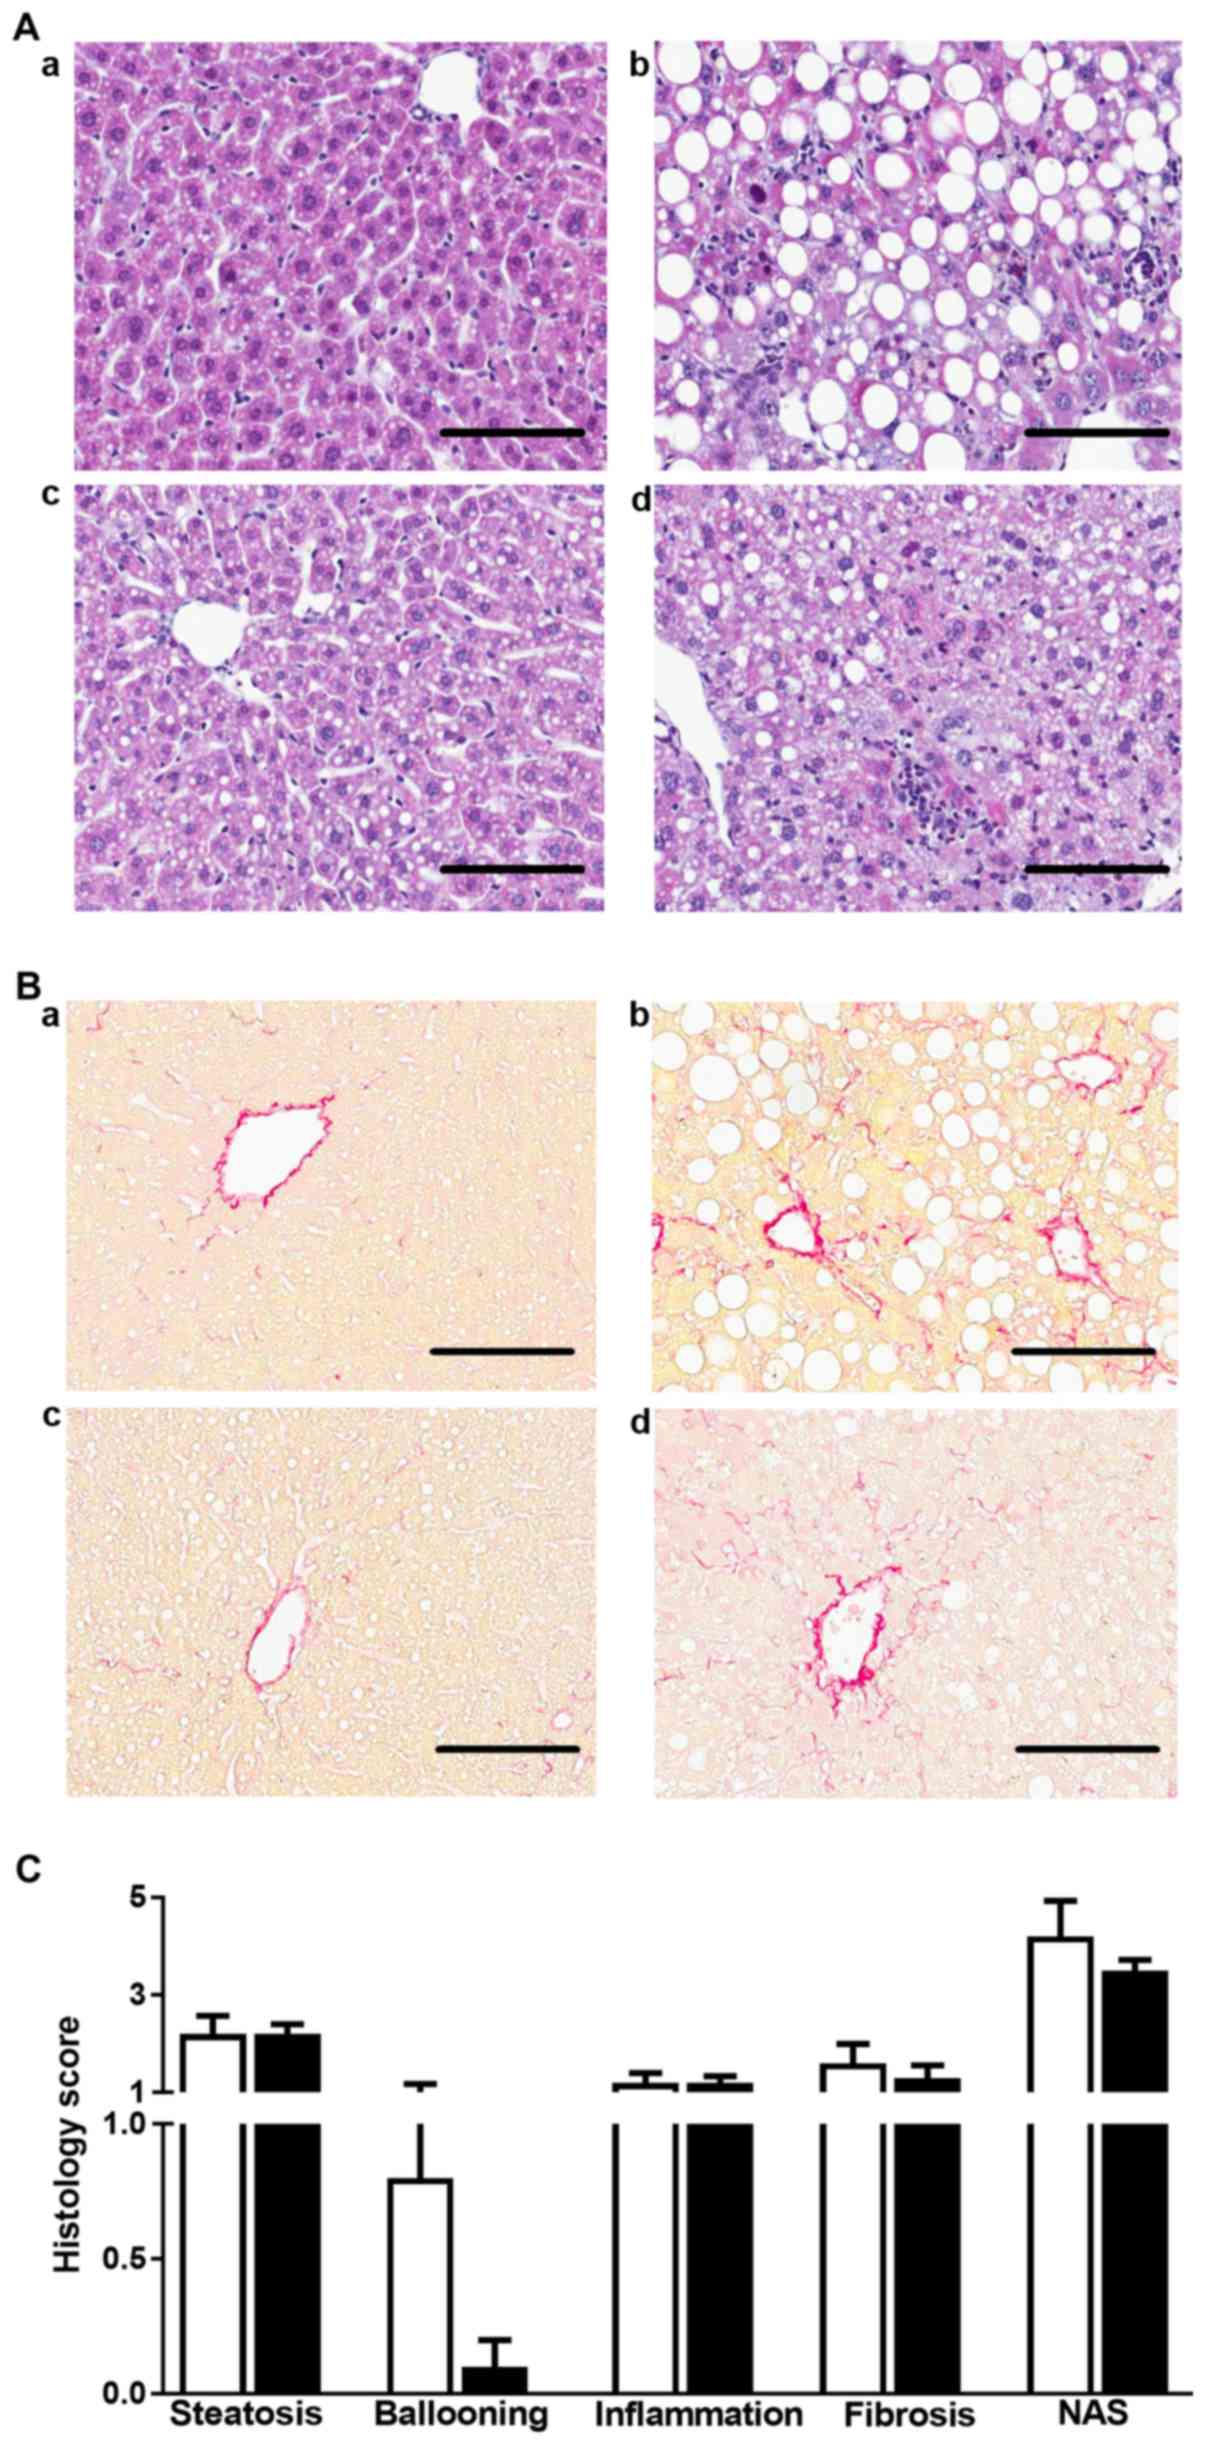 | Figure 2.MCD diet-induced steatohepatitis in
WT and Adamts13−/− mice. (A) Hematoxylin and eosin and
(B) Picrosirius Red staining of liver sections of (a and b) WT and
(c and d) Adamts13−/− mice kept on (a and c) MCC or (b
and d) MCD diet for 4 weeks. Scale bars represent 100 µm. (C)
Histological scoring of steatosis, hepatocyte ballooning,
inflammation, fibrosis and NAS for mice maintained on a MCD diet.
Data are presented as the mean ± standard error of 10
(Adamts13−/−, black bars) or 5 (WT, white bars)
determinations. MCD, methionine and choline deficient diet; WT,
wild-type; Adamts13−/−, a disintegrin and
metalloproteinase with thrombospondin type-1 motif, member 13
deficient; MCC, control diet; NAS, nonalcoholic fatty liver disease
activity score. |
| Table III.Histological scoring of liver
sections of mice maintained on MCC or MCD diet for 4 weeks. |
Table III.
Histological scoring of liver
sections of mice maintained on MCC or MCD diet for 4 weeks.
|
| MCC | MCD |
|---|
|
|
|
|
|---|
| Factor | WT |
Adamts13−/− | WT |
Adamts13−/− |
|---|
| Microvesicular
steatosis |
|
|
|
|
| Score 0
(<5%) | 2/5 | 7/10 | 0/5 | 0/10 |
| Score 1
(5–33%) | 3/5 | 3/10 | 1/5 | 1/10 |
| Score 2
(33–66%) | 0/5 | 0/10 | 2/5 | 6/10 |
| Score 3
(>66%) | 0/5 | 0/10 | 2/5 | 3/10 |
| Hepatocyte
ballooning |
|
|
|
|
| Score
0 | 5/5 | 10/10 | 2/5 | 9/10 |
| Score
1 | 0/5 | 0/10 | 2/5 | 1/10 |
| Score
2 | 0/5 | 0/10 | 1/5 | 0/10 |
| Lobular
inflammation |
|
|
|
|
| Score
0 | 5/5 | 10/10 | 0/5 | 0/10 |
| Score
1 | 0/5 | 0/10 | 4/5 | 8/10 |
| Score
2 | 0/5 | 0/10 | 1/5 | 2/10 |
| Score
3 | 0/5 | 0/10 | 0/5 | 0/10 |
| Fibrosis |
|
|
|
|
| F0 | 5/5 | 10/10 | 1/5 | 1/10 |
| Stage
F1a | 0/5 | 0/10 | 0/5 | 6/10 |
| Stage
F1b | 0/5 | 0/10 | 4/5 | 2/10 |
| Stage
F1c | 0/5 | 0/10 | 0/5 | 0/10 |
| Stage
F2 | 0/5 | 0/10 | 0/5 | 1/10 |
Relative expression of markers of triglyceride
metabolism, fibrosis and inflammation were not markedly affected by
genotype on either diet (data not shown). Histological observations
on steatosis and fibrosis were compatible with markedly enhanced
gene expression of the steatosis maker CD36 and the fibrosis marker
TIMP-1 for MCD vs. MCC fed mice of the two genotypes (Fig. 3A and B). Analysis of hepatic
inflammatory markers identified enhanced expression of TNF-α for WT
mice on MCD as compared with MCC feeding (Fig. 3C).
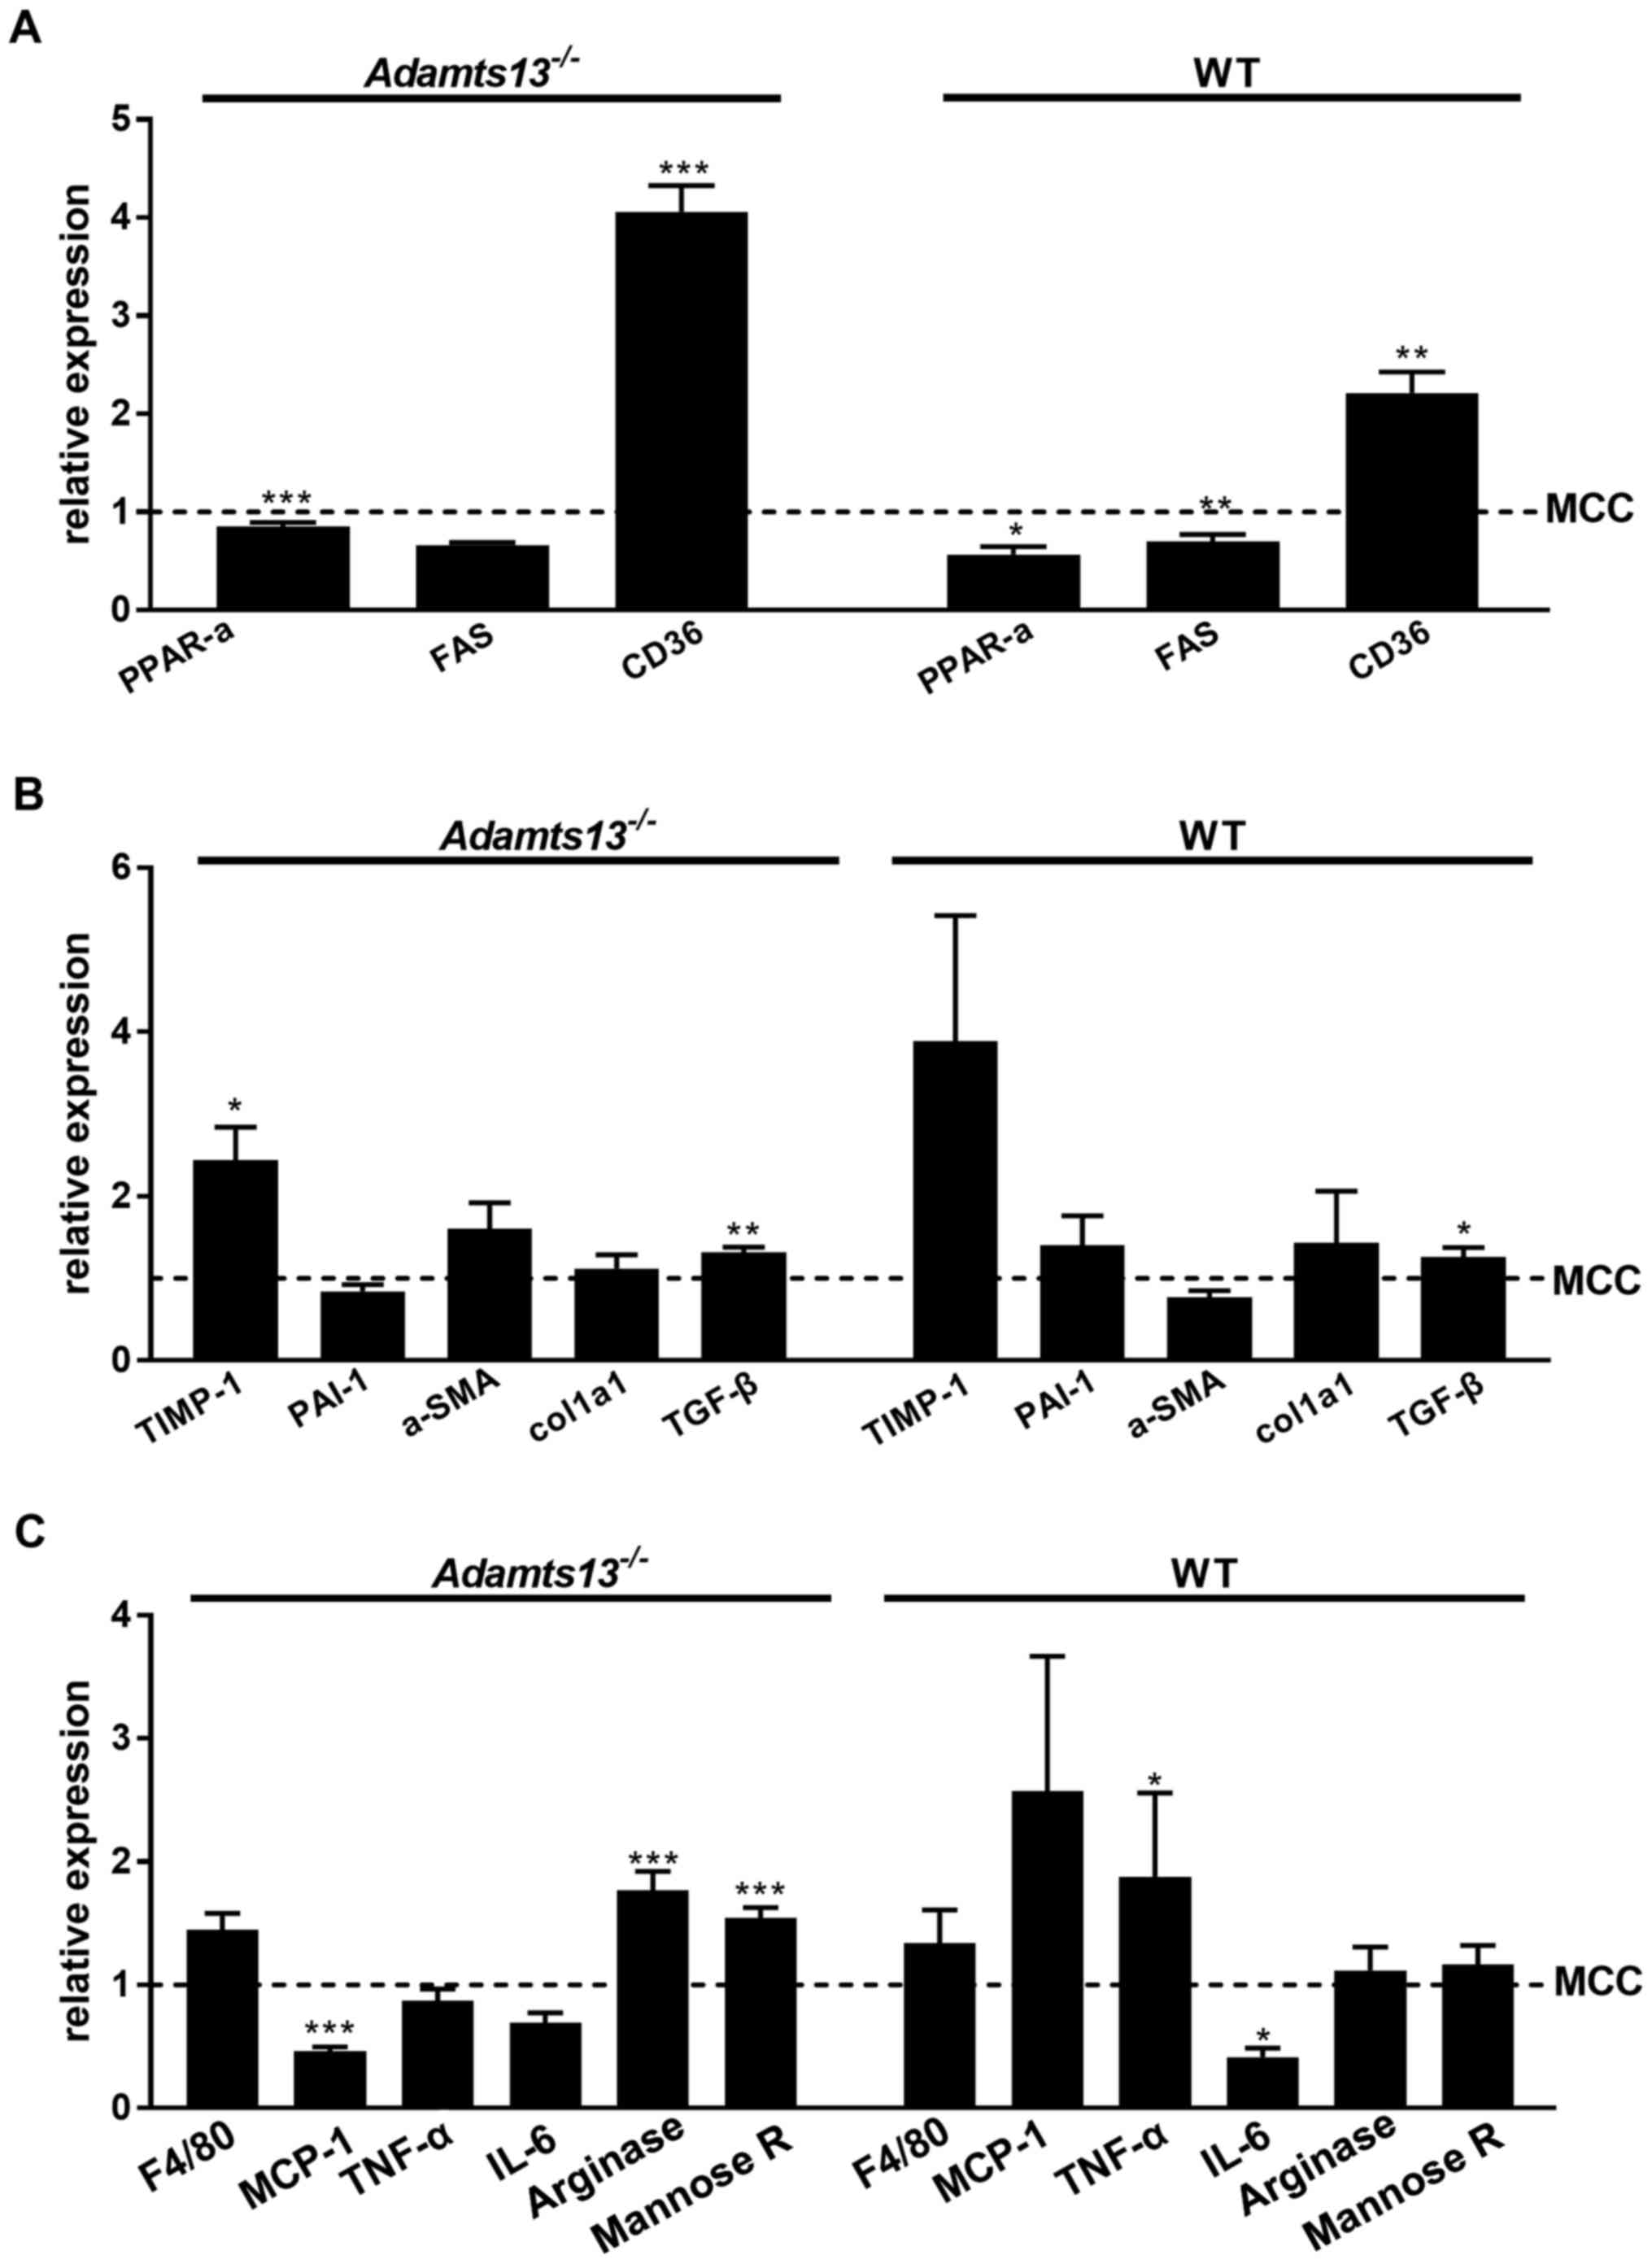 | Figure 3.Effect of MCD diet on (A) expression
of hepatic markers of steatosis/triglyceride metabolism, (B)
fibrosis and (C) inflammation. Gene expression compared with the
MCC diet is presented for MCD fed mice. Data are presented as the
mean ± standard error of 10 (Adamts13−/−) or 5 (WT)
experiments for each diet. *P<0.05, **P<0.01 and
***P<0.001 MCD vs. MCC. MCD, methionine and choline deficient
diet; MCC, control diet; Adamts13−/−, a disintegrin and
metalloproteinase with thrombospondin type-1 motif, member 13
deficient; WT, wild-type; PPAR-α, peroxisome proliferator-activated
receptor α; FAS, Fas cell surface death receptor; CD36, cluster of
differentiation; TIMP-1, tissue activator of metalloproteinase 1;
PAI-1, plasminogen activator inhibitor 1; α-SMA, α-smooth muscle
actin; Col1a1, collagen type I α1 chain; TGF-β, transforming growth
factor β; MCP-1, monocyte chemoattractant protein 1; TNF-α, tumor
necrosis factor α; IL-6, interleukin 6. |
Discussion
Deficiency of ADAMTS13, the VWF cleaving proteinase,
results in thrombotic thrombocytopenic purpura (TTP), a rare
however severe thrombotic disease (27). A functional role of ADAMTS13 has
also been suggested in liver diseases, however the available data
remain controversial (12). It has
been previously demonstrated that ADAMTS13 antigen and activity
levels are enhanced in obese mice, whereas ADAMTS13 deficiency does
not affect development of NASH in obese mice (28,29).
In the present study, it was observed that a steatosis-inducing
diet, independent of obesity, induces NASH to a comparable extent
in Adamts13 deficient and WT mice.
In patients, visceral obesity is frequently
associated with NAFLD and NASH. These conditions may be associated
with reduced ADAMTS13 activity, as reported in an obese patient
with recurrent TTP; defective ADAMTS13 synthesis was suggested as a
possible consequence of NASH (30). Furthermore, an apparent paradox
with respect to the potential role of ADAMTS13 in development of
acute liver failure has been recognized (12). ADAMTS13 activity has been
identified to be inversely associated with disease severity and
outcome, whereas by contrast, no ultralarge VWF multimers were
identified in the systemic circulation, and high molecular weight
VWF levels and VWF function were reduced in patients with acute
liver failure as compared with healthy controls (31).
Due to the fact that NASH is difficult to study in
humans due to slow progression of the disease and ethical
considerations, animal models of NASH are crucial to improve the
understanding of the pathogenesis of the disease. The model of
feeding rodents with an MCD used in the present study is one of the
most commonly used in NASH research (32–35).
It is characterized by macrovesicular steatosis, hepatocellular
death, inflammation, oxidative stress and fibrosis. Due to this
diet, the mice lose weight and the metabolic profile is opposite to
that of typical human NASH, e.g. the mice do not develop
hyperlipidemia or hypertriglyceridemia and do not present with
insulin resistance. However, liver injury and steatohepatitis are
histologically similar to that of human patients (36–38).
The severity of NASH induced in rodents by the MCD diet depends on
the administration scheme, however is also affected by species,
gender and the animal strain (39,40).
Using the administration scheme used in the present study (4 weeks
of MCD/MCC), a protective effect of the ADAMTS5 deficiency
(C57Bl/6J background) on development of NASH was identified
(41). A similar administration
scheme was used by Rinella et al (35). Although a time course was not
performed, different effects of ADAMTS13 deficiency at earlier time
points (e.g. two weeks) cannot be excluded.
It was reported that steatosis in mice kept on the
MCD diet develops within 2–4 weeks and there is progression to
fibrosis by 8–10 weeks (42–44).
The mice in the current study developed steatosis on the 4-week
diet, which was not restricted to centrolobular or periportal liver
portions, however was diffusely spread throughout the liver tissue.
More pronounced steatosis and higher liver triglyceride levels were
identified upon MCD feeding of the two genotypes, however no
differences between the genotypes were observed. No mice developed
severe fibrosis, although mRNA expression of the fibrosis markers
TIMP-1 and TGF-β in the liver tissue were enhanced following the
short-term MCD diet. These results were supported by similar
hepatic expression profiles of steatosis and fibrosis markers for
the two genotypes. The liver enzymes alkaline phosphatases, AST and
ALT were enhanced on the MCD diet, indicating liver damage, however
without marked differences between genotypes. Platelet counts
appeared lower following MCD diet feeding, which was most
pronounced in Adamts13−/− mice. To the best of
our knowledge, this has not been reported previously and remains to
be fully elucidated.
In the present study, it was observed that the WT
and the Adamts13 deficient mice fed with the MCD diet lose
weight and present with low fasting blood glucose, however do not
develop insulin resistance, which is in agreement with previous
studies (32,33,38).
Improved insulin sensitivity upon MCD feeding of the two genotypes
was observed, whereas HOMA-IR was lower for
Adamts13−/− vs. WT mice on either diet. By
contrast, it has been previously observed that in mice with high
fat induced obesity, glucose and insulin sensitivity did not differ
between WT and Adamts13−/− mice (28).
Taken together, the results of the present study and
previous data from the literature (28) do not support a functional role for
ADAMTS13 in the development of steatohepatitis in mouse models of
diet-induced steatosis. This is in agreement with a recent study in
patients with NASH, demonstrating that plasma ADAMTS13 levels were
not different from that of the controls (45).
Acknowledgements
The authors would like to thank Mrs. Liesbeth
Frederix, Ms. Inge Vorsters and Ms. Christine Vranckx for technical
support. The Center for Molecular and Vascular Biology and the
Laboratory of Thrombosis Research are supported by the ‘Programma
financiering KU Leuven’ (PF10/014). The current study was
additionally supported by the ‘Fonds voor Wetenschappelijk
Onderzoek Vlaanderen’ of the Flemish government (FWO grant
G.0D13.15 N and KU Leuven grant OT/14/071 to Professor Karen
Vanhoorelbeke).
References
|
1
|
Cassiman D and Jaeken J: NASH may be
trash. Gut. 57:141–144. 2008. View Article : Google Scholar : PubMed/NCBI
|
|
2
|
Powell EE, Cooksley WG, Hanson R, Searle
J, Halliday JW and Powell LW: The natural history of nonalcoholic
steatohepatitis: A follow-up study of forty-two patients for up to
21 years. Hepatology. 11:74–80. 1990. View Article : Google Scholar : PubMed/NCBI
|
|
3
|
Harrison SA, Torgerson S and Hayashi PH:
The natural history of nonalcoholic fatty liver disease: A clinical
histopathological study. Am J Gastroenterol. 98:2042–2047. 2003.
View Article : Google Scholar : PubMed/NCBI
|
|
4
|
Cohen JC, Horton JD and Hobbs HH: Human
fatty liver disease: Old questions and new insights. Science.
332:1519–1523. 2011. View Article : Google Scholar : PubMed/NCBI
|
|
5
|
Bedogni G, Miglioli L, Masutti F,
Tiribelli C, Marchesini G and Bellentani S: Prevalence of and risk
factors for nonalcoholic fatty liver disease: The Dionysos
nutrition and liver study. Hepatology. 42:44–52. 2005. View Article : Google Scholar : PubMed/NCBI
|
|
6
|
Blachier M, Leleu H, Peck-Radosavljevic M,
Valla DC and Roudot-Thoraval F: The burden of liver disease in
Europe: A review of available epidemiological data. J Hepatol.
58:593–608. 2013. View Article : Google Scholar : PubMed/NCBI
|
|
7
|
Sanyal AJ; American Gastroenterological
Association, : AGA technical review on nonalcoholic fatty liver
disease. Gastroenterology. 123:1705–1725. 2002. View Article : Google Scholar : PubMed/NCBI
|
|
8
|
Neuschwander-Tetri BA: Nonalcoholic
steatohepatitis and the metabolic syndrome. Am J Med Sci.
330:326–335. 2005. View Article : Google Scholar : PubMed/NCBI
|
|
9
|
Le Goff C and Cormier-Daire V: The
ADAMTS(L) family and human genetic disorders. Hum Mol Genet.
20:R163–R167. 2011. View Article : Google Scholar : PubMed/NCBI
|
|
10
|
Uemura M, Tatsumi K, Matsumoto M, Fujimoto
M, Matsuyama T, Ishikawa M, Iwamoto TA, Mori T, Wanaka A, Fukui H
and Fujimura Y: Localization of ADAMTS13 to the stellate cells of
human liver. Blood. 106:922–924. 2005. View Article : Google Scholar : PubMed/NCBI
|
|
11
|
Watanabe N, Ikeda H, Kume Y, Satoh Y,
Kaneko M, Takai D, Tejima K, Nagamine M, Mashima H, Tomiya T, et
al: Increased production of ADAMTS13 in hepatic stellate cells
contributes to enhanced plasma ADAMTS13 activity in rat models of
cholestasis and steatohepatitis. Thromb Haemost. 102:389–396.
2009.PubMed/NCBI
|
|
12
|
Uemura M, Fujimura Y, Ko S, Matsumoto M,
Nakajima Y and Fukui H: Pivotal role of ADAMTS13 function in liver
diseases. Int J Hematol. 91:20–29. 2010. View Article : Google Scholar : PubMed/NCBI
|
|
13
|
Takaya H, Uemura M, Fujimura Y, Matsumoto
M, Matsuyama T, Kato S, Morioka C, Ishizashi H, Hori Y, Fujimoto M,
et al: ADAMTS13 activity may predict the cumulative survival of
patients with liver cirrhosis in comparison with the
Child-Turcotte-Pugh score and the model for end-stage liver disease
score. Hepatol Res. 42:459–472. 2012. View Article : Google Scholar : PubMed/NCBI
|
|
14
|
Uemura M, Matsuyama T, Ishikawa M,
Fujimoto M, Kojima H, Sakurai S, Ishii S, Toyohara M, Yamazaki M,
Yoshiji H, et al: Decreased activity of plasma ADAMTS13 may
contribute to the development of liver disturbance and multiorgan
failure in patients with alcoholic hepatitis. Alcohol Clin Exp Res.
29 12 Suppl:264S–271S. 2005. View Article : Google Scholar : PubMed/NCBI
|
|
15
|
Matsumoto M, Kawa K, Uemura M, Kato S,
Ishizashi H, Isonishi A, Yagi H, Park YD, Takeshima Y, Kosaka Y, et
al: Prophylactic fresh frozen plasma may prevent development of
hepatic VOD after stem cell transplantation via ADAMTS13-mediated
restoration of von Willebrand factor plasma levels. Bone Marrow
Transplant. 40:251–259. 2007. View Article : Google Scholar : PubMed/NCBI
|
|
16
|
Ikeda H, Tateishi R, Enooku K, Yoshida H,
Nakagawa H, Masuzaki R, Kondo Y, Goto T, Shiina S, Kume Y, et al:
Prediction of hepatocellular carcinoma development by plasma
ADAMTS13 in chronic hepatitis B and C. Cancer Epidemiol Biomarkers
Prev. 20:2204–2211. 2011. View Article : Google Scholar : PubMed/NCBI
|
|
17
|
Motto DG, Chauhan AK, Zhu G, Homeister J,
Lamb CB, Desch KC, Zhang W, Tsai HM, Wagner DD and Ginsburg D:
Shigatoxin triggers thrombotic thrombocytopenic purpura in
genetically susceptible ADAMTS13-deficient mice. J Clin Invest.
115:2752–2761. 2005. View
Article : Google Scholar : PubMed/NCBI
|
|
18
|
de Maeyer B, de Meyer SF, Feys HB, Pareyn
I, Vandeputte N, Deckmyn H and Vanhoorelbeke K: The distal
carboxyterminal domains of murine ADAMTS13 influence proteolysis of
platelet-decorated VWF strings in vivo. J Thromb Haemost.
8:2305–2312. 2010. View Article : Google Scholar : PubMed/NCBI
|
|
19
|
Council NR: Guide for the Care and Use
Laboratoy Animals. 7th. Washington, DC: National Academy Press;
1996
|
|
20
|
Kleiner DE, Brunt EM, van Natta M, Behling
C, Contos MJ, Cummings OW, Ferrell LD, Liu YC, Torbenson MS,
Unalp-Arida A, et al: Design and validation of a histological
scoring system for nonalcoholic fatty liver disease. Hepatology.
41:1313–1321. 2005. View Article : Google Scholar : PubMed/NCBI
|
|
21
|
Verbeek J, Lannoo M, Pirinen E, Ryu D,
Spincemaille P, Elst I Vander, Windmolders P, Thevissen K, Cammue
BP, van Pelt J, et al: Roux-en-y gastric bypass attenuates hepatic
mitochondrial dysfunction in mice with non-alcoholic
steatohepatitis. Gut. 64:673–683. 2015. View Article : Google Scholar : PubMed/NCBI
|
|
22
|
Bedossa P, Poitou C, Veyrie N, Bouillot
JL, Basdevant A, Paradis V, Tordjman J and Clement K:
Histopathological algorithm and scoring system for evaluation of
liver lesions in morbidly obese patients. Hepatology. 56:1751–1759.
2012. View Article : Google Scholar : PubMed/NCBI
|
|
23
|
Bedossa P, Dargère D and Paradis V:
Sampling variability of liver fibrosis in chronic hepatitis C.
Hepatology. 38:1449–1457. 2003. View Article : Google Scholar : PubMed/NCBI
|
|
24
|
Livak KJ and Schmittgen TD: Analysis of
relative gene expression data using real-time quantitative PCR and
the 2 (−Delta Delta C(T)) method. Methods. 25:402–408. 2001.
View Article : Google Scholar : PubMed/NCBI
|
|
25
|
Verhenne S, Denorme F, Libbrecht S,
Vandenbulcke A, Pareyn I, Deckmyn H, Lambrecht A, Nieswandt B,
Kleinschnitz C, Vanhoorelbeke K and De Meyer SF: Platelet-derived
VWF is not essential for normal thrombosis and hemostasis but
fosters ischemic stroke injury in mice. Blood. 126:1715–1722. 2015.
View Article : Google Scholar : PubMed/NCBI
|
|
26
|
Deforche L, Tersteeg C, Roose E,
Vandenbulcke A, Vandeputte N, Pareyn I, de Cock E, Rottensteiner H,
Deckmyn H, De Meyer SF and Vanhoorelbeke K: Generation of
anti-murine ADAMTS13 antibodies and their application in a mouse
model for acquired thrombotic thrombocytopenic purpura. PLoS One.
11:e01603882016. View Article : Google Scholar : PubMed/NCBI
|
|
27
|
Murrin RJ and Murray JA: Thrombotic
thrombocytopenic purpura: Aetiology, pathophysiology and treatment.
Blood Rev. 20:51–60. 2006. View Article : Google Scholar : PubMed/NCBI
|
|
28
|
Geys L, Scroyen I, Roose E, Vanhoorelbeke
K and Lijnen HR: ADAMTS13 deficiency in mice does not affect
adipose tissue development. Biochim Biophys Acta. 1850:1368–1374.
2015. View Article : Google Scholar : PubMed/NCBI
|
|
29
|
Geys L, Bauters D, Roose E, Tersteeg C,
Vanhoorelbeke K, Hoylaerts MF, Lijnen RH and Scroyen I: ADAMTS13
deficiency promotes microthrombosis in a murine model of
diet-induced liver steatosis. Thromb Haemost. 117:19–26. 2017.
View Article : Google Scholar : PubMed/NCBI
|
|
30
|
Lombardi AM, Fabris R, de Marinis G Berti,
Marson P, Navaglia F, Plebani M, Vettor R and Fabris F: Defective
ADAMTS13 synthesis as a possible consequence of NASH in an obese
patient with recurrent thrombotic thrombocytopenic purpura. Eur J
Haematol. 92:497–501. 2014. View Article : Google Scholar : PubMed/NCBI
|
|
31
|
Hugenholtz GC, Adelmeijer J, Meijers JC,
Porte RJ, Stravitz RT and Lisman T: An unbalance between von
Willebrand factor and ADAMTS13 in acute liver failure: Implications
for hemostasis and clinical outcome. Hepatology. 58:752–761. 2013.
View Article : Google Scholar : PubMed/NCBI
|
|
32
|
Takahashi Y, Soejima Y and Fukusato T:
Animal models of nonalcoholic fatty liver disease/nonalcoholic
steatohepatitis. World J Gastroenterol. 18:2300–2308. 2012.
View Article : Google Scholar : PubMed/NCBI
|
|
33
|
Machado MV, Michelotti GA, Xie G, Pereira
T Almeida, Boursier J, Bohnic B, Guy CD and Diehl AM: Mouse models
of diet-induced nonalcoholic steatohepatitis reproduce the
heterogeneity of the human disease. PLoS One. 10:e01279912015.
View Article : Google Scholar : PubMed/NCBI
|
|
34
|
Caballero F, Fernández A, Matías N,
Martínez L, Fucho R, Elena M, Caballeria J, Morales A,
Fernández-Checa JC and García-Ruiz C: Specific contribution of
methionine and choline in nutritional nonalcoholic steatohepatitis:
Impact on mitochondrial S-adenosyl-L-methionine and glutathione. J
Biol Chem. 285:18528–18536. 2010. View Article : Google Scholar : PubMed/NCBI
|
|
35
|
Rinella ME, Elias MS, Smolak RR, Fu T,
Borensztajn J and Green RM: Mechanisms of hepatic steatosis in mice
fed a lipogenic methionine choline-deficient diet. J Lipid Res.
49:1068–1076. 2008. View Article : Google Scholar : PubMed/NCBI
|
|
36
|
Weltman MD, Farrell GC and Liddle C:
Increased hepatocyte CYP2E1 expression in a rat nutritional model
of hepatic steatosis with inflammation. Gastroenterology.
111:1645–1653. 1996. View Article : Google Scholar : PubMed/NCBI
|
|
37
|
Weltman MD, Farrell GC, Hall P,
Ingelman-Sundberg M and Liddle C: Hepatic cytochrome P450 2E1 is
increased in patients with nonalcoholic steatohepatitis.
Hepatology. 27:128–133. 1998. View Article : Google Scholar : PubMed/NCBI
|
|
38
|
Rinella ME and Green RM: The
methionine-choline deficient dietary model of steatohepatitis does
not exhibit insulin resistance. J Hepatol. 40:47–51. 2004.
View Article : Google Scholar : PubMed/NCBI
|
|
39
|
Fan JG and Qiao L: Commonly used animal
models of non-alcoholic steatohepatitis. Hepatobiliary Pancreat Dis
Int. 8:233–240. 2009.PubMed/NCBI
|
|
40
|
Kirsch R, Clarkson V, Shephard EG, Marais
DA, Jaffer MA, Woodburne VE, Kirsch RE and Pde L Hall: Rodent
nutritional model of non-alcoholic steatohepatitis: Species, strain
and sex difference studies. J Gastroenterol Hepatol. 18:1272–1282.
2003. View Article : Google Scholar : PubMed/NCBI
|
|
41
|
Bauters D, Spincemaille P, Geys L,
Cassiman D, Vermeersch P, Bedossa P, Scroyen I and Lijnen RH:
ADAMTS5 deficiency protects against non-alcoholic steatohepatitis
(NASH) in obesity. Liver Int. 36:1848–1859. 2016. View Article : Google Scholar : PubMed/NCBI
|
|
42
|
Pena A Dela, Leclercq I, Field J, George
J, Jones B and Farrell G: NF-kappaB activation, rather than TNF,
mediates hepatic inflammation in a murine dietary model of
steatohepatitis. Gastroenterology. 129:1663–1674. 2005. View Article : Google Scholar : PubMed/NCBI
|
|
43
|
Leclercq IA, Farrell GC, Field J, Bell DR,
Gonzalez FJ and Robertson GR: CYP2E1 and CYP4A as microsomal
catalysts of lipid peroxides in murine nonalcoholic
steatohepatitis. J Clin Invest. 105:1067–1075. 2000. View Article : Google Scholar : PubMed/NCBI
|
|
44
|
Ip E, Farrell G, Hall P, Robertson G and
Leclercq I: Administration of the potent PPARalpha agonist,
Wy-14,643, reverses nutritional fibrosis and steatohepatitis in
mice. Hepatology. 39:1286–1296. 2004. View Article : Google Scholar : PubMed/NCBI
|
|
45
|
Potze W, Siddiqui MS, Boyett SL,
Adelmeijer J, Daita K, Sanyal AJ and Lisman T: Preserved hemostatic
status in patients with non-alcoholic fatty liver disease. J
Hepatol. 65:980–987. 2016. View Article : Google Scholar : PubMed/NCBI
|


