Introduction
Pleural effusion is a common clinical manifestation
worldwide, with an annual morbidity >3,000 per million people
(1). The causes of pleural
effusion are diverse. According to specific gravity, protein
content and cell number of pleural effusion, and Light's criteria
(2), pleural effusion is divided
into transudative or exudative pleural effusion. In the clinical
setting, transudative pleural effusion is usually caused by cardiac
insufficiency, hypoproteinemia and hepatocirrhosis. Exudative
pleural effusion is usually due to tuberculosis (TB) and tumors
(3). The World Health Organization
released a global TB report in 2015 (4); this report noted that in 2014, ~9.6
million individuals were infected with TB and 1.5 individuals
succumbed. In recent years, the incidence of lung and pleural
tumors is increasing. The mortality rate has been ranked first of
the malignant tumors. Therefore, establishing a strategy to rapidly
and accurately diagnose and determine the etiologies of pleural
effusion patients is an issue that is difficult to solve. The
current diagnostic methods have various limitations. The biopsy
examination is traumatic and the compliance rate for patients is
usually low. Furthermore, the cytology and pathogenic examinations
often exhibit low sensitivity. With the development of laboratory
techniques, enzymology and tumor marker examinations have been
widely adopted in the clinical setting. Although adenosine
deaminase, lactate dehydrogenase (LDH), carcinoembryonic antigen,
CA 125, CA 199, cytokerantin-19-fragment (CYFRA 21–1) and
neuron-specific enolase levels have been used to determine the
diagnosis of pleural effusion type to a certain extent, they are
considered to be of limited value. There continues to be numerous
pleural effusion patients that have failed to receive rapid and
accurate diagnoses and treatment (5). Data from a mathematical modeling
study estimated that only 35% of pediatric cases of TB were
detected in 15 countries reporting pediatric and adult
notifications by age in 2010 (6).
Therefore, rapid and accurate diagnostic methods are urgently
required.
Since the concept of metabonomics was put forward by
Nicholson in 1999 (7), it has been
developed rapidly and is widely used in clinical research. The
metabolomic research methods (analyzing metabolic phenotype and
metabolic dynamic changes of the body under different conditions)
provide an improved understanding of the development process of
disease, as well as the metabolic pathways and mechanisms of the
inner body. This provides critical clues for diagnosis and
treatment of disease, which is significant, not only in basic
theory research, but in clinical application. As the ultimate
downstream pool of genome transcription, metabolomics reflects what
actually occurs in the living cells or organism, whereas genetics
and proteomics only indicates what may have occurred (8,9).
Evaluation of the dynamic changes in low molecular weight
catabolites has been widely applied in various types of disease and
provides a platform to distinguish novel biomarkers, for example in
cancer (10,11), diabetes (12–14),
hypertension (15), coronary heart
disease (16–18), polycystic ovary syndrome (19), and major depressive disorder
(20). However, there are few
studies regarding the metabolic profiling for pleural effusion.
Applied to biomedical research at the beginning of
the 1970s, 1H nuclear magnetic resonance
(1H-NMR) spectroscopy, in which the relevant information
was obtained by using an external magnetic field to change the
energy of the atomic nucleus, was one of the earliest technologies
applied for the analysis of metabolomics. There are various types
of NMR techniques, such as 1H-NMR, 13C-NMR
and 31P-NMR. However, the most widely adopted is
1H-NMR. NMR technology detects all of the metabolites in
the sample and reflects the content of each metabolite through
relative strength of the signal in a spectrum.
In the current study, NMR-based metabolomic
technology was used to screen characteristic metabolic substances
of patients with tuberculous, malignant or transudative pleural
effusion, which are hypothesized to be potential markers of the
disease state, in order to facilitate further clinical research. A
partial least squares discriminant analysis (PLS-DA) model was
established whilst constructing the metabolite profiles. A total of
58 patients, including 20 with tuberculous pleural effusion, 20
with malignant pleural effusion, and 18 with transudative pleural
effusion were enrolled. Multivariate statistical analysis was
implemented to distinguish between the three groups of patients on
the basis of their metabolic profiles. Novel data processing and
analysis techniques for metabolomics may provide a broader range of
applications in disease diagnosis and classification. Furthermore,
an in-depth knowledge of the metabolic profiling of pleural
effusion may improve the understanding of the underlying mechanism
of pulmonary TB, malignant and transudative pleural effusion, and
reveal novel diagnostic and therapeutic methods for these
diseases.
Materials and methods
Subjects
All participants were recruited from the Second
Department of Respiratory Medicine in the First Affiliated Hospital
of Kunming Medical University (Kunming, China) between August 2014
and September 2015. The study was approved by the ethics committee
of Kunming Medical University and all aspects of the study were
performed within the constraints laid out by the ethics committee.
All patients involved in the study provided written informed
consent.
The T group was formed of tuberculous pleural
effusion patients (n=20), who were diagnosed following chest pain,
dyspnea and other pleural effusion symptoms. In addition, patients
exhibited afternoon fever, night sweats, fatigue, weight loss and
other symptoms of TB. Upon chest physical examination, weakened
tactile fremitus and percussion dullness were observed in the
affected side, lung auscultation revealed weakened or disappeared
breath sounds and chest CT examinations revealed pleural effusion,
with or without pulmonary TB lesions. Routine examination of
pleural fluid was performed according to Light's criteria to
determine the exudate. Mycobacterium was detected as positive by
pleural biopsy or airway secretion pathogen examination. In
addition, treatment with anti-TB medication resulted in clinical
and radiological improvement. Patients with metabolic diseases were
excluded. Pleural effusion was collected from each participant
prior to treatment with anti-TB medication.
The C group was formed of malignant pleural effusion
patients (n=20), who were diagnosed following chest pain, dyspnea
and other pleural effusion symptoms. Chest physical examination
indicated weakened tactile fremitus and percussion dullness in the
affected side. In addition, lung auscultation revealed weakened or
disappeared breath sounds. Patients exhibited other signs of
pleural effusion, including chest CT demonstrating pleural effusion
and tumor lesions in the lung, and routine examination of pleural
fluid was consistent with exudatum according to Light's criteria.
Malignant tumors were confirmed by lung biopsy, pleural biopsy or
cytologic examination of pleural effusion. Patients with metabolic
diseases were excluded, and none of the patients had received
chemotherapy, radiotherapy, surgery or other treatment prior to
sample collection. All of the malignant tumors were primary.
The L group was formed of transudative pleural
effusion (n=18) patients, who were diagnosed following chest pain,
dyspnea and other pleural effusion symptoms. Patients exhibited
cardiac functional insufficiency, cirrhosis, hypoproteinemia or
other basic diseases. Chest physical examination indicated weakened
tactile fremitus and percussion dullness in the affected side.
Furthermore, lung auscultation revealed weakened or disappeared
breath sounds. Patients exhibited other signs of pleural effusion,
including pleural effusion as demonstrated by chest CT, although no
pulmonary or pleural lesions were observed. The routine examination
of pleural fluid was consistent with transudate according to
Light's criteria. Pleural effusion was absorbed following
improvement of cardiac dysfunction and hypoproteinemia. Patients
with metabolic diseases were excluded. The transudative pleural
effusion was collected from the subjects prior to the improvement
of cardiac dysfunction and hypoproteinemia. Subsequently, screening
was performed and samples were selected from patients whose pleural
effusion was absorbed following improvement of cardiac dysfunction
and hypoproteinemia, to be used in subsequent analyses.
Instruments and reagents
The MHz 600 INOVA superconducting nuclear magnetic
resonance spectrometer was purchased from Varian Medical Systems
(Palo Alto, CA, USA). It was equipped with a pulsed field gradient,
and the gradient field has three resonance probes. The Ependorf
MiniSpin Plus centrifuge was obtained from Eppendorf (Hamburg,
Germany).
D2O (concentration, 99.9%) was purchased
from Cambridge Isotope Laboratories, Inc. (Tewksbury, MA). The
3-(trimethylsilyl)-propionic acid-D4 sodium salt (TSP)
was purchased from Merck KGaA (Darmstadt, Germany).
Sample preparation
Pleural effusion samples were obtained via
thoracentesis. After conventional disinfection, the pleural
effusion was collected in sterile test tubes. Each sample (~1 ml)
was placed in a refrigerator at −80°C. Prior to nuclear magnetic
resonance (NMR) analysis, the pleural effusion samples were
defrosted at room temperature and centrifuged at 4,000 × g, 4°C for
10 min. Aliquots of 350 µl supernatant were transferred into 5-mm
NMR tubes, and mixed with 200 µl D2O and 50 µl TSP (0.1%
w/v in D2O). D2O was used for field frequency
locking and normal saline was used to maintain normal plasma
osmolality.
1H-NMR spectroscopy of
pleural effusion samples
1H-NMR measurements were obtained on a Varian INOVA
600 spectrometer at a 1H frequency of 600.13 MHz. 1H-NMR spectra of
the samples were acquired using a solvent pre-saturation pulse
sequence to suppress the residual water resonance.
1H-NMR spectra of the samples were
acquired using a Carr-Purcell-Meiboom-Gill pulse sequence. Free
induction decays (FIDs) were collected at 128-K data points with a
spectral width of 8,000 Hz and 32-K sampling points, the cumulative
number of 64 times an acquisition time of 2.04 sec, providing a
total pulse recycle delay of 2.00 sec. The data were zero filled by
a factor, and FIDs were multiplied by an exponential weighting
function equivalent to a line broadening of 0.5 Hz prior to the
Fourier transform.
Data processing of 1H-NMR
spectra
The phase and baseline of all 1H-NMR spectra were
manually corrected using Mest Re Nova software (version
9.0.1.13254; Mestrelab Research, Santiago de Compostela, Spain).
The range of δ10-0 ppm in standard 1H-NMR spectra was automatically
segmented into 400 regions at 0.01-ppm intervals with δ4.4–0.4 ppm.
The data from each sample were normalized to total area to correct
for the NMR response shift. This divides the spectrum into a
specified number of regions and integrates the total signal area
within each region to provide a numerical value. These values are
then used as variables for data analysis.
Multivariate statistical analysis
The reduced and normalized NMR spectral data were
submitted to SIMCA-P version 11.0 (Umetrics; MKS Data Analytics
Solutions, Umeå, Sweden) software package for multivariate analysis
and to partial least squares discriminant analysis (PLS-DA).
SIMCA-P was used to generate all of the PLS-DA models, score plots
and was performed to clarify which chemical shift regions carry the
separating information. Cross-validation was used to validate the
PLS-DA model according to the default settings in the software.
Hotelling's T-squared statistic is a generalization of Student's t
statistic that is used in multivariate hypothesis testing.
Statistical analysis
SIMCA-P version 11.0 was used for 1H-NMR data
analysis. Values were expressed as the mean ± standard deviation
(SD). The significantly different expression of compound peaks
(variable importance; VIP >1.0) was listed by the software.
Subsequently, the differentiated expressions of peaks were analyzed
by discriminatory analysis. SPSS version 19.0 statistical software
(IBM Corp., Armonk, NY, USA) was used for the statistical analyses
of clinical data. Depending on the underlying statistical
distribution and the result of the homogeneity test for variance,
either one-way analysis of variance (ANOVA) or the Kruskal-Wallis
(K-W) test was used. Primary statistical analysis of the pooled
data (mean ± SD) was performed with the ANOVA to determine mean
differences of metabolites, followed by Student-Newman-Keuls (SNK)
test for multiple comparisons. χ2 test was used to compare
categorical variables. P<0.05 was considered to indicate a
statistically significant difference.
Pathway analysis
In the current study, the different chemical
metabolites were performed with MetaboAnalyst (version 2.0;
www.metaboanalyst.ca/MetaboAnalyst) web portal for
pathway analysis and visualization. In order to obtain more
information on the reference of these metabolites, the Kyoto
Encyclopedia of Genes and Genomes (KEGG) PATHWAY Database
(www.genome.jp/kegg) was searched.
Additional powerful pathway enrichment statistical analysis was
performed on log-transformed data and Pearson correlations were
calculated to evaluate the association between metabolites
(P<0.05, impact >0.01).
Results
Baseline characteristics
A total of 58 samples were evaluated, 20 of which
were from patients with tuberculous pleural effusion (T group), 20
from patients with malignant pleural effusion (C group) and 18 from
patients with transudative pleural effusion (L group). The clinical
characteristics of the three groups of subjects are summarized in
Table I, which also presents the
baseline characteristics of the enrolled patients and control
subjects. No significant differences in age, sex or body mass index
were identified between the three groups (P>0.05).
 | Table I.Demographic characteristics of
individuals with tuberculous, malignant and transudative pleural
effusion. |
Table I.
Demographic characteristics of
individuals with tuberculous, malignant and transudative pleural
effusion.
|
| Pleural
effusion |
|---|
|
|
|
|---|
| Variable | Tuberculous,
n=20 | Malignant,
n=20 | Transudative,
n=18 | P-value |
|---|
| Male (%) | 14 (70.00) | 16 (80.00) | 14 (77.78) | 0.741 |
| Age, years | 53.20±10.30 | 55.70±9.90 | 49.80±15.10 | 0.317 |
| Body mass
index | 23.90±2.80 | 25.10±3.00 | 23.10±1.90 | 0.070 |
| Smoking (%) | 5 (25.00) | 6 (30.00) | 4 (22.22) | 0.856 |
| Alcohol (%) | 3 (15.00) | 5 (25.00) | 4 (22.22) | 0.724 |
| Systolic blood
pressure, mmHg | 130.10±22.00 | 128.50±23.00 | 132.20±22.00 | 0.878 |
| Diastolic blood
pressure, mmHg | 69.60±17.20 | 69.40±10.80 | 70.20±14.50 | 0.985 |
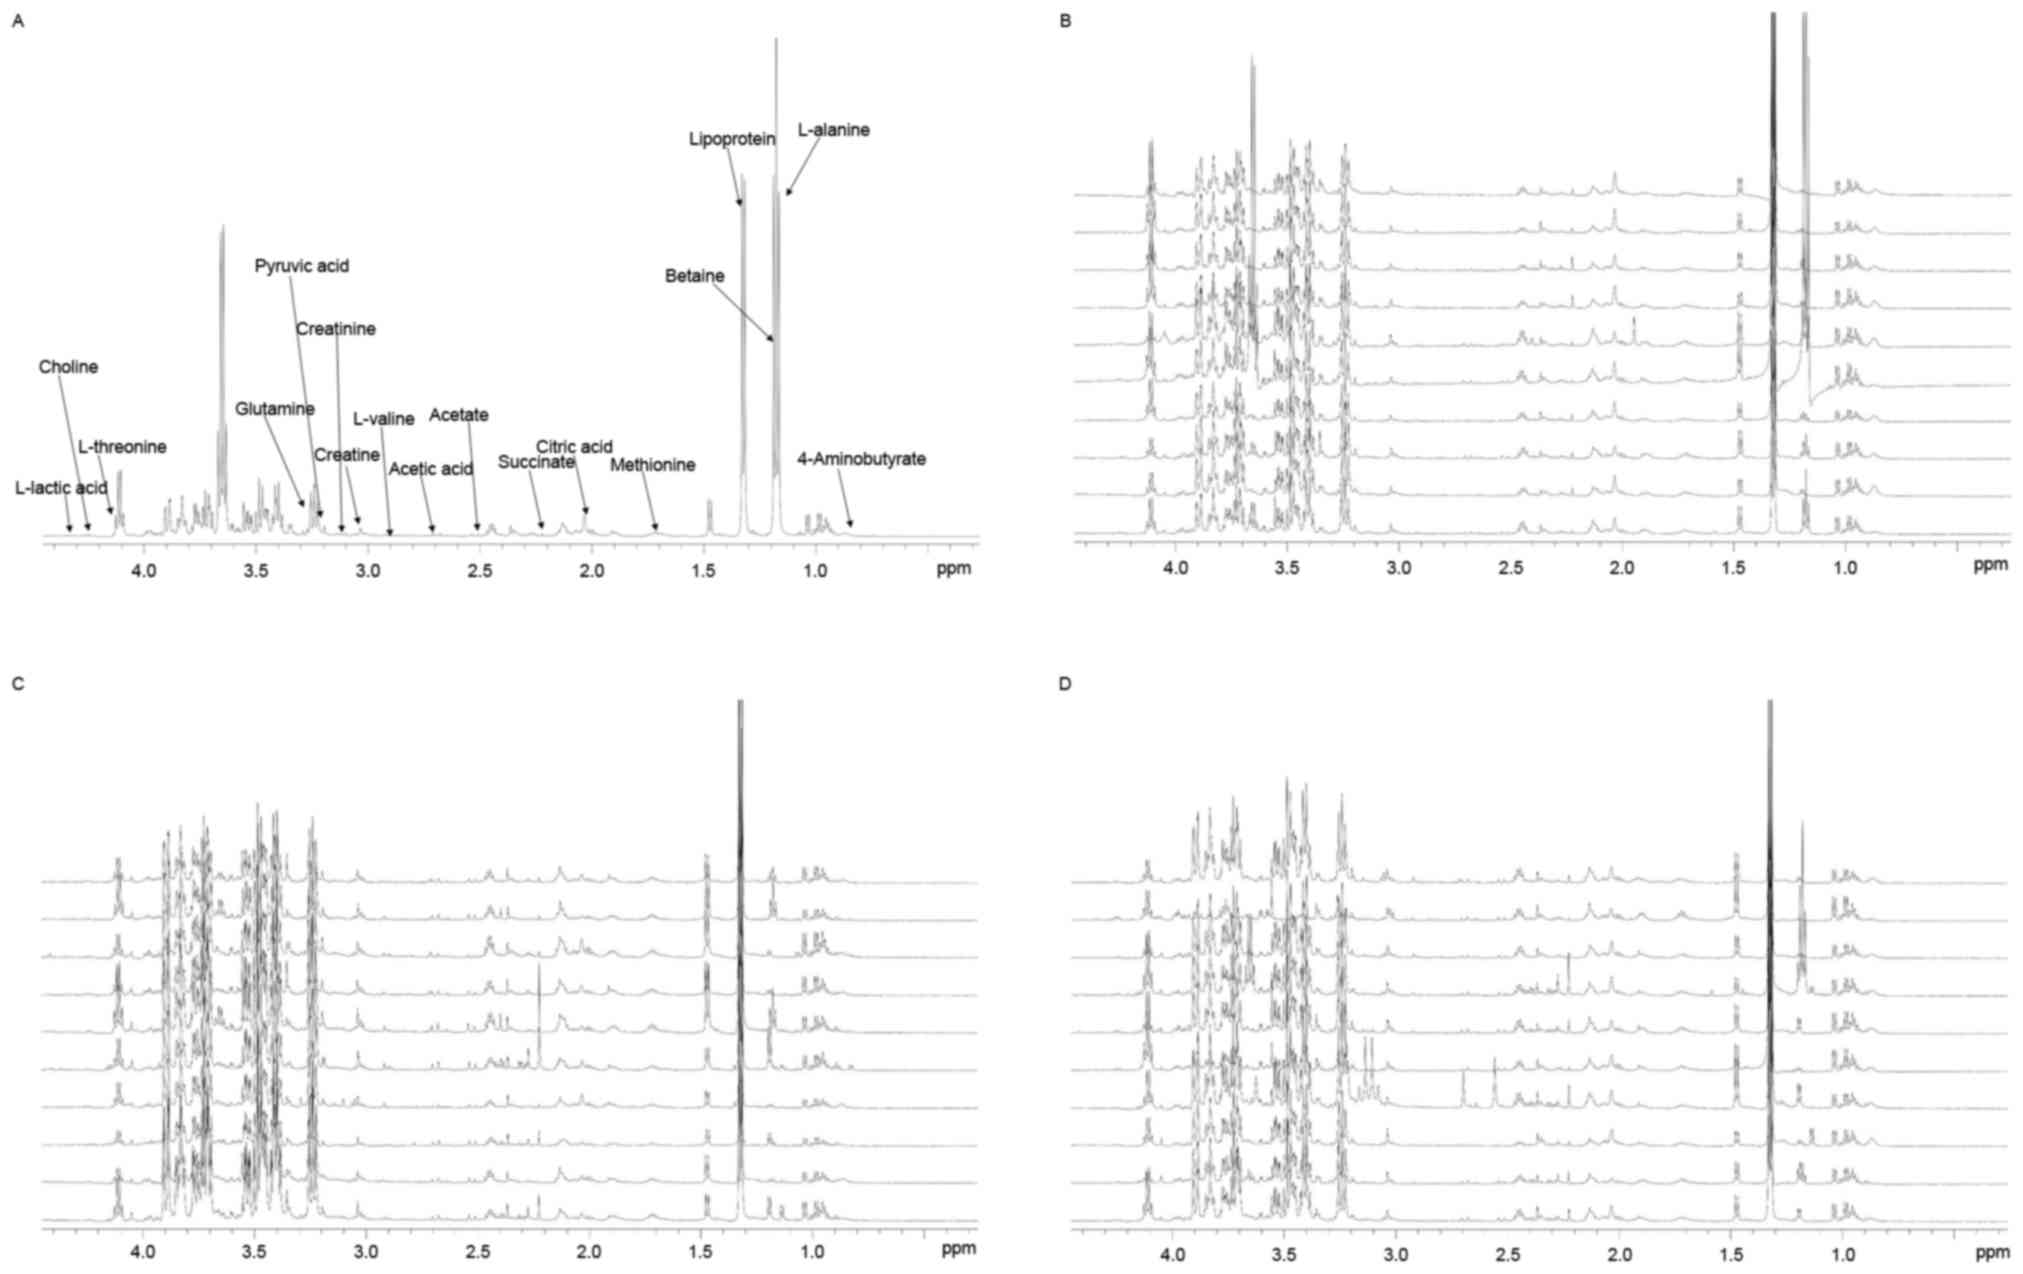
Twenty-six characteristic resonances were observed
in pleural effusion of the T, L and C groups (VIP value >1.0),
and eight significantly altered metabolites were identified in the
pleural effusion. Changes in these metabolites were associated with
the glucose, lipid and amino acid metabolism pathways, some of
which are involved in alanine, glutamate, methionine, choline,
threonine, serine, betaine, lipid, starch, sucrose and pyruvate
metabolism, the citrate cycle, glycolysis, gluconeogenesis and
phospholipid biosynthesis.
Typical 1H-NMR spectra of pleural
effusion samples are presented in (Fig. 1), with the major metabolites in the
integrate regions assigned. The spectra were processed and
converted into 400 integral regions of 0.01 ppm width. The
resonance assignments were made according to published reports and
the Metabolomic Toolbox (21,22).
PLS-DA was used to analyze the 1H-NMR
metabolite profiles, and the separation was readily detected. The
reliability of the established PLS-DA models was evaluated by the
explained variation, R2 and the predicted total
variation, Q2, which is calculated by cross-validation.
The expected R2 and Q2 depend highly on their
application fields, and should be >0.5 and >0.4,
respectively, indicating a significant biological model. In our
established model for pleural effusion of humans, the value of
R2 was >0.7, indicating that the PLS-DA model had
been successfully established (Table
II).
| Table II.Summary of the parameters for
assessing the quality of the partial least squares discriminate
analysis model. |
Table II.
Summary of the parameters for
assessing the quality of the partial least squares discriminate
analysis model.
| Model | Principal
components obtained by cross-validation, n | R2X | R2Y | Q2 |
|---|
| T and L | 100 | 0.226 | 0.983 | 0.768 |
| T and C | 100 | 0.182 | 0.919 | 0.361 |
| L and C | 100 | 0.283 | 0.995 | 0.688 |
The score plots of pleural effusion samples
demonstrated good separation in the T and L groups, the T and C
groups and the L and C groups. Further analysis of the PLS-DA
loading plot indicated that when the variable deviated from the
origin, a higher value of VIP projection was obtained. The
differences in metabolite profiling among the three groups were
important for biomarker identification for diagnosis and therapy.
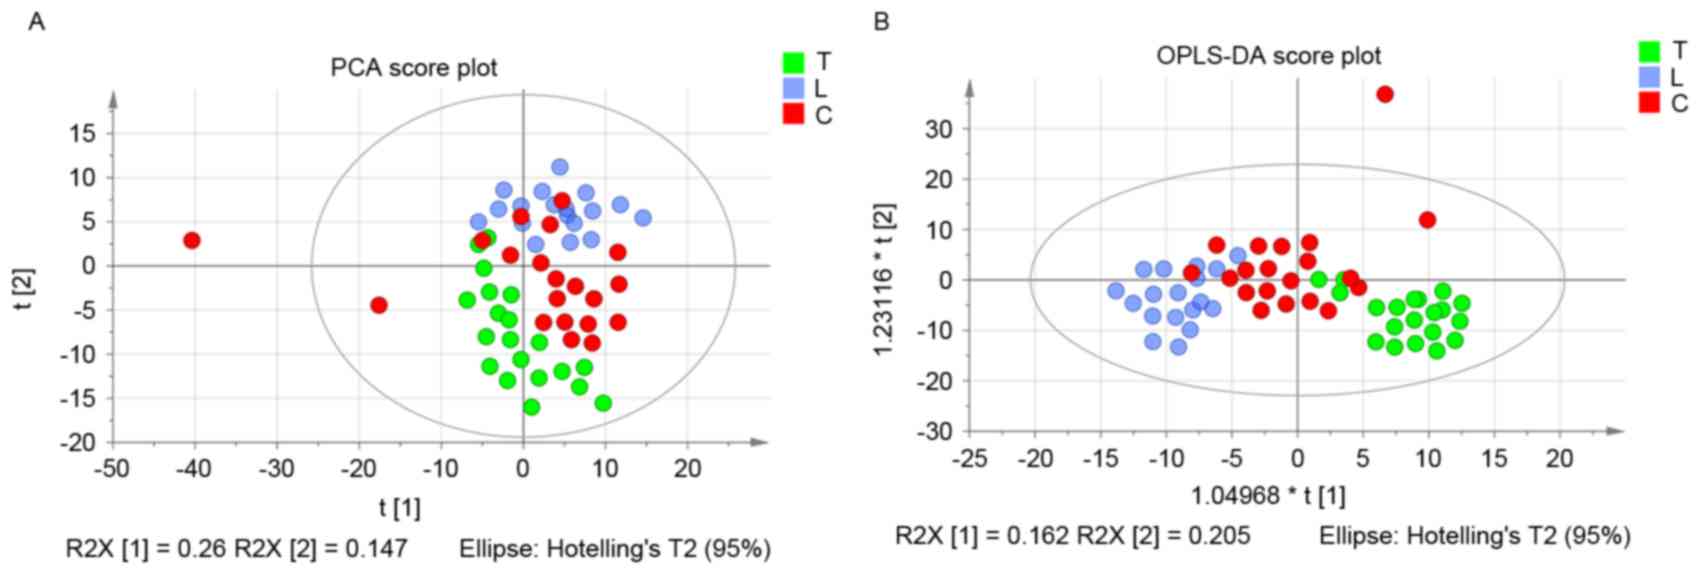
The analysis demonstrated that the metabolites were modified, and
the orthogonal projections to latent structures discriminant
analysis (OPLS-DA) model was subsequently used to investigate the
metabolites that were differentially regulated. As shown in
Fig. 2A, the score plot of
principal component (PC) 1 and PC2 indicated that three groups
could be clearly separated from each other. The statistical
validations of the corresponding OPLS-DA model by permutation
analysis are presented in Fig.
2B.
The parameters for different stages were as follows:
T and L, R2=0.79 and Q2=0.768; T and C,
R2=0.921 and Q2=0.272; and L and C,
R2=0.963 and Q2=0.688. When the VIP value was
>1.0, the variable was considered as a contributor for the
classification of the T and L groups, T and C groups, and L and C
groups. The panel of 26 metabolites with VIP >1 of these three
groups are presented in Table
III.
| Table III.Identified biomarkers from the three
groups. |
Table III.
Identified biomarkers from the three
groups.
| Compound |
1H-nuclear magnetic resonance
spectra (ppm) | Variable
importance |
|---|
| L-lactic acid | 4.28 | 1.948 |
| Fructose | 4.02 | 1.276 |
| L-Serine | 3.96 | 1.274 |
| Tyrosine | 3.95 | 1.034 |
| L-Alanine | 3.76 | 1.361 |
| L-Threonine | 3.59 | 1.131 |
| Betaine | 3.26 | 1.273 |
| Choline | 3.19 | 1.503 |
| Creatinine | 3.10 | 1.059 |
| Creatine | 3.06 | 1.829 |
| Putrescine | 3.04 | 2.206 |
| Aspartate | 2.81 | 1.169 |
| Methionine | 2.64 | 1.592 |
| Pyruvic acid | 2.46 | 1.170 |
| Glutamine | 2.45 | 1.206 |
| L-glutamine | 2.44 | 1.177 |
| Succinate | 2.39 | 1.569 |
| L-glutamic
acid | 2.32 | 1.642 |
|
4-Aminobutyrate | 2.28 | 1.532 |
| L-Valine | 2.27 | 1.438 |
| Low-density
lipoprotein | 1.47 | 1.135 |
| Citric acid | 2.53 | 1.859 |
| Glutamic acid | 2.12 | 1.125 |
| Acetic acid | 1.91 | 1.478 |
| Acetate | 1.90 | 1.166 |
| Ornithine | 1.82 | 1.329 |
The pathway analysis was performed by MetaboAnalyst
2.0 (www.metaboanalyst.ca/MetaboAnalyst) with R version
2.15.0 to identify the most relevant pathwa-ys involved in the
study conditions. To obtain more information on the reference of
these metabolites, the KEGG PATHWAY Database was searched and the
altered metabolites were identified to be predominantly involved in
amino acid metabolism, glycometabolism and lipid metabolism. These
metabolic pathways were detected from the above-mentioned
differentiating metabolites following performance of a pleural
effusion enrichment analysis Fig.
3.
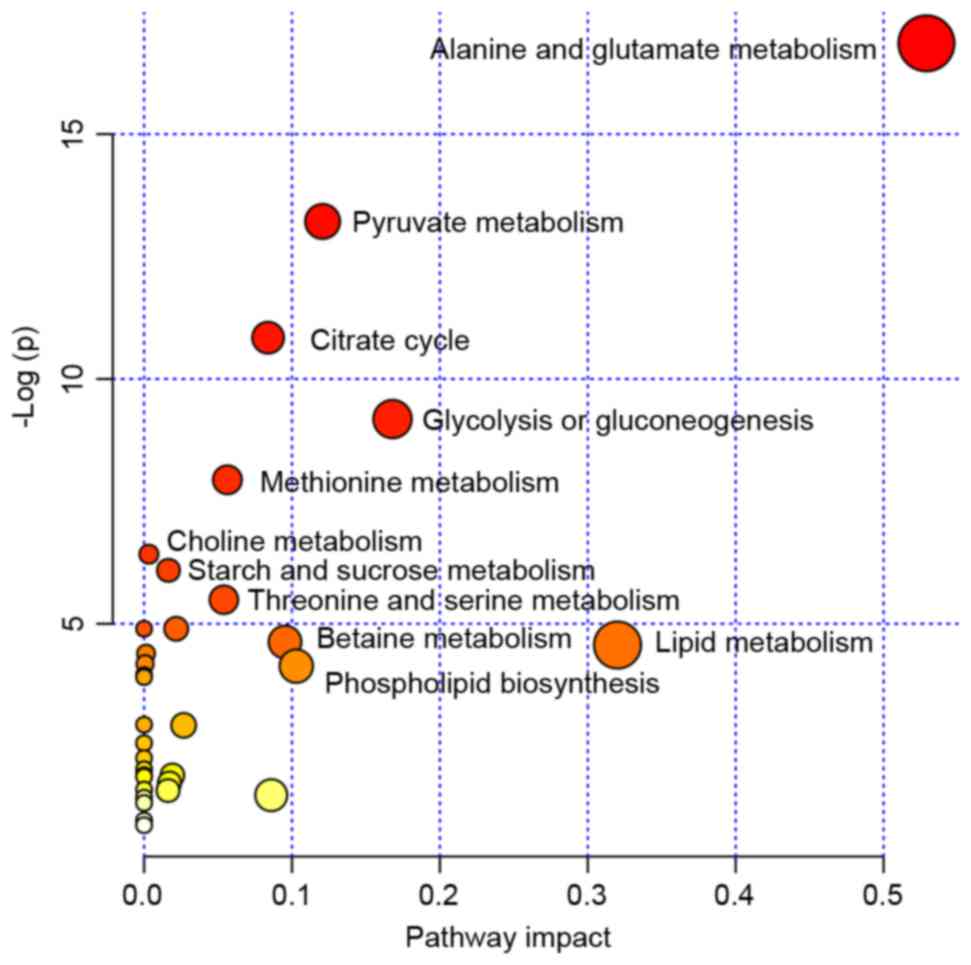 | Figure 3.MSEA was implemented to evaluate
metabolic pathway enrichment among the tuberculous, transudative
and malignant pleural effusion groups. MSEA indicated that the
alanine, glutamate, methionine, choline, threonine, serine,
betaine, lipid, starch, sucrose and pyruvate metabolism, and
citrate cycle, glycolysis, gluconeogenesis and phospholipid
biosynthesis are significantly associated with these diseases.
MSEA, metabolite set enrichment analysis. |
Depending on the result of the homogeneity test for
variance and the underlying statistical distribution, ANOVA was
used to analyze the parameters of L-alanine, citric acid, betaine,
creatine, low-density lipoprotein (LDL), aspartate, pyruvic acid,
glutamine, L-glutamine, succinate, acetate, putrescine and L-lactic
acid (Table IV). For the ANOVA, a
statistically significant difference in the level of L-alanine and
citric acid was observed between the three groups (P<0.05).
Statistically significant differences in the level of creatine, LDL
and L-lactic acid were identified among the three groups
(P<0.01). For the SNK tested, the levels of L-alanine, citric
acid and creatine were lower in tuberculous pleural effusion when
compared with in malignant and transudative pleural effusion
(P<0.05). The LDL level was lower in the transudative pleural
effusion samples when compared with the tuberculous and malignant
pleural effusion samples (P<0.05). No significant differences
were identified in L-alanine, citric acid and creatine levels
between malignant and transudative pleural effusion samples. No
significant difference was identified between tuberculous and
malignant pleural effusion samples for the LDL level, as well as
the level of L-lactic acid between the tuberculous pleural effusion
and the transudative pleural effusion samples.
| Table IV.Statistical results of one way
analysis of variance and SNK. |
Table IV.
Statistical results of one way
analysis of variance and SNK.
|
| Pleural
effusion |
|---|
|
|
|
|---|
| Compound | Tuberculous,
n=20 | Malignant,
n=20 | Transudative,
n=18 | F-value | P-value |
|---|
| L-Alanine |
89.51±19.67a | 108.21±16.04 | 105.90±16.78 | 3.369 | 0.049 |
| Citric acid |
19.42±7.20a | 26.80±6.89 | 24.26±4.73 | 4.165 | 0.027 |
| Betaine | 110.51±19.86 | 130.20±20.40 | 130.22±28.99 | 2.351 | 0.114 |
| Creatine |
3.95±1.22a | 7.67±3.36 | 7.45±3.21 | 5.647 | 0.009 |
| Low-density
lipoprotein | 37.21±4.00 | 37.56±12.25 |
23.11±5.15a | 10.577 | 0.000 |
| Aspartate | 0.77±0.70 | 1.56±1.40 | 1.55±1.19 | 1.599 | 0.221 |
| Pyruvic acid | 21.88±6.60 | 25.18±7.86 | 26.46±9.08 | 0.893 | 0.421 |
| Glutamine | 37.41±11.96 | 45.38±11.36 | 43.90±15.60 | 1.049 | 0.364 |
| L-glutamine | 38.23±13.00 | 47.23±12.14 | 44.75±16.88 | 1.078 | 0.354 |
| Succinate | 5.34±1.72 | 7.45±3.86 | 8.47±2.92 | 2.895 | 0.073 |
| Acetate | 2.94±0.70 | 3.26±1.43 | 3.77±1.08 | 1.397 | 0.265 |
| Putrescine | 13.81±5.67 | 14.88±5.11 | 17.34±5.63 | 1.094 | 0.349 |
| L-lactic acid | 0.09±0.16 |
0.68±0.57a | 0.17±0.24 | 7.567 | 0.002 |
As the parameters did not follow normal
distribution, the K-W test was used (Table V). It is hypothesized that these
data were significantly influenced by the type of disease and,
therefore, did not follow normal distribution. In addition,
statistically significant differences were observed in the level of
L-threonine and acetic acid between the three groups (P<0.05),
and statistically significant differences in the level of
methionine were observed between the three groups (P<0.01). A
significant increase in the level of acetic acid was observed in
malignant pleural effusion patients, as compared with the
tuberculous and transudative pleural effusion subjects. No marked
difference was noted in the acetic acid level of the tuberculous
and transudative pleural effusion groups. The levels of methionine
were significantly lower in the malignant pleural effusion group
when compared with the other groups (P<0.05). However, the level
of L-threonine was significantly increased in the tuberculous
pleural effusion group when compared with transudative pleural
effusion groups (P<0.05). No obvious difference was observed in
the level of L-threonine in the other two groups.
| Table V.Statistical results of Kruskal-Wallis
test. |
Table V.
Statistical results of Kruskal-Wallis
test.
|
| Pleural
effusion |
|---|
|
|
|
|---|
| Compound | Tuberculous,
n=20 | Malignant,
n=20 | Transudative,
n=18 | χ2 | P-value |
|---|
| Fructose | 11.65 | 17.95 | 16.90 | 4.175 | 0.124 |
| L-Serine | 13.80 | 18.60 | 14.10 | 1.866 | 0.393 |
| Tyrosine | 15.10 | 16.90 | 14.50 | 0.403 | 0.818 |
| L-Threonine | 20.90a | 14.90 | 10.70 | 6.782 | 0.034 |
| Creatinine | 18.20 | 10.00 | 18.30 | 5.855 | 0.054 |
| Choline | 20.80 | 11.40 | 14.30 | 5.979 | 0.050 |
| Methionine | 17.00 |
8.80a | 20.70 | 9.572 | 0.008 |
| Acetic acid | 13.60 |
18.20b | 14.70 | 7.760 | 0.020 |
| L-Valine | 20.10 | 13.00 | 13.40 | 4.106 | 0.128 |
| Glutamic acid | 16.00 | 13.50 | 17.00 | 0.839 | 0.657 |
|
4-Aminobutyrate | 20.80 | 11.40 | 14.30 | 2.147 | 0.342 |
| L-glutamic
acid | 19.30 | 11.30 | 15.90 | 4.160 | 0.125 |
| Ornthine | 15.80 | 12.10 | 17.30 | 2.240 | 0.326 |
Discussion
Pleural effusion, which has varied causes, is a
common clinical manifestation (23). TB remains one of the most frequent
causes of pleural effusion, and the pleural form represents 4–10%
of all TB cases (24). Malignant
pleural effusion represents between 15 and 35% of all pleural
effusion cases. Transudative pleural effusion is most often caused
by heart failure (80%) (25).
Patients rarely receive rapid and accurate diagnosis and treatment.
However, with the development and maturation of proteomics, certain
markers have been identified, although there is no uniform criteria
to guide the diagnosis. Additionally, the diagnostic value of a
single marker is limited. In recent years, studies have identified
that the metabolic spectrums of active TB, lung cancer and
tuberculous meningitis patients are specific (26,27),
which provides novel hypotheses for the diagnosis and treatment of
this type of disease. In the current study, eight metabolites were
identified to be altered significantly in the three groups. In the
following discussion, the mechanism underlying the changes in these
prominent metabolites, as well as their potential physiological and
clinical significance are described.
Pathological changes of citric acid
metabolism
Mycobacterium TB is an obligate aerobe, therefore,
it is strongly reliant on the tricarboxylic acid (TCA) cycle to
obtain energy. Citric acid is an important intermediate product of
the TCA cycle, which is catalyzed to isocitric acid by aconitase.
Furthermore, mycobacterium TB is reliant on the glyoxylate cycle as
a source of metabolites and energy. A functional glyoxylate cycle
with its key enzyme, isocitrate lyase is necessary for bacterial
survival. Mycobacterium TB in activated macrophages expresses a
large quantity of isocitrate lyase, which catalyzes isocitrate into
succinate and glyoxylate (28,29).
In the present study, the level of citric acid in tuberculous
pleural effusion was identified to be significantly lower than in
the other groups. The decrease of citric acid in the tuberculous
pleural effusion group may be associated with the above-mentioned
mechanism. As the utilization of citric acid in mycobacterium TB
increased, the level of citric acid was reduced (30).
Citrate synthase, one of the key enzymes in the TCA
cycle, catalyzes the reaction between oxaloacetic acid and acetyl
coenzyme A (CoA) to generate citrate. Increased citrate synthase
has been observed in non-Hodgkin's lymphoma residual disease,
pancreatic cancer, colorectal cancer and ovarian carcinoma
(31–34). Increasing evidence indicates that
citrate synthase activity is closely associated with various types
of cancer (32,34). A recent study hypothesized that
citrate synthase may contribute to the cancer phenotype, as well as
drug resistance and, thus, represent a therapeutic target (34). In this study, the level of citric
acid in the malignant pleural effusion group was significantly
higher when compared with the mycobacterium tuberculous effusion
group. This may be due to the high expression of citrate synthase
in tumor tissue. Lipogenesis is essential to cancer cell survival.
In the fatty acid synthesis pathway, acetyl-CoA is carboxylated to
malonyl-CoA by acetyl-CoA carboxylase. Acetyl-CoA carboxylase, a
key enzyme in fatty acid synthesis, and indicates a possible
connection between lipid synthesis and genetic factors involved in
susceptibility to certain types of cancer (35,36).
Citric acid alters the structure of acetyl-CoA carboxylase to
activate it from monomers to polymers. This process enhances the
catalytic activity of acetyl-CoA carboxylase and creates favorable
conditions for the growth of tumor cells, indicating that citric
acid is required by tumor cells. The effect of citric acid on
acetyl-CoA carboxylase may be associated with the high level of
citric acid in the malignant pleural effusion group in the current
study.
Pathological changes of lactic acid,
creatine and acetic acid metabolism
Tumor cells predominantly produce energy by a high
rate of glycolysis followed by lactic acid fermentation in the
cytosol. Whereas in the majority of normal cells, a comparatively
low rate of glycolysis is followed by oxidation of pyruvate in
mitochondria, even under conditions of sufficient oxygen, which is
termed the Warburg effect (37).
LDH, a key enzyme that catalyzes the transfer of pyruvate to
lactate, is markedly increased in patients with tumors (38). In addition, studies have identified
that in addition to glucose, glutamine is significantly consumed by
the majority of tumor cells and metabolized to alanine, lactate and
ammonium ions (39). The increase
of lactic acid and acetic acid in malignant pleural effusion may be
associated with the following mechanism: The increased lactic acid,
creatine and acetic acid in the tumor tissue causes acidosis, and
acidosis promotes the decomposition of the extracellular matrix and
the formation of angiogenesis, as well as increasing the
proliferation and metastasis of tumor cells (38). Compared with the malignant pleural
effusion group, the lactate, creatine and acetic levels of the
tuberculous pleural effusion group were lower. This may be due to
various reasons. Firstly, mycobacterium TB is an obligate aerobe;
therefore, it predominantly produces energy via the TCA cycle. In
addition, many Bacillus, similar to prokaryotic microorganisms, use
glucose, fructose, lactose and organic acids (such as acetic acid,
pyruvate and lactate) as their energy and carbon sources.
Pathological changes of lipid
metabolism
The lipid of mycobacterium TB accounts for 20–40% of
the dry weight of bacteria, and 60% of the dry weight of the cell
wall. Mycobacterium TB and other mycobacteria have a distinct cell
wall, which has a lipid-rich outer layer. Acylated trehaloses,
trehalose dimycolate and trehalose monomycolate (well characterized
mycobacterium TB virulence factors) are abundant in the
mycobacterial cell wall (40).
Mycolic acids are vital components of mycobacterium TB. The
biosynthesis of mycolic acids is linked to the activity of fatty
acid synthases (41). Cholesterol
is an important nutrient for mycobacterium TB. The catabolism of
cholesterol has multiple functions during macrophage infection; it
is used to supply carbon to the central metabolism of mycobacterium
TB as succinate and pyruvate. It is also involved in the modulation
of intracellular trafficking and immune signaling (42,43).
Peroxisome proliferator-activated receptor γ (PPARγ) is a member of
the lipid-activated nuclear receptor family and has been
demonstrated to function as a key transcriptional regulator of
lipid metabolism in macrophages, dendritic cells, and T and B cells
(44). The PPARγ transcription
factor directly regulates the expression of various genes
participating in fatty acid uptake, lipid storage, and inflammatory
response. Previous studies demonstrated that the mycobacterium
infection induces the expression and activation of PPARγ (45).
In the current study, the lipid levels in
tuberculous pleural effusion samples were significantly higher than
in the transudative pleural effusion samples, which may be
associated with the large number of lipids in TB bacteria. However,
compared with malignant pleural effusion, the lipid levels in
tuberculous pleural effusion were not significantly different. This
may be associated with the lipid content in tumors; it has been
identified that the content of lipid increases in the majority of
tumors (46). The present study
indicates that the pleural effusion of patients with pulmonary TB
demonstrates lipid metabolism disorders. The present microbiology
studies demonstrated that the fatty acid composition in the
bacterial cell structure is highly homologous to the DNA of the
bacteria. The characteristics of fatty acids, such as type and
quantity, provide the basis for the identification of mycobacterium
species (47).
Pathological changes of amino acid
metabolism
Oxygen saturation decreases and the energy consumed
by the maintenance of breathing increases in patients with severe
pulmonary TB and pulmonary dysfunction. When the energy intake is
insufficient, mytolin is decomposed into amino acids, such as
threonine, that are used for gluconeogenesis. In the current study,
the increase of threonine in tuberculous pleural effusion may be
released from other tissue in order to meet the requirement of
tubercle bacillus. Threonine is an essential amino acid, which is
involved in the composition of the immune system. As patients
suffer from inflammation, the demand for threonine increases, which
has an anti-oxidative effect. Furthermore, the activation of T
cells requires different types of amino acid. The mycobacterium TB
genome has a number of genes, which encode proteins associated with
antigen variation and immune evasion. Different types of bacteria
use different amino acids as sources of nitrogen, carbon and
energy. In the tuberculous pleural effusion group, the level of
threonine significantly increased, indicating an amino acid
metabolism disorder which may block threonine metabolism. The
increased threonine may additionally be produced by mycobacterium
TB. The specific mechanism requires further investigation.
Establishing the amino acid status of TB patients provides the
basis for differential diagnosis, facilitates nutritional support
therapy and enhances the immune system of patients.
Patients with cancer are characterized by increased
energy consumption, negative nitrogen balance, increased glutamine
utilization and amino acid metabolism disorders. In the malignant
transformation of tumor tissues, the dynamic changes in tumor cells
lead to the occurrence of amino acid metabolic defects. It was
found that the tumor cells selectively absorb certain amino acids
in the plasma, which meet their growth requirement, and leads to
the disordered amino acid metabolism. Tumors utilize branched chain
amino acids for protein synthesis and may oxidize them either
partially or completely. Weight loss and malnutrition are among the
most common features observed in cancer patients experiencing
prolonged catabolic stress. Numerous studies focus on the concept
of imbalanced amino acid therapy, which alters the proportion of
certain amino acid supplies, resulting in synthesis and metabolism
disorders of proteins in tumors and typically favors the host
(48,49). Furthermore, many studies aim to
establish anti-tumor drugs that are more efficient and less toxic.
In a previous study, amino acids, which are required by malignant
tumor cells, were included in the anti-tumor medicine to increase
the efficacy of these medicines (50). In the present study, decreased
methionine in malignant pleural effusion samples may have been
associated with the increased oxidation of amino acids, which is a
metabolic response that compensates for the increased energy
expenditure and glutamine consumption. In addition, treatments
(particularly chemotherapy treatments) may alter amino acid supply
and demand (48). Furthermore,
disordered amino acid metabolism may depend on specific tumor type
and physiological characteristics, including synthetic rate, volume
of tumor, and rate of proliferation (48). The potential role of amino acid
metabolism in malignant pleural effusion remains unclear, thus, the
specific mechanism requires further investigation.
In conclusion, 1H-NMR-based metabolomic
analysis provides a platform for the identification of small
molecule metabolite spectrums and biomarker metabolites, as well as
associated pathophysiologic and molecular biological pathways in
TB, malignant and transudative pleural effusion. The current
results indicated the 1H-NMR-based metabolite profiling
is promising for differentiating TB, malignant and transudative
pleural effusion, which exhibit morphological similarity. The
findings provide novel insights into the underlying mechanisms of
these diseases, and may offer further avenues for diagnosis and
therapeutic strategies.
Acknowledgements
The authors would like to thank the clinical staff
of the Second Department of Respiratory Medicine in the First
Affiliated Hospital of Kunming Medical University (Kunming, China),
for their care of the study subjects and support with pleural
effusion sample collection. The authors are grateful to Dr Yan Li
and the staff at Fan-Xing Biological Technology Research Laboratory
(Beijing, China) for their assistance with the experiment.
References
|
1
|
Maskell N: British Thoracic Society
Pleural Disease Guideline Group: British thoracic society pleural
disease guidelines-2010 update. Thorax. 65:667–669. 2010.
View Article : Google Scholar : PubMed/NCBI
|
|
2
|
Light RW: Clinical practice: Pleural
effusion. N Engl J Med. 346:1971–1977. 2002. View Article : Google Scholar : PubMed/NCBI
|
|
3
|
Daniil ZD, Zintzaras E, Kiropoulos T,
Papaioannou AI, Koutsokera A, Kastanis A and Gourgoulianis KI:
Discrimination of exudative pleural effusions based on multiple
biological parameters. Eur Respir J. 30:957–964. 2007. View Article : Google Scholar : PubMed/NCBI
|
|
4
|
World Health Organization, . Global
Tuberculosis report. Geneva, Switzerland: 2015
|
|
5
|
Light RW: Update on tuberculous pleural
effusion. Respirology. 15:451–458. 2010. View Article : Google Scholar : PubMed/NCBI
|
|
6
|
Dodd PJ, Gardiner E, Coghlan R and Seddon
JA: Burden of childhood tuberculosis in 22 high-burden countries: A
mathematical modelling study. Lancet Glob Health. 2:e453–e459.
2014. View Article : Google Scholar : PubMed/NCBI
|
|
7
|
Nicholson JK, Lindon JC and Holmes E:
‘Metabonomics’: Understanding the metabolic responses of living
systems to pathophysiological stimuli via multivariate statistical
analysis of biological NMR spectroscopic data. Xenobiotica.
29:1181–1189. 1999. View Article : Google Scholar : PubMed/NCBI
|
|
8
|
Schmidt CW: Metabolomics: What's happening
downstream of DNA. Environ Health Perspect. 112:A410–A415. 2004.
View Article : Google Scholar : PubMed/NCBI
|
|
9
|
Illig T, Gieger C, Zhai G, Römisch-Margl
W, Wang-Sattler R, Prehn C, Altmaier E, Kastenmüller G, Kato BS,
Mewes HW, et al: A genome-wide perspective of genetic variation
inhuman metabolism. Nat Genet. 42:137–141. 2010. View Article : Google Scholar : PubMed/NCBI
|
|
10
|
Yang J, Xu G, Zheng Y, Kong H, Pang T, Lv
S and Yang Q: Diagnosis of liver cancer using HPLC-based
metabonomics avoiding false-positive result from hepatitis and
hepatocirrhosis diseases. J Chromatogr B Analyt Technol Biomed Life
Sci. 813:59–65. 2004. View Article : Google Scholar : PubMed/NCBI
|
|
11
|
Chen J, Zhang X, Cao R, Lu X, Zhao S,
Fekete A, Huang Q, Schmitt-Kopplin P, Wang Y, Xu Z, et al: Serum
27-nor-5β-cholestane-3,7,12,24,25 pentol glucuronide discovered by
metabolomics as potential diagnostic biomarker for epithelium
ovarian cancer. J Proteome Res. 10:2625–2632. 2011. View Article : Google Scholar : PubMed/NCBI
|
|
12
|
Hodavance MS, Ralston SL and Pelczer I:
Beyond blood sugar: The potential of NMR-based metabonomics for
type 2 human diabetes, and the horse as a possible model. Anal
Bioanal Chem. 387:533–537. 2007. View Article : Google Scholar : PubMed/NCBI
|
|
13
|
Mäkinen VP, Soininen P, Forsblom C,
Parkkonen M, Ingman P, Kaski K, Groop PH and Ala-Korpela M:
FinnDiane Study Group: Diagnosing diabetic nephropathy by 1H NMR
metabonomics of serum. Magma. 19:281–296. 2006. View Article : Google Scholar : PubMed/NCBI
|
|
14
|
Messana I, Forni F, Ferrari F, Rossi C,
Giardina B and Zuppi C: Proton nuclear magnetic resonance spectral
profiles of urine in type II diabetic patients. Clin Chem.
44:1529–1534. 1998.PubMed/NCBI
|
|
15
|
Brindle JT, Nicholson JK, Schofield PM,
Grainger DJ and Holmes E: Application of chemometrics to 1H NMR
spectroscopic data to investigate a relationship between human
serum metabolic profiles and hypertension. Analyst. 128:32–36.
2003. View
Article : Google Scholar : PubMed/NCBI
|
|
16
|
Brindle JT, Antti H, Holmes E, Tranter G,
Nicholson JK, Bethell HW, Clarke S, Schofield PM, McKilligin E,
Mosedale DE and Grainger DJ: Rapid and noninvasive diagnosis of the
presence and severity of coronary heart disease using 1H-NMR-based
metabonomics. Nat Med. 8:1439–1444. 2002. View Article : Google Scholar : PubMed/NCBI
|
|
17
|
Sabatine MS, Liu E, Morrow DA, Heller E,
Mc Carroll R, Wiegand R, Berriz GF, Roth FP and Gerszten RE:
Metabolonmic identification of novel biomarkers of myocardial
ischemia. Circulation. 112:3868–3875. 2005. View Article : Google Scholar : PubMed/NCBI
|
|
18
|
Barba I, de León G, Martín E, Cuevas A,
Aguade S, Candell-Riera J, Barrabés JA and Garcia-Dorado D: Nuclear
magnetic resonance-based metabolomics predicts exercise-induced
ischemia in patients with suspected coronary artery disease. Magn
Reson Med. 60:27–32. 2008. View Article : Google Scholar : PubMed/NCBI
|
|
19
|
Sun L, Hu W, Liu Q, Hao Q, Sun B, Zhang Q,
Mao S, Qiao J and Yan X: Metabonomics reveals plasma metabolic
changes and inflammatory marker in polycystic ovary syndrome
patients. J Proteome Res. 11:2937–2946. 2012. View Article : Google Scholar : PubMed/NCBI
|
|
20
|
Zheng P, Gao HC, Li Q, Shao WH, Zhang ML,
Cheng K, Yang DY, Fan SH, Chen L, Fang L and Xie P: Plasma
metabonomics as novel diagnostic approach for major depressive
disorder. J Proteome Res. 11:1741–1748. 2012. View Article : Google Scholar : PubMed/NCBI
|
|
21
|
Xia J, Mandal R, Sinelnikov IV, Broadhurst
D and Wishart DS: MetaboAnalyst 2.0-a comprehensive server for
metabolomic data analysis. Nucleic Acids Res. 40:W127–W133. 2012.
View Article : Google Scholar : PubMed/NCBI
|
|
22
|
Xia J and Wishart DS: Metabolomic data
processing, analysis, and interpretation using MetaboAnalyst. Curr
Protoc Bioinformatics Chapter. 14:Unit 14.102011.
|
|
23
|
Yang WB, Liang QL, Ye ZJ, Niu CM, Ma WL,
Xiong XZ, Du RH, Zhou Q, Zhang JC and Shi HZ: Cell origins and
diagnostic accuracy of interleukin 27 in pleural effusions. PLoS
One. 7:e404502012. View Article : Google Scholar : PubMed/NCBI
|
|
24
|
Dong X and Yang J: High IL-35 pleural
expression in patients with tuberculous pleural effusion. Med Sci
Monit. 21:1261–1268. 2015. View Article : Google Scholar : PubMed/NCBI
|
|
25
|
Garrido V Villena, Viedma E Cases,
Fernández Villar A, de Pablo Gafas A, Pérez Rodríguez E, Pérez JM
Porcel, Rodríguez Panadero F, Martínez C Ruiz, Velázquez A
Salvatierra and Valdés Cuadrado L: Recommendations of diagnosis and
treatment of pleural effusion. Update. Arch Bronconeumol.
50:235–249. 2014.(In English, Spanish). View Article : Google Scholar
|
|
26
|
Frediani JK, Jones DP, Tukvadze N, Uppal
K, Sanikidze E, Kipiani M, Tran VT, Hebbar G, Walker DI, Kempker
RR, et al: Plasma metabolomics in human pulmonary tuberculosis
disease: A pilot study. PLoS One. 9:e1088542014. View Article : Google Scholar : PubMed/NCBI
|
|
27
|
Deja S, Porebska I, Kowal A, Zabek A, Barg
W, Pawelczyk K, Stanimirova I, Daszykowski M, Korzeniewska A,
Jankowska R and Mlynarz P: Metabolomics provide new insights on
lung cancer staging and discrimination from chronic obstructive
pulmonary disease. J Pharm Biomed Anal. 100:369–380. 2014.
View Article : Google Scholar : PubMed/NCBI
|
|
28
|
Nandakumar M, Nathan C and Rhee KY:
Isocitrate lyase mediates broad antibiotic tolerance in
Mycobacterium tuberculosis. Nat Commun. 5:43062014. View Article : Google Scholar : PubMed/NCBI
|
|
29
|
Eoh H and Rhee KY: Multifunctional
essentiality of succinate metabolism in adaptation to hypoxia in
Mycobacterium tuberculosis. Proc Natl Acad Sci USA. 110:6554–6559.
2013. View Article : Google Scholar : PubMed/NCBI
|
|
30
|
Micklinghoff JC, Breitinger KJ, Schmidt M,
Geffers R, Eikmanns BJ and Bange FC: Role of the transcriptional
regulator RamB (Rv0465c) in the control of the glyoxylate cycle in
Mycobacterium tuberculosis. J Bacteriol. 191:7260–7269. 2009.
View Article : Google Scholar : PubMed/NCBI
|
|
31
|
Kusao I, Troelstrup D and Shiramizu B:
Possible mitochondria-associated enzymatic role in Non-Hodgkin
lymphoma residual disease. Cancer Growth Metastasis. 1:3–8.
2008.PubMed/NCBI
|
|
32
|
Schlichtholz B, Turyn J, Goyke E,
Biernacki M, Jaskiewicz K, Sledzinski Z and Swierczynski J:
Enhanced citrate synthase activity in human pancreatic cancer.
Pancreas. 30:99–104. 2005. View Article : Google Scholar : PubMed/NCBI
|
|
33
|
Qiu Y, Cai G, Su M, Chen T, Liu Y, Xu Y,
Ni Y, Zhao A, Cai S, Xu LX and Jia W: Urinary metabonomic study on
colorectal cancer. J Proteome Res Mar. 9:1627–1634. 2010.
View Article : Google Scholar
|
|
34
|
Chen L, Liu T, Zhou J, Wang Y, Wang X, Di
W and Zhang S: Citrate synthase expression affects tumor phenotype
and drug resistance in human ovarian carcinoma. PLoS One.
9:e1157082014. View Article : Google Scholar : PubMed/NCBI
|
|
35
|
Chajès V, Cambot M, Moreau K, Lenoir GM
and Joulin V: Acetyl-CoA carboxylase alpha is essential to breast
cancer cell survival. Cancer Res. 66:5287–5294. 2006. View Article : Google Scholar : PubMed/NCBI
|
|
36
|
Brusselmans K, de Schrijver E, Verhoeven G
and Swinnen JV: RNA interference-mediated silencing of the
acetyl-CoA-carboxylase-α gene induces growth inhibition and
apoptosis of prostate cancer cells. Cancer Res. 65:6719–6725. 2005.
View Article : Google Scholar : PubMed/NCBI
|
|
37
|
Warburg O: On the origin of cancer cells.
Science. 123:309–314. 1956. View Article : Google Scholar : PubMed/NCBI
|
|
38
|
Kayser G, Kassem A, Sienel W,
Schulte-Uentrop L, Mattern D, Aumann K, Stickeler E, Werner M,
Passlick B and zur Hausen A: Lactate-dehydrogenase 5 is
overexpressed in non-small cell lung cancer and correlates with the
expression of the transketolase-like protein 1. Diagn Pathol.
5:222010. View Article : Google Scholar : PubMed/NCBI
|
|
39
|
Chen JQ and Russo J: Dysregulation of
glucose transport, glycolysis, TCA cycle and glutaminolysis by
oncogenes and tumor suppressors in cancer cells. Biochim Biophys
Acta. 1826:370–384. 2012.PubMed/NCBI
|
|
40
|
Gilmore SA, Schelle MW, Holsclaw CM, Leigh
CD, Jain M, Cox JS, Leary JA and Bertozzi CR: Sulfolipid-1
biosynthesis restricts Mycobacterium tuberculosis growth in human
macrophages. ACS Chem Biol. 7:863–870. 2012. View Article : Google Scholar : PubMed/NCBI
|
|
41
|
Brown AK, Bhatt A, Singh A, Saparia E,
Evans AF and Besra GS: Identification of the dehydratase component
of the mycobacterial mycolic acid-synthesizing fatty acid
synthase-II complex. Microbiology. 153:4166–4173. 2007. View Article : Google Scholar : PubMed/NCBI
|
|
42
|
Klink M, Brzezinska M, Szulc I, Brzostek
A, Kielbik M, Sulowska Z and Dziadek J: Cholesterol oxidase is
indispensable in the pathogenesis of Mycobacterium tuberculosis.
PLoS One. 8:e733332013. View Article : Google Scholar : PubMed/NCBI
|
|
43
|
Ouellet H, Johnston JB and de Montellano
PR: Cholesterol catabolism as a therapeutic target in Mycobacterium
tuberculosis. Trends Microbiol. 19:530–539. 2011. View Article : Google Scholar : PubMed/NCBI
|
|
44
|
Szatmari I and Nagy L: Nuclear receptor
signalling in dendritic cells connects lipids, the genome and
immune function. EMBO J. 27:2353–2362. 2008. View Article : Google Scholar : PubMed/NCBI
|
|
45
|
Almeida PE, Silva AR, Maya-Monteiro CM,
Töröcsik D, D'Avila H, Dezsö B, Magalhães KG, Castro-Faria-Neto HC,
Nagy L and Bozza PT: Mycobacterium bovis bacillus Calmette-Guérin
infection induces TLR2-dependent peroxisome proliferator-activated
receptor gamma expression and activation: Functions in
inflammation, lipid metabolism, and pathogenesis. J Immunol.
183:1337–1345. 2009. View Article : Google Scholar : PubMed/NCBI
|
|
46
|
Chen W, Zu Y, Huang Q, Chen F, Wang G, Lan
W, Bai C, Lu S, Yue Y and Deng F: Study on metabonomic
characteristics of human lung cancer using high resolution
magic-angle spinning 1H NMR spectroscopy and multivariate data
analysis. Magn Reson Med. 66:1531–1540. 2011. View Article : Google Scholar : PubMed/NCBI
|
|
47
|
Collins MD, Goodfellow M and Minnikin DE:
Fatty acid composition of some mycolic acid-containing coryneform
bacteria. J Gen Microbiol. 128:2503–2509. 1982.PubMed/NCBI
|
|
48
|
Baracos VE and Mackenzie ML:
Investigations of branched-chain amino acids and their metabolites
in animal models of cancer. J Nutr. 136 Suppl 1:S237–S242.
2006.
|
|
49
|
Choudry HA, Pan M, Karinch AM and Souba
WW: Branched-chain amino acid-enriched nutritional support in
surgical and cancer patients. J Nutr. 136 Suppl 1:S314–S318.
2006.
|
|
50
|
Liu B, Cui C, Duan W, Zhao M, Peng S, Wang
L, Liu H and Cui G: Synthesis and evaluation of anti-tumor
activities of N4 fatty acyl amino acid derivatives of
1-beta-arabinofuranosylcytosine. Eur Med Chem. 44:3596–3600. 2009.
View Article : Google Scholar
|