Introduction
It was estimated that there were ~14 million new
cancer cases in 2012 and the number is expected to rise to 22
million in the next two decades (1). Cancer-associated mortality,
meanwhile, was ~8.2 million in 2012 and is predicted to rise to 13
million by 2032 (1). Thus, an
improved understanding of the pathogenic mechanisms of cancer is of
great importance. At present, it is widely accepted that cancer is
a multifactorial and complex disease resulting from interaction
between environmental and genetic factors (2).
Single nucleotide polymorphisms (SNPs) are
frequently occurring variations in the human genome, and have been
extensively investigated in genetic studies of cancer. Recent
studies have demonstrated that SNPs of multiple genes may have an
important role in cancer occurrence and progression (3). In addition, numerous publications
have reported that cytokine gene polymorphisms may affect
inflammatory-related pathways, and influence susceptibility to
different types of cancer (4,5).
Interleukin-4 (IL-4) is a potent regulator of antitumor immune
responses with both tumor-promoting and tumor-inhibiting
properties, since it has both immunosuppressive and anti-angiogenic
functions (6–9). Consequently, certain genetic
polymorphisms of IL-4 gene are considered as good candidates for
cancer susceptibility prediction. To date, several studies have
aimed to assess the potential association of IL-4 polymorphisms
rs2243250 [-590C to T, 5′untranslated region (UTR)], rs2070874
(−34C to T, 5′ UTR) and rs79071878 (intron-3, 70 bp variable number
tandem repeat, VNTR) with cancer risk, but the results remain
inconsistent. Therefore, a meta-analysis was performed in the
present study in order to better elucidate the roles of IL-4 gene
polymorphisms in the occurrence and progression of cancer.
Materials and methods
Study identification and
selection
Potentially relevant articles were independently
identified by three investigators from the Medline (http://www.medline.com/), PubMed (https://www.ncbi.nlm.nih.gov/pubmed), Embase
(https://www.embase.com) and China National
Knowledge Infrastructure databases (http://www.cnki.net/). The searching terms were as
follows: (Interleukin-4 OR IL-4 OR Interleukin 4 OR IL 4) AND
(polymorphism OR variant OR genotype OR allele) AND (cancer OR
tumor OR carcinoma OR neoplasm). In addition, the reference lists
of retrieved articles were searched manually for additional
eligible studies. Among studies with overlapping data published by
the same authors, only the most recent and complete study was
included in the present meta-analysis.
Inclusion and exclusion criteria
The following inclusion criteria were used to select
eligible articles: i) Case-control study of cancer cases and
healthy controls; ii) investigate the relationship between IL-4
gene polymorphisms and cancer risk; iii) provide both genotype and
allele distributions inpatients and controls; iv) full text in
English or Chinese available. Articles were excluded if: i) The
study was duplicated; ii) the analyses were based on linkage
considerations; iii) the report was not original (reviews or
meta-analyses).
Data extraction and quality
assessment
The following information was extracted from all
included studies independently by two authors: i) Name of the first
author; ii) year of publication; iii) country in which the study
was conducted; iv) ethnicity of study population; v) cancer type;
vi) allele and genotype frequencies of IL-4 gene polymorphisms in
cases and controls; vii) P-value of Hardy-Weinberg equilibrium
(HWE) in the control group. The Newcastle-Ottawa quality assessment
scale was used to evaluate the quality of all included studies
(10). This rating scale has a
score range of 0 to 9, and studies with scores >7 were assumed
to be of high quality. Two reviewers performed data extraction and
quality assessment independently. When necessary, the reviewers
wrote to the corresponding authors for extra information or raw
data. Disagreements between reviewers were resolved by discussion
until a consensus was achieved. The final results were reviewed by
a senior reviewer.
Statistical analysis
All statistical analyses were performed with Review
Manage version 5.3 (Cochrane, London, United Kingdom). HWE in the
control group was estimated using the χ2test. Odds
ratios (ORs) and 95% confidence intervals (CIs) were used to
evaluate the strength of the associations between IL-4 gene
polymorphisms and cancer susceptibility. In addition, heterogeneity
among studies was assessed using the Q test and I2
statistics. When the probability value (P-value) of Q test was
<0.1 or I2 was >50%, inter-study heterogeneity was
considered to be significant, and the random-effects model (REM)
was employed for analyses. Otherwise, the fixed-effect model (FEM)
was applied for analyses. First, associations based on all study
subjects were analyzed, and then subgroup analyses by cancer type
and ethnicity were performed to obtain the cancer type-specific
effects and the ethnic-specific effects of IL-4 polymorphisms.
Sensitivity analyses were conducted by sequentially omitting one
individual study each time to assess the stability of the results.
Furthermore, the possible publication bias was evaluated by using
funnel plots (data not shown).
Results
Characteristics of eligible
studies
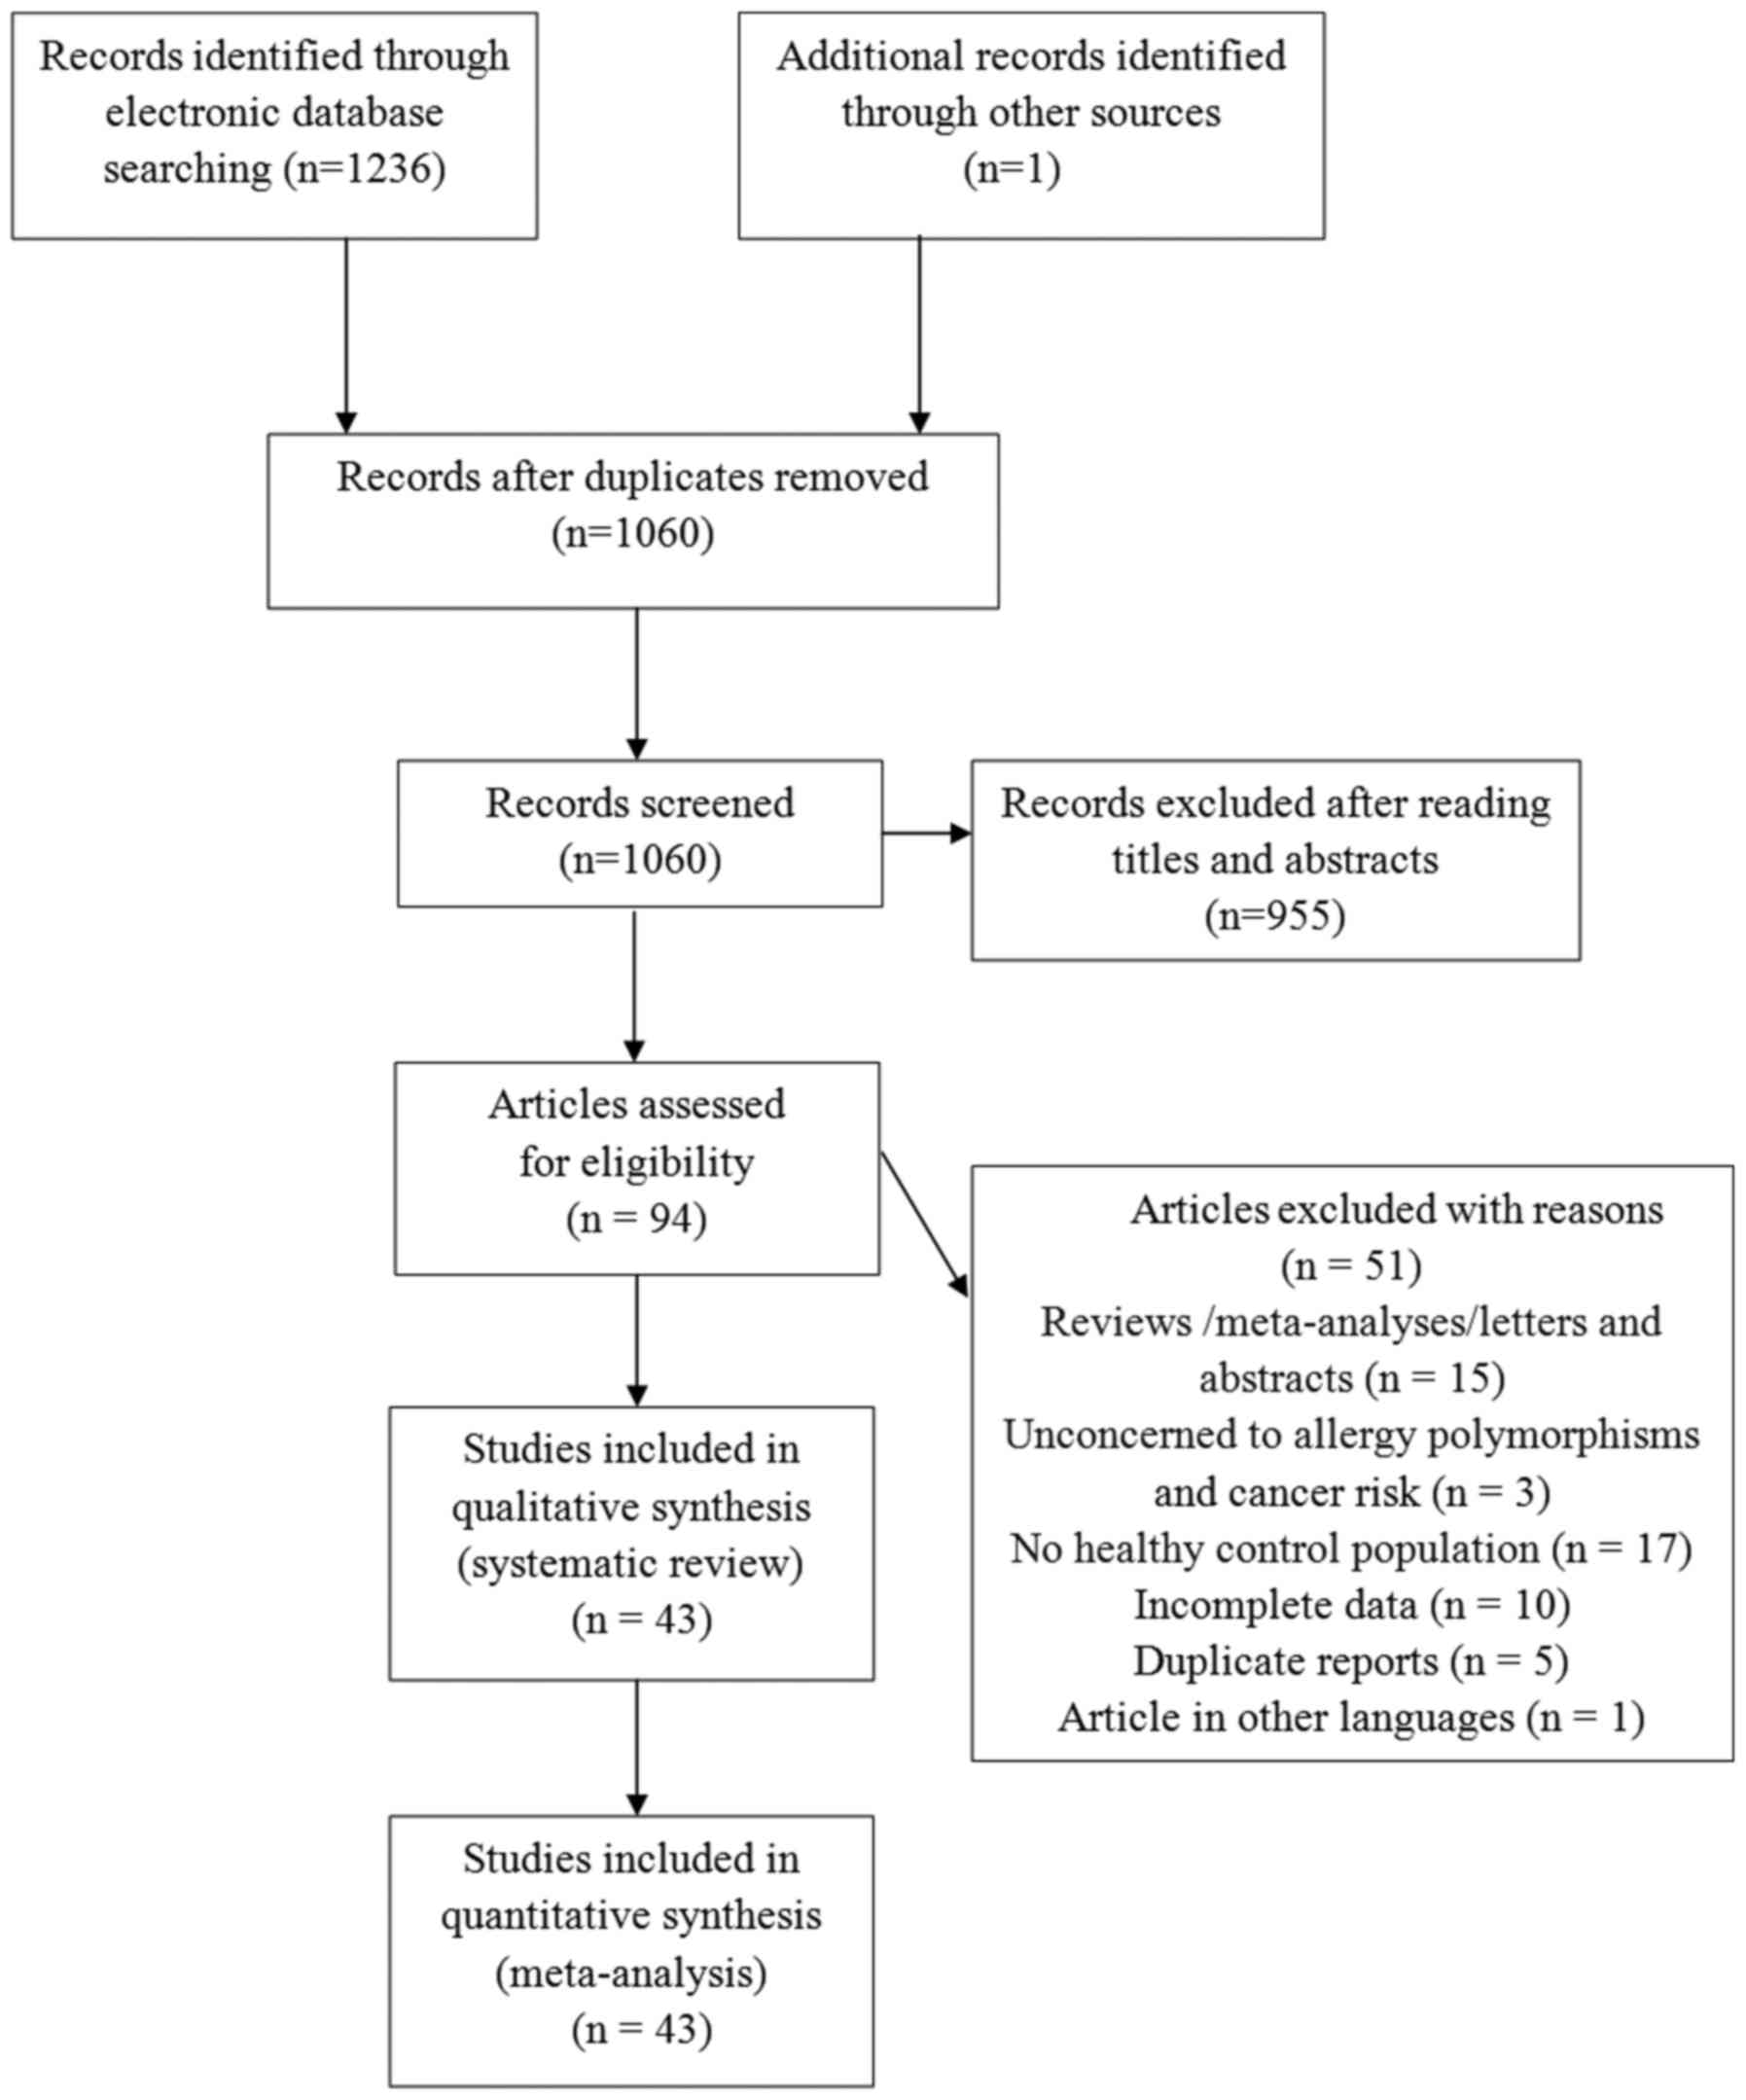
The literature search identified 1,237 eligible
articles. After reading titles and abstracts, a total of 94
articles were selected for further evaluation. Amongst these, 51
articles were excluded based on the inclusion and exclusion
criteria, as described in the Methods. Finally, 43 articles
(11–53), 33 studies focusing on polymorphism
rs2243250, 11 studies onrs2070874, and 10 studies on rs79071878,
were included in the meta-analysis. The majority of the articles
were published in English, except for three that were published in
Chinese. A schematic of the selection process is illustrated in
Fig. 1.
IL-4 rs2243250 polymorphism and the
risk of cancer
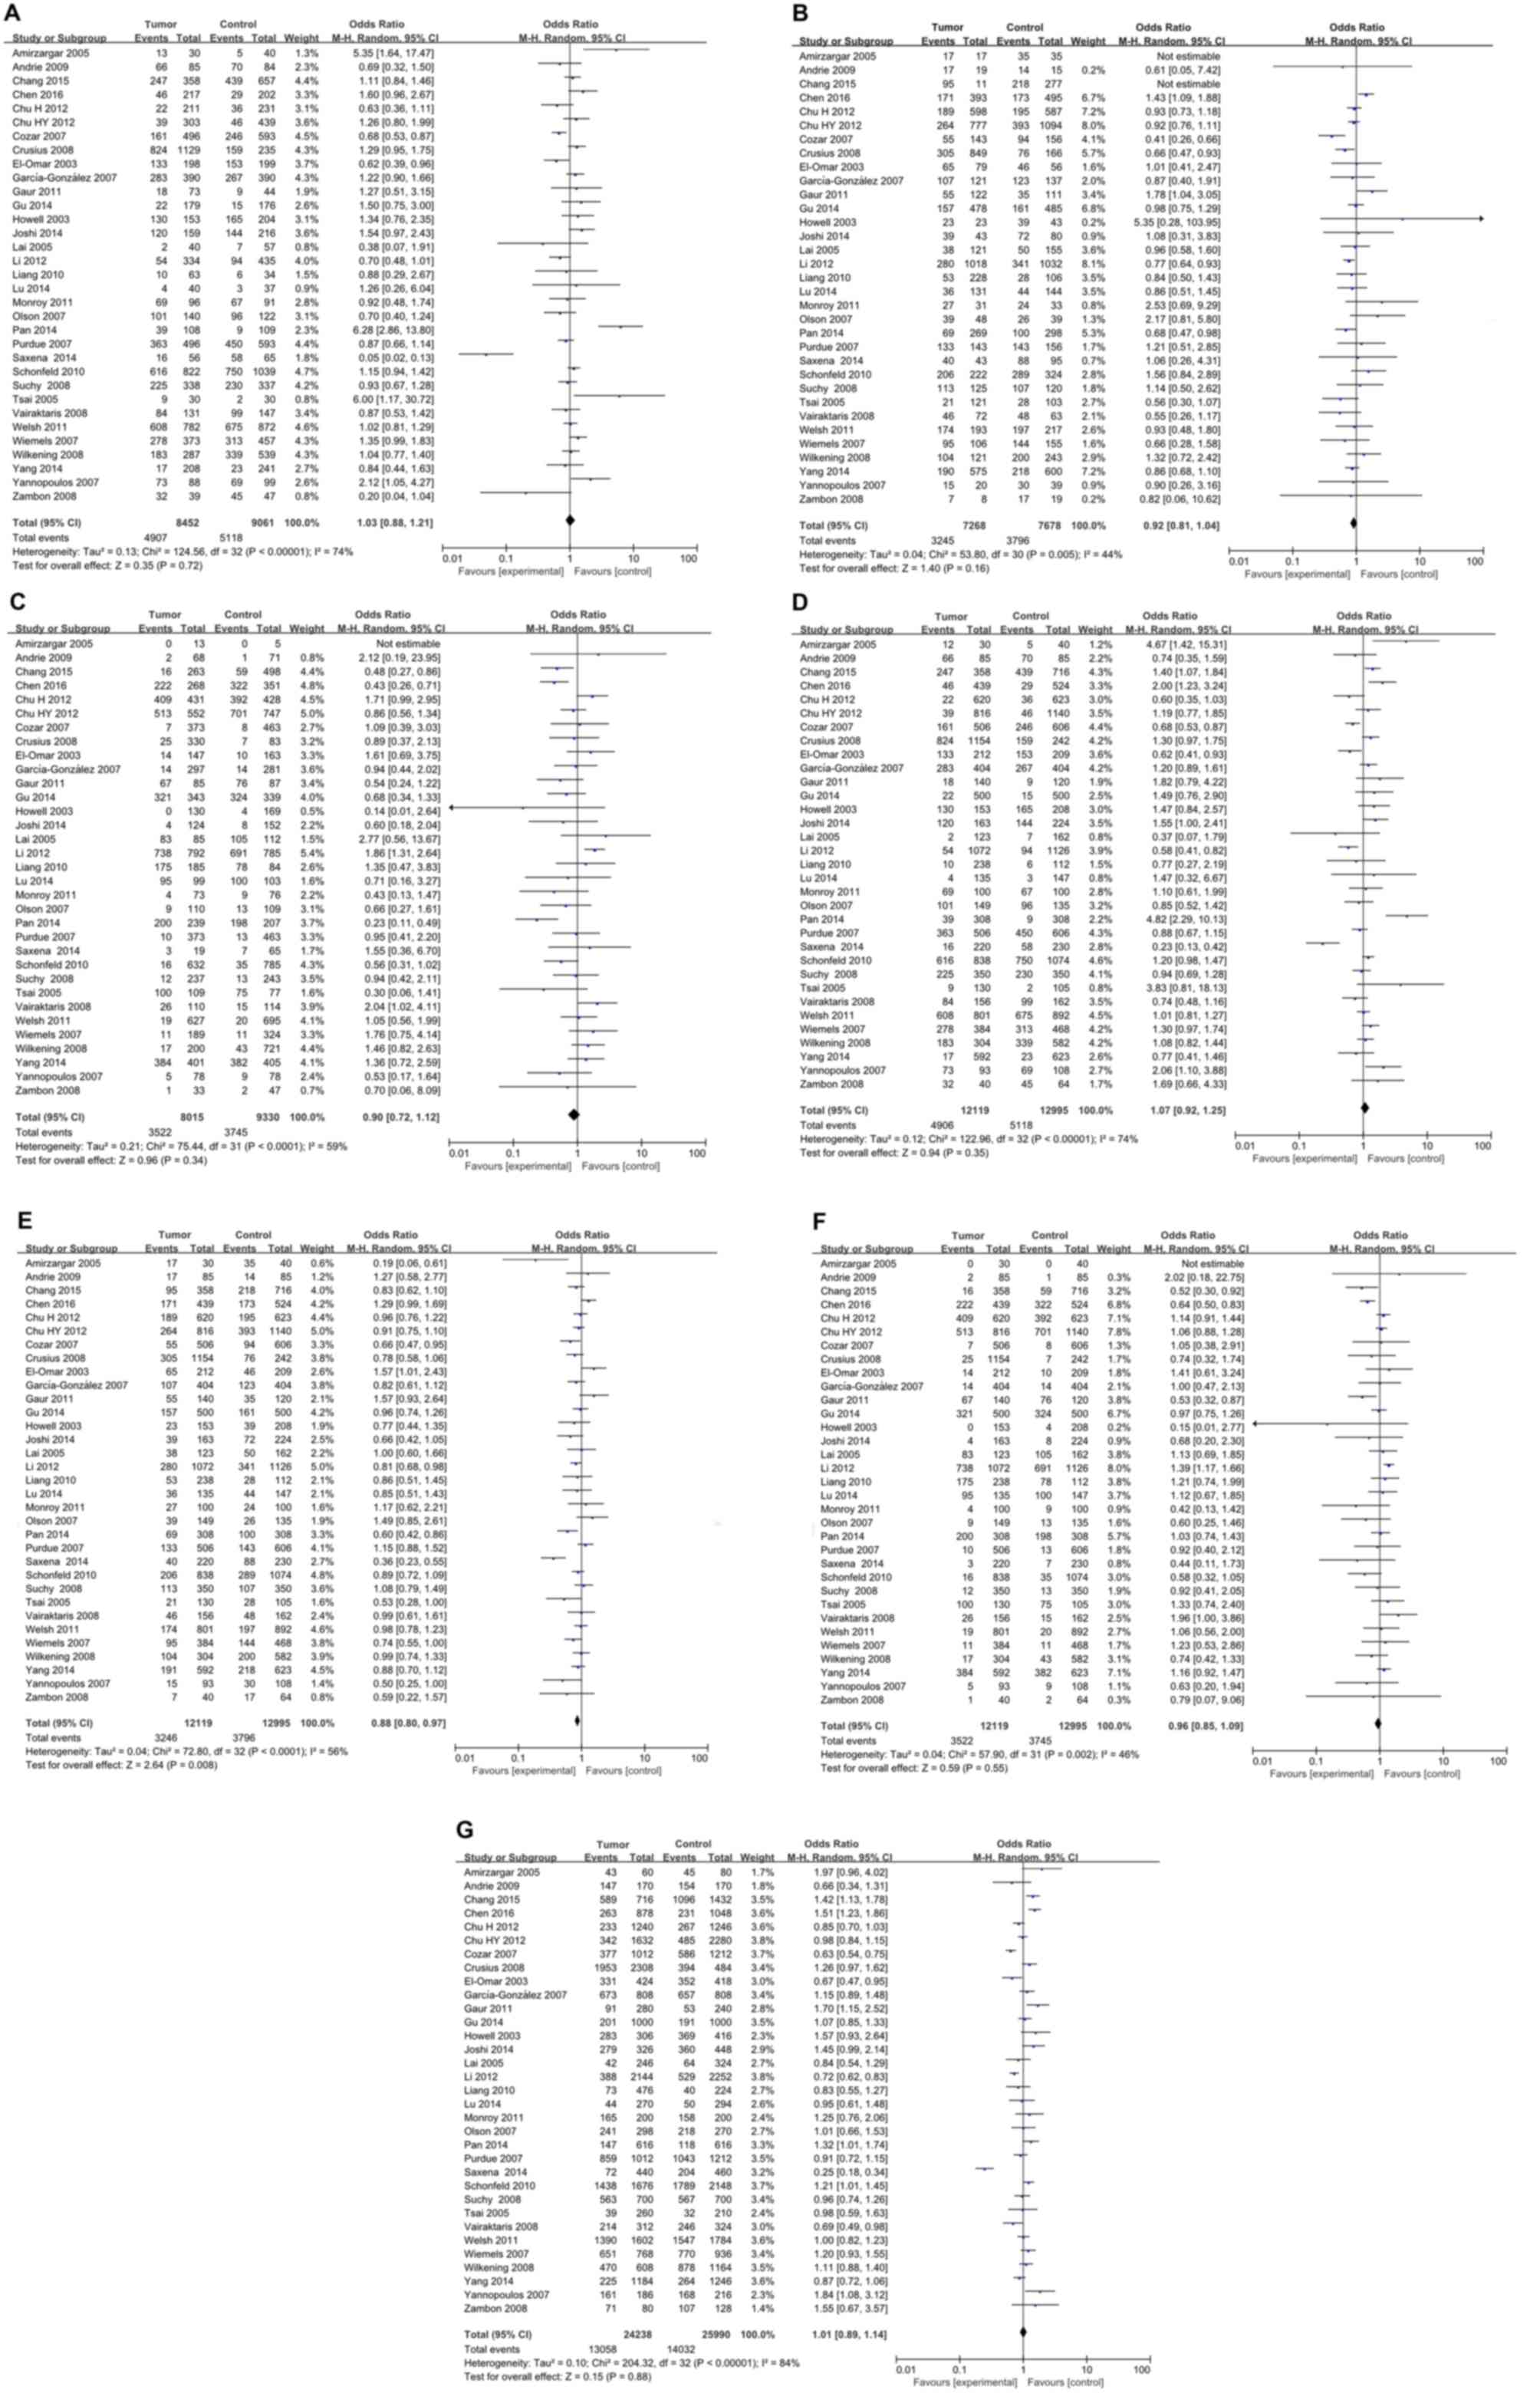
For IL-4 rs2243250 polymorphism, a total of 33
studies including 10,873 cancer cases and 14,328 normal controls
were investigated. Deviations from HWE were observed in 9 studies,
while the other 24 studies were in accordance with HWE (Table I). As illustrated in Fig. 2, the meta-analysis identified a
significant association between IL-4 rs2243250 polymorphism and
cancer risk (CT vs. CC/TT: P=0.008, OR=0.88, 95% CI 0.80–0.97) with
an overt heterogeneity across studies (I2=56%). Subgroup analyses
were then performed based on cancer type (Table II). The results suggested that the
IL-4 rs2243250 polymorphism was significantly associated with an
increased risk of gastric cancer (CT vs. TT: P=0.004, OR=0.75, 95%
CI 0.61–0.91; CT vs. CC/TT: P=0.002, OR=0.77, 95% CI 0.66–0.91; and
C vs. T: P=0.04, OR=1.15, 95% CI 1.01–1.32), breast cancer (CC vs.
CT: P=0.05, OR=1.21, 95% CI 1.00–1.46; TT vs. CC: P=0.04, OR=0.56,
95% CI 0.33–0.97; CC vs. CT/TT: P=0.02, OR=1.25, 95% CI 1.04–1.51;
and C vs. T: P=0.007, OR=1.25, 95% CI 1.06–1.47), lung cancer (CT
vs. CC/TT: P=0.02, OR=0.84, 95% CI 0.75–0.97), prostate cancer (CT
vs. TT: P=0.004, OR=1.48, 95% CI 1.14–1.92;TT vs. CC: P=0.0009,
OR=0.48, 95% CI 0.31–0.74; CT vs. CC/TT: P=0.02, OR=1.33, 95% CI
1.05–1.69; and TT vs. CC/CT: P=0.0004, OR=0.64, 95% CI 0.50–0.82)
and leukemia (CC vs. CT: P=0.005, OR=5.35, 95% CI 1.64–17.47;CC vs.
CT/TT: P=0.01, OR=4.67, 95% CI 1.42–15.31; and CT vs. CC/TT:
P=0.005, OR=0.19, 95% CI 0.06–0.61). Studies in each cancer
subgroup were homogenous. No significant association between IL-4
rs2243250 polymorphism and cancer risk was identified for oral
carcinoma, colorectal cancer, skin cancer, hepatocellular
carcinoma, lymphoma, bladder cancer, brain tumor, testicular tumor,
renal cell carcinoma, and brain tumor (Table II). Subgroup analyses were also
conducted by ethnicity. As illustrated in Table II, a significant association
between IL-4 rs2243250 polymorphism and cancer risk was identified
in both Caucasian (CT vs. TT: P=0.03, OR=0.82, 95% CI 0.68–0.98,
I2=46%; CT vs. CC/TT: P=0.02, OR=0.79, 95% CI 0.66–0.96, I2=64%)
and Asian populations (CT vs. CC/TT: P=0.006, OR=0.89, 95% CI
0.82–0.97, I2=36%).
 | Table I.Characteristics of subjects included
in the meta-analysis of interleukin-4 rs2243250 polymorphism and
cancer risk. |
Table I.
Characteristics of subjects included
in the meta-analysis of interleukin-4 rs2243250 polymorphism and
cancer risk.
|
|
|
|
| Case | Control |
|
|
|
|---|
|
|
|
|
|
|
|
|
|
|
|---|
| First author,
year | Country | Ethnicity | Cancer type | n | Genotypes
CC/CT/TT | Alleles C/T
(%) | n | Genotypes
CC/CT/TT | Alleles C/T
(%) | P-value HWE | NOS score | (Refs.) |
|---|
| Amirzargar,
2005 | Iran | Caucasian | Leukemia | 30 | 13/17/0 | 71.7/28.3 | 40 | 5/35/0 | 56.3/43.7 |
<0.001 | 7 | (42) |
| Andrie, 2009 | Greece | Caucasian | Lymphoma | 85 | 66/17/2 | 87.6/12.4 | 85 | 70/14/1 | 90.6/9.6 | 0.753 | 7 | (26) |
| Chang, 2015 | Taiwan | Asian | Lung cancer | 358 | 247/95/16 | 82.3/17.7 | 716 | 439/218/59 | 76.5/23.5 |
<0.001 | 7 | (35) |
| Chen, 2016 | China | Asian | Prostate
cancer | 439 | 46/171/222 | 30.0/70.0 | 524 | 29/173/322 | 22.0/78.0 | 0.368 | 7 | (22) |
| Chu, 2012 | China | Asian | Bladder cancer | 816 | 39/264/513 | 21.0/79.0 | 1140 | 46/393/701 | 21.3/78.7 | 0.322 | 7 | (41) |
| Chu, 2012 | China | Asian | Renal cell
carcinoma | 620 | 22/189/409 | 18.8/81.2 | 623 | 36/195/392 | 21.4/78.6 | 0.079 | 7 | (18) |
| Cozar, 2007 | Spain | Caucasian | Renal cell
carcinoma | 127 | 93/30/4 | 85.0/15.0 | 174 | 123/47/4 | 84.2/15.8 | 0.844 | 7 | (19) |
| Cozar, 2007 | Spain | Caucasian | Colorectal
cancer | 96 | 68/25/3 | 83.9/16.1 | 174 | 123/47/4 | 84.2/15.8 | 0.844 | 7 | (19) |
| Crusius, 2008 | Netherlands | Caucasian | Gastric cancer | 242 | 159/76/7 | 81.4/18.6 | 1154 | 824/305/25 | 84.6/15.4 | 0.603 | 7 | (11) |
| El-omar, 2003 | Scotland | Mixed | Esophageal
cancer | 90 | 55/28/7 | 76.7/23.3 | 209 | 153/46/10 | 84.2/15.8 | 0.013 | 7 | (12) |
| El-omar, 2003 | Scotland | Mixed | Gastric cancer | 122 | 78/37/7 | 79.1/20.9 | 209 | 153/46/10 | 84.2/15.8 | 0.013 | 7 | (12) |
| Garcia-Gonzalez,
2007 | Spain | Caucasian | Gastric cancer | 404 | 283/107/14 | 83.3/16.7 | 404 | 267/123/14 | 81.3/18.7 | 0.971 | 8 | (13) |
| Gaur, 2011 | India | Caucasian | Oral carcinoma | 140 | 18/55/67 | 32.5/67.5 | 120 | 9/35/76 | 22.1/77.9 | 0.095 | 8 | (28) |
| Gu, 2014 | China | Asian | Lung cancer | 500 | 22/157/321 | 20.1/79.9 | 500 | 15/161/324 | 19.1/80.9 | 0.348 | 7 | (34) |
| Howell, 2003 | UK | Caucasian | Skin cancer | 153 | 130/23/0 | 92.5/7.5 | 208 | 165/39/4 | 88.7/11.3 | 0.352 | 8 | (25) |
| Joshi, 2014 | India | Caucasian | Breast cancer | 163 | 120/39/4 | 85.6/14.4 | 224 | 144/72/8 | 80.4/19.6 | 0.786 | 8 | (20) |
| Lai, 2005 | Taiwan | Asian | Gastric cancer | 123 | 2/38/83 | 17.1/82.9 | 162 | 7/50/105 | 19.8/80.2 | 0.736 | 7 | (14) |
| Li, 2012 | China | Asian | Lung cancer | 1072 | 54/280/738 | 18.1/81.9 | 1126 | 94/341/691 | 23.5/76.5 |
<0.001 | 7 | (33) |
| Liang, 2010 | China | Asian | Gastric cancer | 238 | 10/53/175 | 15.3/84.7 | 112 | 6/28/78 | 17.9/82.1 | 0.118 | 7 | (17) |
| Lu, 2014 | China | Asian | Hepatocellular
cancer | 154 | 4/39/111 | 15.3/84.7 | 170 | 4/51/115 | 17.4/82.6 | 0.055 | 7 | (31) |
| Monroy, 2011 | USA | Mixed | Lymphoma | 100 | 69/27/4 | 82.5/17.5 | 100 | 67/24/9 | 79.0/21.0 | 0.006 | 7 | (27) |
| Olson, 2007 | USA | Mixed | Prostate
cancer | 149 | 101/39/9 | 80.9/19.1 | 128 | 96/26/6 | 85.2/14.8 | 0.026 | 7 | (23) |
| Pan, 2014 | China | Asian | Gastric cancer | 308 | 39/69/200 | 23.9/76.1 | 307 | 9/100/198 | 19.2/80.8 | 0.390 | 7 | (15) |
| Purdue, 2007 | USA | Mixed | Testicular germ
cell tumor | 506 | 363/133/10 | 84.9/15.1 | 606 | 450/143/13 | 86.1/13.9 | 0.680 | 8 | (40) |
| Saxena, 2014 | India | Caucasian | Hepatocellular
carcinoma | 59 | 16/40/3 | 61.0/39.0 | 153 | 58/88/7 | 66.7/33.3 |
<0.001 | 7 | (32) |
| Schonfeld,
2010 | USA | Mixed | Breast cancer | 838 | 616/206/16 | 85.8/14.2 | 1074 | 750/289/35 | 83.3/16.7 | 0.273 | 8 | (21) |
| Suchy, 2008 | Poland | Caucasian | Colorectal
cancer | 350 | 225/113/12 | 80.4/19.6 | 350 | 230/107/13 | 81.0/19.0 | 0.899 | 8 | (36) |
| Tsai, 2005 | Taiwan | Asian | Oral carcinoma | 130 | 9/21/100 | 15.0/85.0 | 105 | 2/28/75 | 15.2/84.8 | 0.741 | 7 | (29) |
| Vairaktaris,
2008 | Greek and
German | Caucasian | Oral carcinoma | 156 | 84/46/26 | 68.6/31.4 | 162 | 99/48/15 | 75.9/24.1 | 0.016 | 7 | (30) |
| Welsh, 2011 | UK | Caucasian | Skin cancer | 892 | 675/197/20 | 86.6/13.3 | 801 | 608/174/19 | 86.8/13.2 | 0.126 | 8 | (24) |
| Wiemels, 2007 | USA | Mixed | Glioma | 384 | 278/95/11 | 84.8/15.2 | 468 | 313/144/11 | 82.3/17.7 | 0.239 | 8 | (39) |
| Wilkening,
2008 | North Sweden | Caucasian | Colorectal
cancer | 304 | 183/104/17 | 77.3/22.7 | 582 | 339/200/43 | 75.4/24.6 | 0.079 | 8 | (37) |
| Yang, 2014 | Taiwan | Asian | Oral carcinoma | 463 | 13/148/302 | 18.8/81.2 | 623 | 23/218/382 | 21.2/78.8 | 0.233 | 7 | (53) |
| Yang, 2014 | Taiwan | Asian | Pharyngeal
carcinoma | 129 | 4/43/82 | 19.8/80.2 | 623 | 23/218/382 | 21.2/78.8 | 0.233 | 7 | (53) |
| Yannopoulos,
2007 | Greece | Caucasian | Colorectal
cancer | 93 | 73/15/5 | 86.6/13.4 | 108 | 69/30/9 | 77.8/22.2 | 0.041 | 7 | (38) |
| Zambon, 2008 | Italy | Caucasian | Gastric cancer | 40 | 32/7/1 | 88.8/11.2 | 64 | 45/17/2 | 83.6/16.4 | 0.800 | 7 | (16) |
| Table II.Subgroup analyses for interleukin-4
rs2243250 polymorphism and cancer risk. |
Table II.
Subgroup analyses for interleukin-4
rs2243250 polymorphism and cancer risk.
| A, Gastric cancer
(n=6a) |
|---|
|
|---|
| Variable | P-value | OR (95% Cl) | I-square (%) | P-value for the
heterogeneity |
|---|
| CC vs. CT | 0.47 | 1.24
(0.69–2.20) | 78% | 0.0003 |
| CT vs. TT | 0.004 | 0.75
(0.61–0.91) | 0% | 0.85 |
| TT vs. CC | 0.57 | 0.81
(0.40–1.66) | 63% | 0.02 |
| CC vs. CT + TT | 0.11 | 1.42
(0.92–2.20) | 68% | 0.007 |
| CT vs. CC + TT | 0.002 | 0.77
(0.66–0.91) | 0% | 0.62 |
| TT vs. CC + CT | 0.63 | 1.06
(0.85–1.32) | 0% | 0.95 |
| C vs. T | 0.04 | 1.15
(1.01–1.32) | 21% | 0.28 |
|
| B, Oral carcinoma
(n=3a) |
|
| CC vs. CT | 0.43 | 1.41
(0.60–3.30) | 45% | 0.14 |
| CT vs. TT | 0.68 | 0.84
(0.37–1.91) | 80% | 0.007 |
| TT vs. CC | 0.67 | 0.78
(0.25–2.44) | 77% | 0.01 |
| CC vs. CT + TT | 0.45 | 0.41
(0.58–3.47) | 70% | 0.04 |
| CT vs. CC + TT | 0.90 | 0.96
(0.54–1.71) | 70% | 0.03 |
| TT vs. CC + CT | 0.83 | 1.09
(0.50–2.39) | 82% | 0.004 |
| C vs. T | 0.88 | 1.05
(0.60–1.84) | 82% | 0.004 |
|
| C, Colorectal
cancer (n=3a) |
|
| CC vs. TT | 0.51 | 1.12
(0.80–1.57) | 55% | 0.11 |
| CT vs. TT | 0.43 | 1.20
(0.76–1.90) | 0% | 0.86 |
| TT vs. CC | 0.83 | 1.04
(0.70–1.55) | 0% | 0.41 |
| CC vs. CT + TT | 0.39 | 1.16
(0.83–1.62) | 58% | 0.09 |
| CT vs. CC + TT | 0.74 | 0.97
(0.79–1.19) | 50% | 0.14 |
| TT vs. CC + CT | 0.23 | 0.77
(0.50–1.19) | 0% | 0.84 |
| C vs. T | 0.31 | 1.15
(0.88–1.52) | 56% | 0.10 |
|
| D, Lung cancer
(n=3a) |
|
| CC vs. CT | 0.97 | 0.99
(0.67–1.47) | 63% | 0.07 |
| CT vs. TT | 0.19 | 0.85
(0.67–1.08) | 54% | 0.14 |
| TT vs. CC | 0.75 | 0.87
(0.35–2.17) | 89% | 0.00001 |
| CC vs. CT + TT | 0.89 | 1.05
(0.54–2.01) | 88% | 0.0002 |
| CT vs. CC + TT | 0.02 | 0.84
(0.75–0.97) | 0% | 0.58 |
| TT vs. CC + CT | 0.86 | 0.96
(0.62–1.49) | 85% | 0.001 |
| C vs. T | 0.92 | 1.02
(0.68–1.54) | 92% | 0.00001 |
|
| E, Skin cancer
(n=2a) |
|
| CC vs. CT | 0.59 | 1.06
(0.86–1.31) | 0% | 0.39 |
| CT vs. TT | 0.84 | 1.07
(0.57–2.00) | 23% | 0.25 |
| TT vs. CC | 0.72 | 0.89
(0.49–1.64) | 44% | 0.18 |
| CC vs. CT + TT | 0.53 | 1.07
(0.87–1.31) | 33% | 0.22 |
| CT vs. CC + TT | 0.60 | 0.94
(0.76–1.17) | 0% | 0.43 |
| TT vs. CC + CT | 0.74 | 0.90
(0.49–1.65) | 41% | 0.19 |
| C vs. T | 0.45 | 1.17
(0.77–1.77) | 59% | 0.12 |
|
| F, Hepatocellular
cancer (n=2a) |
|
| CC vs. CT | 0.37 | 0.23
(0.01–5.69) | 92% | 0.0005 |
| CT vs. TT | 0.62 | 0.88
(0.54–1.44) | 0% | 0.79 |
| TT vs. CC | 0.93 | 1.05
(0.36–3.04) | 10% | 0.33 |
| CC vs. CT + TT | 0.46 | 0.51
(0.09–3.03) | 80% | 0.03 |
| CT vs. CC + TT | 0.16 | 0.55
(0.23–1.27) | 84% | 0.01 |
| TT vs. CC + CT | 0.95 | 0.99
(0.62–1.58) | 36% | 0.21 |
| C vs. T | 0.28 | 0.48
(0.13–1.80) | 96% | 0.00001 |
|
| G, Lymphoma
(n=2a) |
|
| CC vs. CT | 0.42 | 0.82
(0.50–1.34) | 0% | 0.59 |
| CT vs. TT | 0.28 | 1.85
(0.61–5.61) | 0% | 0.32 |
| TT vs. CC | 0.34 | 0.60
(0.21–1.72) | 24% | 0.25 |
| CC vs. CT + TT | 0.81 | 0.95
(0.59–1.51) | 0% | 0.43 |
| CT vs. CC + TT | 0.45 | 1.21
(0.74–1.98) | 0% | 0.88 |
| TT vs. CC + CT | 0.31 | 0.58
(0.21–1.65) | 23% | 0.26 |
| C vs. T | 0.88 | 0.95
(0.51–1.76) | 54% | 0.14 |
|
| H, Prostate cancer
(n=2a) |
|
| CC vs. CT | 0.87 | 1.07
(0.48–2.41) | 78% | 0.03 |
| CT vs. TT | 0.004 | 1.48
(1.14–1.92) | 0% | 0.43 |
| TT vs. CC | 0.0009 | 0.48
(0.31–0.74) | 0% | 0.43 |
| CC vs. CT + TT | 0.52 | 1.31
(0.57–3.01) | 82% | 0.02 |
| CT vs. CC + TT | 0.02 | 1.33
(1.05–1.69) | 0% | 0.66 |
| TT vs. CC + CT | 0.0004 | 0.64
(0.50–0.82) | 0% | 0.90 |
| C vs. T | 0.20 | 1.29
(0.87–1.90) | 66% | 0.09 |
|
| I, Breast cancer
(n=2a) |
|
| CC vs. CT | 0.05 | 1.21
(1.00–1.46) | 21% | 0.26 |
| CT vs. TT | 0.18 | 1.46
(0.84–2.54) | 0% | 0.61 |
| TT vs. CC | 0.04 | 0.56
(0.33–0.97) | 0% | 0.91 |
| CC vs. CT + TT | 0.02 | 1.25
(1.04–1.51) | 7% | 0.30 |
| CT vs. CC + TT | 0.07 | 0.84
(0.70–1.02) | 21% | 0.26 |
| TT vs. CC + CT | 0.06 | 0.60
(0.35–1.02) | 0% | 0.82 |
| C vs. T | 0.007 | 1.25
(1.06–1.47) | 0% | 0.41 |
|
| J, Bladder cancer
(n=1a) |
|
| CC vs. CT | 0.32 | 1.26
(0.80–1.99) | NA | NA |
| CT vs. TT | 0.38 | 0.92
(0.76–1.11) | NA | NA |
| TT vs. CC | 0.51 | 0.86
(0.56–1.34) | NA | NA |
| CC vs. CT + TT | 0.43 | 1.19
(0.77–1.85) | NA | NA |
| CT vs. CC + TT | 0.33 | 0.91
(0.75–1.10) | NA | NA |
| TT vs. CC + CT | 0.54 | 1.06
(0.88–1.28) | NA | NA |
| C vs. T | 0.81 | 0.98
(0.84–1.15) | NA | NA |
|
| K, Brain tumor
(n=1a) |
|
| CC vs. CT | 0.06 | 1.35
(0.99–1.83) | NA | NA |
| CT vs. TT | 0.35 | 0.66
(0.28–1.58) | NA | NA |
| TT vs. CC | 0.20 | 1.76
(0.75–4.14) | NA | NA |
| CC vs. CT + TT | 0.08 | 1.30
(0.97–1.74) | NA | NA |
| CT vs. CC + TT | 0.05 | 0.74
(0.55–1.00) | NA | NA |
| TT vs. CC + CT | 0.64 | 1.23
(0.53–2.86) | NA | NA |
| C vs. T | 0.17 | 1.20
(0.93–1.55) | NA | NA |
|
| L, Testicular tumor
(n=1a) |
|
| CC vs. CT | 0.31 | 0.87
(0.66–1.14) | NA | NA |
| CT vs. TT | 0.66 | 1.21
(0.51–2.85) | NA | NA |
| TT vs. CC | 0.91 | 0.95
(0.41–2.20) | NA | NA |
| CC vs. CT + TT | 0.35 | 0.88
(0.67–1.15) | NA | NA |
| CT vs. CC + TT | 0.30 | 1.15
(0.88–1.52) | NA | NA |
| TT vs. CC + CT | 0.84 | 0.92
(0.40–2.12) | NA | NA |
| C vs. T | 0.43 | 0.91
(0.72–1.15) | NA | NA |
|
| M, Leukemia
(n=1a) |
|
| CC vs. CT | 0.005 | 5.35
(1.64–17.47) | NA | NA |
| CT vs. TT | NA | NA | NA | NA |
| TT vs. CC | NA | NA | NA | NA |
| CC vs. CT + TT | 0.01 | 4.67
(1.42–15.31) | NA | NA |
| CT vs. CC + TT | 0.005 | 0.19
(0.06–0.61) | NA | NA |
| TT vs. CC + CT | NA | 1.11
(0.86–1.44) | NA | NA |
| C vs. T | 0.06 | 1.97
(0.96–4.02) | NA | NA |
|
| N, Renal cell
carcinoma (n=1a) |
|
| CC vs. CT | 0.11 | 0.63
(0.36–1.11) | NA | NA |
| CT vs. TT | 0.55 | 0.93
(0.73–1.18) | NA | NA |
| TT vs. CC | 0.06 | 1.71
(0.99–2.95) | NA | NA |
| CC vs. CT + TT | 0.06 | 0.60
(0.35–1.03) | NA | NA |
| CT vs. CC + TT | 0.76 | 0.96
(0.76–1.22) | NA | NA |
| TT vs. CC + CT | 0.26 | 1.14
(0.91–1.44) | NA | NA |
| C vs. T | 0.10 | 0.85
(0.70–1.03) | NA | NA |
|
| O, Caucasian
(n=15a) |
|
| CC vs. CT | 0.85 | 0.98
(0.75–1.27) | 81% | 0.00001 |
| CT vs. TT | 0.03 | 0.82
(0.68–0.98) | 46% | 0.03 |
| TT vs. CC | 0.84 | 1.03
(0.81–1.30) | 0% | 0.50 |
| CC vs. CT + TT | 0.56 | 1.07
(0.85–1.34) | 77% | 0.00001 |
| CT vs. CC + TT | 0.02 | 0.79
(0.66–0.96) | 64% | 0.0003 |
| TT vs. CC + CT | 0.10 | 0.83
(0.67–1.04) | 4% | 0.41 |
| C vs. T | 0.84 | 1.03
(0.80–1.33) | 90% | 0.00001 |
|
| P, Asian
(n=12a) |
|
| CC vs. CT | 0.26 | 1.22
(0.87–1.72) | 71% | 0.00001 |
| CT vs. TT | 0.11 | 0.90
(0.79–1.02) | 47% | 0.04 |
| TT vs. CC | 0.38 | 0.83
(0.54–1.27) | 80% | 0.00001 |
| CC vs. CT + TT | 0.34 | 1.19
(0.83–1.72) | 77% | 0.00001 |
| CT vs. CC + TT | 0.006 | 0.89
(0.82–0.97) | 36% | 0.11 |
| TT vs. CC + CT | 0.62 | 1.04
(0.89–1.21) | 66% | 0.0007 |
| C vs. T | 0.90 | 1.01
(0.87–1.18) | 80% | 0.00001 |
IL-4 rs2070874 polymorphism and the
risk of cancer
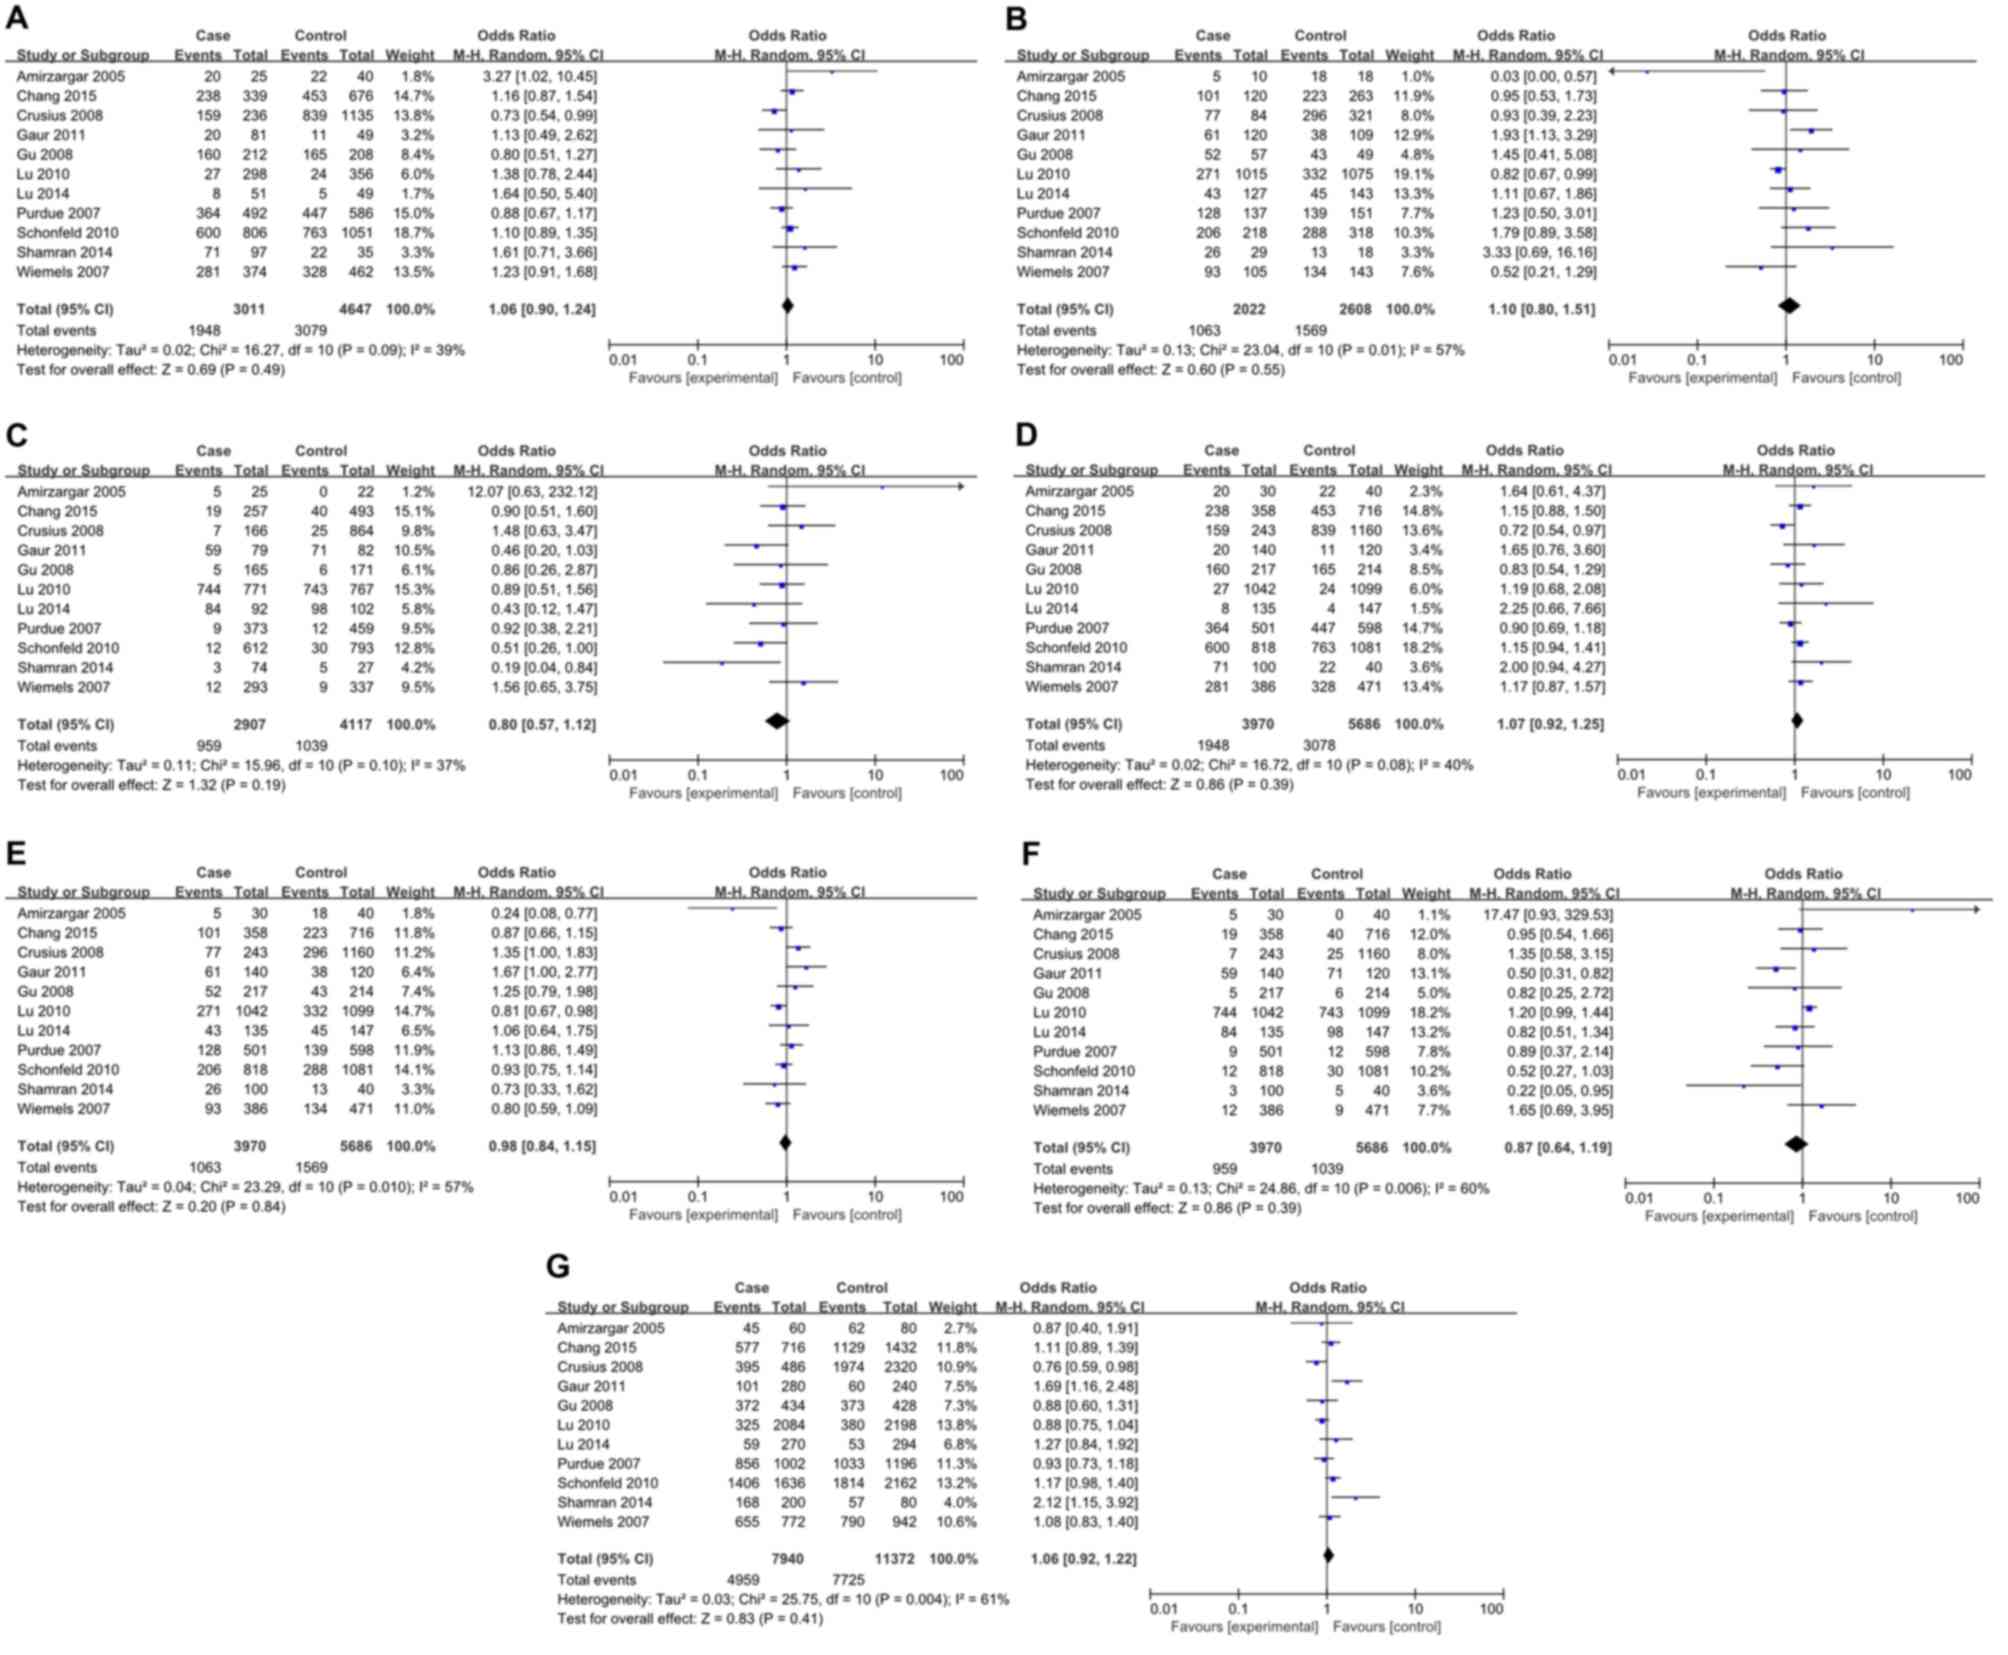
For IL-4 rs2070874 polymorphism, 11 studies
involving 3,970 patients and 5,686 controls were included. All
relevant studies were in agreement with HWE (Table III). Inter-study heterogeneity
was obvious in all comparisons and thus REMs were used for
analyses. No significant association between IL-4 rs2070874
polymorphism and cancer risk was observed in all genetic models
(Fig. 3). Further stratification
analyses by cancer type revealed a significant association with
leukemia (CC vs. CT: P=0.05, OR=3.27, 95% CI1.02–10.45; CT vs. TT:
P=0.02, OR=0.03, 95% CI 0.00–0.57; and CT vs. CC/TT: P=0.02,
OR=0.24, 95% CI 0.08–0.77), and oral carcinoma (CT vs. TT: P=0.02,
OR=1.93, 95% CI1.13–3.29; CT vs. CC/TT: P=0.05, OR=1.67, 95% CI
1.00–2.77; TT vs. CC/CT: P=0.006, OR=0.50, 95% CI 0.31–0.82; and C
vs. T: P=0.007, OR=1.69, 95% CI 1.16–2.48) (Table II). Nevertheless, no association
was observed between rs2070874 polymorphism and other tumor types
(Table III). In the subgroup
analyses by ethnicity, a significant association was found in Asian
populations (CT vs. CC/TT: P=0.03, OR=0.85, 95% CI 0.73–0.98), but
not in Caucasian populations (Table
IV).
| Table III.Characteristics of subjects included
in the meta-analysis of inteleukin-4 rs2070874 polymorphism and
cancer risk. |
Table III.
Characteristics of subjects included
in the meta-analysis of inteleukin-4 rs2070874 polymorphism and
cancer risk.
|
|
|
|
| Case | Control |
|
|
|
|---|
|
|
|
|
|
|
|
|
|
|
|---|
| First author,
year | Country | Ethnicity | Cancer type | n | Genotypes
CC/CT/TT | Alleles C/T
(%) | n | Genotypes
CC/CT/TT | Alleles C/T
(%) | P-value HWE | NOS score | (Ref.) |
|---|
| Amirzargar,
2005 | Iran | Caucasian | Leukemia | 30 | 20/5/5 | 75.0/25.0 | 40 | 22/18/0 | 77.5/22.5 | 0.066 | 7 | (42) |
| Chang, 2015 | Taiwan | Asian | Lung cancer | 358 | 238/101/19 | 80.6/19.4 | 716 | 453/223/40 | 78.8/21.2 | 0.075 | 7 | (35) |
| Crusius, 2008 | Netherlands | Caucasian | Gastric cancer | 243 | 159/77/7 | 81.3/18.7 | 1160 | 839/296/25 | 85.1/14.9 | 0.853 | 8 | (11) |
| Gaur, 2011 | India | Caucasian | Oral carcinoma | 140 | 20/61/59 | 36.1/63.9 | 120 | 11/38/71 | 25.0/75.0 | 0.088 | 8 | (28) |
| Gu, 2008 | USA | Mixed | Skin cancer | 217 | 160/52/5 | 85.7/14.3 | 214 | 165/43/6 | 87.1/12.9 | 0.132 | 8 | (45) |
| Lu, 2010 | China | Asian | Gastric cancer | 1042 | 27/271/744 | 15.6/84.4 | 1099 | 24/332/743 | 17.3/82.7 | 0.062 | 7 | (44) |
| Lu, 2014 | China | Asian | Hepatocellular
cancer | 135 | 8/43/84 | 21.9/78.1 | 147 | 4/45/98 | 18.0/82.0 | 0.664 | 7 | (31) |
| Purdue, 2007 | USA | Mixed | Testicular germ
cell tumor | 501 | 364/128/9 | 85.4/14.6 | 598 | 447/139/12 | 86.4/13.6 | 0.757 | 8 | (40) |
| Schonfeld,
2010 | USA | Mixed | Breast cancer | 818 | 600/206/12 | 85.9/14.1 | 1081 | 763/288/30 | 83.9/16.1 | 0.654 | 7 | (21) |
| Shamran, 2014 | Iraq | Caucasian | Brain tumor | 100 | 71/26/3 | 84.0/16.0 | 40 | 22/13/5 | 71.3/28.7 | 0.191 | 8 | (43) |
| Wiemels, 2007 | USA | Mixed | Brain tumor | 386 | 281/93/12 | 84.8/15.2 | 471 | 328/134/9 | 83.9/16.1 | 0.267 | 8 | (39) |
| Table IV.Subgroup analyses for interleukin-4
rs2070874polymorphism and cancer risk. |
Table IV.
Subgroup analyses for interleukin-4
rs2070874polymorphism and cancer risk.
| A, Gastric cancer
(n=3a) |
|---|
|
|---|
| Variable | P-value | OR (95% Cl) | I-square (%) | P-value for the
heterogeneity |
|---|
| CC vs. CT | 0.91 | 1.03
(0.60–1.76) | 59% | 0.09 |
| CT vs. TT | 0.07 | 0.85
(0.71–1.01) | 0% | 0.52 |
| TT vs. CC | 0.67 | 0.91
(0.59–1.41) | 25% | 0.26 |
| CC vs. CT + TT | 0.94 | 1.02
(0.60–1.74) | 60% | 0.08 |
| CT vs. CC + TT | 0.85 | 1.04
(0.72–1.49) | 75% | 0.85 |
| TT vs. CC + CT | 0.11 | 1.15
(0.97–1.36) | 5% | 0.35 |
| C vs. T | 0.35 | 0.90
(0.72–1.12) | 53% | 0.12 |
|
| B, Brain tumor
(n=2a) |
|
| CC vs. CT | 0.10 | 1.27
(0.95–1.70) | 0% | 0.55 |
| CT vs. TT | 0.86 | 1.17
(0.19–7.13) | 75% | 0.05 |
| TT vs. CC | 0.62 | 0.59
(0.07–4.70) | 82% | 0.02 |
| CC vs. CT + TT | 0.11 | 1.25
(0.95–1.65) | 41% | 0.19 |
| CT vs. CC + TT | 0.30 | 0.52
(0.15–1.77) | 78% | 0.03 |
| TT vs. CC + CT | 0.67 | 0.65
(0.09–4.74) | 81% | 0.02 |
| C vs. T | 0.29 | 1.42
(0.74–2.73) | 75% | 0.05 |
|
| C, Leukemia
(n=1a) |
|
| CC vs. CT | 0.05 | 3.27
(1.02–10.45) | NA | NA |
| CT vs. TT | 0.02 | 0.03
(0.00–0.57) | NA | NA |
| TT vs. CC | 0.10 | 12.07
(0.63–232.12) | NA | NA |
| CC vs. CT + TT | 0.33 | 1.64
(0.61–4.37) | NA | NA |
| CT vs. CC + TT | 0.02 | 0.24
(0.08–0.77) | NA | NA |
| TT vs. CC + CT | 0.06 | 17.47
(0.93–329.53) | NA | NA |
| C vs. T | 0.73 | 0.87
(0.40–1.91) | NA | NA |
|
| D, Lung cancer
(n=1a) |
|
| CC vs. CT | 0.30 | 1.16
(0.87–1.54) | NA | NA |
| CT vs. TT | 0.88 | 0.95
(0.53–1.73) | NA | NA |
| TT vs. CC | 0.73 | 0.90
(0.51–1.60) | NA | NA |
| CC vs. CT + TT | 0.30 | 1.15
(0.88–1.50) | NA | NA |
| CT vs. CC + TT | 0.32 | 0.87
(0.66–1.15) | NA | NA |
| TT vs. CC + CT | 0.85 | 0.95
(0.54–1.66) | NA | NA |
| C vs. T | 0.35 | 1.11
(0.89–1.39) | NA | NA |
|
| E, Oral carcinoma
(n=1a) |
|
| CC vs. CT | 0.77 | 1.13
(0.49–2.62) | NA | NA |
| CT vs. TT | 0.02 | 1.93
(1.13–3.29) | NA | NA |
| TT vs. CC | 0.06 | 0.46
(0.20–1.03) | NA | NA |
| CC vs. CT + TT | 0.21 | 1.65
(0.76–3.60) | NA | NA |
| CT vs. CC + TT | 0.05 | 1.67
(1.00–2.77) | NA | NA |
| TT vs. CC + CT | 0.006 | 0.50
(0.31–0.82) | NA | NA |
| C vs. T | 0.007 | 1.69
(1.16–2.48) | NA | NA |
|
| F, Breast cancer
(n=1a) |
|
| CC vs. CT | 0.37 | 1.10
(0.89–1.35) | NA | NA |
| CT vs. TT | 0.10 | 1.79
(0.89–3.58) | NA | NA |
| TT vs. CC | 0.05 | 0.51
(0.26–1.00) | NA | NA |
| CC vs. CT + TT | 0.18 | 1.15
(0.94–1.41) | NA | NA |
| CT vs. CC + TT | 0.47 | 0.93
(0.75–1.14) | NA | NA |
| TT vs. CC + CT | 0.06 | 0.52
(0.27–1.03) | NA | NA |
| C vs. T | 0.08 | 1.17
(0.98–1.40) | NA | NA |
|
| G, Testicular tumor
(n=1a) |
|
| CC vs. CT | 0.38 | 0.88
(0.67–1.17) | NA | NA |
| CT vs. TT | 0.65 | 1.23
(0.50–3.01) | NA | NA |
| TT vs. CC | 0.85 | 0.92
(0.38–2.21) | NA | NA |
| CC vs. CT + TT | 0.43 | 0.90
(0.69–1.18) | NA | NA |
| CT vs. CC + TT | 0.38 | 1.13
(0.86–1.49) | NA | NA |
| TT vs. CC + CT | 0.80 | 0.89
(0.37–2.14) | NA | NA |
| C vs. T | 0.53 | 0.93
(0.73–1.18) | NA | NA |
|
| H, Skin cancer
(n=1a) |
|
| CC vs. CT | 0.35 | 0.80
(0.51–1.27) | NA | NA |
| CT vs. TT | 0.56 | 1.45
(0.41–5.08) | NA | NA |
| TT vs. CC | 0.81 | 0.86
(0.26–2.87) | NA | NA |
| CC vs. CT + TT | 0.42 | 0.83
(0.54–1.29) | NA | NA |
| CT vs. CC + TT | 0.33 | 1.25
(0.79–1.98) | NA | NA |
| TT vs. CC + CT | 0.74 | 0.82
(0.25–2.72) | NA | NA |
| C vs. T | 0.54 | 0.88
(0.60–1.31) | NA | NA |
|
| I, Caucasian
(n=4a) |
|
| CC vs. CT | 0.48 | 1.25
(0.67–2.33) | 66% | 0.03 |
| CT vs. TT | 0.78 | 1.16
(0.41–3.29) | 70% | 0.02 |
| TT vs. CC | 0.67 | 0.78
(0.24–2.51) | 72% | 0.01 |
| CC vs. CT + TT | 0.40 | 1.30
(0.71–2.38) | 70% | 0.02 |
| CT vs. CC + TT | 0.92 | 0.97
(0.55–1.73) | 73% | 0.01 |
| TT vs. CC + CT | 0.68 | 0.80
(0.28–2.27) | 73% | 0.01 |
| C vs. T | 0.45 | 1.23
(0.71–2.13) | 83% | 0.0006 |
|
| J, Asian
(n=3a) |
|
| CC vs. CT | 0.12 | 1.22
(0.95–1.56) | 0% | 0.77 |
| CT vs. TT | 0.07 | 0.86
(0.72–1.01) | 0% | 0.49 |
| TT vs. CC | 0.35 | 0.83
(0.57–1.22) | 0% | 0.54 |
| CC vs. CT + TT | 0.15 | 1.19
(0.94–1.51) | 0% | 0.58 |
| CT vs. CC + TT | 0.03 | 0.85
(0.73–0.98) | 0% | 0.61 |
| TT vs. CC + CT | 0.17 | 1.12
(0.95–1.32) | 15% | 0.17 |
| C vs. T | 0.81 | 1.03
(0.83–1.26) | 54% | 0.11 |
IL-4 rs79071878 polymorphism and the
risk of cancer
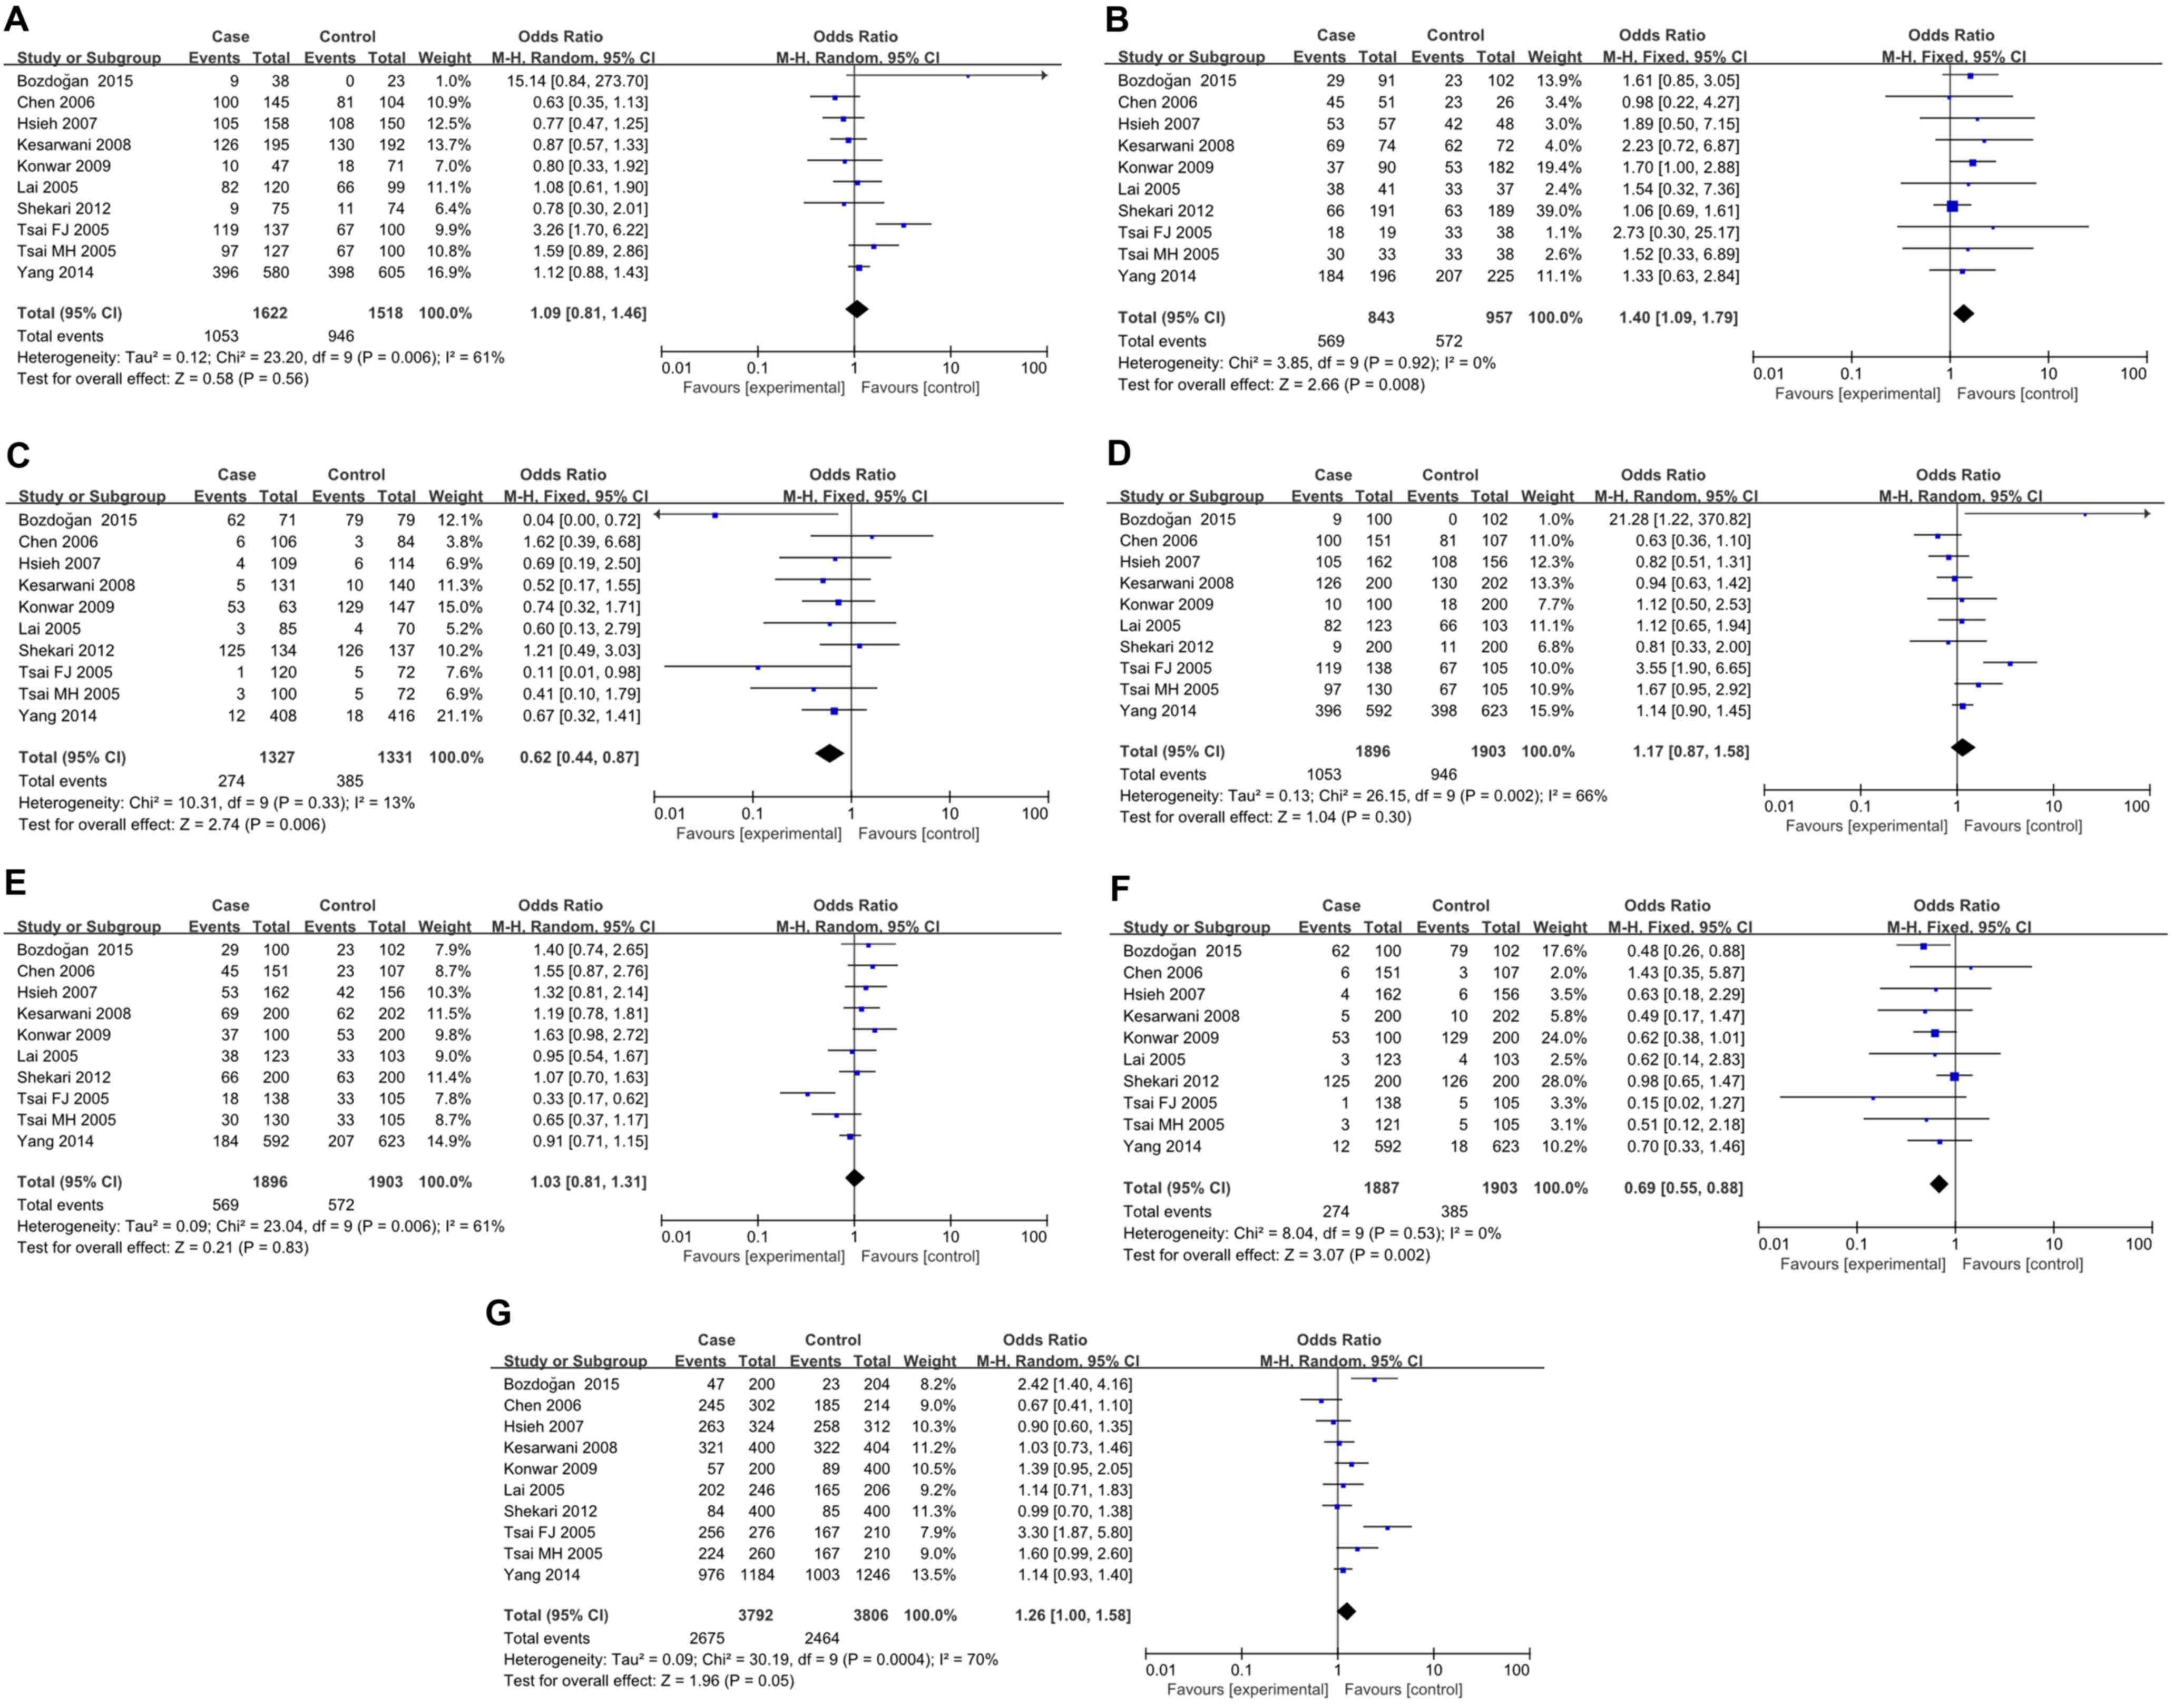
A total of 10 studies with 1,896 patients and 2,526
controls were involved in the present analyses for IL-4 rs79071878
polymorphism and cancer risk. HWE test revealed that only one study
deviated from HWE (Table V). IL-4
VNTR is a 70 bp repeat. Alleles of two and three repeats were
designated as repeat 1 (RP1) and repeat 2 (RP2), respectively, and
genotypes of RP1/RP1, RP1/RP2 and RP2/RP2 were designated as RP1.1,
RP1.2 and RP2.2, respectively. For RP1.2 vs. RP2.2, RP2.2 vs. RP1.1
and RP2.2 vs. RP1.1/RP1.2, FEMs were selected for analyses since
only mild inter-study heterogeneity was observed. In contrast, for
RP1.1 vs. RP1.2, RP1.1 vs. RP1.2/RP2.2, RP1.2 vs. RP1.1/RP2.2 and
RP1 vs. RP2, REMs were used because heterogeneity between studies
was significant. The results demonstrated an apparent correlation
between IL-4 rs79071878 polymorphism and cancer risk (RP1.2 vs.
RP2.2: P=0.008, OR=1.40, 95% CI 1.09–1.79; RP2.2 vs. RP1.1:
P=0.006, OR=0.62, 95% CI0.44–0.87, RP2.2 vs. RP1.1/RP1.2: P=0.002,
OR=0.69, 95% CI 0.55–0.88; and RP1.1 vs. RP2.2: P=0.05, OR=1.26,
95% CI 1.00–1.58; Fig. 4). Further
analyses by cancer type subgroup revealed that the rs79071878
polymorphism was associated with an increased risk of bladder
cancer (RP1.1 vs. RP1.2: P<0.0001, OR=3.78, 95% CI 2.03–7.05;
RP2.2 vs. RP1.1: P=0.002, OR=0.07, 95% CI 0.01–0.38; RP1.1 vs.
RP1.2/RP2.2: P<0.0001, OR=4.28, 95% CI 2.35–7.81; and RP2.2 vs.
RP1.1/RP1.2: P=0.004, OR=0.42, 95% CI 0.24–0.76) and breast cancer
(RP1.2 vs. RP2.2: P=0.05, OR=1.70, 95% CI 1.00–2.88) (Table VI). However, no significant
association was observed in other types of cancer. Furthermore,
stratified analysis by ethnicity yielded a significant association
for the IL-4 rs79071878 polymorphism with cancer risk in the Asian
ethnicity (RP1.2 vs. RP2.2: P=0.03, OR=1.38, 95% CI 1.04–1.83; and
RP2.2 vs. RP1.1/RP1.2: P=0.01, OR=0.71, 95% CI 0.54–0.93). However,
no evidence for any associations between IL-4 rs79071878
polymorphism and cancer risk was detected in the Caucasian
ethnicity (Table VI).
| Table V.Characteristics of subjects included
in the meta-analysis of interleukin-4 rs79071878 polymorphism and
cancer risk. |
Table V.
Characteristics of subjects included
in the meta-analysis of interleukin-4 rs79071878 polymorphism and
cancer risk.
|
|
|
|
| Case | Control |
|
|
|
|---|
|
|
|
|
|
|
|
|
|
|
|---|
| First author,
year | Country | Ethnicity | Cancer type | n | Genotypes
RP1.1/RP1.2/RP2.2 | Alleles RP1.1/RP2.2
(%) | n | Genotypes
RP1.1/RP1.2/RP2.2 | Alleles RP1.1/RP2.2
(%) | P-value HWE | NOS score | (Refs.) |
|---|
| Bozdoğan, 2015 | Turkey | Caucasian | Bladder cancer | 100 | 9/29/62 | 40.0/60.0 | 102 | 0/23/79 | 38.7/61.3 | 0.199 | 7 | (48) |
| Chen, 2006 | China | Asian | Gastric cancer | 151 | 100/45/6 | 81.1/18.9 | 107 | 81/23/3 | 86.4/13.6 | 0.393 | 7 | (46) |
| Hsieh, 2007 | Taiwan | Asian | Leiomyoma | 162 | 105/53/4 | 81.2/18.8 | 156 | 108/42/6 | 82.7/17.3 | 0.458 | 8 | (27) |
| Kesarwani,
2008 | India | Caucasian | Prostate
cancer | 200 | 126/69/5 | 80.3/19.7 | 202 | 130/62/10 | 79.7/20.3 | 0.465 | 8 | (52) |
| Konwar, 2009 | India | Caucasian | Breast cancer | 100 | 10/37/53 | 28.5/71.5 | 200 | 18/53/129 | 22.3/77.7 | 0.001 | 7 | (51) |
| Lai, 2005 | Taiwan | Asian | Gastric cancer | 123 | 82/38/3 | 82.1/17.9 | 103 | 66/33/4 | 80.1/19.9 | 0.961 | 7 | (14) |
| Shekari, 2012 | India | Caucasian | Cervical
cancer | 200 | 9/66/125 | 21.0/79.0 | 200 | 11/63/126 | 21.3/78.7 | 0.405 | 8 | (50) |
| Tsai, 2005 | Taiwan | Asian | Bladder cancer | 138 | 119/18/1 | 92.8/7.2 | 105 | 67/33/5 | 79.5/20.5 | 0.720 | 7 | (47) |
| Tsai, 2005 | Taiwan | Asian | Oral carcinoma | 121 | 97/30/3 | 88.8/11.2 | 105 | 67/33/5 | 47.7/52.3 | 0.720 | 7 | (29) |
| Yang, 2014 | Taiwan | Asian | Oral carcinoma | 463 | 309/145/9 | 82.4/17.6 | 623 | 398/207/18 | 80.5/19.5 | 0.146 | 8 | (53) |
| Yang, 2014 | Taiwan | Asian | Pharyngeal
carcinoma | 129 | 87/39/3 | 82.6/17.4 | 623 | 398/207/18 | 80.5/19.5 | 0.146 | 8 | (53) |
| Table VI.Subgroup analyses for inteleukin-4
rs79071878polymorphism and cancer risk. |
Table VI.
Subgroup analyses for inteleukin-4
rs79071878polymorphism and cancer risk.
| A, Bladder cancer
(n=2a) |
|---|
|
|---|
| Variable | P-value | OR (95% Cl) | I-square (%) | P-value for the
heterogeneity |
|---|
| RP1.1 vs.
RP1.2 | 0.56 | 1.09
(0.81–1.46) | 8% | 0.30 |
| RP1.2 vs.
RP2.2 | 0.008 | 1.40
(1.09–1.79) | 0% | 0.65 |
| RP2.2 vs.
RP1.1 | 0.006 | 0.62
(0.44–0.87) | 0% | 0.57 |
| RP1.1 vs. RP1.2/
RP2.2 | 0.30 | 1.17
(0.87–1.58) | 35% | 0.21 |
| RP1.2 vs.
RP1.1/RP2.2 | 0.83 | 1.03
(0.81–1.13) | 90% | 0.002 |
| RP2.2 vs. RP1.1/
RP1.2 | 0.002 | 0.69
(0.55–0.88) | 6% | 0.30 |
| RP1 vs. RP2 | 0.005 | 1.26
(1.00–1.58) | 0% | 0.44 |
|
| B, Gastric cancer
(n=2a) |
|
| RP1.1 vs.
RP1.2 | 0.36 | 0.83
(0.49–1.40) | 40% | 0.20 |
| RP1.2 vs.
RP2.2 | 0.73 | 1.21
(0.42–3.50) | 0% | 0.68 |
| RP2.2 vs.
RP1.1 | 0.94 | 1.04
(0.38–2.85) | 0% | 0.35 |
| RP1.1 vs.
RP1.2/RP2.2 | 0.55 | 0.84
(0.48–1.48) | 52% | 0.15 |
| RP1.2 vs.
RP1.1/RP2.2 | 0.35 | 1.21
(0.81–1.81) | 30% | 0.23 |
| RP2.2 vs.
RP1.1/RP1.2 | 0.97 | 0.98
(0.36–2.69) | 0% | 0.43 |
| RP1 vs. RP2 | 0.63 | 0.88
(0.52–1.47) | 57% | 0.13 |
|
| C, Leiomyoma
(n=1a) |
|
| RP1.1 vs.
RP1.2 | 0.29 | 0.77
(0.47–1.25) | NA | NA |
| RP1.2 vs.
RP2.2 | 0.35 | 1.89
(0.50–7.15) | NA | NA |
| RP2.2 vs.
RP1.1 | 0.57 | 0.69
(0.19–2.50) | NA | NA |
| RP1.1 vs.
RP1.2/RP2.2 | 0.40 | 0.82
(0.51–1.31) | NA | NA |
| RP1.2 vs.
RP1.1/RP2.2 | 0.26 | 1.32
(0.81–2.14) | NA | NA |
| RP2.2 vs.
RP1.1/RP1.2 | 0.49 | 0.63
(0.18–2.29) | NA | NA |
| RP1 vs. RP2 | 0.62 | 0.90
(0.60–1.35) | NA | NA |
|
| D, Oral carcinoma
(n=1a) |
|
| RP1.1 vs.
RP1.2 | 0.12 | 1.59
(0.89–2.86) | NA | NA |
| RP1.2 vs.
RP2.2 | 0.59 | 1.52
(0.33–6.89) | NA | NA |
| RP2.2 vs.
RP1.1 | 0.24 | 0.41
(0.10–1.79) | NA | NA |
| RP1.1 vs.
RP1.2/RP2.2 | 0.07 | 1.67
(0.95–2.92) | NA | NA |
| RP1.2 vs.
RP1.1/RP2.2 | 0.15 | 0.65
(0.37–1.17) | NA | NA |
| RP2.2 vs.
RP1.1/RP1.2 | 0.36 | 0.51
(0.12–2.18) | NA | NA |
| RP1 vs. RP2 | 0.06 | 1.60
(0.99–2.60) | NA | NA |
|
| E, Prostate cancer
(n=1a) |
|
| RP1.1 vs.
RP1.2 | 0.52 | 0.87
(0.57–1.33) | NA | NA |
| RP1.2 vs.
RP2.2 | 0.16 | 2.23
(0.72–6.87) | NA | NA |
| RP2.2 vs.
RP1.1 | 0.24 | 0.52
(0.17–1.55) | NA | NA |
| RP1.1 vs.
RP1.2/RP2.2 | 0.78 | 0.94
(0.63–1.42) | NA | NA |
| RP1.2 vs.
RP1.1/RP2.2 | 0.42 | 1.19
(0.78–1.81) | NA | NA |
| RP2.2 vs.
RP1.1/RP1.2 | 0.20 | 0.49
(0.17–1.47) | NA | NA |
| RP1 vs. RP2 | 0.85 | 1.03
(0.73–1.46) | NA | NA |
|
| F, Cervical cancer
(n=1a) |
|
| Variable | P-value | OR (95% Cl) | I-square (%) | P-value for the
heterogeneity |
| RP1.1 vs.
RP1.2 | 0.61 | 0.78
(0.30–2.01) | NA | NA |
| RP1.2 vs.
RP2.2 | 0.80 | 1.06
(0.69–1.61) | NA | NA |
| RP2.2 vs.
RP1.1 | 0.68 | 1.21
(0.49–3.03) | NA | NA |
| RP1.1 vs.
RP1.2/RP2.2 | 0.65 | 0.81
(0.33–2.00) | NA | NA |
| RP1.2 vs.
RP1.1/RP2.2 | 0.75 | 1.07
(0.70–1.63) | NA | NA |
| RP2.2 vs.
RP1.1/RP1.2 | 0.92 | 0.98
(0.65–1.47) | NA | NA |
| RP1 vs. RP2 | 0.93 | 0.99
(0.70–1.38) | NA | NA |
|
| G, Breast cancer
(n=1a) |
|
| RP1.1 vs.
RP1.2 | 0.61 | 0.80
(0.33–1.92) | NA | NA |
| RP1.2 vs.
RP2.2 | 0.05 | 1.70
(1.00–2.88) | NA | NA |
| RP2.2 vs.
RP1.1 | 0.48 | 0.74
(0.32–1.71) | NA | NA |
| RP1.1 vs.
RP1.2/RP2.2 | 0.78 | 1.12
(0.50–2.53) | NA | NA |
| RP1.2 vs.
RP1.1/RP2.2 | 0.06 | 1.63
(0.98–2.72) | NA | NA |
| RP2.2 vs.
RP1.1/RP1.2 | 0.06 | 0.62
(038–1.01) | NA | NA |
| RP1 vs. RP2 | 0.09 | 1.39
(0.95–2.05) | NA | NA |
|
| H, Caucasian
(n=4a) |
|
| RP1.1 vs.
RP1.2 | 0.74 | 0.94
(0.67–1.33) | 24% | 0.26 |
| RP1.2 vs.
RP2.2 | 0.03 | 1.38
(1.04–1.83) | 1% | 0.39 |
| RP2.2 vs.
RP1.1 | 0.05 | 0.61
(0.37–1.01) | 49% | 0.12 |
| RP1.1 vs.
RP1.2/RP2.2 | 0.64 | 1.08
(0.78–1.50) | 40% | 0.17 |
| RP1.2 vs.
RP1.1/RP2.2 | 0.06 | 1.26
(0.99–1.59) | 0% | 0.63 |
| RP2.2 vs.
RP1.1/RP1.2 | 0.01 | 0.71
(0.54–0.93) | 37% | 0.19 |
| RP1 vs. RP2 | 0.13 | 1.30
(0.92–1.82) | 66% | 0.03 |
|
| I, Asian
(n=6a) |
|
| RP1.1 vs.
RP1.2 | 0.41 | 1.17
(0.81–1.71) | 72% | 0.003 |
| RP1.2 vs.
RP2.2 | 0.14 | 1.46
(0.88–2.42) | 0% | 0.98 |
| RP2.2 vs.
RP1.1 | 0.05 | 0.62
(0.38–1.01) | 0% | 0.48 |
| RP1.1 vs.
RP1.2/RP2.2 | 0.31 | 1.22
(0.83–1.81) | 76% | 0.0009 |
| RP1.2 vs.
RP1.2/RP2.2 | 0.46 | 0.87
(0.61–1.25) | 70% | 0.006 |
| RP2.2 vs.
RP1.1/RP1.2 | 0.07 | 0.64
(0.40–1.04) | 0% | 0.67 |
| RP1 vs. RP2 | 0.23 | 1.23
(0.88–1.74) | 76% | 0.0008 |
Sensitivity analysis and publication
bias
Sensitivity analyses were performed by removing one
individual study from the analysis at a time. For IL-4 rs2243250
polymorphism, when the study of Chen et al (22) was omitted, the comparison in CT vs.
TT yielded positive result (P=0.03, OR=0.88, 95% CI 0.79–0.98). For
IL-4 rs2070874 and rs79071878 polymorphisms, however, removing
individual studies did not impact the overall results. Publication
bias was evaluated with funnel plots, and visual inspection of the
funnel plots for all investigated polymorphisms indicated that
there was no significant publication bias in the present
meta-analysis.
Discussion
Cancer is a major public health problem with
extremely high morbidity and mortality. Certain cytokine gene
polymorphisms may serve crucial roles in cancer pathogenesis. Among
these, IL-4 rs2243250, rs2070874 and rs79071878 polymorphisms are
three intensively studied variants. Previous studies have
demonstrated that the T allele of IL-4 rs2243250 and rs2070874
polymorphisms can increase binding of nuclear transcription factors
to the promoter region of the IL-4 gene, and thus lead to increased
transcription of IL-4 (32,43).
In addition, the rs79071878 polymorphism may also affect the
transcription activity of IL-4 (54). However, despite the identifications
of these potential mechanisms, the results concerning the
association of IL-4 gene polymorphisms and cancer risk remain
controversial. Thus, in order to clarify this association, a
meta-analysis was performed in the present study to estimate the
correlation between IL-4 gene polymorphisms (rs2243250, rs2070874
and rs79071878) and cancer susceptibility.
For IL-4 rs2243250 polymorphism, the present data
suggested that this polymorphism was significantly associated with
cancer risk. In subgroup analyses by cancer type, rs2243250 was
demonstrated to be associated with a higher risk of gastric cancer
and breast cancer. The CT/TT genotype carriers were at a lower risk
of developing gastric cancer or breast cancer compared with
individuals with the CC genotype. Furthermore, the CT genotype was
demonstrated to be associated with an increased risk of prostate
cancer compared with the CC/TT genotypes. These results suggested
that this polymorphism may serve different roles in different types
of malignancies. Further subgroup analysis by ethnicity revealed
that the IL-4 rs2243250 polymorphism was correlated with an
increased cancer risk in both Asian and Caucasian populations. The
overall analysis for the IL-4 rs2070874 polymorphism yielded no
significant association with general cancer risk. In the
cancer-type subgroup analysis, a significant association of IL-4
rs2070874 polymorphism with leukemia and oral carcinoma was
identified, with patients carrying the CT genotype or the C allele
being more likely to develop oral carcinoma. By contrast, for
leukemia the CT genotype carriers were at a lower risk of
developing leukemia. It is worth noting that these results should
be interpreted with caution, since our estimations regarding
leukemia and oral carcinoma were based on one single study.
Additionally, in ethnicity sub-analysis, the results indicated a
significant association with cancer susceptibility among Asian
populations under the recessive genetic model. Finally, the IL-4
rs79071878 polymorphism was overtly associated with a higher risk
of cancer under the allelic model. The results of subgroup analyses
indicated that IL-4 rs79071878 polymorphism was significantly
associated with bladder cancer and breast cancer in certain genetic
models, and an association between IL-4 rs79071878 polymorphism and
cancer susceptibility was only observed among Caucasians, but not
Asians. Overall, from general and subgroup analyses, it can be
concluded that IL-4 gene polymorphisms may be important in the
pathogenesis of certain types of cancer, and their effects on
cancer risk may be ethnic specific. Nevertheless, the amount of
relevant studies is not sufficient to draw a safe conclusion, and
further well-designed studies with larger patient sample size will
be required in the future to validate the present results.
Heterogeneity is one of the most important issues
when performing meta-analysis. In the present meta-analysis,
heterogeneity between studies existed in almost all comparisons.
Therefore, we attempted to detect the source of heterogeneity by
dividing included studies into different subgroups according to
cancer type and ethnicity. The heterogeneity was drastically
decreased in most subgroups, suggesting that these two factors
contribute to a significant portion of heterogeneity in the present
meta-analysis.
When interpreting the results of the present
meta-analysis, several limitations should be considered. Firstly,
the numbers of relevant studies were limited, and studies regarding
several particular types of cancer were extremely lacking.
Secondly, although funnel plots did not reveal any publication
bias, the possibility of publication bias cannot be completely
eliminated, since only published studies were included. Thirdly,
the present results were based on unadjusted estimates, while a
more precise analysis should have been adjusted by other factors,
including smoking, age, and environmental factors. Finally, the
present analyses did not consider the possibility of gene-gene or
SNP-SNP interactions or the possibility of linkage disequilibrium
between polymorphisms. Taking all these limitations into
consideration, the results reported by the current study should be
interpreted with caution.
In summary, the present results suggest that the
IL-4 rs2243250 and rs79071878 polymorphisms were associated with
cancer susceptibility. Further subgroup analyses revealed that the
effects of IL-4 gene polymorphisms on cancer risk may vary
depending on the cancer type and the ethnicity. However, given that
the present results were based on limited number of case-control
studies, further multi-center studies with larger sample size from
different populations are warranted to confirm our results.
References
|
1
|
Ferlay J, Soerjomataram I, Dikshit R, Eser
S, Mathers C, Rebelo M, Parkin DM, Forman D and Bray F: Cancer
incidence and mortality worldwide: Sources, methods and major
patterns in GLOBOCAN 2012. Int J Cancer. 136:E359–E386. 2015.
View Article : Google Scholar : PubMed/NCBI
|
|
2
|
Knox SS: From ‘omics’ to complex disease:
A systems biology approach to gene-environment interactions in
cancer. Cancer Cell Int. 10:112010. View Article : Google Scholar : PubMed/NCBI
|
|
3
|
Jang JP, Baek IC, Choi EJ and Kim TG:
Multiplex genotyping of cytokine gene SNPs using fluorescence bead
array. PLoS One. 10:e01180082015. View Article : Google Scholar : PubMed/NCBI
|
|
4
|
Balkwill F and Mantovani A: Inflammation
and cancer: Back to Virchow? Lancet. 357:539–545. 2001. View Article : Google Scholar : PubMed/NCBI
|
|
5
|
Leibovici D, Grossman HB, Dinney CP,
Millikan RE, Lerner S, Wang Y, Gu J, Dong Q and Wu X: Polymorphisms
in inflammation genes and bladder cancer: From initiation to
recurrence, progression, and survival. J Clin Oncol. 23:5746–5756.
2005. View Article : Google Scholar : PubMed/NCBI
|
|
6
|
Baniyash M: Chronic inflammation,
immunosuppression and cancer: New insights and outlook. Semin
Cancer Biol. 16:80–88. 2006. View Article : Google Scholar : PubMed/NCBI
|
|
7
|
Aggarwal BB, Vijayalekshmi RV and Sung B:
Targeting inflammatory pathways for prevention and therapy of
cancer: Short-term friend, long-term foe. Clin Cancer Res.
15:425–430. 2009. View Article : Google Scholar : PubMed/NCBI
|
|
8
|
Bidwell J, Keen L, Gallagher G, Kimberly
R, Huizinga T, McDermott MF, Oksenberg J, McNicholl J, Pociot F,
Hardt C and D'Alfonso S: Cytokine gene polymorphism in human
disease: On-line databases, supplement 1. Genes Immun. 2:61–70.
2001. View Article : Google Scholar : PubMed/NCBI
|
|
9
|
Wang HW and Joyce JA: Alternative
activation of tumor-associated macrophages by IL-4: Priming for
protumoral functions. Cell Cycle. 9:4824–4835. 2010. View Article : Google Scholar : PubMed/NCBI
|
|
10
|
Stang A: Critical evaluation of the
Newcastle-Ottawa scale for the assessment of the quality of
nonrandomized studies in meta-analyses. Eur J Epidemiol.
25:603–605. 2010. View Article : Google Scholar : PubMed/NCBI
|
|
11
|
Crusius JB, Canzian F, Capellá G, Peña AS,
Pera G, Sala N, Agudo A, Rico F, Del Giudice G, Palli D, et al:
Cytokine gene polymorphisms and the risk of adenocarcinoma of the
stomach in the European prospective investigation into cancer and
nutrition (EPIC-EURGAST). Ann Oncol. 19:1894–1902. 2008. View Article : Google Scholar : PubMed/NCBI
|
|
12
|
El-Omar EM, Rabkin CS, Gammon MD, Vaughan
TL, Risch HA, Schoenberg JB, Stanford JL, Mayne ST, Goedert J, Blot
WJ, et al: Increased risk of noncardia gastric cancer associated
with proinflammatory cytokine gene polymorphisms. Gastroenterology.
124:1193–1201. 2003. View Article : Google Scholar : PubMed/NCBI
|
|
13
|
García-González MA, Lanas A, Quintero E,
Nicolás D, Parra-Blanco A, Strunk M, Benito R, Simón M Angel,
Santolaria S, Sopeña F, et al: Gastric cancer susceptibility is not
linked to pro-and anti-inflammatory cytokine gene polymorphisms in
whites: A Nationwide Multicenter Study in Spain. Am J
Gastroenterol. 102:1878–1892. 2007. View Article : Google Scholar : PubMed/NCBI
|
|
14
|
Lai KC, Chen WC, Jeng LB, Li SY, Chou MC
and Tsai FJ: Association of genetic polymorphisms of MK, IL-4, p16,
p21, p53 genes and human gastric cancer in Taiwan. Eur J Surg
Oncol. 31:1135–1140. 2005. View Article : Google Scholar : PubMed/NCBI
|
|
15
|
Pan XF, Wen Y, Loh M, Wen YY, Yang SJ,
Zhao ZM, Tian Z, Huang H, Lan H, Chen F, et al: Interleukin-4 and
−8 gene polymorphisms and risk of gastric cancer in a population in
Southwestern China. Asian Pac J Cancer Prev. 15:2951–2957. 2014.
View Article : Google Scholar : PubMed/NCBI
|
|
16
|
Zambon CF, Basso D, Marchet A, Fasolo M,
Stranges A, Schiavon S, Navaglia F, Greco E, Fogar P, Falda A, et
al: IL-4-588C>T polymorphism and IL-4 receptor alpha
[Ex5+14A>G; Ex11+828A>G] haplotype concur in selecting H.
pylori cagA subtype infections. Clin Chim Acta. 389:139–145. 2008.
View Article : Google Scholar : PubMed/NCBI
|
|
17
|
Liang XL, Hu HB, Jia AP and Liu ZP:
Association of PTPN11 and interleukin-4 gene polymorphisms and
helicobacter pylori infection with susceptibility to gastric
cancer. Hai Nan Yi Xue. 2010:1–5. 2010.(In Chinese).
|
|
18
|
Chu H, Wang M, Yan F, Zhong D, Shi D, Ma
L, Pan X, Qin C, Yin C and Zhang Z: Polymorphisms in the IL-13 and
IL-4R genes are associated with the development of renal cell
carcinoma. Ann Oncol. 23:2114–2121. 2012. View Article : Google Scholar : PubMed/NCBI
|
|
19
|
Cozar JM, Romero JM, Aptsiauri N, Vazquez
F, Vilchez JR, Tallada M, Garrido F and Ruiz-Cabello F: High
incidence of CTLA-4 AA (CT60) polymorphism in renal cell cancer.
Hum Immunol. 68:698–704. 2007. View Article : Google Scholar : PubMed/NCBI
|
|
20
|
Joshi NN, Bhat S, Hake S, Kale M and
Kannan S: Opposing effects of pro- and anti-inflammatory cytokine
gene polymorphisms on the risk for breast cancer in western Indian
women: A pilot study. Int J Immunogenet. 41:242–249. 2014.
View Article : Google Scholar : PubMed/NCBI
|
|
21
|
Schonfeld SJ, Bhatti P, Brown EE, Linet
MS, Simon SL, Weinstock RM, Hutchinson AA, Stovall M, Preston DL,
Alexander BH, et al: Polymorphisms in oxidative stress and
inflammation pathway genes, low-dose ionizing radiation, and the
risk of breast cancer among US radiologic technologists. Cancer
Causes Control. 21:1857–1866. 2010. View Article : Google Scholar : PubMed/NCBI
|
|
22
|
Chen J, Ying XM, Huang XM, Huang P and Yan
SC: Association between polymorphisms in selected inflammatory
response genes and the risk of prostate cancer. Onco Targets Ther.
9:223–229. 2016.PubMed/NCBI
|
|
23
|
Olson SH, Orlow I, Simon J, Tommasi D, Roy
P, Bayuga S, Ludwig E, Zauber AG and Kurtz RC: Allergies, variants
in IL-4 and IL-4R alpha genes, and risk of pancreatic cancer.
Cancer Detect Prev. 31:345–351. 2007. View Article : Google Scholar : PubMed/NCBI
|
|
24
|
Welsh MM, Karagas MR, Kuriger JK, Houseman
A, Spencer SK, Perry AE and Nelson HH: Genetic determinants of
UV-susceptibility in non-melanoma skin cancer. PLoS One.
6:e200192011. View Article : Google Scholar : PubMed/NCBI
|
|
25
|
Howell WM, Turner SJ, Theaker JM and
Bateman AC: Cytokine gene single nucleotide polymorphisms and
susceptibility to and prognosis in cutaneous malignant melanoma.
Eur J Immunogenet. 30:409–414. 2003. View Article : Google Scholar : PubMed/NCBI
|
|
26
|
Andrie E, Michos A, Kalampoki V,
Pourtsidis A, Moschovi M, Polychronopoulou S,
Athanasiadou-Piperopoulou F, Kalmanti M, Hatzakis A, Paraskevis D,
et al: Genetic variants in immunoregulatory genes and risk for
childhood lymphomas. Eur J Haematol. 83:334–342. 2009. View Article : Google Scholar : PubMed/NCBI
|
|
27
|
Monroy CM, Cortes AC, Lopez MS, D'Amelio
AM Jr, Etzel CJ, Younes A, Strom SS and El-Zein RA: Hodgkin disease
risk: Role of genetic polymorphisms and gene-gene interactions in
inflammation pathway genes. Mol Carcinog. 50:36–46. 2011.
View Article : Google Scholar : PubMed/NCBI
|
|
28
|
Gaur P, Mittal M, Mohanti B and Das S:
Functional variants of IL4 and IL6 genes and risk of
tobacco-related oral carcinoma in high-risk Asian Indians. Oral
Dis. 17:720–726. 2011. View Article : Google Scholar : PubMed/NCBI
|
|
29
|
Tsai MH, Chen WC, Tsai CH, Hang LW and
Tsai FJ: Interleukin-4 gene, but not the interleukin-1 beta gene
polymorphism, is associated with oral cancer. J Clin Lab Anal.
19:93–98. 2005. View Article : Google Scholar : PubMed/NCBI
|
|
30
|
Vairaktaris E, Yapijakis C, Serefoglou Z,
Avgoustidis D, Critselis E, Spyridonidou S, Vylliotis A, Derka S,
Vassiliou S, Nkenke E and Patsouris E: Gene expression
polymorphisms of interleukins-1 beta, −4, −6, −8, −10, and tumor
necrosis factors-alpha, -beta: Regression analysis of their effect
upon oral squamous cell carcinoma. J Cancer Res Clin Oncol.
134:821–832. 2008. View Article : Google Scholar : PubMed/NCBI
|
|
31
|
Lu Y, Wu Z, Peng Q, Ma L, Zhang X, Zhao J,
Qin X and Li S: Role of IL-4 gene polymorphisms in HBV-related
hepatocellular carcinoma in a Chinese population. PLoS One.
9:e1100612014. View Article : Google Scholar : PubMed/NCBI
|
|
32
|
Saxena R, Chawla YK, Verma I and Kaur J:
Effect of IL-12B, IL-2, TGF-β1, and IL-4 polymorphism and
expression on hepatitis B progression. J Interferon Cytokine Res.
34:117–128. 2014. View Article : Google Scholar : PubMed/NCBI
|
|
33
|
Li X, Shi W, Yu G, Lin L, Yang B, Li J,
Guo W, Tang C, Wang H, Gao H, et al: Interleukin-4 −590T/C
polymorphism influences the susceptibility to nonsmall cell lung
cancer. DNA Cell Biol. 31:797–800. 2012. View Article : Google Scholar : PubMed/NCBI
|
|
34
|
Gu J, Shen Y and Zhang Y: Association
between interleukin-4 polymorphisms and environment and nonsmall
cell lung cancer in Chinese population. J Cancer Res Ther. 10
Suppl:C135–C139. 2014. View Article : Google Scholar : PubMed/NCBI
|
|
35
|
Chang WS, Wang SC, Chuang CL, Ji HX, Hsiao
CL, Hsu CM, Tsai CW, Liu SP, Hsu PC, Lo YL and Bau DT: Contribution
of interleukin-4 genotypes to lung cancer risk in Taiwan.
Anticancer Res. 35:6297–6301. 2015.PubMed/NCBI
|
|
36
|
Suchy J, Kłujszo-Grabowska E, Kładny J,
Cybulski C, Wokołorczyk D, Szymańska-Pasternak J, Kurzawski G,
Scott RJ and Lubiński J: Inflammatory response gene polymorphisms
and their relationship with colorectal cancer risk. BMC Cancer.
8:1122008. View Article : Google Scholar : PubMed/NCBI
|
|
37
|
Wilkening S, Tavelin B, Canzian F, Enquist
K, Palmqvist R, Altieri A, Hallmans G, Hemminki K, Lenner P and
Försti A: Interleukin promoter polymorphisms and prognosis in
colorectal cancer. Carcinogenesis. 29:1202–1206. 2008. View Article : Google Scholar : PubMed/NCBI
|
|
38
|
Yannopoulos A, Nikiteas N,
Chatzitheofylaktou A and Tsigris C: The (−590 C/T) polymorphism in
the interleukin-4 gene is associated with increased risk for early
stages of corolectal adenocarcinoma. In Vivo. 21:1031–1035.
2007.PubMed/NCBI
|
|
39
|
Wiemels JL, Wiencke JK, Kelsey KT,
Moghadassi M, Rice T, Urayama KY, Miike R and Wrensch M:
Allergy-related polymorphisms influence glioma status and serum IgE
levels. Cancer Epidemiol Biomarkers Prev. 16:1229–1235. 2007.
View Article : Google Scholar : PubMed/NCBI
|
|
40
|
Purdue MP, Sakoda LC, Graubard BI, Welch
R, Chanock SJ, Sesterhenn IA, Rubertone MV, Erickson RL and McGlynn
KA: A case-control investigation of immune function gene
polymorphisms and risk of testicular germ cell tumors. Cancer
Epidemiol Biomarkers Prev. 16:77–83. 2007. View Article : Google Scholar : PubMed/NCBI
|
|
41
|
Chu H, Ma L, Wang M, Shi D, Qin C, Yuan L,
Yin C and Zhang Z: The polymorphisms of IL-4, IL-4R and IL-13 genes
and bladder cancer risk in a Chinese population: A case-control
study. Mol Biol Rep. 39:5349–5357. 2012. View Article : Google Scholar : PubMed/NCBI
|
|
42
|
Amirzargar AA, Bagheri M, Ghavamzadeh A,
Alimoghadam K, Khosravi F, Rezaei N, Moheydin M, Ansaripour B,
Moradi B and Nikbin B: Cytokine gene polymorphism in Iranian
patients with chronic myelogenous leukaemia. Int J Immunogenet.
32:167–171. 2005. View Article : Google Scholar : PubMed/NCBI
|
|
43
|
Shamran HA, Hamza SJ, Yaseen NY,
Al-Juboory AA, Taub DD, Price RL, Nagarkatti M, Nagarkatti PS and
Singh UP: Impact of single nucleotide polymorphism in IL-4, IL-4R
genes and systemic concentration of IL-4 on the incidence of glioma
in Iraqi patients. Int J Med Sci. 11:1147–1153. 2014. View Article : Google Scholar : PubMed/NCBI
|
|
44
|
Lu Y: Association of variants of
inflammation and immunity genes with susceptibility to gastric
cancer. Nanjing Medical University; 2010, (In Chinese).
|
|
45
|
Gu F, Qureshi AA, Niu T, Kraft P, Guo Q,
Hunter DJ and Han J: Interleukin and interleukin receptor gene
polymorphisms and susceptibility to melanoma. Melanoma Res.
18:330–335. 2008. View Article : Google Scholar : PubMed/NCBI
|
|
46
|
Chen XL: TNF-β IL-4 genes polymorphisms
and Helicobacter pylori in gastric cancer and duodenal ulcer in the
Chinese. Fujian Medical University; 2006, (In Chinese).
|
|
47
|
Tsai FJ, Chang CH, Chen CC, Hsia TC, Chen
HY and Chen WC: Interleukin-4 gene intron-3 polymorphism is
associated with transitional cell carcinoma of the urinary bladder.
BJU Int. 95:432–435. 2005. View Article : Google Scholar : PubMed/NCBI
|
|
48
|
Bozdoğan ST, Erol B, Dursun A, Bozdoğan G,
Dönmez I, Mungan NA and Seydaoglu G: The IL-1RN and IL-4 gene
polymorphisms are potential genetic markers of susceptibility to
bladder cancer: A case-control study. World J Urol. 33:389–395.
2015. View Article : Google Scholar : PubMed/NCBI
|
|
49
|
Hsieh YY, Chang CC, Tsai CH, Lin CC and
Tsai FJ: Interleukin (IL)-12 receptor beta1 codon 378 G homozygote
and allele, but not IL-1 (beta-511 promoter, 3953 exon 5, receptor
antagonist), IL-2 114, IL-4-590 intron 3, IL-8 3′-UTR2767, and
IL-18 105, are associated with higher susceptibility to leiomyoma.
Fertil Steril. 87:886–895. 2007. View Article : Google Scholar : PubMed/NCBI
|
|
50
|
Shekari M, Kordi-Tamandani DM, MalekZadeh
K, Sobti RC, Karimi S and Suri V: Effect of anti-inflammatory
(IL-4, IL-10) cytokine genes in relation to risk of cervical
carcinoma. Am J Clin Oncol. 35:514–519. 2012. View Article : Google Scholar : PubMed/NCBI
|
|
51
|
Konwar R, Chaudhary P, Kumar S, Mishra D,
Chattopadhyay N and Bid HK: Breast cancer risk associated with
polymorphisms of IL-1RN and IL-4 gene in Indian women. Oncol Res.
17:367–372. 2009. View Article : Google Scholar : PubMed/NCBI
|
|
52
|
Kesarwani P, Ahirwar DK, Mandhani A and
Mittal RD: Association between-174 G/C promoter polymorphism of the
interleukin-6 gene and progression of prostate cancer in North
Indian population. DNA Cell Biol. 27:505–510. 2008. View Article : Google Scholar : PubMed/NCBI
|
|
53
|
Yang CM, Chen HC, Hou YY, Lee MC, Liou HH,
Huang SJ, Yen LM, Eng DM, Hsieh YD and Ger LP: A high IL-4
production diplotype is associated with an increased risk but
better prognosis of oral and pharyngeal carcinomas. Arch Oral Biol.
59:35–46. 2014. View Article : Google Scholar : PubMed/NCBI
|
|
54
|
Salimi S, Mohammadoo-Khorasani M, Yaghmaei
M, Mokhtari M and Moossavi M: Possible association of IL-4 VNTR
polymorphism with susceptibility to preeclampsia. Biomed Res Int.
2014:4970312014. View Article : Google Scholar : PubMed/NCBI
|