Introduction
Pregnancy-associated breast cancer (PABC) is a
primary breast cancer characterized by breast lumps, breast
thickening and changes in breast shape or pits of skin (1). It occurs during pregnancy or within
one year postpartum, with an increased risk of metastasis and
mortality. The incidence rate of PABC is ~0.76–3.80% and the age is
23–47 years old (2). The incidence
of PABC has risen due to women delaying childbearing (3). Despite efforts being made to improve
the diagnosis and treatment of PABC, the development of clinically
validated detection markers represents a great challenge.
Therefore, it is important to understand the underlying molecular
mechanisms of PABC to provide the treatment basis for patients with
PABC.
Multiple epidemiological studies have reported that
the genetic factors, including breast cancer 1, early onset
(BRCA1) or BRCA2 mutations, are involved in
increasing the incidence of PABC (4–6).
Overexpression of tumor protein p53 and Erb-B2 receptor tyrosine
kinase 2 (ERBB2) in patients with PABC has been demonstrated
to lead to high proliferation of the tumors (7). Furthermore, C-X-C motif chemokine
ligand 13 (CXCL13) and C-C motif chemokine ligand 20
(CCL20) have also been demonstrated to be associated with
the progression of PABC (8).
Although potential biomarkers associated with PABC have been
studied previously, it is far from enough for the diagnosis and
treatment of PABC.
The breast consists of two major cell populations,
stromal and epithelial cells, that communicate with each other
through the extracellular matrix (9). Breast cancer manifests in the
epithelium, but the involvement of stromal cells in tumorigenesis
is also receiving attention (10).
In the present study, gene expression profile data GSE31192 was
downloaded to identify the differentially expressed genes (DEGs)
between tumor associated stromal cells and normal stromal cells in
PABC. Based on the obtained DEGs, Gene Ontology (GO) functional
annotation, Kyoto Encyclopedia of Genes and Genomes (KEGG) pathway
enrichment analysis and protein-protein interaction (PPI) network
analysis were performed. Notably, in order to validate the findings
of the present study, microarray data of GSE15852 were downloaded,
and the DEGs between 43 breast tumors and their paired normal
controls were identified. These DEGs were subsequently compared
with those in GSE31192. The aim of the present study was to explore
the DEGs in tumor-associated stroma of PABC using bioinformatics
methods.
Data and methods
Affymetrix microarray data
The unstandardized gene expression profile
microarray data GSE31192 was downloaded from the Gene Expression
Omnibus (GEO; http://www.ncbi.nlm.nih.gov/geo/) (11) database of the National Center for
Biotechnology Information, which was deposited by Harvell et
al (9). The data platform was
Affymetrix Human Genome U133 Plus 2.0 Array (Affymetrix, Inc.;
Thermo Fisher Scientific, Inc., Waltham, MA, USA). The dataset
included 33 samples that were obtained from women whose tumors
arose while they were pregnant or within 1 year of delivery, and
from age-matched controls who had never been pregnant. In the
present study, 7 samples of tumor associated stromal cells and 4
samples of normal stromal cells in patients with PABC were selected
to study the differences in gene expression.
Data preprocessing and DEGs
analysis
All raw data were quantile normalized using the
Robust Multiarray Averaging (RMA) method (12) in the Affy version 1.52.0
(http://www.bioconductor.org/packages/release/bioc/html/affy.html)
(13) package in R language. In
addition, preprocessing including RMA background correction and
conversion of probe ID to gene symbol were performed. Eventually,
the standardized gene expression matrix of samples was obtained.
The DEGs between tumor associated stromal cells and normal stromal
cells in PABC patients were analyzed with Limma version 3.30.11
(http://www.bioconductor.org/packages/release/bioc/html/limma.html)
(14) package in R language.
Student's t-tests were used to obtain the corresponding P-value of
the gene symbols. P<0.01 and log2 fold change (FC) >1were
considered as the cut-off values.
GO and KEGG pathway enrichment
analyses
GO (http://www.geneontology.org) database (15) is a tool for the functional
unification of large-scale genomic data, which includes 3
categories: Biological process (BP), molecular function and
cellular component. The KEGG (http://www.genome.ad.jp/kegg/) (16) database is used to classify
correlating gene sets into their respective pathways. In the
present study, the GO function and KEGG pathway enrichment analyses
for the DEGs were performed using the Database for Annotation,
Visualization and Integrated Discovery (DAVID version 6.8;
https://david.ncifcrf.gov/) (17) online tool, which aimed to provide
functional explanations of a large number of genes derived from
genomic studies and proteins. With the enrichment thresholds of
modified fisher exact P-value <0.05 and the count number >2,
the DEG enrichment results in the GO BP and KEGG pathway were
obtained (16).
PPI network construction
Search Tool for the Retrieval of Interacting Genes
(STRING version 10.0; http://string.embl.de/) (18) is a network resource and biological
database of predicted and known PPIs. In this tool, the data of
confidence scores were calculated for all protein interactions
(19). In the present study, the
DEGs were mapped into the STRING database to identify significant
protein pairs with a combined score >0.4. Then, the PPI network
was constructed based on the obtained PPI interaction pairs.
Previous studies on biological networks have revealed that most PPI
networks obeyed the scale-free attribution. Thus, the connectivity
degree was analyzed using the network statistics to obtain the
critical nodes, namely hub proteins (20).
Data validation based on GSE15852
In order to validate the reliability of the results,
the expression profile microarray GSE15852 was downloaded from the
GEO database based on the platform of GPL96 (HG-U133A) Affymetrix
Human Genome U133A (Affymetrix Inc.; Thermo Fisher Scientific,
Inc.). There were 86 samples in this dataset, including 43 breast
tumors and their paired normal control.
The procedures of data preprocessing were the same
as those detailed above. The DEGs between the 43 breast tumors and
their paired normal control were then identified with the
thresholds of P<0.01 and log2 FC >1. The
identified DEGs were subsequently compared with the DEGs identified
in GSE31192.
Results
DEG analysis
In order to obtain DEGs between tumor-associated
stromal cells and normal stromal cells in patients with PABC, the
publicly available microarray dataset was downloaded from GEO and
analyzed with the Limma package. With P<0.01 and log2 FC >1,
a total of 480 genes were identified, including 94 upregulated
genes and 386 downregulated ones.
GO enrichment analysis of DEGs
To investigate the functional changes in the
pathologic course of PABC, the identified DEGs were mapped to the
GO database. Tables I and II list the top 10 GOBP enrichment
results of upregulated and downregulated DEGs, respectively. The
upregulated DEGs were primarily enriched in BP terms associated
with the immune response (12 genes), regulation of cell
proliferation (10 genes) and defense response (9 genes). For
instance, interleukin 18 (IL18) and cluster of
differentiation 274 (CD274) were primarily enriched in the
immune response. The downregulated DEGs were enriched in cell
surface receptor linked signal transduction (49 genes), cell
adhesion (45 genes) and biological adhesion (45 genes).
 | Table I.GO biological process functional
enrichment analysis results of upregulated genes (top 10). |
Table I.
GO biological process functional
enrichment analysis results of upregulated genes (top 10).
| Category | Term | Description | Count | P-value |
|---|
| BP | GO:0006955 | Immune
response | 12 |
8.59×10⁻⁵ |
| BP | GO:0042127 | Regulation of cell
proliferation | 10 |
4.15×10⁻³ |
| BP | GO:0006952 | Defense
response | 9 |
3.21×10⁻³ |
| BP | GO:0007267 | Cell-cell
signaling | 8 |
1.04×10⁻² |
| BP | GO:0042981 | Regulation of
apoptosis | 8 |
4.32×10⁻² |
| BP | GO:0043067 | Regulation of
programmed cell death | 8 |
4.52×10⁻² |
| BP | GO:0010941 | Regulation of cell
death | 8 |
4.60×10⁻² |
| BP | GO:0051249 | Regulation of
lymphocyte activation | 6 |
3.28×10⁻⁴ |
| BP | GO:0002694 | Regulation of
leukocyte activation | 6 |
5.55×10⁻⁴ |
| BP | GO:0050865 | Regulation of cell
activation | 6 |
7.05×10⁻⁴ |
| Table II.Gene Ontology biological process P
functional enrichment analysis results of downregulated genes (top
10). |
Table II.
Gene Ontology biological process P
functional enrichment analysis results of downregulated genes (top
10).
| Category | Term | Description | Count | P-value |
|---|
| BP | GO:0007166 | Cell surface
receptor linked signal transduction | 49 |
1.14×10⁻² |
| BP | GO:0007155 | Cell adhesion | 45 |
9.72×10⁻¹³ |
| BP | GO:0022610 | Biological
adhesion | 45 |
1.01×10⁻¹² |
| BP | GO:0007610 | Behavior | 29 |
5.78×10⁻⁸ |
| BP | GO:0010033 | Response to organic
substance | 28 |
4.60×10⁻⁴ |
| BP | GO:0042127 | Regulation of cell
proliferation | 28 |
1.70×10⁻³ |
| BP | GO:0042981 | Regulation of
apoptosis | 27 |
4.56×10⁻³ |
| BP | GO:0043067 | Regulation of
programmed cell death | 27 |
5.18×10⁻³ |
| BP | GO:0010941 | Regulation of cell
death | 27 |
5.41×10⁻³ |
| BP | GO:0010604 | Positive regulation
of macromolecule metabolic process | 27 |
1.01×10⁻² |
KEGG pathway enrichment analysis of
DEGs
To gain further insights into the changes of
biological pathways in PABC, significant enrichment of the DEGs in
was observed in multiple KEGG terms. The significant pathway
enrichment results were listed in Tables III and IV. As revealed in Table III, only one significant pathway
enriched by upregulated DEGs was obtained: The cytokine-cytokine
receptor interaction pathway. In addition, 9 pathways of
downregulated DEGs were obtained, including focal adhesion (21
genes), pathways in cancer (17 genes), ECM-receptor interaction (13
genes), and vascular smooth muscle contraction (7 genes).
| Table III.KEGG pathway enrichment analysis
results of upregulated genes. |
Table III.
KEGG pathway enrichment analysis
results of upregulated genes.
| Category | Term | Description | Count | P-value |
|---|
| KEGG | hsa04060 | Cytokine-cytokine
receptor interaction | 6 |
7.94×10⁻³ |
| Table IV.KEGG pathway enrichment analysis
results of downregulated genes. |
Table IV.
KEGG pathway enrichment analysis
results of downregulated genes.
| Category | Term | Description | Count | P-value |
|---|
| KEGG | hsa04510 | Focal adhesion | 21 |
2.29×10⁻⁸ |
| KEGG | hsa05200 | Pathways in
cancer | 17 |
3.45×10⁻³ |
| KEGG | hsa04512 | ECM-receptor
interaction | 13 |
3.84×10⁻⁷ |
| KEGG | hsa05210 | Colorectal
cancer | 8 |
3.14×10⁻³ |
| KEGG | hsa05215 | Prostate
cancer | 8 |
4.34×10⁻³ |
| KEGG | hsa04360 | Axon guidance | 8 |
2.96×10⁻² |
| KEGG | hsa04012 | ErbB signaling
pathway | 7 |
1.51×10⁻² |
| KEGG | hsa04270 | Vascular smooth
muscle contraction | 7 |
4.50×10⁻² |
| KEGG | hsa05222 | Small cell lung
cancer | 6 |
4.47×10⁻² |
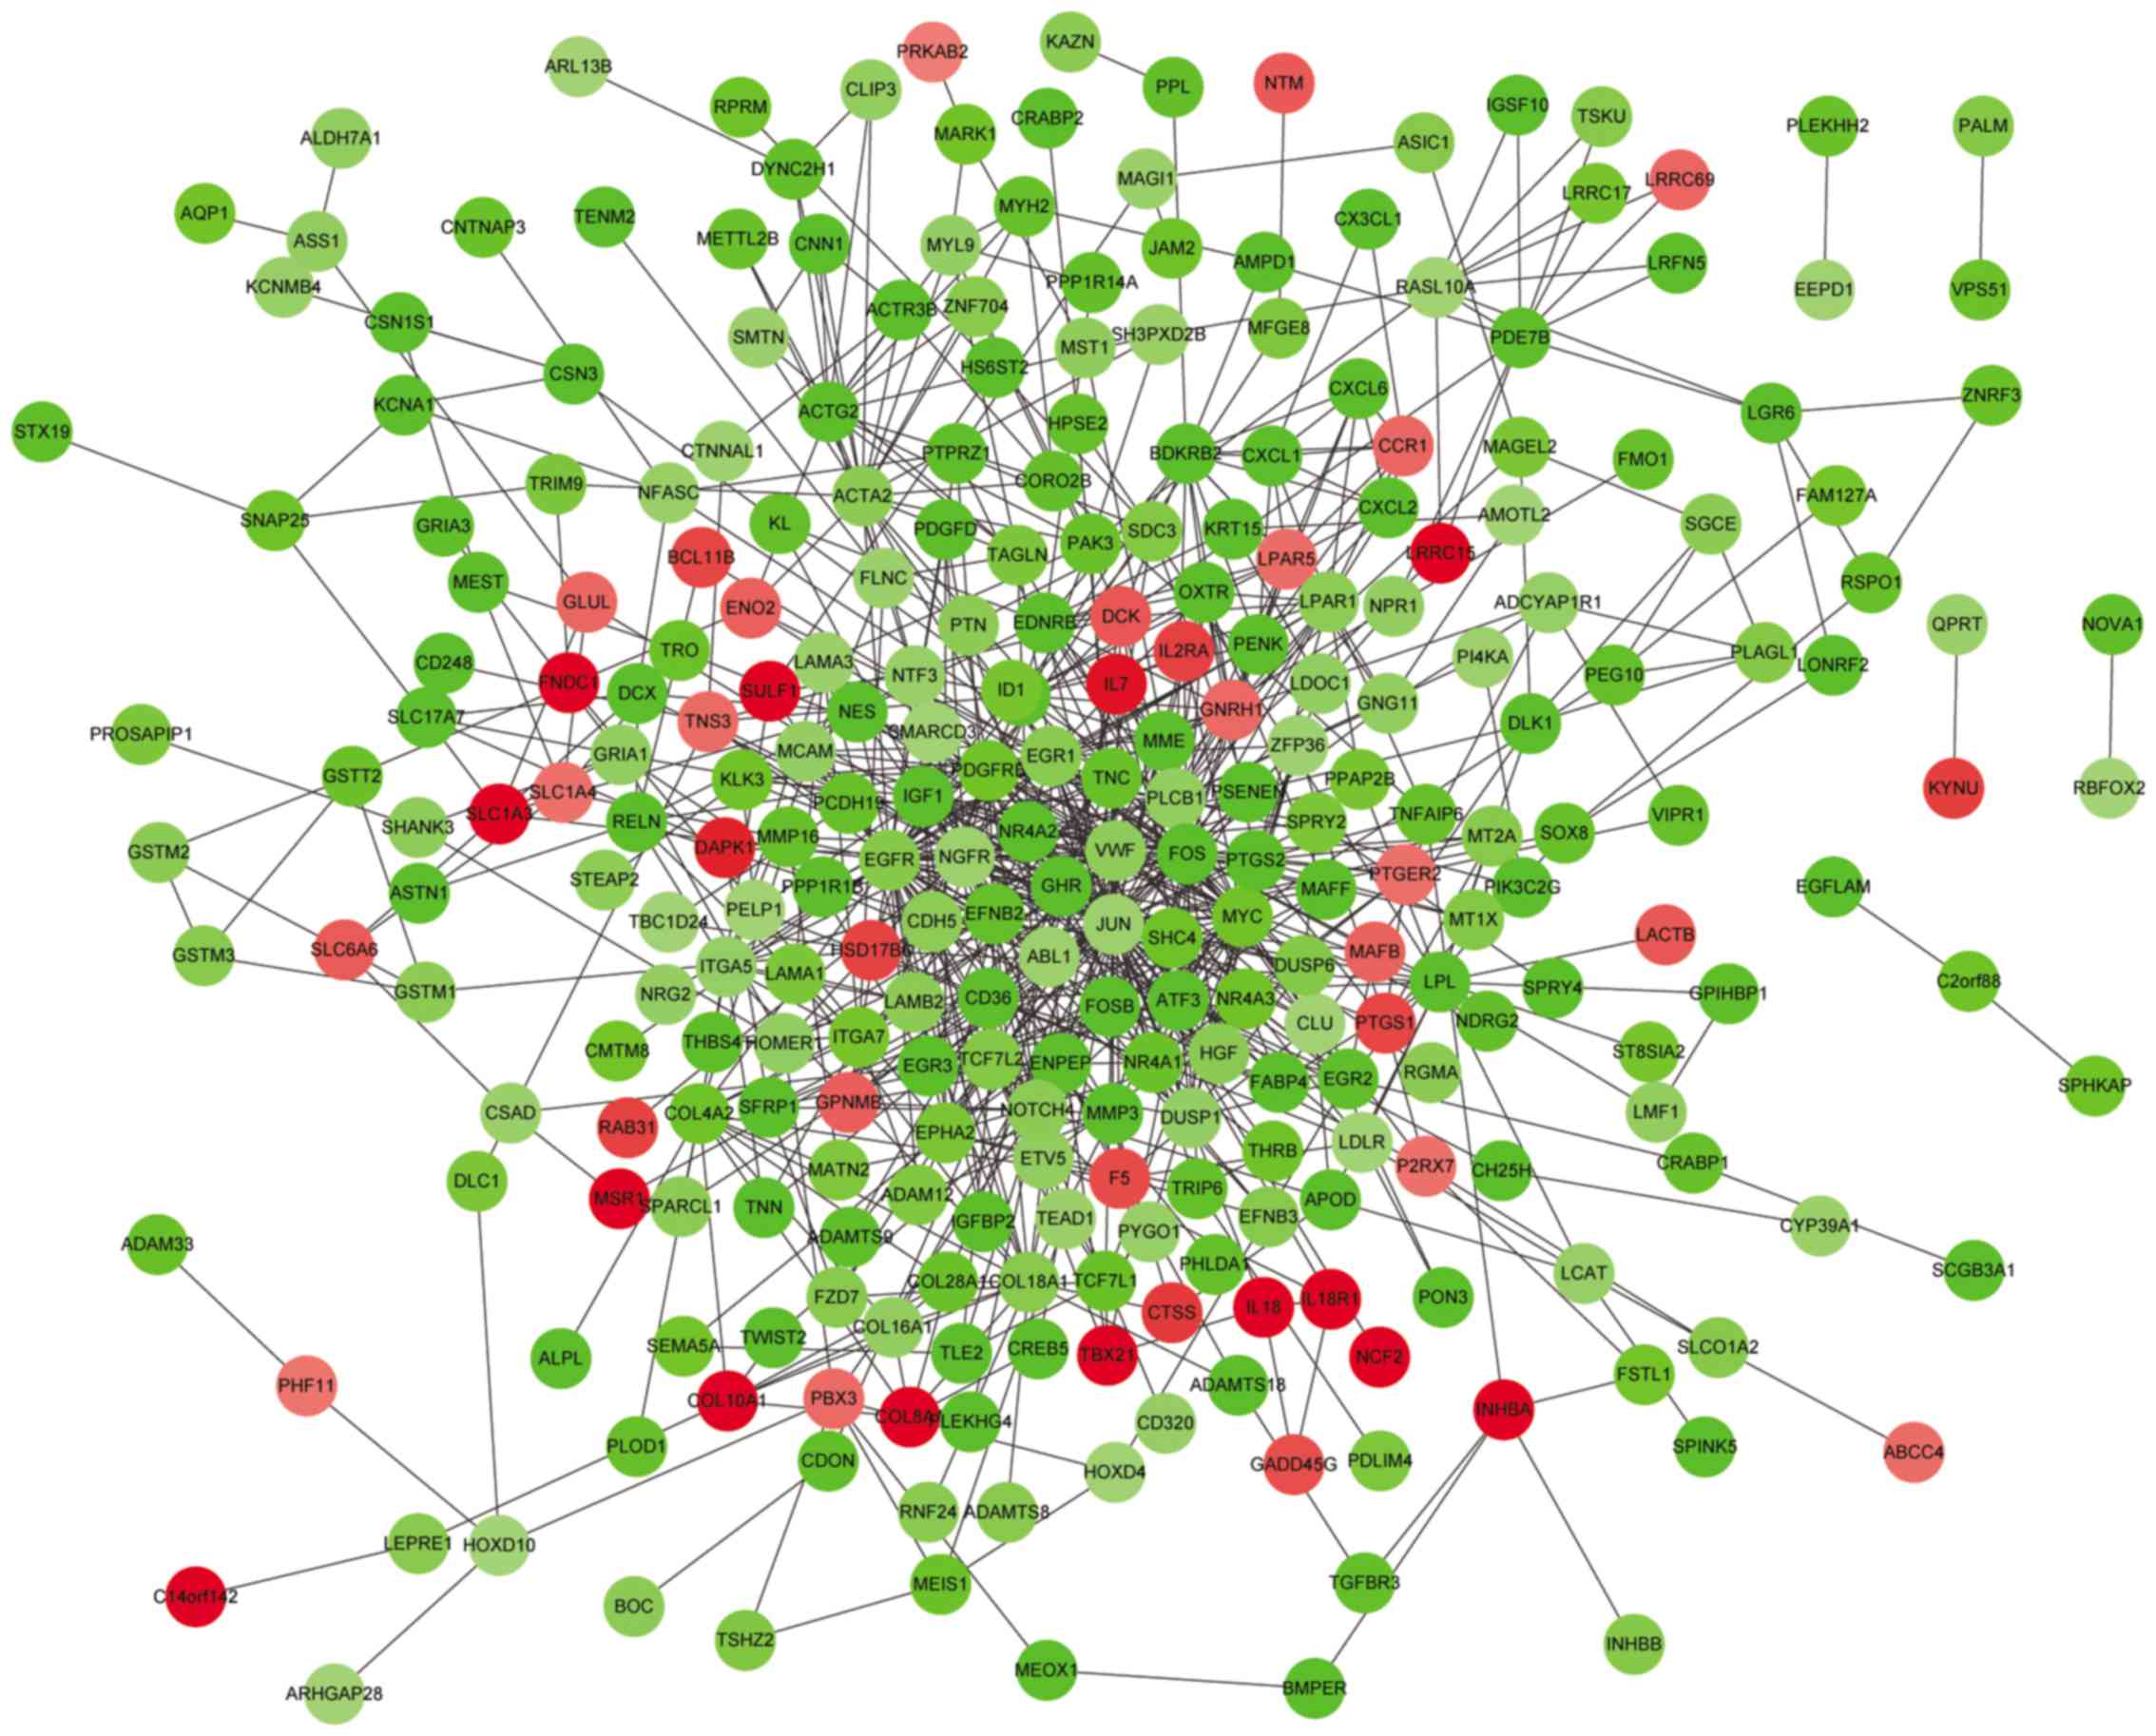
PPI network construction
In order to obtain novel insights into protein
function, the PPI network was constructed. Using STRING (combined
score >0.4), a total of 286 nodes and 811 protein interaction
pairs were obtained (Fig. 1). The
nodes with degree ≥10 in the PPI network were listed in Table V, including jun proto-oncogene
(JUN; degree=61), FBJ murine osteosarcoma viral oncogene
homolog (FOS; degree=50), epidermal growth factor receptor
(EGFR; degree=48), V-myc avian myelocytomatosis viral
oncogene homolog (MYC; degree=32), and α-smooth muscle actin
(ACTA2; degree=21).
| Table V.Nodes with higher connectivity degree
in the PPI network of differentially expressed genes (degree
≥10). |
Table V.
Nodes with higher connectivity degree
in the PPI network of differentially expressed genes (degree
≥10).
| Node | Degree | Node | Degree | Node | Degree | Node | Degree |
|---|
| JUN | 61 | LPL | 17 | EPHA2 | 14 | MMP3 | 12 |
| FOS | 50 | NOTCH4 | 16 | PENK | 13 | OXTR | 12 |
| EGFR | 48 | ABL1 | 16 | TNC | 13 | CD36 | 12 |
| MYC | 32 | ACTG2 | 16 | EGR2 | 13 | PDE7B | 11 |
| EGR1 | 27 | NGFR | 16 | BDKRB2 | 13 | LAMB2 | 11 |
| IGF1 | 23 | COL4A2 | 16 | ITGA7 | 13 | NES | 11 |
| PDGFRB | 22 | PLCB1 | 16 | FOSB | 13 | HSD17B6 | 10 |
| ACTA2 | 21 | ATF3 | 15 | TCF7L2 | 13 | RASL10A | 10 |
| LPAR1 | 19 | GNRH1 | 15 | DUSP1 | 13 | MME | 10 |
| VWF | 19 | ITGA5 | 14 | LPAR5 | 13 | EGR3 | 10 |
| COL18A1 | 18 | NR4A1 | 14 | EDNRB | 12 |
|
|
| PTGS2 | 17 | TAC1 | 14 | NR4A2 | 12 |
|
|
Data validation based on GSE15852
Following data validation of the DEGs based on
GSE15852 microarray data, the hub genes obtained in GSE31192,
including JUN, FOS, EGFR, MYC and
ACTA2 were revealed to have the same expression levels as in
GSE15852. In addition, IL18 (enriched in BP terms associated
with the immune response) was also upregulated in GSE15852. The
identified DEGs in GSE15852 can be obtained from http://pan.baidu.com/share/link?shareid=988837841&uk=3125911049.
Discussion
PABC is a malignant tumor that poses a serious
threat to women's health (21).
Therefore, exploration of the pathogenesis of PABC is urgent. In
the present study, based on the predefined thresholds of the
software and online tools used, a total of 480 DEGs were identified
between tumor stromal cells and normal stromal cells in patients
with PABC, including JUN, FOS, MYC,
ACTA2, IL18 and CD274. These genes were
primarily enriched in pathways in cancer, and vascular smooth
muscle contraction, and in GO BP terms were associated with cell
surface receptor linked signal transduction and the immune
response. Furthermore, the DEGs of JUN, FOS,
MYC and ACTA2 were hub genes with higher degrees in
the PPI network. Notably, these DEGs, with the exception of
CD274, were validated by the dataset of GSE15852.
By analyzing the DEGs in the PPI network,
JUN, FOS, MYC and ACTA2 were revealed
to be hub genes with higher degrees. JUN and FOS are
proto-oncogenes which are involved in multiple tumors. JUN
is the component of transcription factor activator protein 1
(AP-1), which primarily forms heterodimers with FOS, and was
the first oncogenic transcription factor to be discovered (22). AP-1 participates in multiple
cellular processes, including cell proliferation, transformation
and death, and is also involved in tumorigenesis, proliferation and
metastasis. JUN is activated by c-jun N-terminal kinases
(JNKs) through c-jun N-terminal phosphorylation of the JNK pathway
(23). The binding of JUN
and FOS to a high-affinity AP-1 binding site on DNA induces
gene transcription and promotes tumorigenesis (24). Previous studies have demonstrated
that human chorionic gonadotropin in the breast cancer Michigan
Cancer Foundation-7 cell line exerts anti-proliferative and
anti-invasive effects by downregulating nuclear factor-κB and AP-1
transcription factors, so as to induce a protective effect in
pregnant women (25). Notably, a
previous study has also reported that deregulation of JUN
expression results in the metastasis of breast cancer (26). Therefore, deregulation of
JUN and FOS maybe involved in the tumor-associated
stroma of PABC.
MYC is a regulator gene coding for a
transcription factor that is involved in cell cycle progression,
apoptosis and cellular transformation (27). It is activated by a variety of
mitogenic signals, including EGF, wingless and INT-1 via the
mitogen-activated protein kinases/extracellular signal-regulated
kinases pathway (28). Imbalanced
expression of MYC promotes cell transformation from G1 to S
phase, thereby leading to cell proliferation and the formation of
cancer (29). Notably,
malfunctions in MYC have been observed in several types of
cancer, including breast, uterine, gastric, pancreatic and
colorectal cancer (30).
MYC is thus considered to be a promising target for
anti-cancer drugs. Taken together, it was hypothesized that
MYC may act as a potential biomarker in tumor-associated
stroma of PABC.
Another hub gene, ACTA2, encodes a protein
which belongs to the highly conserved actin family. It is known to
contribute to cell-generated mechanical tension and be involved in
cell motility, structure and integrity (31). In the present study, ACTA2
was demonstrated to be enriched in the pathway of vascular smooth
muscle contraction. Lambrechts et al (32) revealed that ACTA2 is
primarily expressed in the smooth muscle cells and activated
cancer-associated fibroblasts. Tumor cells use actin bundles to
allow them to break away from a primary tumor and invade the
surrounding tissue (33).
ACTA2 has been demonstrated to be involved in lung
adenocarcinoma metastasis (31).
Therefore, the deregulation of ACTA2 in tumor stroma may
affect the progression of PABC.
Furthermore, previous studies have demonstrated that
the expression changes of genes associated with the immune response
contribute to tumor aggressiveness (34). The analysis data of Ma et al
(35) revealed that the
upregulated genes associated with the immune response are exhibited
in the stroma of high-grade PABC. In the present study, the immune
response was a significant BP term that was enriched by IL18
and CD274. IL18 is a tumor inhibiting factor,
dysregulation of which has been observed in the progression of
tumors. Studies have reported that IL18 effectively inhibits
the growth of hepatoma cells by inhibiting angiogenesis and
participating in apoptotic signal transduction (36). An analysis of tumor specimens with
renal cell carcinoma has revealed that high expression of
CD274 increases tumor aggressiveness and risk of death
(37). Thus, IL18 and
CD274 may affect the progression of PABC through the
pathways associated with immune response.
However, the present study has limitations. In the
process of data analysis, only a few samples were used. In
addition, no microarray experiments were performed, except for
bioinformatics analysis of two gene expression profile data from
the GEO database. Therefore, further experimental studies with
larger sample size are required to confirm the observations of the
present study.
In conclusion, there were significant differences in
gene expression between tumor-associated stromal cells and normal
stromal cells in PABC, confirmed by analyzing the gene expression
profiles with bioinformatics. The DEGs of JUN, FOS,
MYC, ACTA2, IL18 and CD274, and BP
terms associated with the immune response may be involved in the
development of tumor stroma in PABC.
Acknowledgements
The present study was supported by the Key Program
of Science and Technology Development Fund of Nanjing Medical
University (grant no. 2013NJMU146).
References
|
1
|
Sathian B, Nagaraja SB, Banerjee I,
Sreedharan J, De A, Roy B, Rajesh E, Senthilkumaran S, Hussain SA
and Menezes RG: Awareness of breast cancer warning signs and
screening methods among female residents of Pokhara valley, Nepal.
Asian Pac J Cancer Prev. 15:4723–4726. 2014. View Article : Google Scholar : PubMed/NCBI
|
|
2
|
Rovera F, Frattini F, Coglitore A, Marelli
M, Rausei S, Dionigi G, Boni L and Dionigi R: Breast cancer in
pregnancy. Breast J. 16:(Suppl 1). S22–S25. 2010. View Article : Google Scholar : PubMed/NCBI
|
|
3
|
Abenhaim HA, Azoulay L, Holcroft CA, Bure
LA, Assayag J and Benjamin A: Incidence, risk factors, and
obstetrical outcomes of women with breast cancer in pregnancy.
Breast J. 18:564–568. 2012. View Article : Google Scholar : PubMed/NCBI
|
|
4
|
Antoniou A, Pharoah P, Narod S, Risch HA,
Eyfjord JE, Hopper JL, Loman N, Olsson H, Johannsson O, Borg A, et
al: Average risks of breast and ovarian cancer associated with
BRCA1 or BRCA2 mutations detected in case series unselected for
family history: A combined analysis of 22 studies. Am J Hum Genet.
72:1117–1130. 2003. View
Article : Google Scholar : PubMed/NCBI
|
|
5
|
Cullinane CA, Lubinski J, Neuhausen SL,
Ghadirian P, Lynch HT, Isaacs C, Weber B, Moller P, Offit K,
Kim-Sing C, et al: Effect of pregnancy as a risk factor for breast
cancer in BRCA1/BRCA2 mutation carriers. Int J Cancer. 117:988–991.
2005. View Article : Google Scholar : PubMed/NCBI
|
|
6
|
Kotsopoulos J, Lubinski J, Lynch HT, Klijn
J, Ghadirian P, Neuhausen SL, Kim-Sing C, Foulkes WD, Moller P,
Isaacs C, et al: Age at first birth and the risk of breast cancer
in BRCA1 and BRCA2 mutation carriers. Breast Cancer Res Treat.
105:221–228. 2007. View Article : Google Scholar : PubMed/NCBI
|
|
7
|
Gao L, Ding H, Li L and Hu H: A
clinicopathological study of pregnancy-associated breast cancer and
breast cancer with pregnancy-like change. Chin J Clin Exper Pathol.
20:29–34. 2003.(In Chinese).
|
|
8
|
Douglas MR, Morrison KE, Salmon M and
Buckley CD: Why does inflammation persist: A dominant role for the
stromal microenvironment? Expert Rev Mol Med. 4:1–18. 2002.
View Article : Google Scholar : PubMed/NCBI
|
|
9
|
Harvell DM, Kim J, O'Brien J, Tan AC,
Borges VF, Schedin P, Jacobsen BM and Horwitz KB: Genomic
signatures of pregnancy-associated breast cancer epithelia and
stroma and their regulation by estrogens and progesterone. Horm
Cancer. 4:140–153. 2013. View Article : Google Scholar : PubMed/NCBI
|
|
10
|
Wiseman BS and Werb Z: Stromal effects on
mammary gland development and breast cancer. Science.
296:1046–1049. 2002. View Article : Google Scholar : PubMed/NCBI
|
|
11
|
Edgar R, Domrachev M and Lash AE: Gene
expression omnibus: NCBI gene expression and hybridization array
data repository. Nucleic Acids Res. 30:207–210. 2002. View Article : Google Scholar : PubMed/NCBI
|
|
12
|
Irizarry RA, Hobbs B, Collin F,
Beazer-Barclay YD, Antonellis KJ, Scherf U and Speed TP:
Exploration, normalization, and summaries of high density
oligonucleotide array probe level data. Biostatistics. 4:249–264.
2003. View Article : Google Scholar : PubMed/NCBI
|
|
13
|
Gautier L, Cope L, Bolstad BM and Irizarry
RA: Affy-analysis of Affymetrix GeneChip data at the probe level.
Bioinformatics. 20:307–315. 2004. View Article : Google Scholar : PubMed/NCBI
|
|
14
|
Ritchie ME, Phipson B, Wu D, Hu Y, Law CW,
Shi W and Smyth GK: limma powers differential expression analyses
for RNA-sequencing and microarray studies. Nucleic Acids Res.
43:e472015. View Article : Google Scholar : PubMed/NCBI
|
|
15
|
Ashburner M, Ball CA, Blake JA, Botstein
D, Butler H, Cherry JM, Davis AP, Dolinski K, Dwight SS, Eppig JT,
et al: Gene ontology: Tool for the unification of biology. The Gene
ontology consortium. Nat Genet. 25:25–29. 2000. View Article : Google Scholar : PubMed/NCBI
|
|
16
|
Kanehisa M and Goto S: KEGG: Kyoto
encyclopedia of genes and genomes. Nucleic Acids Res. 28:27–30.
2000. View Article : Google Scholar : PubMed/NCBI
|
|
17
|
Huang DW, Sherman BT, Tan Q, Collins JR,
Alvord WG, Roayaei J, Stephens R, Baseler MW, Lane HC and Lempicki
RA: The DAVID gene functional classification tool: A novel
biological module-centric algorithm to functionally analyze large
gene lists. Genome Biol. 8:R1832007. View Article : Google Scholar : PubMed/NCBI
|
|
18
|
Von Mering C, Huynen M, Jaeggi D, Schmidt
S, Bork P and Snel B: STRING: A database of predicted functional
associations between proteins. Nucleic Acids Res. 31:258–261. 2003.
View Article : Google Scholar : PubMed/NCBI
|
|
19
|
Jensen LJ, Kuhn M, Stark M, Chaffron S,
Creevey C, Muller J, Doerks T, Julien P, Roth A, Simonovic M, et
al: STRING 8-a global view on proteins and their functional
interactions in 630 organisms. Nucleic Acids Res. 37:(Database
issue). D412–D416. 2009. View Article : Google Scholar : PubMed/NCBI
|
|
20
|
He X and Zhang J: Why do hubs tend to be
essential in protein networks? PLoS Genet. 2:e882006. View Article : Google Scholar : PubMed/NCBI
|
|
21
|
Andersson TM, Johansson AL, Hsieh CC,
Cnattingius S and Lambe M: Increasing incidence of
pregnancy-associated breast cancer in Sweden. Obstet Gynecol.
114:568–572. 2009. View Article : Google Scholar : PubMed/NCBI
|
|
22
|
Vogt PK: Fortuitous convergences: The
beginnings of JUN. Nat Rev Cancer. 2:465–469. 2002. View Article : Google Scholar : PubMed/NCBI
|
|
23
|
Behrens A, Sibilia M and Wagner EF:
Amino-terminal phosphorylation of c-Jun regulates stress-induced
apoptosis and cellular proliferation. Nat Genet. 21:326–329. 1999.
View Article : Google Scholar : PubMed/NCBI
|
|
24
|
Rauscher FD III, Voulalas P, Franza B Jr
and Curran T: Fos and Jun bind cooperatively to the AP-1 site:
Reconstitution in vitro. Genes Dev. 2:1687–1699. 1988. View Article : Google Scholar : PubMed/NCBI
|
|
25
|
Rao ChV, Li X, Manna SK, Lei ZM and
Aggarwal BB: Human chorionic gonadotropin decreases proliferation
and invasion of breast cancer MCF-7 cells by inhibiting NF-kappaB
and AP-1 activation. J Biol Chem. 279:25503–25510. 2004. View Article : Google Scholar : PubMed/NCBI
|
|
26
|
Zhang Y, Pu X, Shi M, Chen L, Song Y, Qian
L, Yuan G, Zhang H, Yu M, Hu M, et al: Critical role of c-Jun
overexpression in liver metastasis of human breast cancer xenograft
model. BMC Cancer. 7:1452007. View Article : Google Scholar : PubMed/NCBI
|
|
27
|
Facchini LM and Penn LZ: The molecular
role of Myc in growth and transformation: Recent discoveries lead
to new insights. FASEB J. 12:633–651. 1998.PubMed/NCBI
|
|
28
|
Hayashi J, Aoki H, Kajino K, Moriyama M,
Arakawa Y and Hino O: Hepatitis C virus core protein activates the
MAPK/ERK cascade synergistically with tumor promoter TPA, but not
with epidermal growth factor or transforming growth factor alpha.
Hepatology. 32:958–961. 2000. View Article : Google Scholar : PubMed/NCBI
|
|
29
|
Santoni-Rugiu E, Falck J, Mailand N,
Bartek J and Lukas J: Involvement of Myc activity in a
G1/S-promoting mechanism parallel to the pRb/E2F pathway. Mol Cell
Biol. 20:3497–3509. 2000. View Article : Google Scholar : PubMed/NCBI
|
|
30
|
Chen Y, McGee J, Chen X, Doman TN, Gong X,
Zhang Y, Hamm N, Ma X, Higgs RE, Bhagwat SV, et al: Identification
of druggable cancer driver genes amplified across TCGA datasets.
PloS One. 9:e982932014. View Article : Google Scholar : PubMed/NCBI
|
|
31
|
Lee HW, Park YM, Lee SJ, Cho HJ, Kim DH,
Lee JI, Kang MS, Seol HJ, Shim YM, Nam DH, et al: Alpha-smooth
muscle actin (ACTA2) is required for metastatic potential of human
lung adenocarcinoma. Clin Cancer Res. 19:5879–5889. 2013.
View Article : Google Scholar : PubMed/NCBI
|
|
32
|
Lambrechts A, Van Troys M and Ampe C: The
actin cytoskeleton in normal and pathological cell motility. Int J
Biochem Cell Biol. 36:1890–1909. 2004. View Article : Google Scholar : PubMed/NCBI
|
|
33
|
Fritz G and Kaina B: Rho GTPases:
Promising cellular targets for novel anticancer drugs. Curr Cancer
Drug Targets. 6:1–14. 2006. View Article : Google Scholar : PubMed/NCBI
|
|
34
|
Asztalos S, Gann PH, Hayes MK, Nonn L,
Beam CA, Dai Y, Wiley EL and Tonetti DA: Gene expression patterns
in the human breast after pregnancy. Cancer Prev Res (Phila).
3:301–311. 2010. View Article : Google Scholar : PubMed/NCBI
|
|
35
|
Ma XJ, Dahiya S, Richardson E, Erlander M
and Sgroi DC: Gene expression profiling of the tumor
microenvironment during breast cancer progression. Breast Cancer
Res. 11:R72009. View Article : Google Scholar : PubMed/NCBI
|
|
36
|
Wenfeng Y: Interleukin-18
anti-hepatocellular carcinoma in nude mice transplanted mechanism.
Soochow University. 2009.(In Chinese).
|
|
37
|
Thompson RH, Gillett MD, Cheville JC,
Lohse CM, Dong H, Webster WS, Krejci KG, Lobo JR, Sengupta S, Chen
L, et al: Costimulatory B7-H1 in renal cell carcinoma patients:
Indicator of tumor aggressiveness and potential therapeutic target.
Proc Natl Acad Sci USA. 101:17174–17179. 2004. View Article : Google Scholar : PubMed/NCBI
|