Introduction
Ovarian cancer is a malignancy with one of the
poorest prognoses, which was reported to rank as the fifth leading
cause of cancer in women, with ~140,200 deaths annually worldwide
(1). Epithelial ovarian cancer
(EOC) is one of the most frequently observed types of gynecological
cancer, accounting for 85–90% of cases of ovarian cancer (2). EOC is commonly diagnosed at an
advanced stage, resulting in a poor 5-year overall survival rate of
25–30% (3). The main reasons for
the poor prognosis lie in the difficult to identify clinical
features, early lymph metastasis and common recurrence. In
addition, EOC presents with a variety of clinical manifestations,
genetic mutations and tumor morphologies, which add further
difficulty to the diagnosis and treatment (4).
Carboplatin [diammine (1,1-cyclobutanedicarboxylato)
platinum (II)] is one of the most promising second generation
platinum compounds. In clinical trials, carboplatin has been
demonstrated to be as active, however exhibits less nephrotoxicity
and neurotoxicity than cisplatin in previously untreated patients
with advanced ovarian cancer (5).
Despite the initially high response rate to carboplatin, the
relapse rate in ovarian cancer is high and numerous patients will
experience recurrence within 6 months, which leads to no
improvement in the long-term survival rate (6). Platinum resistance, which
predominantly includes carboplatin resistance and cisplatin
resistance, is considered as the main reason for the unsatisfactory
curative effect, and has led to widespread concerns in EOC
(7,8). Peters et al (9) identified that carboplatin-resistant
vs. -sensitive ovarian cancer cells differentially expressed genes
(DEGs) were associated with apoptosis, cell-cell communication,
cell adhesion, DNA repair and cell proliferation. However, fewer
biomarkers were identified of carboplatin resistance and the
specific mechanism remains unclear. Therefore, further potential
key genes associated with effects of carboplatin on EOS are
urgently required in order to confirm, and further explore the
mechanisms of carboplatin resistance. In the present study,
carboplatin-induced sequential gene expression changes in EOS were
identified and analyzed via microarray analysis, in order to screen
out certain biomarkers or pathways of EOS that may be involved in
the mechanism of carboplatin resistance.
Materials and methods
Microarray data
The expression profile of GSE13525 (10) was downloaded from the Gene
Expression Omnibus (GEO) database (www.ncbi.nlm.nih.gov/geo). There were 12 EOC cell
samples in this profile, including 6 samples treated with
carboplatin at 24, 30 and 36 h, with 2 samples at every time point
(case group), and 6 samples treated with phosphate-buffered saline
at the same time points (control group). Here, EOC cell samples
were 36M2 cell lines, which were sensitive to carboplatin.
Detection of this profile was performed based on the platform of
GPL570 [HG-U133_Plus_2] Affymetrix Human Genome U133 Plus 2.0 Array
(Affymetrix, Inc., Santa Clara, CA, USA).
Data pre-processing
For the expression profile, the original data were
converted into a recognizable format with the affy package
(11). The method of Robust
Multi-array Average (12) was used
for normalization and logarithmic conversion. If multi-probes
corresponded to a gene symbol, the average value was regarded as
the gene expression value.
Identification and comparison of
DEGs
Subsequent to the data pre-processing, DEGs were
selected out using Limma (13)
package according to the criteria: P<0.05, |log2
(fold-change)|>0.05. In the current study, 3 sets of DEGs were
obtained, including DEGs in EOC cell samples treated with
carboplatin compared with the control group at 24, 30 and 36 h,
respectively, which were separately recorded as DEG-24, DEG-30 and
DEG-36. The 3-set DEGs were compared and the overlapped DEGs were
screened out. In addition, the cluster analysis of the overlapped
genes was conducted.
Functional and pathway enrichment
analysis
Gene Ontology (GO) and Kyoto Encyclopedia of Genes
and Genomes (KEGG) pathway enrichment analysis of the overlapped
DEGs were performed via the Database for Annotation, Visualization
and Integrated Discovery (http://david.abcc.ncifcrf.gov/) (14). The GO terms and the KEGG pathways
were screened out with the criteria P<0.05.
Construction of the protein-protein
interaction network and the survival curve
The interactions among the overlapped genes were
explored with the Search Tool for the Retrieval of Interacting
Genes/Proteins database (string-db.org)
(15). Subsequently, the
protein-protein interaction (PPI) network was constructed by
Cytoscape software (16). Certain
critical nodes with higher degrees were analyzed, and the ‘degree’
represented the connections with other nodes. In addition, the
interactions between the expression values of the critical nodes
and the survival period were evaluated with the KMplot software
version 4.7.2 (ChinaUnix; www.chinaunix.net), and the survival curves were
plotted. In addition, correlation analysis between some important
nodes and the outcome of EOC was performed.
Results
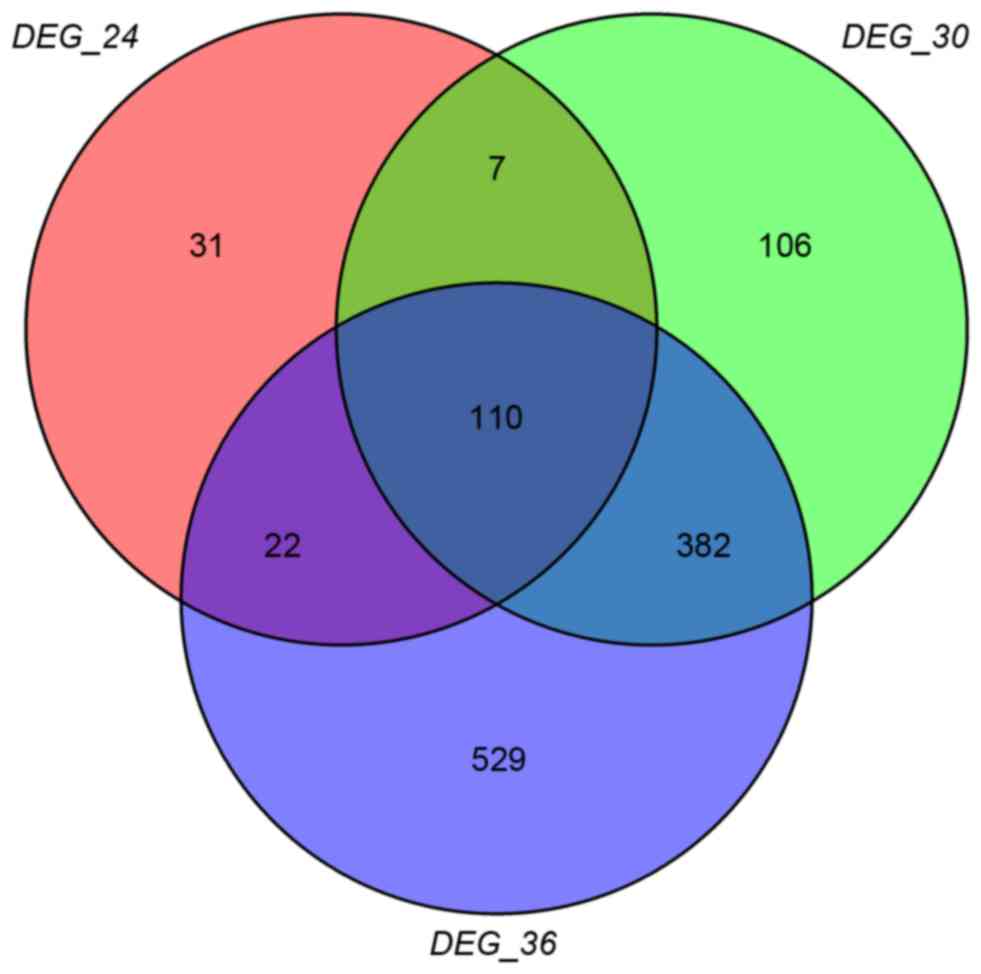
DEGs and overlaps
A total of 170,605 and 1,043 DEGs were obtained in
DEG-24 DEG-30 and DEG-36, and the Venn diagram is presented in
Fig. 1. It was clearly identified
that there were 110 overlaps in the 3-set DEGs, and 40 out of the
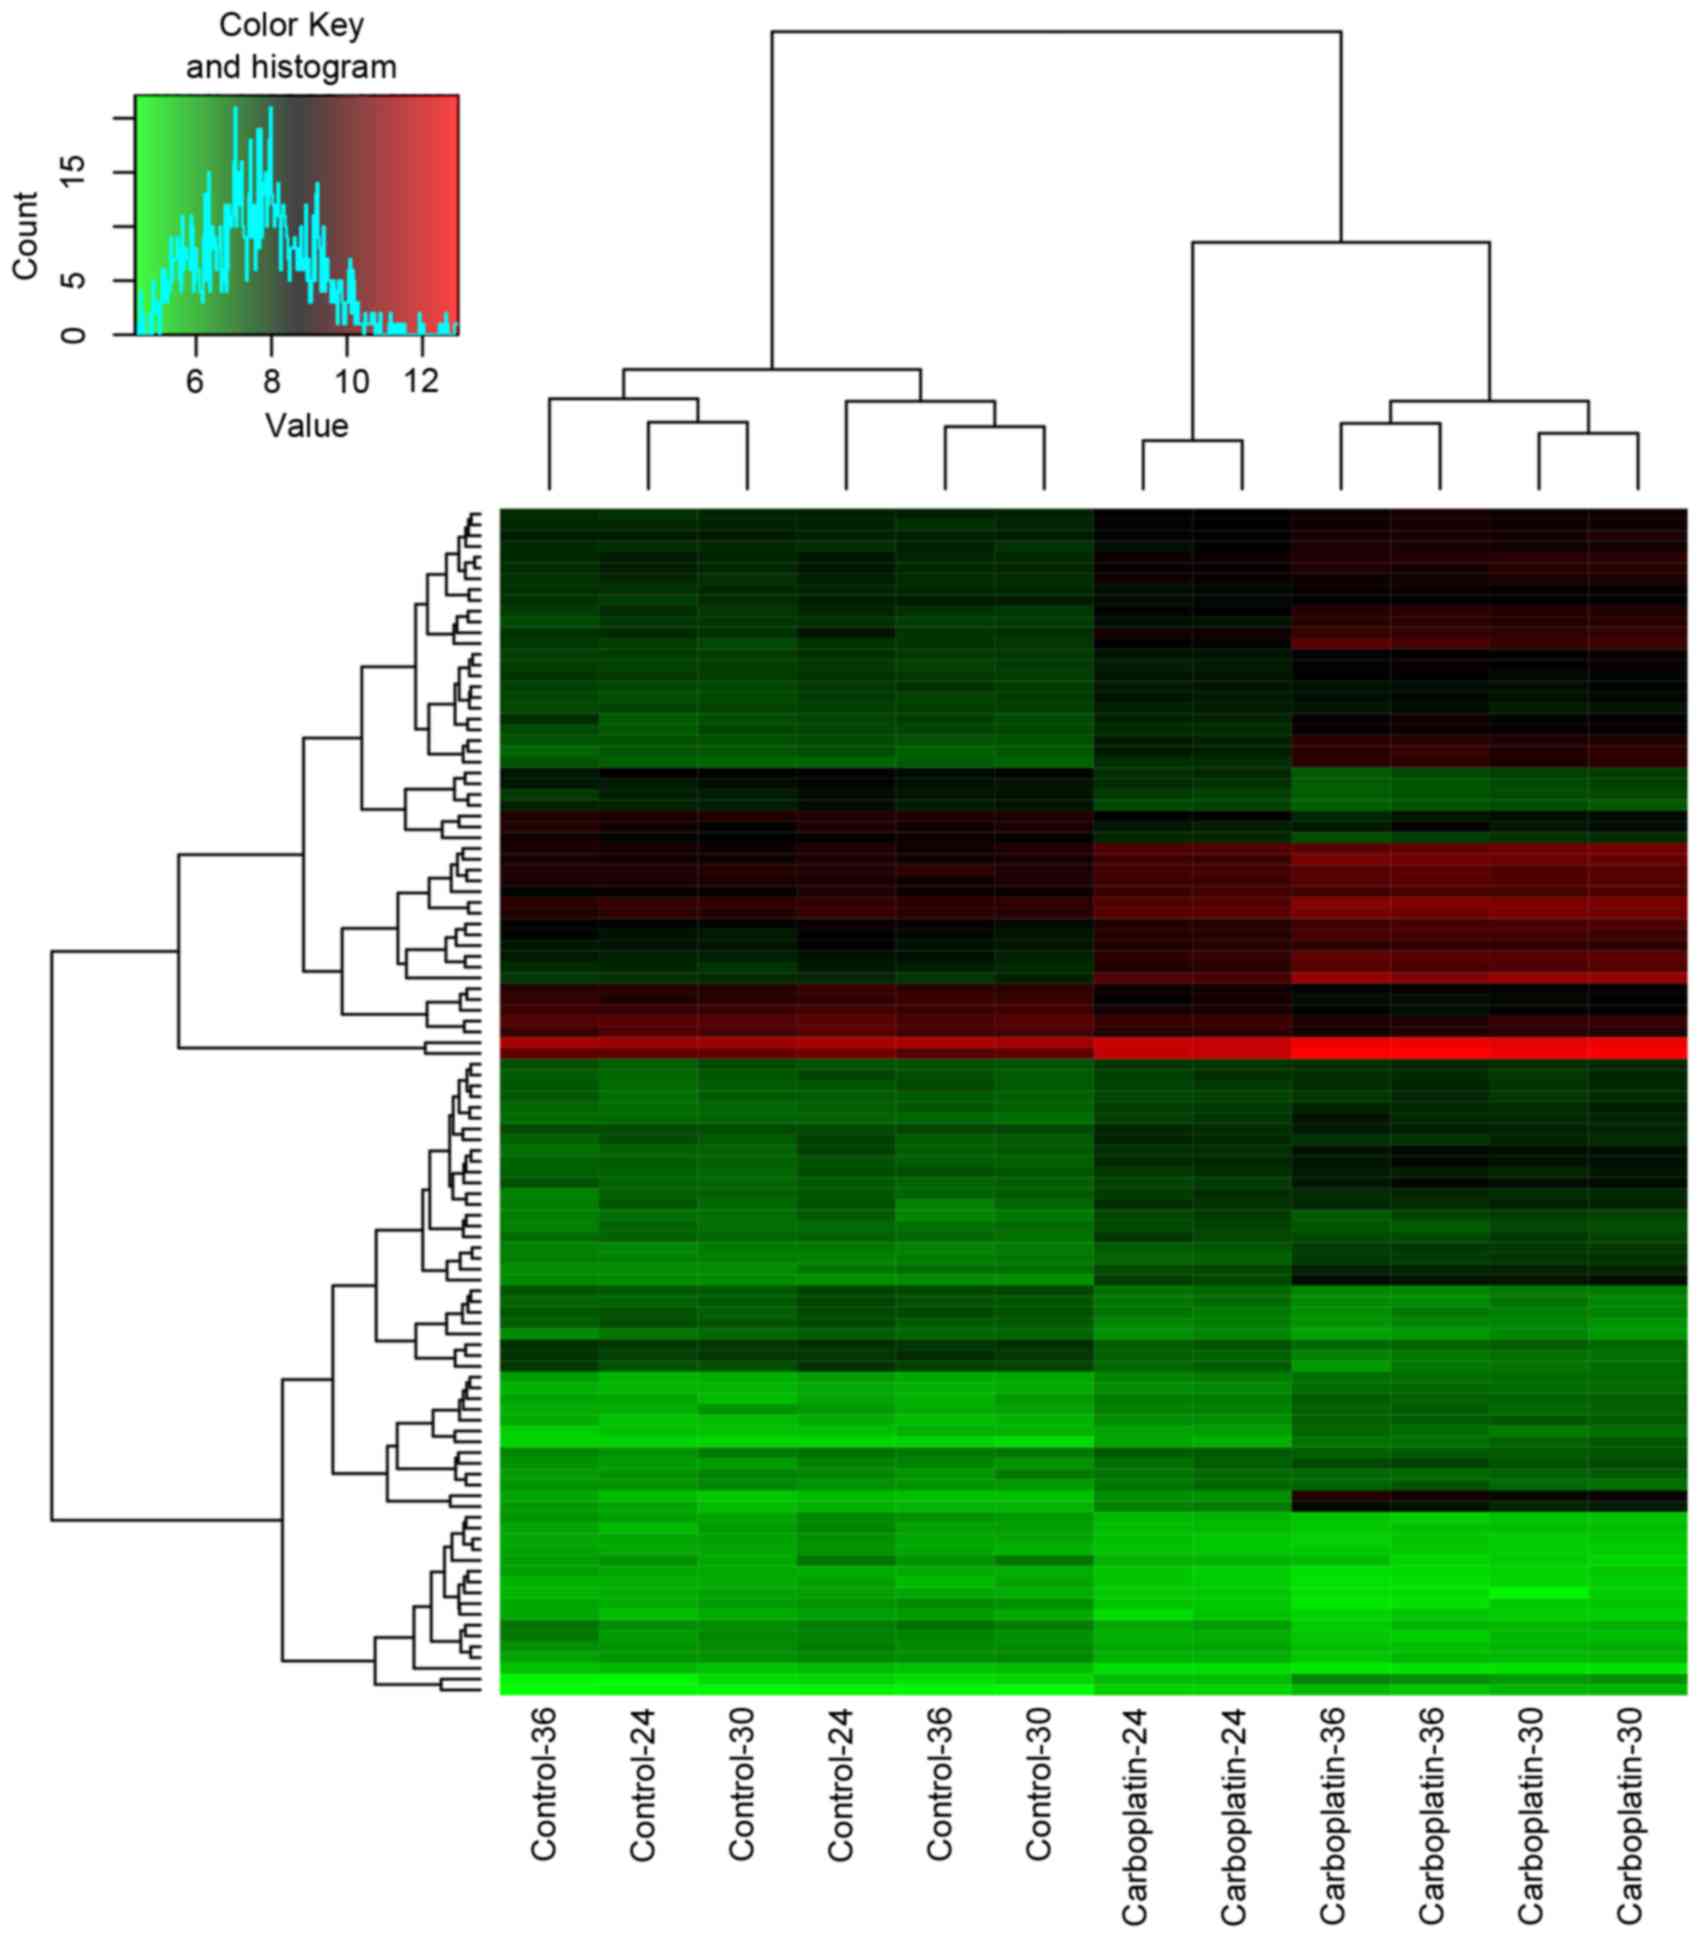
110 overlaps (arbitrarily selected) were presented in Table I. In addition, the heatmap of the
overlaps was presented in Fig.
2.
 | Table I.40 out of the 110 overlapping
DEGs. |
Table I.
40 out of the 110 overlapping
DEGs.
| Gene | logFC-24 | logFC-30 | logFC-36 |
|---|
| c-Jun | 0.597575 | 1.328237 | 1.18567 |
| ATF3 | 1.23664 | 2.04034 | 2.048266 |
| MYC | 0.897095 | 1.506238 | 1.185579 |
| SMYD3 | −0.79469 | −0.98629 | −0.9974 |
| SUGCT | −0.7813 | −1.11645 | −0.83396 |
| CCNB1 | −0.7313 | −0.56078 | −0.51498 |
| H3F3A | −0.68925 | −0.68752 | −0.86869 |
| ZFHX4-AS1 | −0.68093 | −0.60716 | −0.61631 |
| SLIT2 | −0.67813 | −0.85581 | −0.76238 |
| TENM2 | −0.65069 | −0.82711 | −1.25469 |
| EID2B | −0.64698 | −0.52262 | −0.61981 |
| GPC6 | −0.6393 | −0.95796 | −1.33614 |
| TYRP1 | −0.63771 | −0.85061 | −1.41218 |
| COX7B2 | −0.60476 | −0.96575 | −1.20234 |
| CCDC102B | −0.59926 | −0.99286 | −0.83222 |
| SLC39A11 | −0.58811 | −0.80546 | −0.8992 |
| FAM155A | −0.57958 | −0.5765 | −0.61568 |
| DIAPH2 | −0.57649 | −0.60056 | −0.74229 |
| ARL15 | −0.57305 | −0.57539 | −0.95364 |
| ZNF804A | −0.57214 | −0.73618 | −1.06175 |
| RBMS3 | −0.56804 | −0.72509 | −0.66383 |
| COLEC12 | −0.5643 | −0.56611 | −0.92667 |
| FAM172A | −0.54727 | −0.73332 | −0.70188 |
| FRMPD4 | −0.54134 | −0.65706 | −0.60094 |
| MROH2A | −0.53617 | −0.53163 | −0.79999 |
| CSN3 | −0.53327 | −0.55616 | −0.52556 |
| TMEM117 | −0.52405 | −0.78864 | −1.25632 |
| NRXN3 | −0.5218 | −0.62797 | −0.83785 |
| ALG14 | −0.51912 | −0.69366 | −0.92383 |
| LINC01279 | −0.51733 | −0.85673 | −1.16606 |
| SPA17 | −0.50974 | −0.62461 | −0.80034 |
| RNASE4 | −0.50843 | −0.63322 | −1.26577 |
| ROBO1 | −0.50546 | −0.82298 | −1.17568 |
| DLGAP5 | −0.50254 | −0.62455 | −0.62672 |
| CDH13 | −0.50095 | −0.80013 | −1.29452 |
| SLC25A25 | 0.501864 | 0.517077 | 0.791164 |
| RELB | 0.504759 | 1.161993 | 1.440501 |
| E2F8 | 0.508001 | 0.684447 | 0.689356 |
| FAM53C | 0.509583 | 0.939359 | 0.974481 |
| NFKBIE | 0.525352 | 1.418745 | 1.240866 |
GO terms and KEGG pathways
The overlaps were enriched in 77 GO terms and 3 KEGG
pathways [p53 signaling pathway, cell cycle and mitogen-activated
protein kinase (MAPK) signaling pathway], and the top 10 most
significant GO terms were exhibited in Table II.
| Table II.The top 10 most significant GO terms
of the overlapping differentially expressed genes. |
Table II.
The top 10 most significant GO terms
of the overlapping differentially expressed genes.
| Category | Term | Count | P-value |
|---|
| GOTERM_CC_5 |
GO:0005634~nucleus | 45 | 4.27E-05 |
| GOTERM_BP_5 | GO:0051173~positive
regulation of nitrogen compound metabolic process | 14 | 1.24E-04 |
| GOTERM_BP_5 |
GO:0048660~regulation of smooth muscle
cell proliferation | 5 | 1.72E-04 |
| GOTERM_BP_5 | GO:0031328~positive
regulation of cellular biosynthetic process | 14 | 2.29E-04 |
| GOTERM_BP_5 | GO:0009891~positive
regulation of biosynthetic process | 14 | 2.64E-04 |
| GOTERM_BP_5 | GO:0043065~positive
regulation of apoptosis | 11 | 2.68E-04 |
| GOTERM_BP_5 | GO:0043068~positive
regulation of programmed cell death | 11 | 2.83E-04 |
| GOTERM_BP_5 | GO:0010942~positive
regulation of cell death | 11 | 2.94E-04 |
| GOTERM_CC_5 |
GO:0043231~intracellular membrane-bounded
organelle | 58 | 3.03E-04 |
| GOTERM_BP_5 |
GO:0006355~regulation of transcription,
DNA-dependent | 23 | 6.52E-04 |
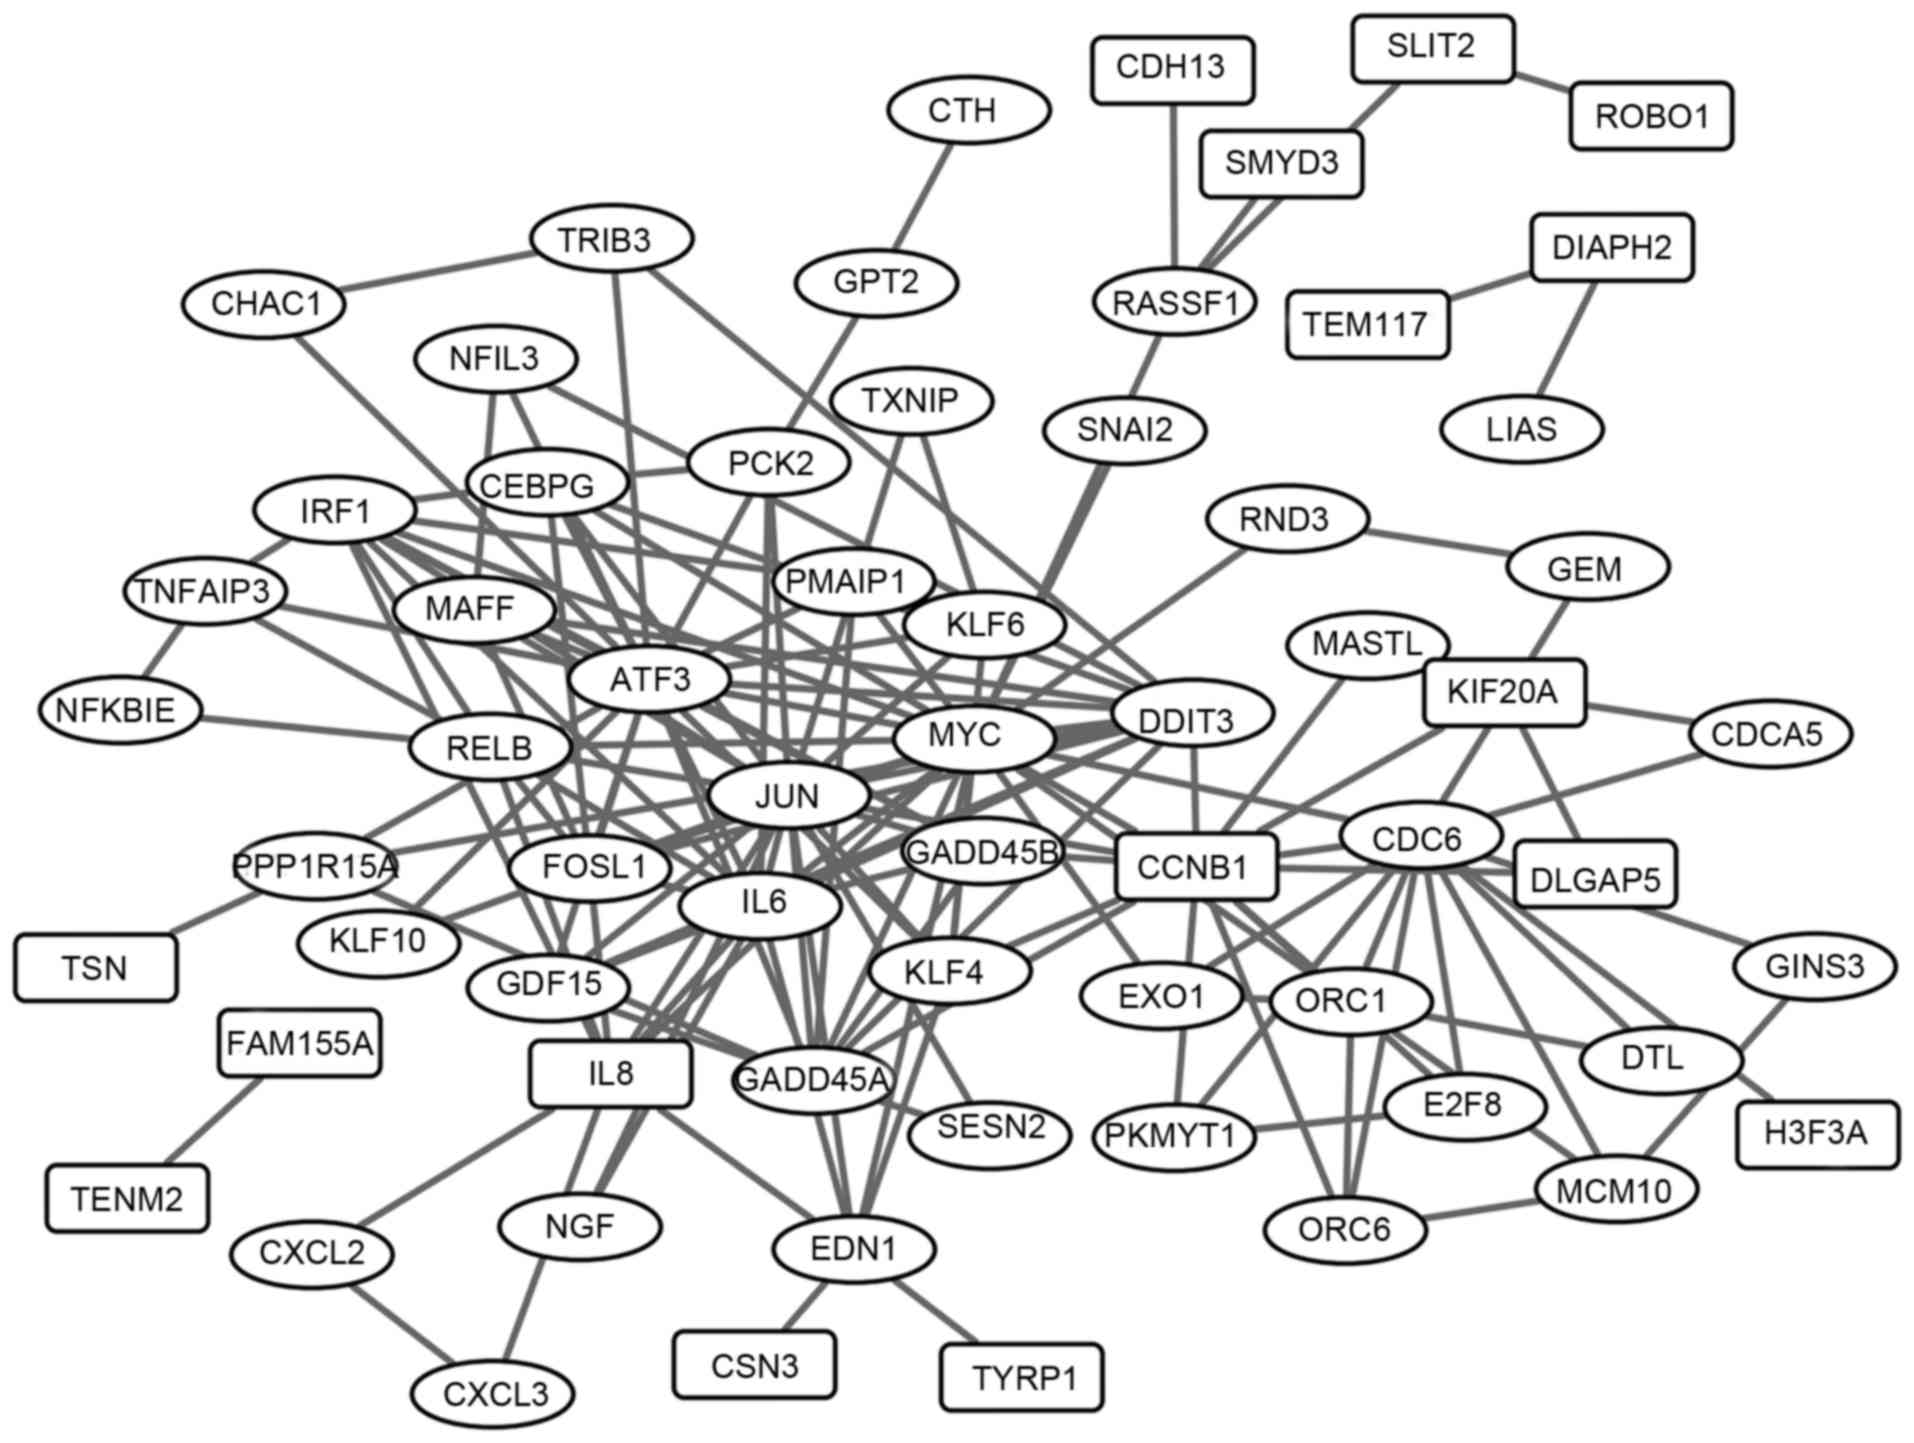
The PPI network and survival
curves
The PPI network of the overlaps was established and
exhibited in Fig. 3, including 152
interaction pairs. The top 30 nodes with high degrees were
presented in Table III (e.g.
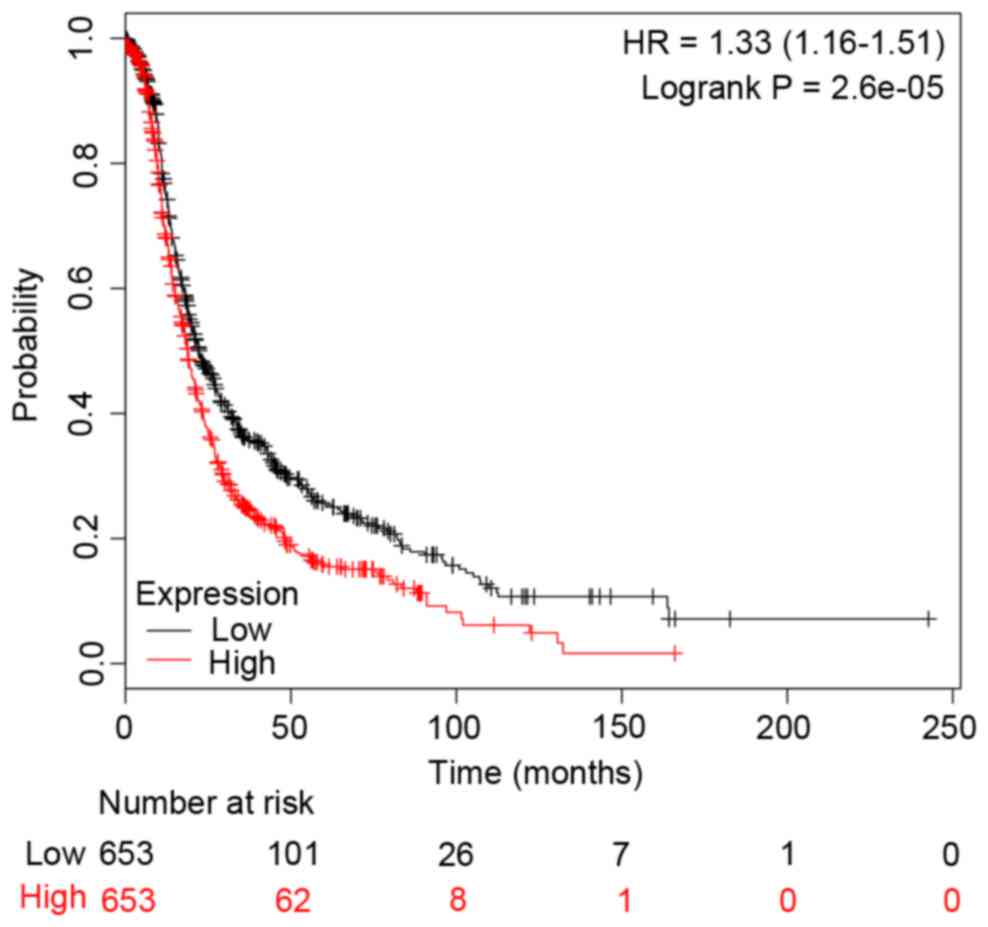
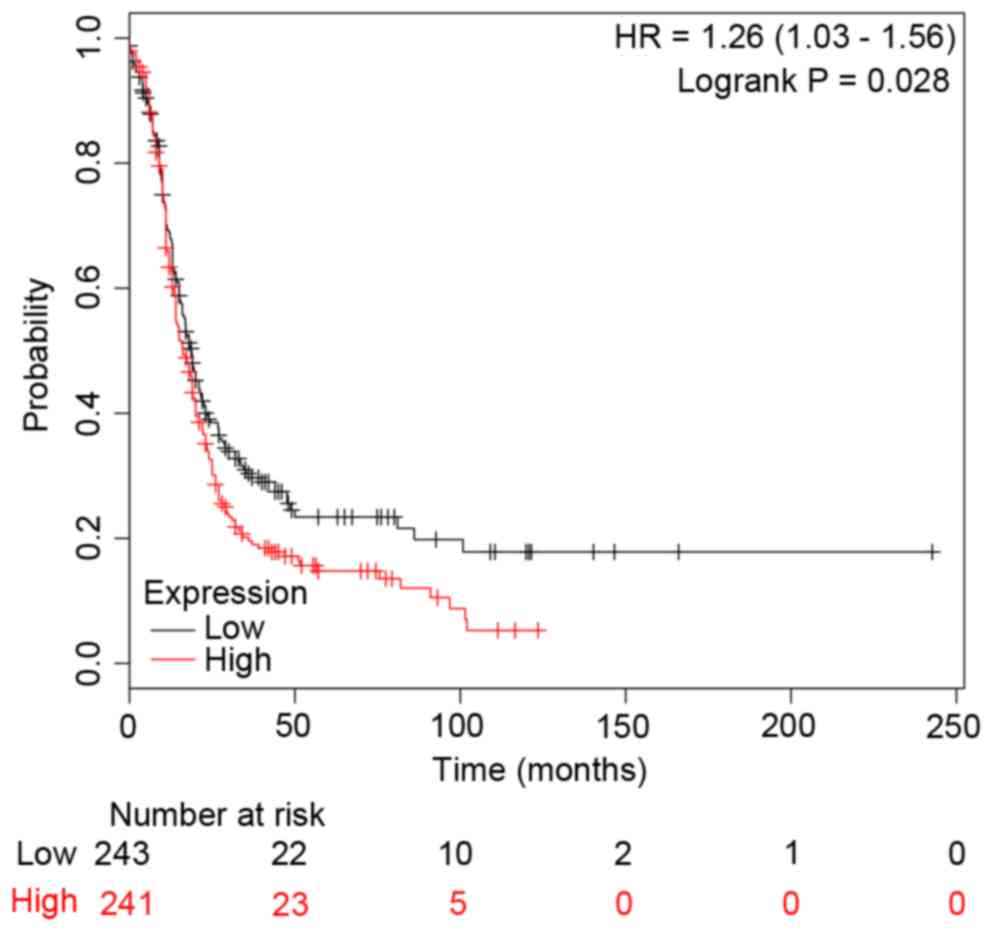
c-Jun and CCNB1). In addition, the survival curves
were drawn to demonstrate the associations between the gene
expression levels and the prognosis of EOC for c-Jun and
CCNB1, respectively. The two survival curves were presented
in Figs. 4 and 5. It was clear that the high or low
expression probability of c-Jun and CCNB1 was
negatively associated with the survival time of patients, that is,
the abnormal expression probability of c-Jun and
CCNB1 was positively correlated with a poor outcome of
EOC.
| Table III.The top 30 nodes with higher degrees
in the PPI network. |
Table III.
The top 30 nodes with higher degrees
in the PPI network.
| Gene | Degree |
|---|
| c-Jun | 22 |
| ATF3 | 21 |
| MYC | 20 |
| CCNB1 | 14 |
| CDC6 | 13 |
| DDIT3 | 13 |
| IL6 | 13 |
| GADD45A | 10 |
| IRF1 | 10 |
| FOSL1 | 9 |
| IL8 | 9 |
| RELB | 8 |
| CEBPG | 7 |
| EDN1 | 7 |
| ORC1 | 7 |
| GADD45B | 6 |
| KLF4 | 6 |
| GDF15 | 5 |
| MAFF | 5 |
| PCK2 | 5 |
| KLF6 | 4 |
| MCM10 | 4 |
| ORC6 | 4 |
| PMAIP1 | 4 |
| PPP1R15A | 4 |
| RASSF1 | 4 |
| TNFAIP3 | 4 |
| E2F8 | 3 |
| EXO1 | 3 |
| KIF20A | 3 |
Discussion
Platinum drugs, such as cisplatin and carboplatin,
have been most frequently used for treatment of ovarian cancer.
However, platinum resistance has severely limited its efficacy,
which is a major clinical problem requiring a solution. In the
present study, the carboplatin-induced sequential genes expression
changes of EOC were analyzed, and 3 KEGG pathways of overlaps were
obtained, including the p53 signaling pathway, cell cycle and MAPK
signaling pathway. Certain studies have indicated that these
pathways were involved in the platinum resistance of ovarian
cancer. One study reported that chaetoglobosin K induced
G2 cell cycle arrest through a p53-dependent pathway in
cisplatin-resistant ovarian cancer cells (17). An additional study drew a similar
conclusion that theaflavin-3, 3′-digallate induced G2
cell cycle arrest through the protein kinase B/MDM2/p53 pathway in
cisplatin-resistant ovarian cancer cells (18). Meng et al (19) hypothesized that ovarian cancer
cells expressing aldehyde dehydrogenase 1 family member A1
may maintain platinum resistance by altered regulation of cell
cycle checkpoints and DNA repair network signaling. MAPKs regulate
diverse cellular programs including embryogenesis, proliferation,
differentiation and apoptosis based on cues derived from the cell
surface and the metabolic state and environment of the cell
(20). They are activated by dual
phosphorylation of threonine and tyrosine in response to a wide
array of extracellular stimuli (21). Results of a previous study
indicated that cisplatin activated p38 MAPK in all of the cell
lines tested, and carboplatin could induce activation of p38 MAPK
(22,23). The p38 MAPK pathway was considered
as a specific target for cisplatin-based therapy with clinical
implications. In addition, MEK inhibition could overcome cisplatin
resistance conferred the son of sevenless/MAPK pathway activation
in squamous cell carcinoma (24).
In the present study, the overlapped DEGs were enriched in p53
signaling pathway, cell cycle and the MAPK signaling pathway.
Therefore, it was suspected that these three pathways may be
involved in the carboplatin resistance of EOC, although further
research and clinical verifications were necessary to confirm
it.
The PPI network of the overlaps was analyzed, and
c-Jun and CCNB1 were the top 4 nodes with the highest
degrees (Table III). In human
ovarian cancer, the overexpression of fucosyltransferase 1
(FUT1) was associated with advanced pathological stages and
involved in cell proliferation, migration and invasion (25–27).
Gao et al (28) reported
that c-Jun could transcriptionally modulate FUT1
expression in ovarian cancer, implicating the potential application
of c-Jun inhibitors for human ovarian cancer therapy.
Echevarría-Vargas et al (29) reported that the c-Jun N-terminal
kinase 1/c-Jun/microRNA-21 pathway contributed to the cisplatin
resistance of ovarian cancer cells, and the activation of
c-Jun was closely associated with the prognosis. In
addition, the present study identified that abnormal expression of
c-Jun was positively correlated with a poor outcome of EOC
(Fig. 4). Therefore, c-Jun
may be a potential target for the prognosis of EOC. Similarly,
CCNB1 encoded G2/mitotic-specific cyclin-B1, a
member of the highly conserved cyclin family, whose members were
characterized by a marked periodicity in protein abundance through
the cell cycle. As abovementioned, cell cycle may contribute to the
carboplatin-resistance of EOC. A previous study suggested that
sulforaphane induced cell cycle arrest in the G2/M phase
via the blockade of CCNB1/cyclin-dependent kinase 1 in human
ovarian cancer cells (30). An
additional study observed nuclear CCNB1 was overexpressed in
ovarian tumors and associated with a low potential for malignance,
however, this was not the case in EOC. Thus, it is suggested that
CCNB1 may not be suitable targets for EOC treatment
(31). The present study indicated
that CCNB1 was differentially expressed in
carboplatin-resistant EOC cells, and the differential expression of
CCNB1 was closely associated with the low survival rate
(Fig. 5). Therefore, CCNB1
may be a potential marker for the prognosis of EOC, although
further investigation into whether different expression levels or
different treatments would affect CCNB1 expression levels in
EOC are required.
In conclusion, the results of the current study
suggested that c-Jun and CCNB1 may be prognostic
biomarkers of EOC, and certain pathways (including p53 signaling
pathway, cell cycle and MAPK signaling pathway) may contribute to
carboplatin resistance of EOC.
References
|
1
|
Siegel R, Naishadham D and Jemal A: Cancer
statistics, 2013. CA Cancer J Clin. 63:11–30. 2013. View Article : Google Scholar : PubMed/NCBI
|
|
2
|
Chudecka-Glaz AM: ROMA, an algorithm for
ovarian cancer. Clin Chim Acta. 440:143–151. 2015. View Article : Google Scholar : PubMed/NCBI
|
|
3
|
Bai Y, Li LD, Li J and Lu X: Targeting of
topoisomerases for prognosis and drug resistance in ovarian cancer.
J Ovarian Res. 9:352016. View Article : Google Scholar : PubMed/NCBI
|
|
4
|
Karst AM and Drapkin R: Ovarian cancer
pathogenesis: A model in evolution. J Oncol. 2010:9323712010.
View Article : Google Scholar : PubMed/NCBI
|
|
5
|
Ozols RF: Role of carboplatin in ovarian
cancer. Current results and thoughts for the future. Acta Obstet
Gynecol Scand Suppl. 155:75–77. 1992. View Article : Google Scholar : PubMed/NCBI
|
|
6
|
Pinato DJ, Graham J, Gabra H and Sharma R:
Evolving concepts in the management of drug resistant ovarian
cancer: Dose dense chemotherapy and the reversal of clinical
platinum resistance. Cancer Treat Rev. 39:153–160. 2013. View Article : Google Scholar : PubMed/NCBI
|
|
7
|
Pénzváltó Z, Lánczky A, Lénárt J,
Meggyesházi N, Krenács T, Szoboszlai N, Denkert C, Pete I and
Győrffy B: MEK1 is associated with carboplatin resistance and is a
prognostic biomarker in epithelial ovarian cancer. BMC Cancer.
14:8372014. View Article : Google Scholar : PubMed/NCBI
|
|
8
|
Barghout SH, Zepeda N, Vincent K, Azad AK,
Xu Z, Yang C, Steed H, Postovit LM and Fu Y: RUNX3 contributes to
carboplatin resistance in epithelial ovarian cancer cells. Gynecol
Oncol. 138:647–655. 2015. View Article : Google Scholar : PubMed/NCBI
|
|
9
|
Peters D, Freund J and Ochs RL:
Genome-wide transcriptional analysis of carboplatin response in
chemosensitive and chemoresistant ovarian cancer cells. Mol Cancer
Ther. 4:1605–1616. 2005. View Article : Google Scholar : PubMed/NCBI
|
|
10
|
Konstantinopoulos PA, Fountzilas E, Pillay
K, Zerbini LF, Libermann TA, Cannistra SA and Spentzos D:
Carboplatin-induced gene expression changes in vitro are prognostic
of survival in epithelial ovarian cancer. BMC Med Genomics.
1:592008. View Article : Google Scholar : PubMed/NCBI
|
|
11
|
Gautier L, Cope L, Bolstad BM and Irizarry
RA: Affy-analysis of Affymetrix GeneChip data at the probe level.
Bioinformatics. 20:307–315. 2004. View Article : Google Scholar : PubMed/NCBI
|
|
12
|
Irizarry RA, Hobbs B, Collin F,
Beazer-Barclay YD, Antonellis KJ, Scherf U and Speed TP:
Exploration, normalization, and summaries of high density
oligonucleotide array probe level data. Biostatistics. 4:249–264.
2003. View Article : Google Scholar : PubMed/NCBI
|
|
13
|
Diboun I, Wernisch L, Orengo CA and
Koltzenburg M: Microarray analysis after RNA amplification can
detect pronounced differences in gene expression using limma. BMC
Genomics. 7:2522006. View Article : Google Scholar : PubMed/NCBI
|
|
14
|
Sherman BT, da Huang W, Tan Q, Guo Y, Bour
S, Liu D, Stephens R, Baseler MW, Lane HC and Lempicki RA: DAVID
Knowledgebase: A gene-centered database integrating heterogeneous
gene annotation resources to facilitate high-throughput gene
functional analysis. BMC Bioinformatics. 8:4262007. View Article : Google Scholar : PubMed/NCBI
|
|
15
|
Szklarczyk D, Franceschini A, Wyder S,
Forslund K, Heller D, Huerta-Cepas J, Simonovic M, Roth A, Santos
A, Tsafou KP, et al: STRING v10: Protein-protein interaction
networks, integrated over the tree of life. Nucleic Acids Res.
43:(Database Issue). D447–D452. 2015. View Article : Google Scholar : PubMed/NCBI
|
|
16
|
Shannon P, Markiel A, Ozier O, Baliga NS,
Wang JT, Ramage D, Amin N, Schwikowski B and Ideker T: Cytoscape: A
software environment for integrated models of biomolecular
interaction networks. Genome Res. 13:2498–2504. 2003. View Article : Google Scholar : PubMed/NCBI
|
|
17
|
Li B, Gao Y, Rankin GO, Rojanasakul Y,
Cutler SJ, Tu Y and Chen YC: Chaetoglobosin K induces apoptosis and
G2 cell cycle arrest through p53-dependent pathway in
cisplatin-resistant ovarian cancer cells. Cancer Lett. 356:418–433.
2015. View Article : Google Scholar : PubMed/NCBI
|
|
18
|
Tu Y, Kim E, Gao Y, Rankin GO, Li B and
Chen YC: Theaflavin-3, 3′-digallate induces apoptosis and G2 cell
cycle arrest through the Akt/MDM2/p53 pathway in
cisplatin-resistant ovarian cancer A2780/CP70 cells. Int J Oncol.
48:2657–2665. 2016.PubMed/NCBI
|
|
19
|
Meng E, Mitra A, Tripathi K, Finan MA,
Scalici J, McClellan S, da Madeira Silva L, Reed E, Shevde LA,
Palle K and Rocconi RP: ALDH1A1 maintains ovarian cancer stem
cell-like properties by altered regulation of cell cycle checkpoint
and DNA repair network signaling. PLoS One. 9:e1071422014.
View Article : Google Scholar : PubMed/NCBI
|
|
20
|
Raman M, Chen W and Cobb MH: Differential
regulation and properties of MAPKs. Oncogene. 26:3100–3112. 2007.
View Article : Google Scholar : PubMed/NCBI
|
|
21
|
Davis RJ: MAPKs: New JNK expands the
group. Trends Biochem Sci. 19:470–473. 1994. View Article : Google Scholar : PubMed/NCBI
|
|
22
|
Klotz R, Zeimet AG, Reimer D,
Müller-Holzner E, Chamson M and Marth C: Activated p38-MAPK and
gemcitabine sensitivity in recurrent ovarian cancer. Anticancer
Res. 28:2975–2980. 2008.PubMed/NCBI
|
|
23
|
Losa J Hernández, Cobo C Parada, Viniegra
J Guinea, Lobo VJ Sánchez-Arevalo, Cajal S Ramón y and
Sánchez-Prieto R: Role of the p38 MAPK pathway in cisplatin-based
therapy. Oncogene. 22:3998–4006. 2003. View Article : Google Scholar : PubMed/NCBI
|
|
24
|
Kong LR, Chua KN, Sim WJ, Ng HC, Bi C, Ho
J, Nga ME, Pang YH, Ong WR, Soo RA, et al: MEK Inhibition overcomes
cisplatin resistance conferred by SOS/MAPK pathway activation in
squamous cell carcinoma. Mol Cancer Ther. 14:1750–1760. 2015.
View Article : Google Scholar : PubMed/NCBI
|
|
25
|
Iwamori M, Tanaka K, Kubushiro K, Lin B,
Kiguchi K, Ishiwata I, Tsukazaki K and Nozawa S: Alterations in the
glycolipid composition and cellular properties of ovarian
carcinoma-derived RMG-1 cells on transfection of the
alpha1,2-fucosyltransferase gene. Cancer Sci. 96:26–30. 2005.
View Article : Google Scholar : PubMed/NCBI
|
|
26
|
Yan L, Lin B, Gao L, Gao S, Liu C, Wang C,
Wang Y, Zhang S and Iwamori M: Lewis (y) antigen overexpression
increases the expression of MMP-2 and MMP-9 and invasion of human
ovarian cancer cells. Int J Mol Sci. 11:4441–4452. 2010. View Article : Google Scholar : PubMed/NCBI
|
|
27
|
Liu D, Liu J, Wang C, Lin B, Liu Q, Hao Y,
Zhang S and Iwamori M: The stimulation of IGF-1R expression by
Lewis(y) antigen provides a powerful development mechanism of
epithelial ovarian carcinoma. Int J Mol Sci. 12:6781–6795. 2011.
View Article : Google Scholar : PubMed/NCBI
|
|
28
|
Gao N, Liu J, Liu D, Hao Y, Yan L, Ma Y,
Zhuang H, Hu Z, Gao J, Yang Z, et al: c-Jun transcriptionally
regulates alpha 1, 2-fucosyltransferase 1 (FUT1) in ovarian cancer.
Biochimie. 107:Pt B. 286–292. 2014. View Article : Google Scholar : PubMed/NCBI
|
|
29
|
Echevarría-Vargas IM, Valiyeva F and
Vivas-Mejía PE: Upregulation of miR-21 in cisplatin resistant
ovarian cancer via JNK-1/c-Jun pathway. PLoS One. 9:e970942014.
View Article : Google Scholar : PubMed/NCBI
|
|
30
|
Chang CC, Hung CM, Yang YR, Lee MJ and Hsu
YC: Sulforaphane induced cell cycle arrest in the G2/M phase via
the blockade of cyclin B1/CDC2 in human ovarian cancer cells. J
Ovarian Res. 6:412013. View Article : Google Scholar : PubMed/NCBI
|
|
31
|
Zheng H, Hu W, Deavers MT, Shen DY, Fu S,
Li YF and Kavanagh JJ: Nuclear cyclin B1 is overexpressed in
low-malignant-potential ovarian tumors but not in epithelial
ovarian cancer. Am J Obstet Gynecol. 201:367.e1–6. 2009. View Article : Google Scholar
|