Introduction
Cholangiocarcinoma (CCA) is the most common biliary
malignancy and the second most common hepatic malignancy, following
hepatocellular carcinoma (1). CCA
accounts for 10–25% of primary liver carcinomas (2). CCA may be classified as intrahepatic
(ICC), perihilar or distal CCA depending on the anatomical location
(3). CCA is more prevalent in Asia
compared with western countries. This is primarily attributed to
the increased prevalence of established risk factors, including
parasitic infections, bile duct cysts and hepatolithiasis (2). However, the incidence of ICC in the
USA has increased from 0.44 to 1.18 cases/100,000 over the past
three decades (4). The majority of
CCA cases have the characteristics of insidious early and atypical
clinical symptoms, rapid progression and poor prognosis. Surgery is
the only curative treatment for patients with CCA; however, 50–95%
of cases are not surgical candidates (5). The current 5-year survival rate for
CCA following surgery and chemotherapy is <20% (6). In addition, CCA is difficult to
diagnose, and existing CCA classification systems do not provide
insights into the mechanisms of CCA tumorigenesis or potential
targets for therapy (7).
Therefore, a better understanding of the biology and molecular
pathogenesis of CCA may provide the basis to target these markers
for tumor prevention or therapy.
Genomic profiling studies have highlighted differing
patterns of CCA, helping to stratify patients for targeted
therapies (8). Previous studies
have investigated the roles of genetic, epigenetic and
transcriptomic alterations, in tumor suppressor genes and
oncogenes, in the pathogenesis of CCA. Using integrative molecular
analysis, Sia et al (9)
described two distinct gene signature classes: A proliferation and
an inflammatory class. The proliferation class has specific copy
number alterations, activation of oncogenic pathways, and is
associated with worse outcome. Based on microarray analysis,
Jusakul et al (7)
additionally revealed four distinct clusters characterized by
different clinical features and genomic alterations. These previous
results exemplify how genetics, epigenetics and environmental
carcinogens may interplay across different geographies to generate
distinct molecular subtypes of cancer. In addition, there are
studies comparing gene expression profiles between ICC and
hepatocellular carcinoma (HCC), in order to identify differences in
their carcinogenic mechanisms (10,11).
These studies identified genetic alterations in CCA that
potentially render early diagnosis and precision treatment a
possibility.
However, relatively small sample sizes, and
differences in control design and platforms, has led to
inconsistencies in terms of the identified genes. Additionally,
certain studies have used HCC tissue as a control to identify
differentially expressed genes (DEGs) in ICC (10,11).
All these aspects increase the heterogeneity of the results.
Therefore, an integrated analysis of multiple microarray studies
may be helpful to define common DEGs and provide additional
evidence for understanding the regulatory mechanism of CCA.
In the present study, an integrated analysis to
identify DEGs between CCA and non-tumor tissues was performed by
integrating gene expression files in the Gene Expression Omnibus
(GEO) database using the web-based tool, NetworkAnalyst. The
protein-protein interaction (PPI) network of these genes was
subsequently constructed and visualized. In addition, significantly
enriched functions of these DEGs were screened and analyzed to
identify CCA-associated biological processes and pathways.
Materials and methods
Dataset collection and data
processing
Gene expression profiles of CCAs were obtained from
the GEO database (www.ncbi.nlm.nih.gov/geo). The following key words
were used: ‘Homo sapiens’ and ‘cholangiocarcinoma’. Datasets
containing gene expression profiles of CCA and non-tumor tissues or
cultured cells were included in the present study. Studies with a
sample number <10 were excluded. A total of seven datasets were
included in this systematic review. The GEO IDs of these seven
datasets were GSE26566, GSE32225, GSE32879, GSE89749, GSE22633,
GSE45001 and GSE57555 (Table I)
(7,9,11–15).
 | Table I.Characteristics of the individual
studies for integrated analysis. |
Table I.
Characteristics of the individual
studies for integrated analysis.
|
|
|
| Sample type |
|
|---|
|
|
|
|
|
|
|---|
| Author, year | Datasets | Platforms | CCA, no. | Control, no. | (Refs.) |
|---|
| Jusakul et
al, 2017 | GSE89749 | Illumina HumanHT-12
V4.0 expression beadchip | 118 | 2 | (7) |
| Sia et al,
2013 | GSE32225 | Illumina HumanRef-8
WG-DASL v3.0 | 149 | 6 | (9) |
| Murakami et
al, 2015 | GSE57555 | Agilent-039494
SurePrint G3 Human GE v2 8×60K Microarray | 11 | 11 | (11) |
| Andersen et
al, 2012 | GSE26566 | Illumina humanRef-8
v2.0 expression beadchip | 104 | 6 | (12) |
| Oishi et al,
2012 | GSE32879 | Affymetrix Human
Gene 1.0 ST Array | 16 | 7 | (13) |
| Seol et al,
2011 | GSE22633 | Illumina human-6
v2.0 expression beadchip | 20 | 4 | (14) |
| Sulpice et
al, 2016 | GSE45001 | Agilent-028004
SurePrint G3 Human GE 8×60K Microarray | 10 | 10 | (15) |
Processed data in matrix form were collected from
each qualifying microarray study. A global meta-analysis for
identifying DEGs in CCA was conducted using the rank product
algorithm (RankProd package in R statistical software; www.r-project.org) implemented in the web-based tool
NetworkAnalyst (integrative meta-analysis of expression data;
www.networkanalyst.ca) (16,17).
Normalized gene expression datasets were uploaded into
NetworkAnalyst. The datasets were subsequently processed and
annotated to adjust the data format and class labels to a
consistent style. Following an integrity check, the random effects
model was used to calculate the pooled effect size according to the
result of Cochran's Q tests (16).
Functional enrichment analysis of
DEGs
The Database for Annotation, Visualization and
Integrated Discovery (DAVID; david.abcc.ncifcrf.gov/knowledgebase) (18,19)
is a comprehensive set of functional annotation tools. In the
present study, gene ontology (GO) enrichment analysis (including
biological process, cellular component and molecular function
categories) and Kyoto Encyclopedia of Genes and Genomes (KEGG)
pathway enrichment analysis for DEGs was performed using the DAVID
tool. A P-value of 0.05 was selected as the cutoff criterion.
Construction of PPI network
Network analyst uses a comprehensive, high-quality
PPI database downloaded from InnateDB (20), which is part of the International
Molecular Exchange (IMEx) consortium (21). It additionally contains manually
curated protein interaction data from published literature and
experimental data from a number of PPI databases, including IntAct
(22), MINT (23), DIP (24), BIND (25) and BioGRID (26). To construct the gene coexpression
network of the DEGs, the DEGs were mapped on the protein
interaction network tool in NetworkAnalyst. As the total nodes were
>2,000, the network was switched to zero-order interactions,
which composed only of the seed nodes and the edges that
interconnect them (16).
Visualization and functional analyses were performed. Furthermore,
functional modules from the PPI network in NetworkAnalyst were
identified and extracted, using enrichment analysis.
Results
Data processing and DEG
identification
From the GEO database of the National Center for
Biotechnology Information, seven GEO datasets associated with CCA
that met our criteria for meta-analysis were extracted (Table I). Among these datasets, a total of
428 CCA cases and 46 controls were included in the integrated
analysis.
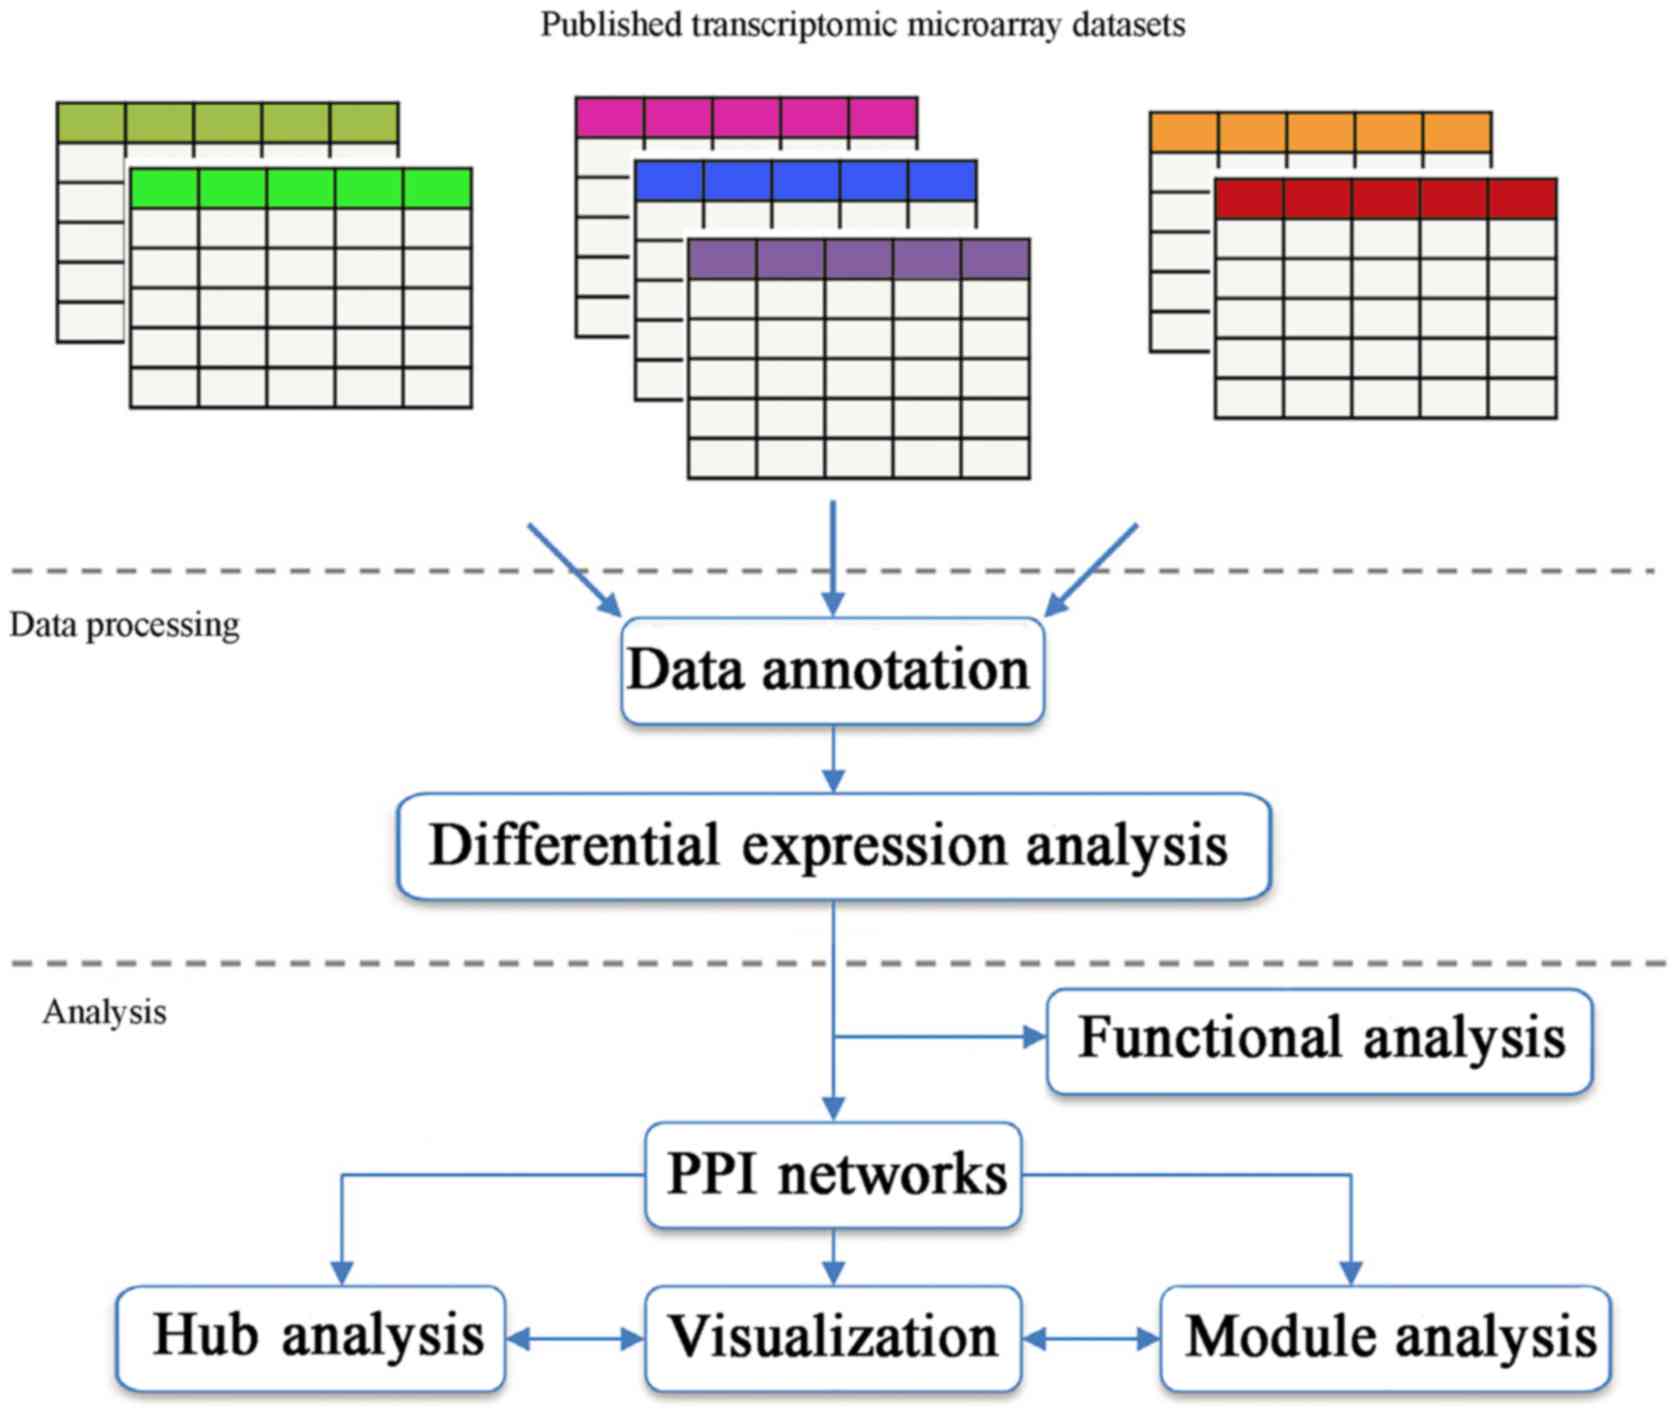
An overview of the meta-analysis approach is
outlined in Fig. 1. The
meta-analysis page of the NetworkAnalyst website presents five
common approaches for meta-analysis. The present study was
performed based on combining effect sizes. According to the result
of Cochran's Q test (data not shown), the random effects model was
chosen for statistical meta-analysis. DEGs with P<0.05 were
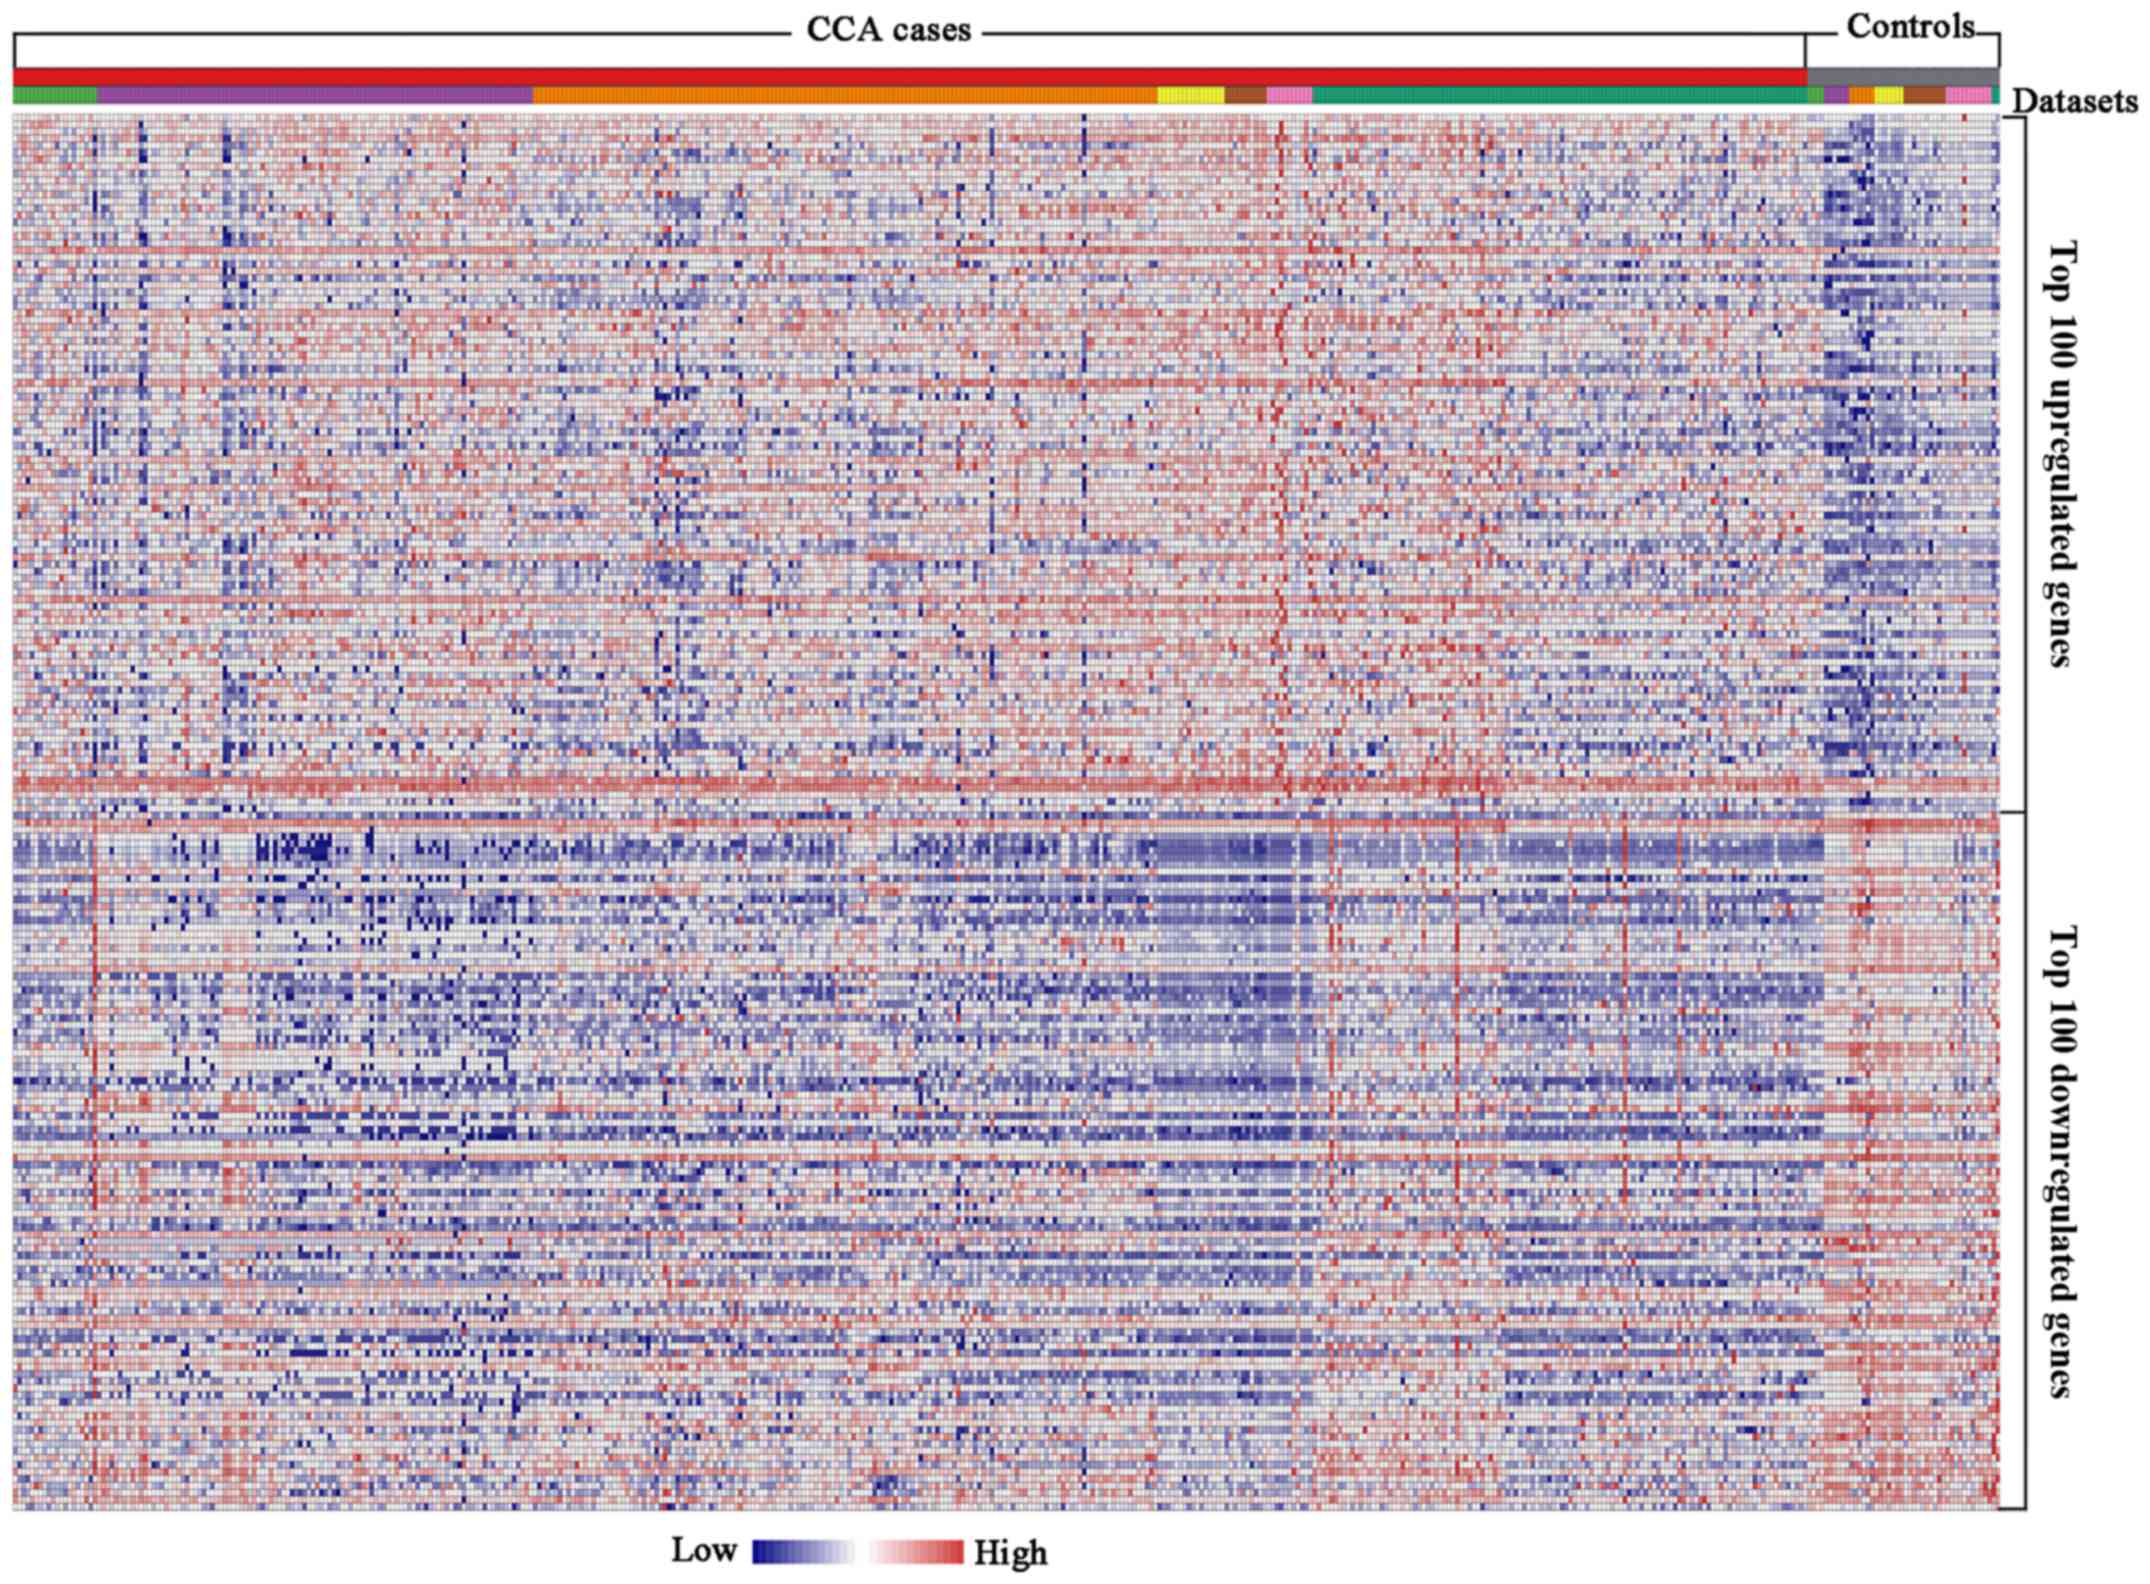
selected. A total of 12,081 genes were identified by integrated
analysis, and 1,080 DEGs were identified from this meta-analysis,
including 710 upregulated and 370 downregulated genes. The 10 most
significantly upregulated genes (P<0.05) are secreted
phosphoprotein 1 (SPP1), matrix metallopeptidase 11 (MMP11),
collagen type I α1 chain (COL1A1), thymosin β10 (TMSB10), agrin
(AGRN), collagen type IV α1 chain (COL4A1), Collagen type X α1
chain (COL10A1), minichromosome maintenance complex component 3
(MCM3), collagen type IV α2 chain (COL4A2) and solute carrier
family 39 member 1 (SLC39A1; Table
IIA). The 10 most significantly downregulated genes (P<0.05)
are FXYD domain containing ion transport regulator 1 (FXYD1),
cytochrome P450 family 2 subfamily A member 13 (CYP2A13),
cystathionine gamma-lyase (CTH), apolipoprotein F (APOF), ornithine
carbamoyltransferase (OTC), hydroxyacid oxidase 2 (HAO2),
glycine-N-acyltransferase (GLYAT), phosphoenolpyruvate
carboxykinase 2 (PCK2), microsomal triglyceride transfer protein
(MTTP) and cytochrome P450 family 4 subfamily A member 22 (CYP4A22;
Table IIB). The heat map of the
top 100 upregulated and downregulated DEGs is presented in Fig. 2.
| Table II.Top 10 most significantly up- or
downregulated differentially expressed genes. |
Table II.
Top 10 most significantly up- or
downregulated differentially expressed genes.
| A, Upregulated
genes |
|---|
|
|---|
| Entrez ID | Name | Combined ES | P-value |
|---|
| 6696 | SPP1 | −2.2097 | 0.014356 |
| 4320 | MMP11 | −2.0235 | 0.000592 |
| 1277 | COL1A1 | −1.9385 | 0.040954 |
| 9168 | TMSB10 | −1.8021 | 0.014024 |
| 375790 | AGRN | −1.7029 | 0.008481 |
| 1282 | COL4A1 | −1.5809 | 0.004244 |
| 1300 | COL10A1 | −1.5545 | 0.000309 |
| 4172 | MCM3 | −1.5505 | 0.001245 |
| 1284 | COL4A2 | −1.5413 | 0.010102 |
| 27173 | SLC39A1 | −1.5064 | 0.015808 |
|
| B, Downregulated
genes |
|
| Entrez ID | Name | Combined ES | P-value |
| 5348 | FXYD1 | 2.508 | 0.009848 |
| 1553 | CYP2A13 | 2.5026 | 0.029454 |
| 1491 | CTH | 2.4578 | 0.000691 |
| 319 | APOF | 2.4369 | 0.048764 |
| 5009 | OTC | 2.4193 | 0.039134 |
| 51179 | HAO2 | 2.4088 | 0.040748 |
| 10249 | GLYAT | 2.3862 | 0.037987 |
| 5106 | PCK2 | 2.3849 | 0.002871 |
| 4547 | MTTP | 2.3174 | 0.038962 |
| 284541 | CYP4A22 | 2.2502 | 0.013350 |
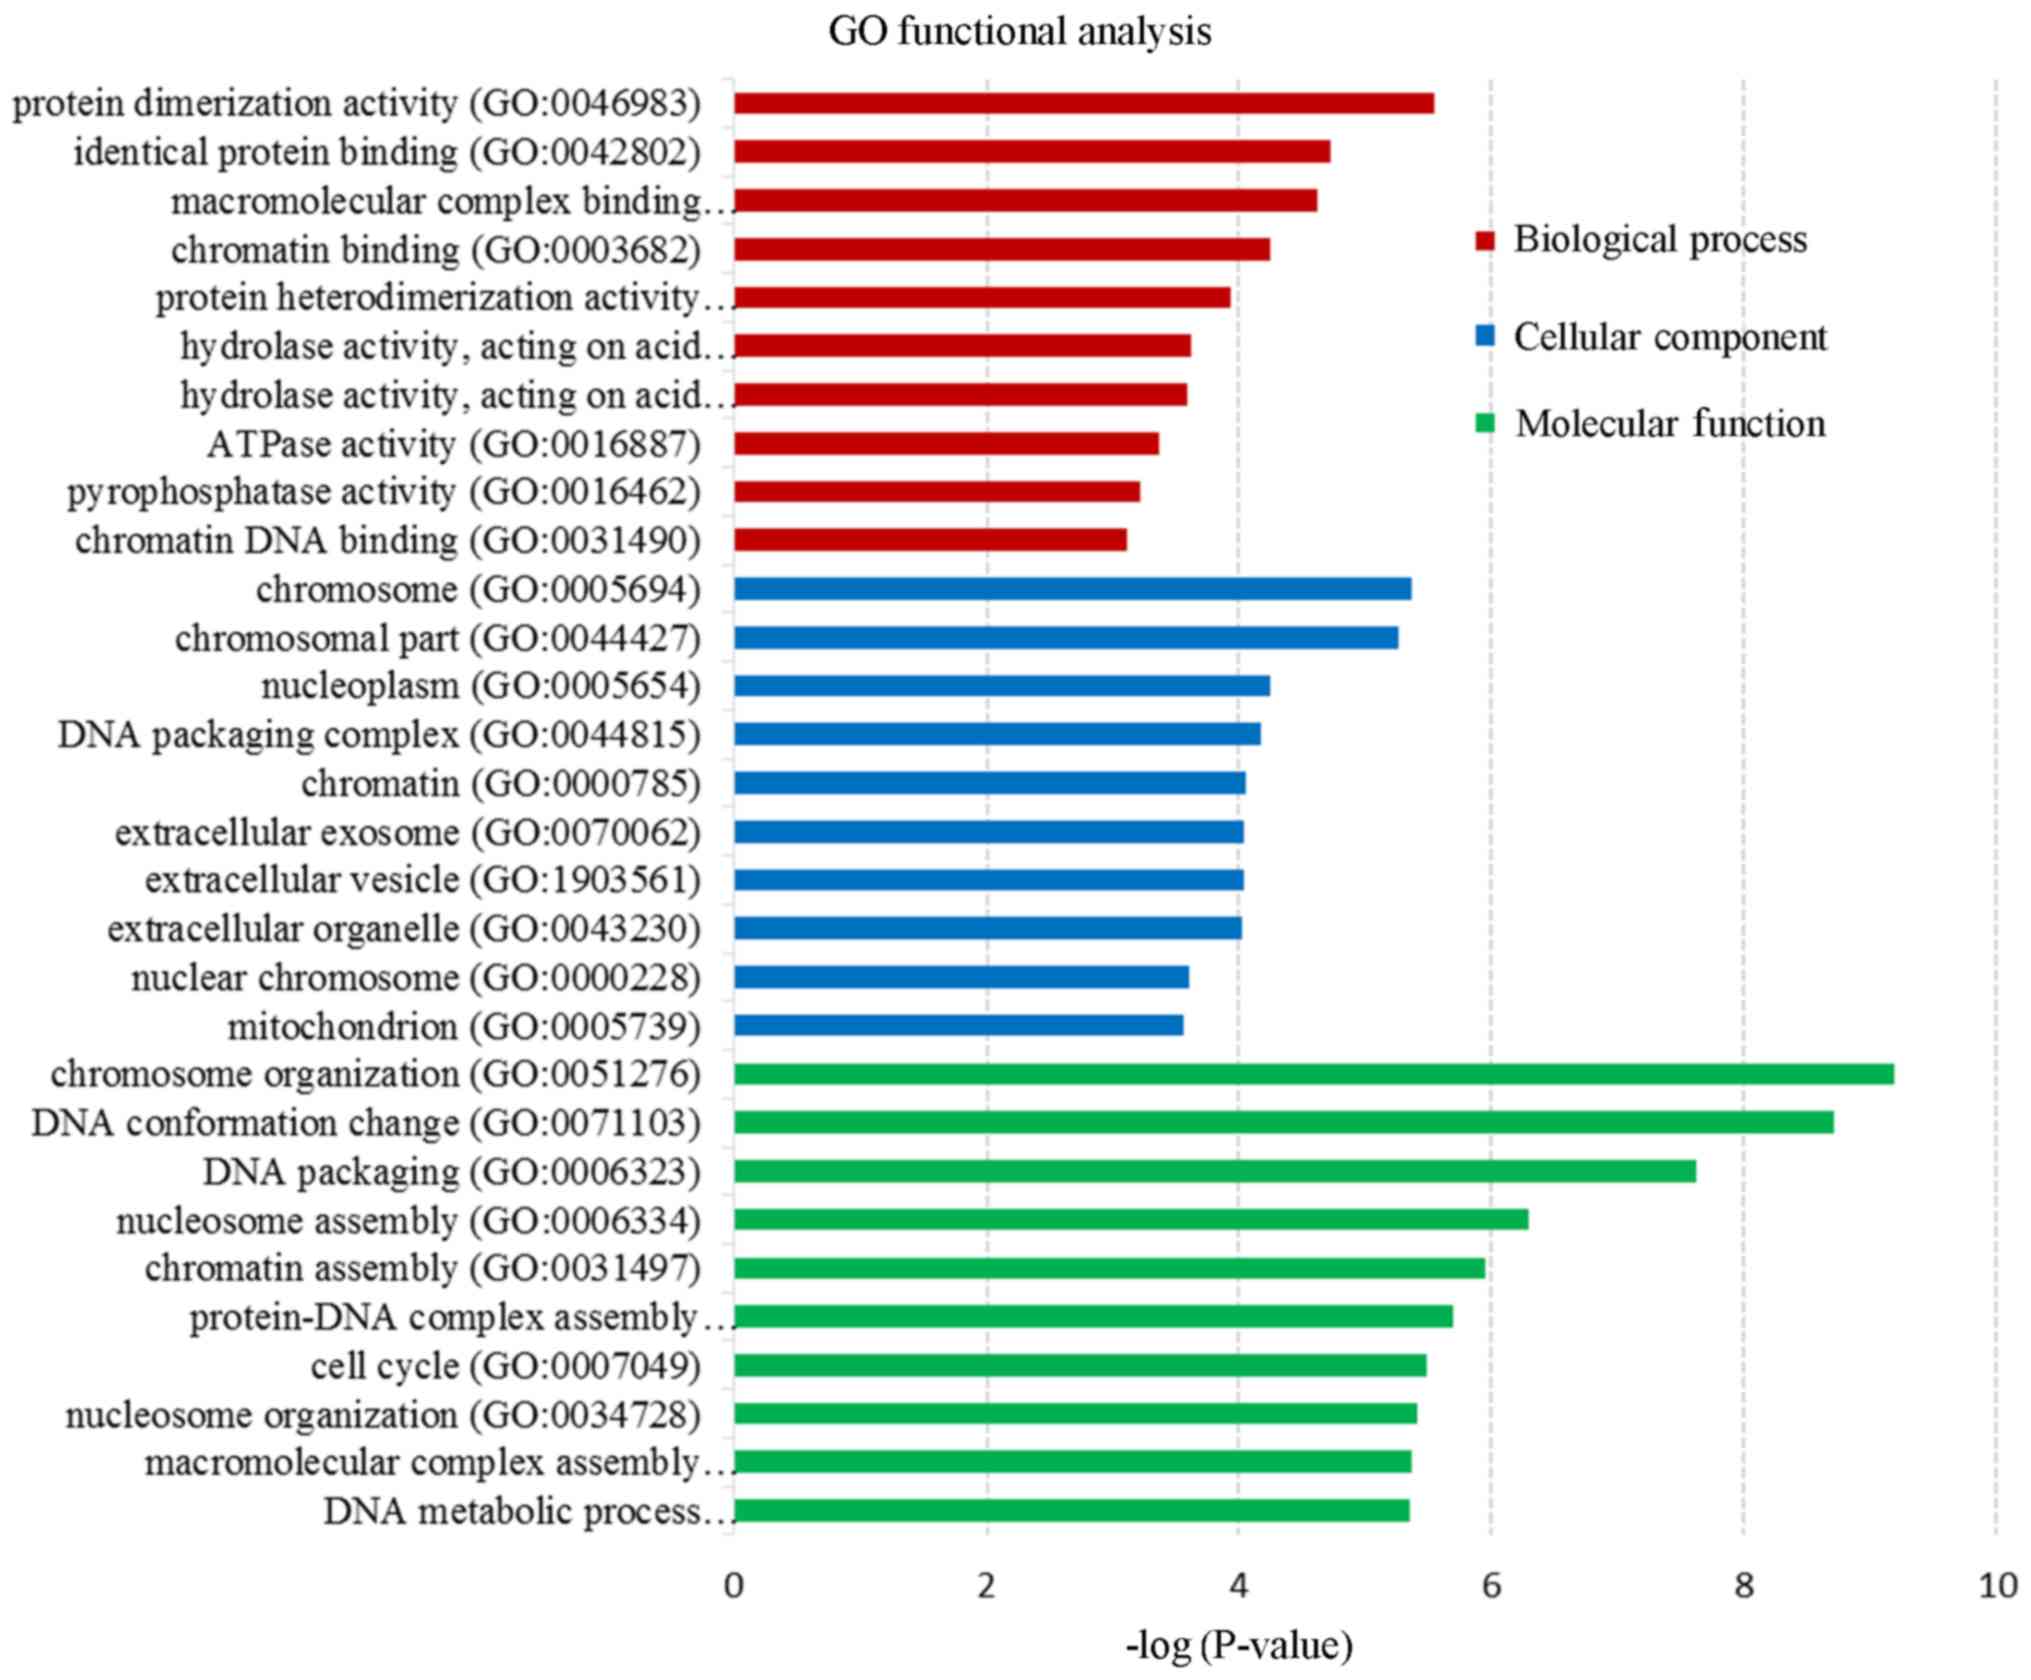
Functional enrichment analysis
Functional enrichment analysis was performed to
further study these DEGs. Following GO enrichment analysis, three
categories (biological process, cellular component and molecular
function) were detected using the DAVID database. The 10 most
significantly enriched terms (P<0.05) in each category are
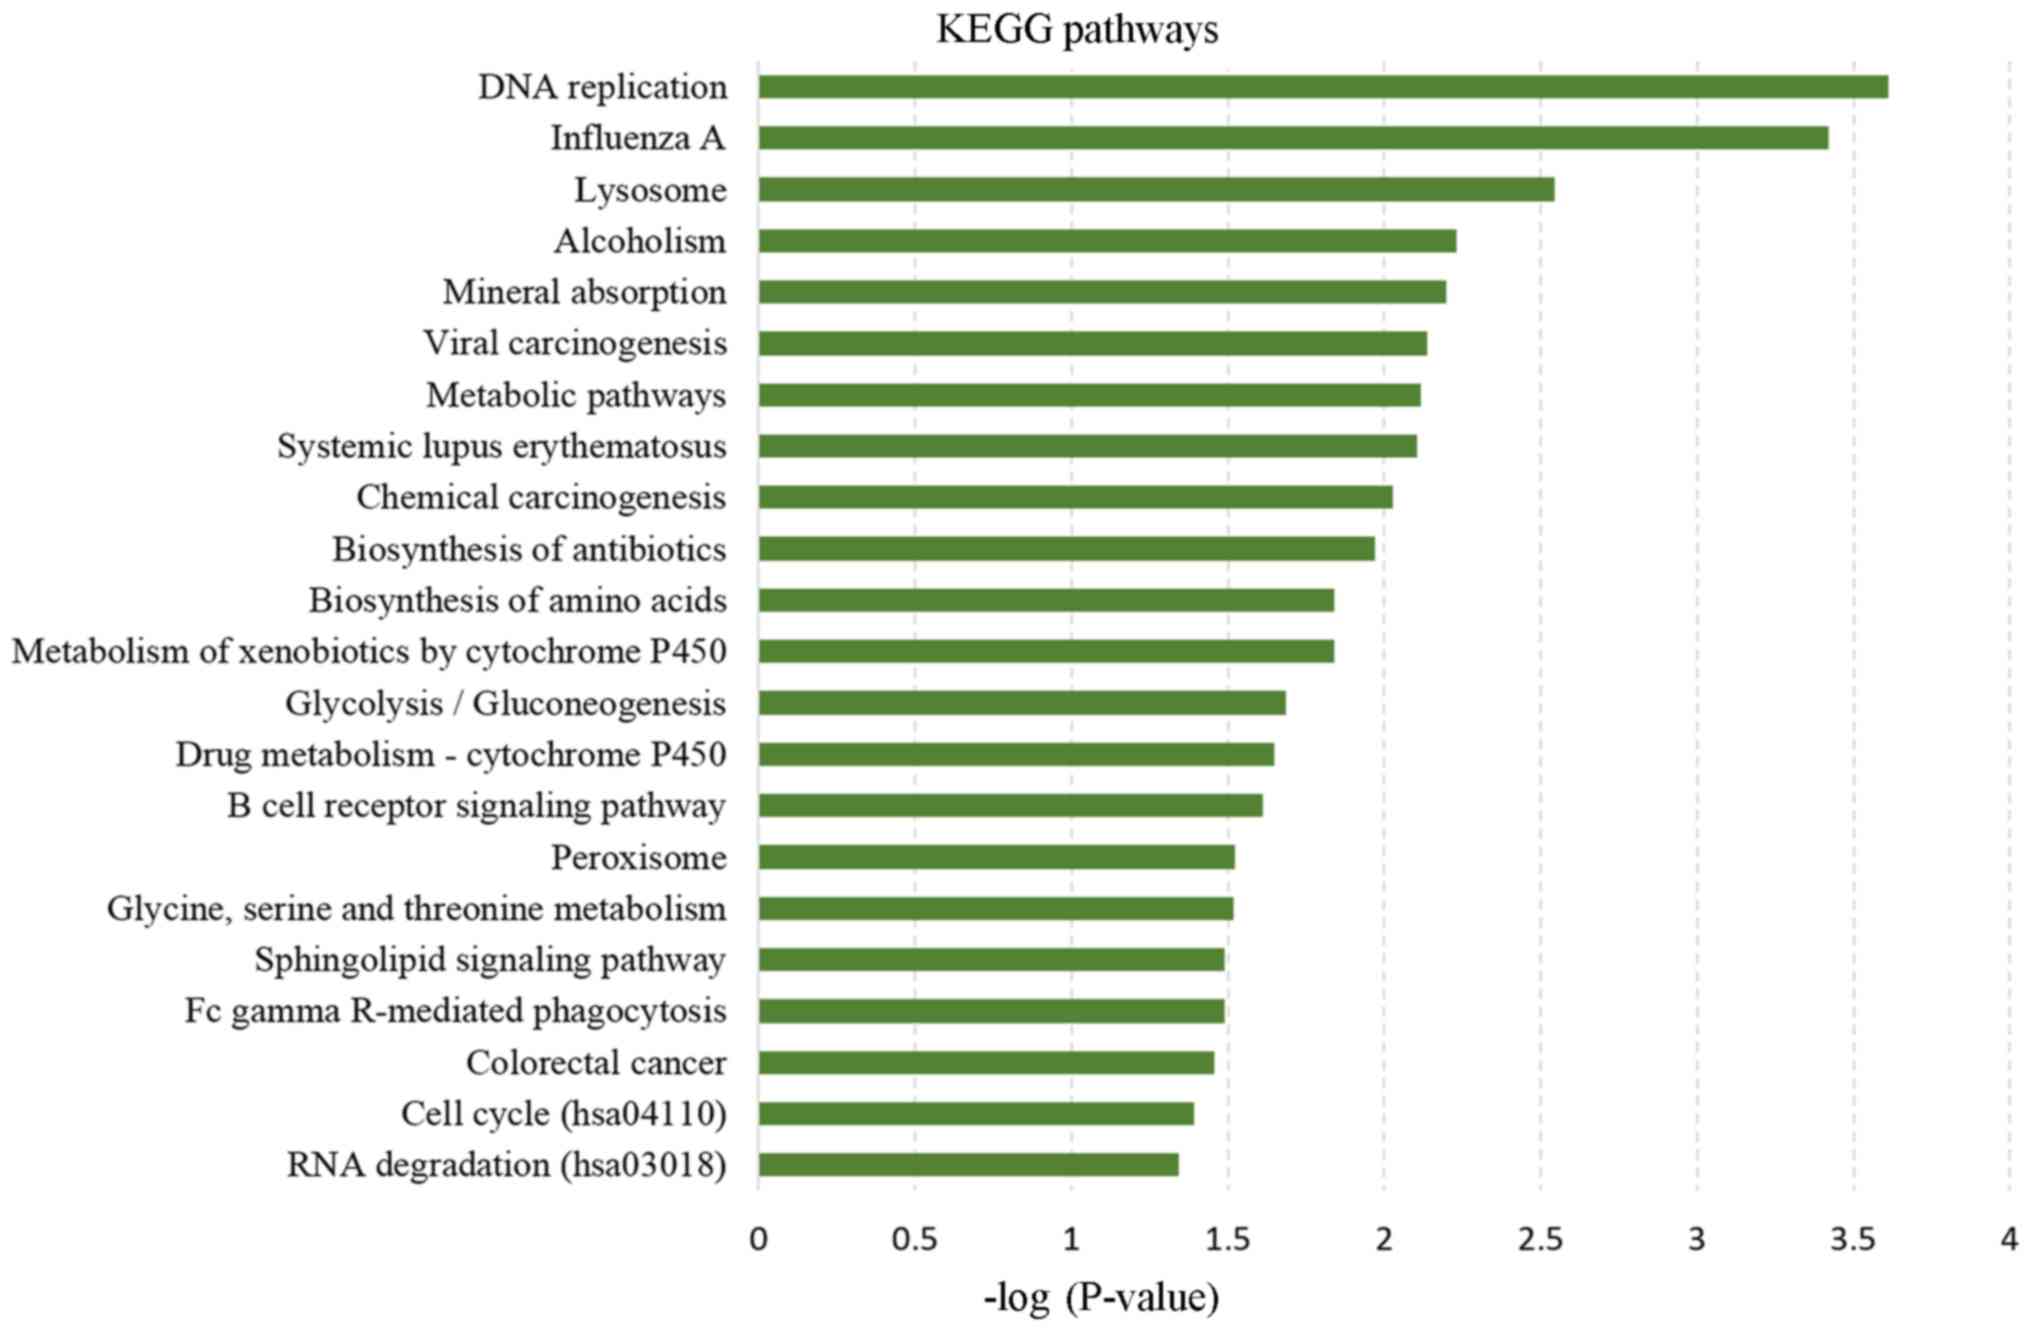
presented in Fig. 3. KEGG pathway
analysis revealed 23 significantly enriched pathways, with ‘DNA
replication’ being the most significantly enriched pathway. In
addition, ‘influenza A’ and ‘lysosome’ were also significantly
enriched pathways (Fig. 4).
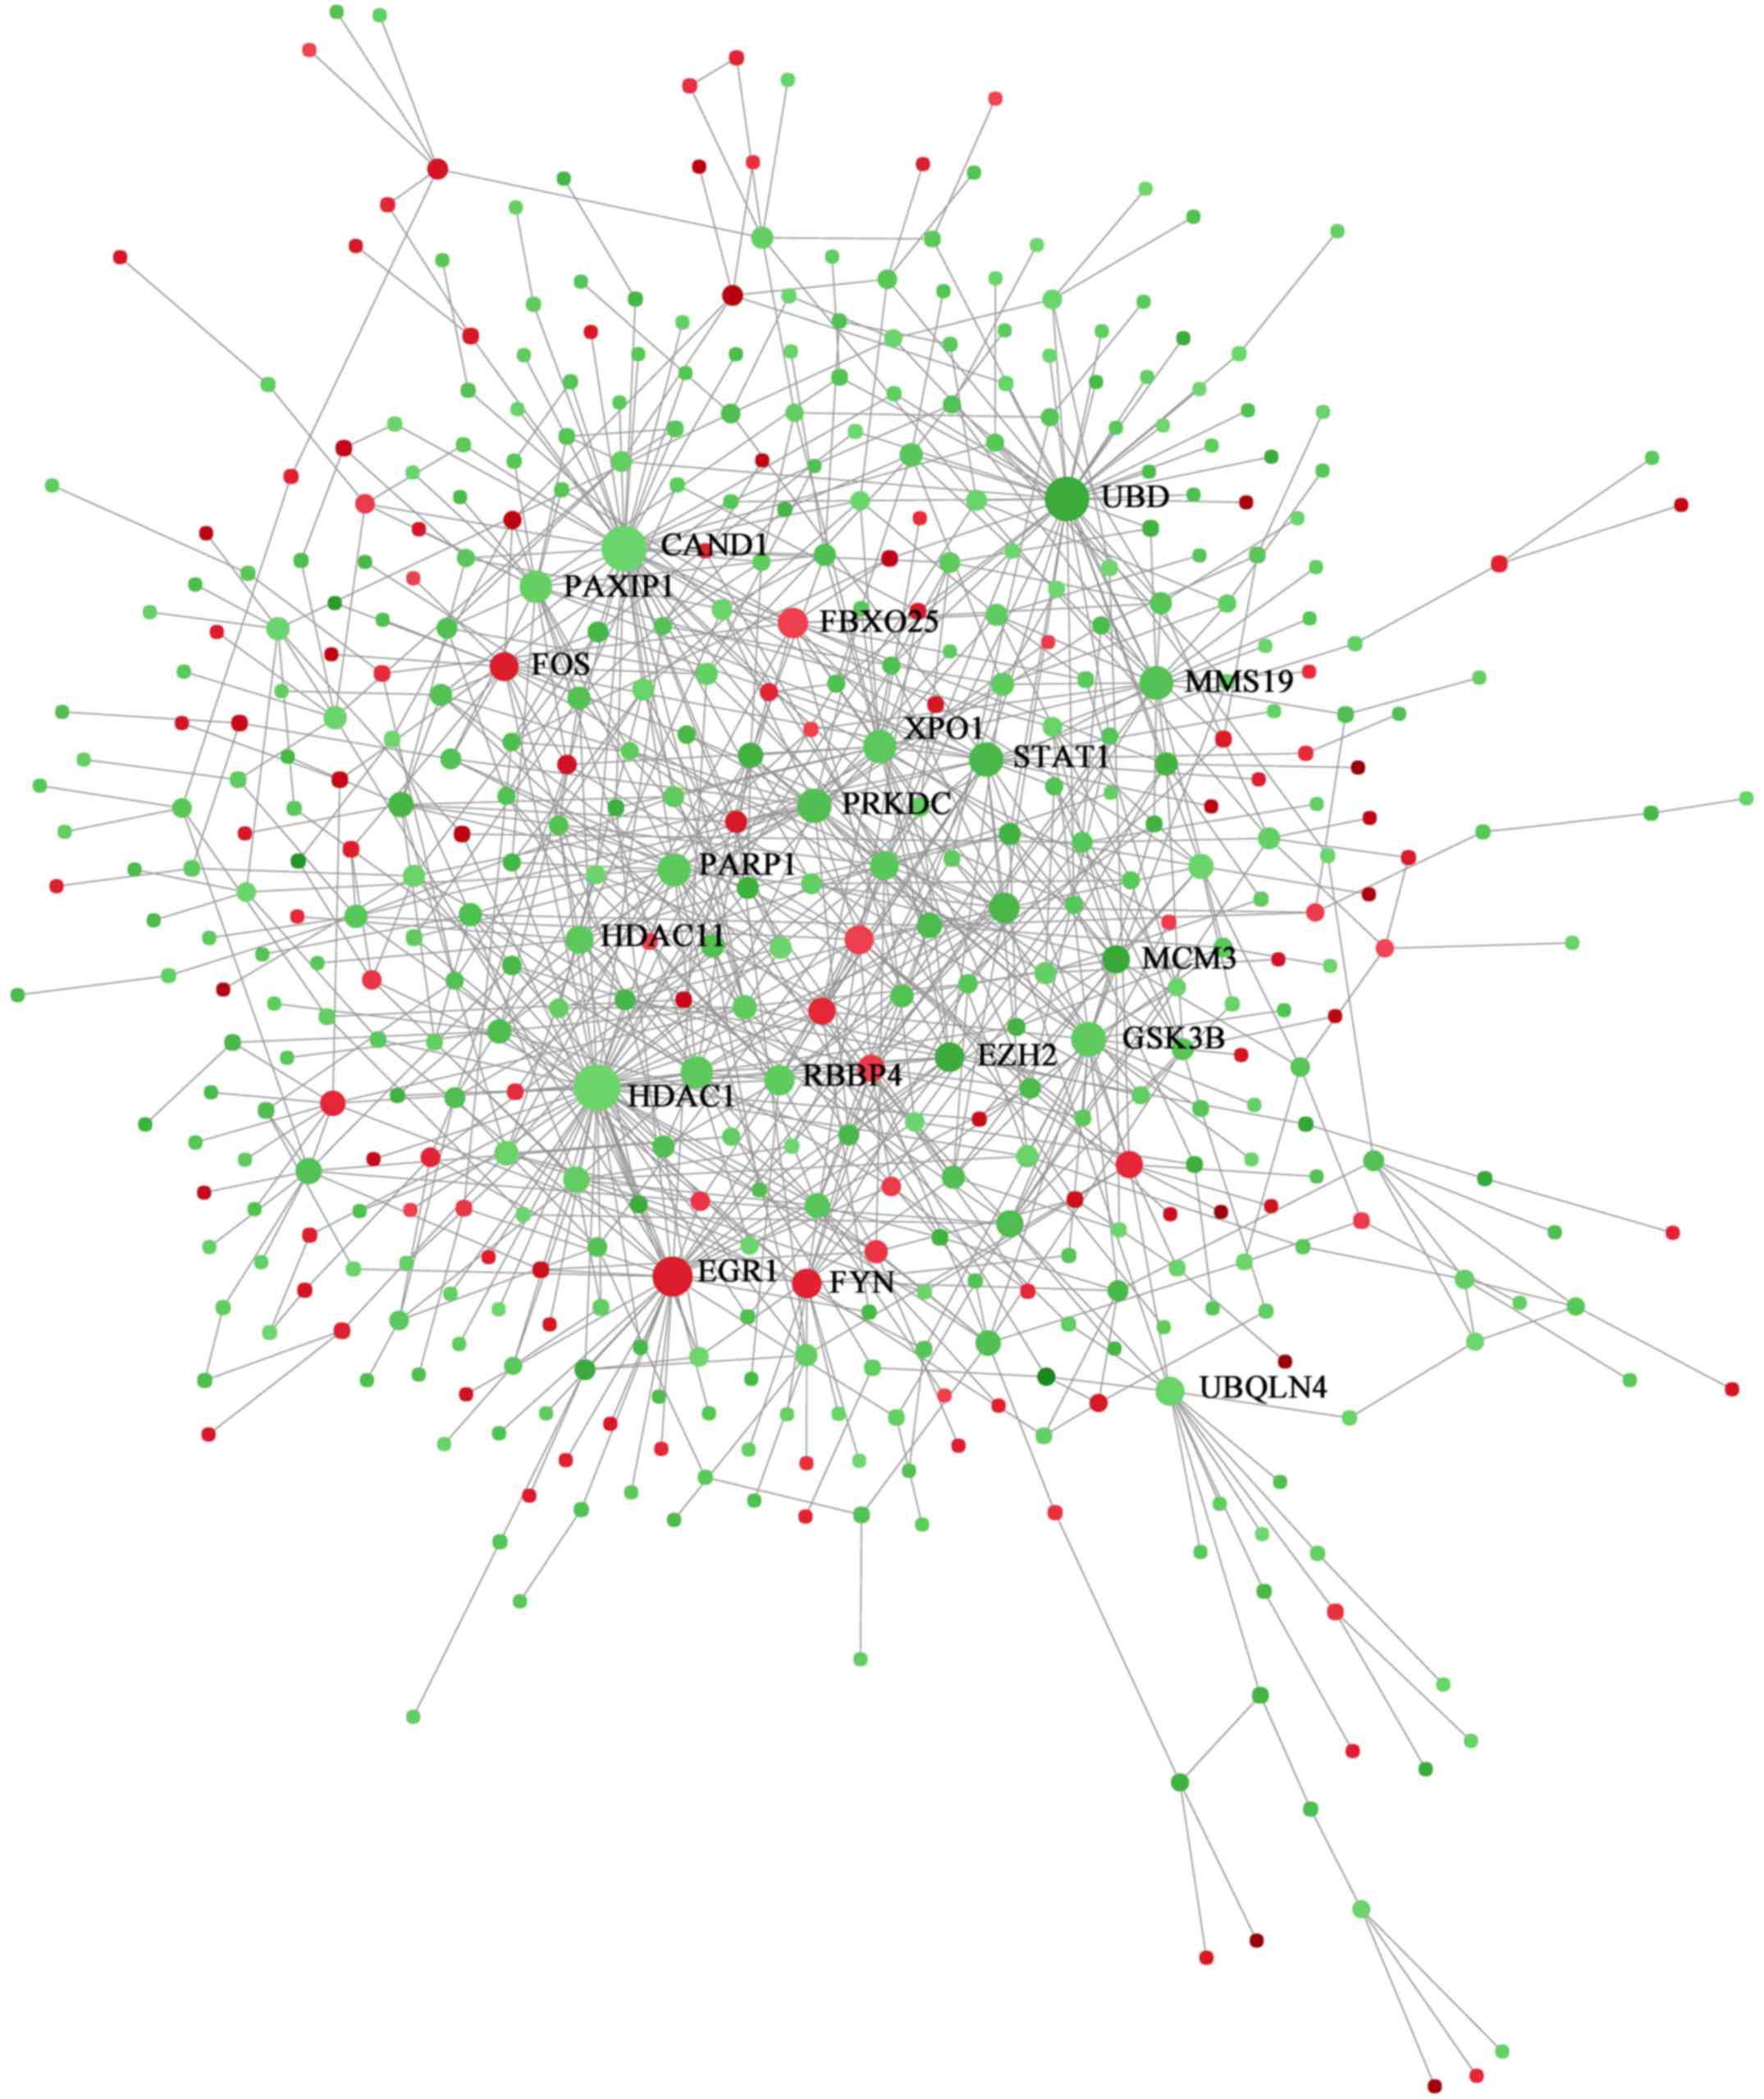
PPI network construction
Based on the IMEx database, the PPI network of the
DEGs was constructed using NetworkAnalyst. The interaction network
included 471 nodes and 896 edges (Fig.
5). In the PPI network, degrees were defined to determine the
number of neighbors a node is directly connected to, and nodes with
higher degrees were considered to be hub proteins. The five most
significant hub proteins were histone deacetylase 1 (HDAC1;
degree=50), cullin-associated NEDD8-dissociated protein 1 (CAND1;
degree=47), ubiquitin D (UBD; degree=44), early growth response
protein 1 (EGR1; degree=33) and glycogen synthase kinase 3β (GSK3B;
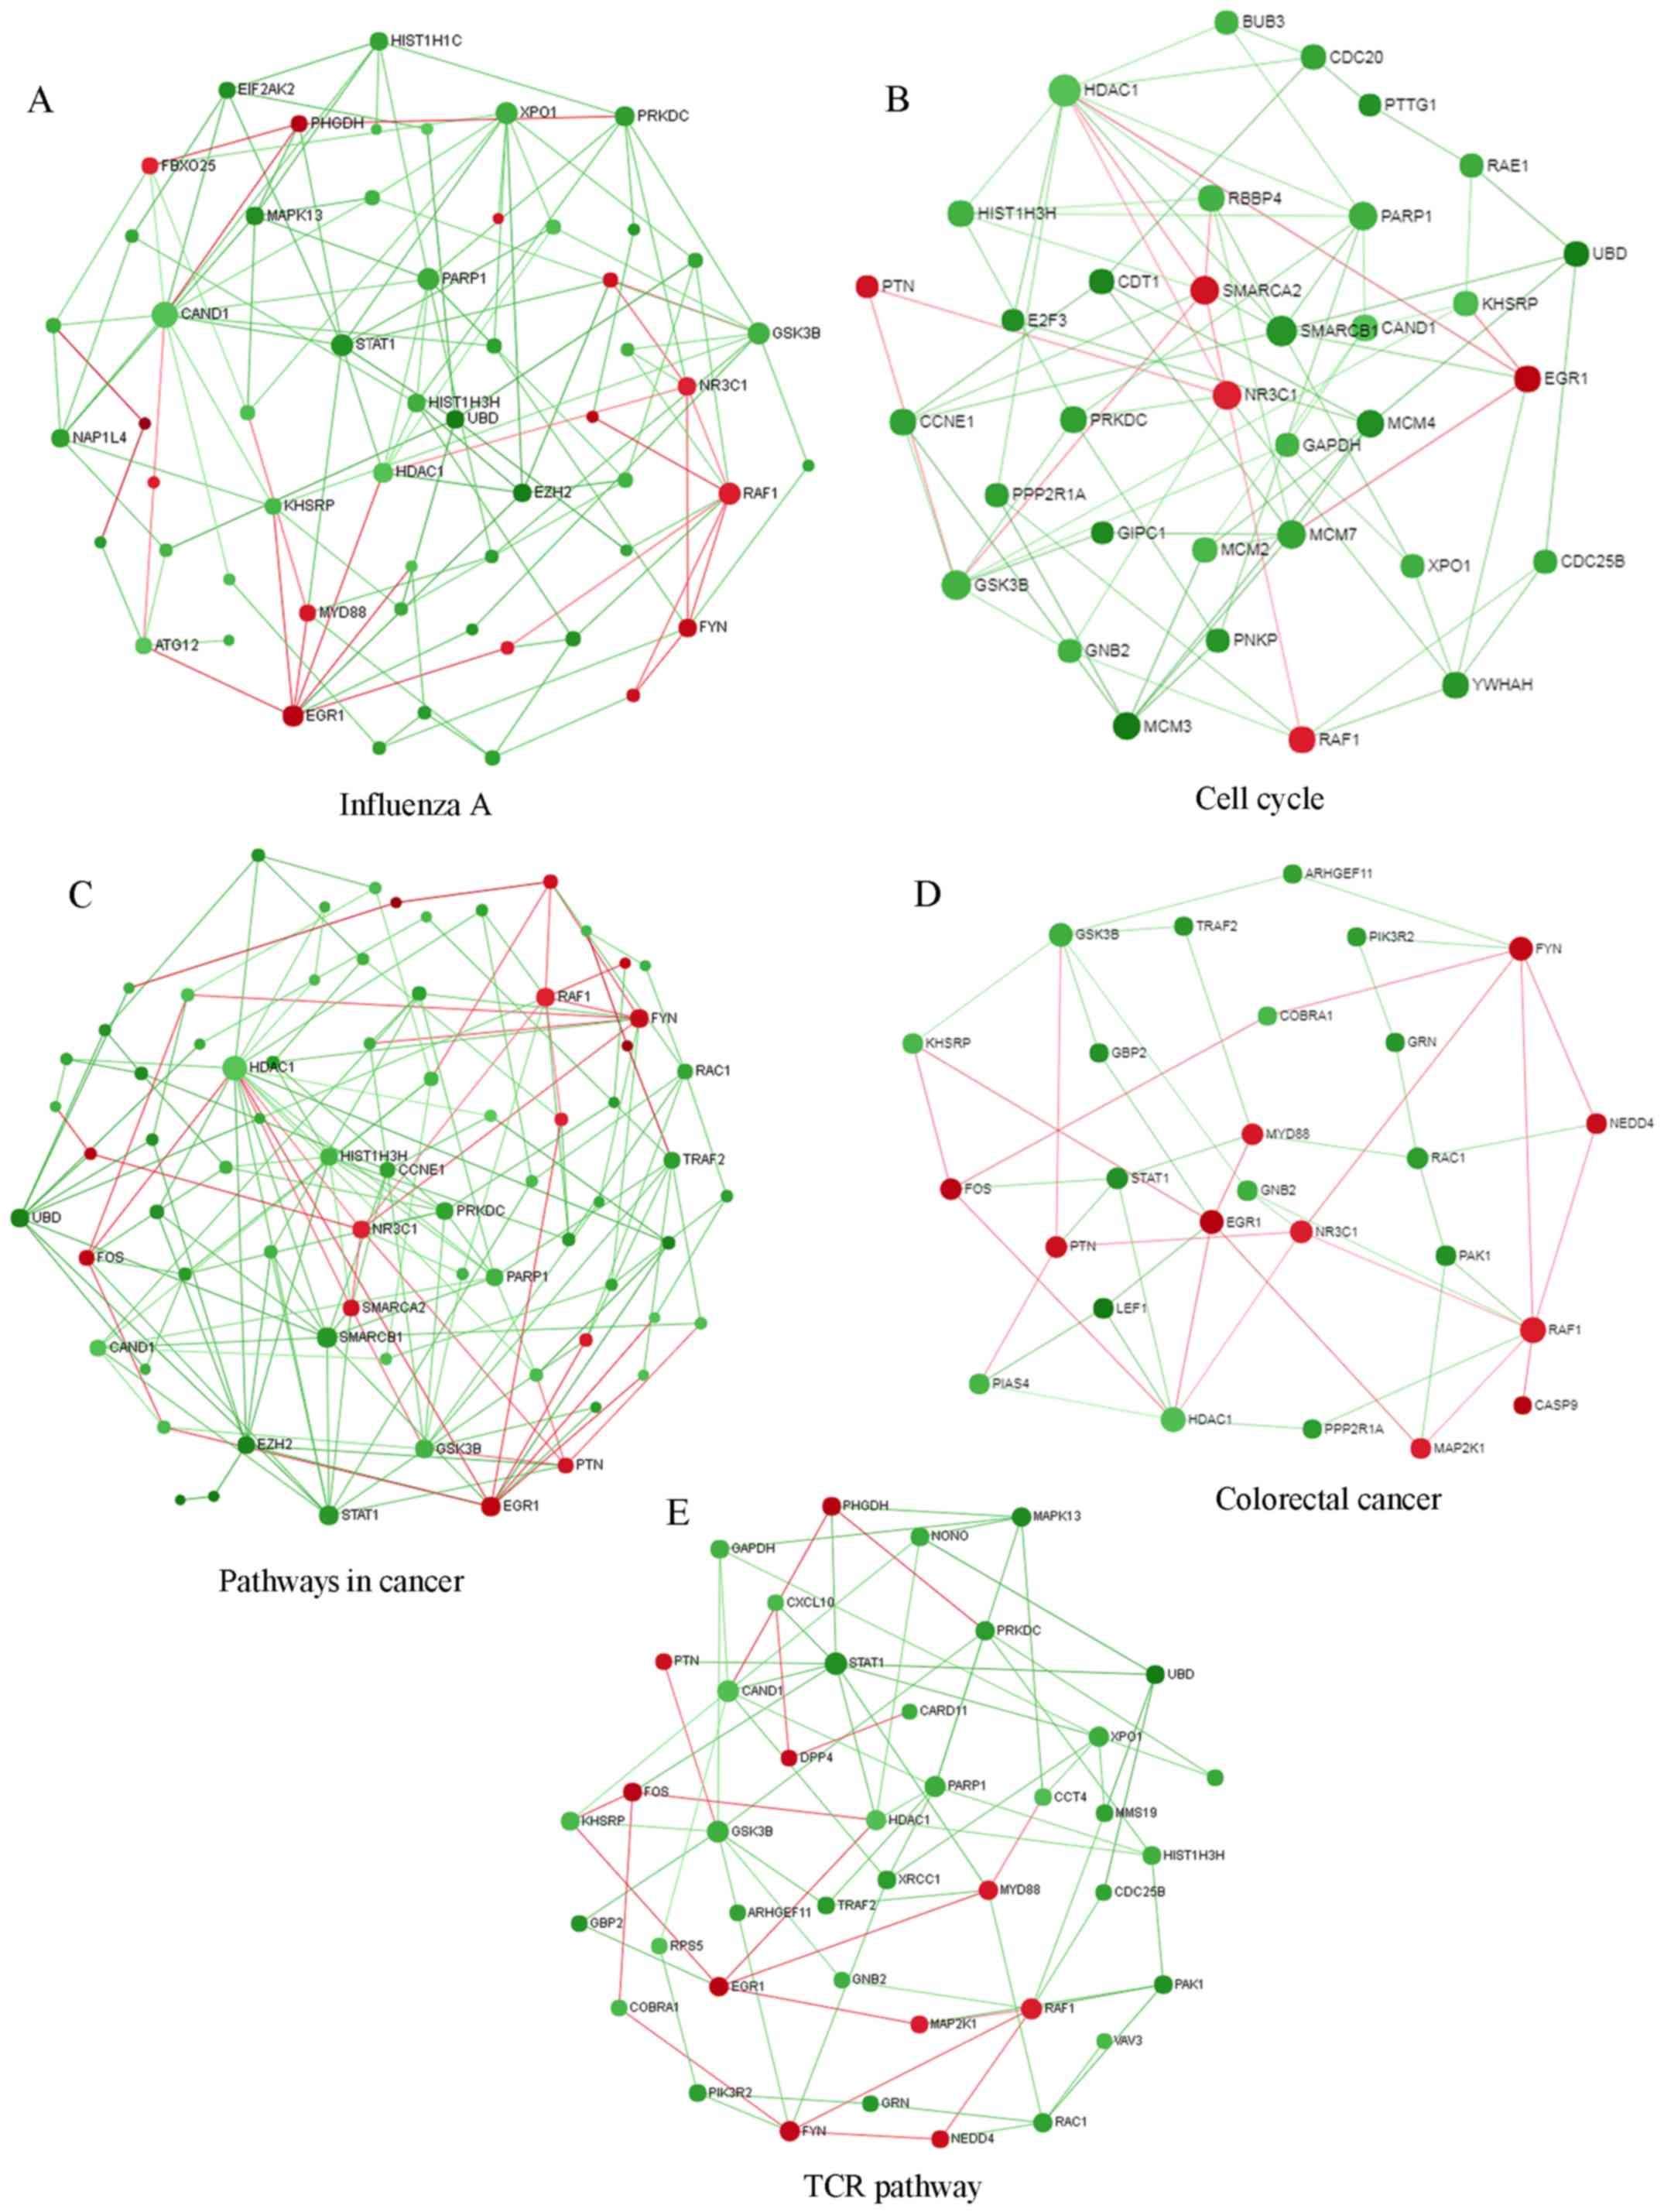
degree=23). KEGG pathways were subsequently extracted from the PPI
network. The five most significantly enriched KEGG pathways in the
PPI network were ‘influenza A’, ‘cell cycle’, ‘pathways in cancer’,
‘colorectal cancer’ and ‘T cell receptor signaling pathway’
(Fig. 6). Numerous hub genes were
associated with these pathways.
Discussion
CCA is the most common primary malignancy of the
biliary tract. The prognosis of this malignancy is dismal owing to
its silent clinical character, difficulties in early diagnosis and
limited therapeutic approaches; median survival is less than 24
months (27). There are a number
of established risk factors for the development of CCA, although
the majority of patients have no identifiable risks (2). Therefore, the identification of novel
tumor biomarkers for the early diagnosis and effective treatment of
patients with CCA is an important future direction. The
transcriptional regulatory network, screened and analyzed with
advanced technologies including transcriptomic and proteomic
analysis, may be informative to understand the underlying
regulatory mechanisms and provide additional evidence for
therapeutic applications.
In the present study, a total of 1,080 DEGs were
identified based on an integrated analysis. Through a PubMed
literature search, it was identified that six out of the 10 most
upregulated genes have been associated with CCA in biological or
clinical experiments: SPP1 (28,29),
MMP11 (30), COL1A1 (31), TMSB10 (32), AGRN (33), and COL4A1 (29). By microarray analysis and reverse
transcription-quantitative polymerase chain reaction, Hass et
al (28) determined that SPP1
is the most overexpressed gene in ICC. Another study demonstrated
that SPP1 expression in the stroma of ICC is significantly
associated with the overall patient survival (29). A previous study illustrated the
role of MMP11 in cancer progression, with positive MMP11 expression
in CCA indicating poor prognosis (30). COL1A1 is a component of type I
collagen, which has been reported to be involved in tumor invasion
and progression. COL1A1 is significantly upregulated in CCA
compared with non-tumor tissues (31). Tissue microarray analysis by
Sulpice et al (29)
demonstrated increased expression of COL4A1 in the stroma of ICC.
Abnormal expression of TMSB10 may contribute to the malignant
progression of HCC, and high expression of TMSB10 predicts poor
prognosis in patients with HCC following hepatectomy (34). High TMSB10 expression is
significantly associated with clinicopathological features, poor
prognosis, and distant metastases in patients with breast cancer
(35). AGRN is a multidomain
heparan sulfate proteoglycan, with different modules homologous to
domains present in basement membrane proteins. AGRN expression and
deposits are increased in CCA compared with HCC and nontumorous
livers, which implies multiple roles in the pathogenesis and
progression of CCA (33). However,
few downregulated DEGs have been reported to be associated with
CCA. Certain genes may be associated with CCA indirectly. For
example, the metabolic gene HAO2 is downregulated in HCC, and HAO2
expression levels are inversely correlated with grading, overall
survival and metastatic ability (36). Cystathionine-γ-lyase expression is
regulated by the Wnt pathway at the transcriptional level and is
involved in colon cancer (37); it
additionally leads to the development of breast cancer in
association with the STAT3 signaling pathway (38). The low expression level of these
genes may be associated with the development of CCA, although there
are no specific experiments investigating these genes in CCA.
The functional mechanisms of these DEGs using GO and
KEGG pathway analyses were further investigated. A total of 482
significantly enriched terms in the biological process, 42 in the
cellular component and 73 in the molecular function category were
identified. All of the 10 most significantly enriched terms in the
biological process category are associated with DNA and
chromosomes. Active DNA synthesis means proliferation signaling
pathways may be activated in CCA, and an activated cell cycle
process may be a sign of proliferation or cancer progression. There
were 141 DEGs enriched in the cell cycle process, including
enhancer of zeste 2 polycomb repressive complex 2 subunit (EZH2),
cyclin C and cyclin E1. EZH2 expression promotes the progression of
CCA cells by regulating the cell cycle and is associated with poor
CCA prognosis (39). In the top 10
cell cycle process terms, apart from terms associated with DNA and
chromosomes, there were three GO terms associated with
extracellular components: ‘Extracellular exosome’, ‘extracellular
vesicle’ and ‘extracellular organelle’. Among the 10 most
significantly upregulated DEGs, SPP1, MMP11, COL1A1, COL4A1, COL4A2
and COL10A1 are able to be secreted to the extracellular space
(40,41). These results indicated enhanced
communication between CCA and the tumor microenvironment. Thus, the
tumor microenvironment may be a crucial component governing tumor
development and progression and, by targeting it, may be a new
direction for CCA treatment (42).
Following KEGG pathway analysis, 22 pathways were
identified according to the P-value cut-off. There were five terms,
in accordance with the results published by Huang et al
(31). Certain pathways, including
‘alcoholism’ (hsa05034), ‘viral carcinogenesis’ (hsa05203) and
‘colorectal cancer’ (hsa05210) have a close association with CCA.
Additionally, heavy alcohol use, hepatitis B virus infection,
hepatitis C virus infection and inflammatory bowel disease are
possible risk factors for CCA (2).
Furthermore, a PPI network was established using the NetworkAnalyst
visualization tool. PPI network analysis revealed the significant
hub proteins, HDAC1, CAND1, UBD, EGR1 and GSK3B. HDACs serve an
oncogenic role in the occurrence and development of ICC. Abnormal
expression of HDAC1 is significantly associated with lymph node
metastasis, high stage carcinoma, vascular invasion and poor
prognosis of ICC (43).
It was hypothesized that analyzing multiple datasets
may increase the accuracy of the findings, compared with
conclusions raised from analyzing a single datasets. In addition,
identifying cell markers that are overexpressed in the majority of
CCAs may lead to novel drug targets with high specificity. The
present results may help to identify combinations of treatments to
target various signaling pathways that are altered in CCA. However,
certain limitations remain with the present study. Firstly, DEGs
were identified via integrated analysis of microarray data.
Although differential expression of several of these genes was
confirmed by previous biological or clinical research, further
in vitro and in vivo validation of these results is
required. Secondly, the DEGs identified only represent relative
expression levels compared with CCA and non-tumor tissues. Gene
mutation and methylation, which are also important for CCA
tumorigenesis and progression, were not included in the present
analysis. Thirdly, the integrative analysis method used in the
present study is based on combining the effect sizes, although
there are a number of other algorithms used to identify DEGs,
including P-values and gene ranks (15). Different methods may increase the
heterogeneity between different published analyses of DEGs.
Additionally, the sample cases are much more than the controls (428
vs. 46), and this case-control ratio may be another limitation of
the present study.
In summary, the present study identified potential
novel markers in the pathogenesis of CCA. In addition, genes
consistently differing in expression in CCA were identified through
NetworkAnalyst tools. The 10 most significantly upregulated and
downregulated genes may serve as potential diagnostic biomarkers.
GO annotation and KEGG pathway analysis demonstrated that the
identified candidates have a strong association with CCA.
Furthermore, a number of novel CCA-associated genes were
identified. Further experimental validation is required to fully
understand the mechanism of these novel genes in CCA, and to
investigate any therapeutic and diagnostic potential these genes
may hold.
Acknowledgements
Not applicable.
Funding
The present study was supported by nursery grants
from the 175th Hospital of People's Liberation Army, Zhang Zhou,
China (grant no. 16Y006).
Availability of data and materials
The datasets used and/or analyzed during the current
study are available from the corresponding author on reasonable
request.
Authors' contributions
The authors' contributions were as follows: WZ,
conception and design, data collection, data analysis and
manuscript writing; LD, data collection and data analysis; JL,
conception and design and data analysis; SZ, conception and design
and final approval of manuscript. All authors read and approved the
final manuscript.
Ethics approval and consent to
participate
Not applicable.
Consent for publication
Not applicable.
Competing interests
The authors declare that they have no competing
interests.
References
|
1
|
de Groen PC, Gores GJ, LaRusso NF,
Gunderson LL and Nagorney DM: Biliary tract cancers. N Engl J Med.
341:1368–1378. 1999. View Article : Google Scholar : PubMed/NCBI
|
|
2
|
Tyson GL and El-Serag HB: Risk factors for
cholangiocarcinoma. Hepatology. 54:173–184. 2011. View Article : Google Scholar : PubMed/NCBI
|
|
3
|
Rizvi S and Gores GJ: Pathogenesis,
diagnosis, and management of cholangiocarcinoma. Gastroenterology.
145:1215–1229. 2013. View Article : Google Scholar : PubMed/NCBI
|
|
4
|
Saha SK, Zhu AX, Fuchs CS and Brooks GA:
Forty-year trends in cholangiocarcinoma incidence in the U.S.:
Intrahepatic disease on the rise. Oncologist. 21:594–599. 2016.
View Article : Google Scholar : PubMed/NCBI
|
|
5
|
Oliveira IS, Kilcoyne A, Everett JM,
Mino-Kenudson M, Harisinghani MG and Ganesan K: Cholangiocarcinoma:
Classification, diagnosis, staging, imaging features, and
management. Abdom Radiol (NY). 42:1637–1649. 2017. View Article : Google Scholar : PubMed/NCBI
|
|
6
|
Khuntikeo N, Chamadol N, Yongvanit P,
Loilome W, Namwat N, Sithithaworn P, Andrews RH, Petney TN,
Promthet S, Thinkhamrop K, et al: Cohort profile:
Cholangiocarcinoma screening and care program (CASCAP). BMC Cancer.
15:4592015. View Article : Google Scholar : PubMed/NCBI
|
|
7
|
Jusakul A, Cutcutache I, Yong CH, Lim JQ,
Huang MN, Padmanabhan N, Nellore V, Kongpetch S, Ng AWT, Ng LM, et
al: Whole-genome and epigenomic landscapes of etiologically
distinct subtypes of cholangiocarcinoma. Cancer Discov.
7:1116–1135. 2017. View Article : Google Scholar : PubMed/NCBI
|
|
8
|
Kayhanian H, Smyth EC and Braconi C:
Emerging molecular targets and therapy for cholangiocarcinoma.
World J Gastrointest Oncol. 9:268–280. 2017. View Article : Google Scholar : PubMed/NCBI
|
|
9
|
Sia D, Hoshida Y, Villanueva A, Roayaie S,
Ferrer J, Tabak B, Peix J, Sole M, Tovar V, Alsinet C, et al:
Integrative molecular analysis of intrahepatic cholangiocarcinoma
reveals 2 classes that have different outcomes. Gastroenterology.
144:829–840. 2013. View Article : Google Scholar : PubMed/NCBI
|
|
10
|
Seok JY, Na DC, Woo HG, Roncalli M, Kwon
SM, Yoo JE, Ahn EY, Kim GI, Choi JS, Kim YB and Park YN: A fibrous
stromal component in hepatocellular carcinoma reveals a
cholangiocarcinoma-like gene expression trait and
epithelial-mesenchymal transition. Hepatology. 55:1776–1786. 2012.
View Article : Google Scholar : PubMed/NCBI
|
|
11
|
Murakami Y, Kubo S, Tamori A, Itami S,
Kawamura E, Iwaisako K, Ikeda K, Kawada N, Ochiya T and Taguchi YH:
Comprehensive analysis of transcriptome and metabolome analysis in
intrahepatic cholangiocarcinoma and hepatocellular carcinoma. Sci
Rep. 5:162942015. View Article : Google Scholar : PubMed/NCBI
|
|
12
|
Andersen JB, Spee B, Blechacz BR, Avital
I, Komuta M, Barbour A, Conner EA, Gillen MC, Roskams T, Roberts
LR, et al: Genomic and genetic characterization of
cholangiocarcinoma identifies therapeutic targets for tyrosine
kinase inhibitors. Gastroenterology. 142:1021–1031.e15. 2012.
View Article : Google Scholar : PubMed/NCBI
|
|
13
|
Oishi N, Kumar MR, Roessler S, Ji J,
Forgues M, Budhu A, Zhao X, Andersen JB, Ye QH, Jia HL, et al:
Transcriptomic profiling reveals hepatic stem-like gene signatures
and interplay of miR-200c and epithelial-mesenchymal transition in
intrahepatic cholangiocarcinoma. Hepatology. 56:1792–1803. 2012.
View Article : Google Scholar : PubMed/NCBI
|
|
14
|
Seol MA, Chu IS, Lee MJ, Yu GR, Cui XD,
Cho BH, Ahn EK, Leem SH, Kim IH and Kim DG: Genome-wide expression
patterns associated with oncogenesis and sarcomatous
transdifferentation of cholangiocarcinoma. BMC Cancer. 11:782011.
View Article : Google Scholar : PubMed/NCBI
|
|
15
|
Sulpice L, Desille M, Turlin B, Fautrel A,
Boudjema K, Clément B and Coulouarn C: Gene expression profiling of
the tumor microenvironment in human intrahepatic
cholangiocarcinoma. Genom Data. 7:229–232. 2016. View Article : Google Scholar : PubMed/NCBI
|
|
16
|
Xia J, Gill EE and Hancock RE:
NetworkAnalyst for statistical, visual and network-based
meta-analysis of gene expression data. Nat Protoc. 10:823–844.
2015. View Article : Google Scholar : PubMed/NCBI
|
|
17
|
Xia J, Benner MJ and Hancock RE:
NetworkAnalyst-integrative approaches for protein-protein
interaction network analysis and visual exploration. Nucleic Acids
Res. 42(Web Server Issue): W167–W174. 2014. View Article : Google Scholar : PubMed/NCBI
|
|
18
|
Huang da W, Sherman BT and Lempicki RA:
Systematic and integrative analysis of large gene lists using DAVID
bioinformatics resources. Nat Protoc. 4:44–57. 2009. View Article : Google Scholar : PubMed/NCBI
|
|
19
|
Huang da W, Sherman BT and Lempicki RA:
Bioinformatics enrichment tools: Paths toward the comprehensive
functional analysis of large gene lists. Nucleic Acids Res.
37:1–13. 2009. View Article : Google Scholar : PubMed/NCBI
|
|
20
|
Breuer K, Foroushani AK, Laird MR, Chen C,
Sribnaia A, Lo R, Winsor GL, Hancock RE, Brinkman FS and Lynn DJ:
InnateDB: Systems biology of innate immunity and beyond-recent
updates and continuing curation. Nucleic Acids Res. 41(Database
Issue): D1228–D1233. 2013. View Article : Google Scholar : PubMed/NCBI
|
|
21
|
Orchard S, Kerrien S, Abbani S, Aranda B,
Bhate J, Bidwell S, Bridge A, Briganti L, Brinkman FS, Cesareni G,
et al: Protein interaction data curation: The International
Molecular Exchange (IMEx) consortium. Nat Methods. 9:345–350. 2012.
View Article : Google Scholar : PubMed/NCBI
|
|
22
|
Hermjakob H, Montecchi-Palazzi L,
Lewington C, Mudali S, Kerrien S, Orchard S, Vingron M, Roechert B,
Roepstorff P, Valencia A, et al: IntAct: An open source molecular
interaction database. Nucleic Acids Res. 32(Database Issue):
D452–D455. 2004. View Article : Google Scholar : PubMed/NCBI
|
|
23
|
Licata L, Briganti L, Peluso D, Perfetto
L, Iannuccelli M, Galeota E, Sacco F, Palma A, Nardozza AP,
Santonico E, et al: MINT, the molecular interaction database: 2012
update. Nucleic Acids Res. 40(Database Issue): D857–D861. 2012.
View Article : Google Scholar : PubMed/NCBI
|
|
24
|
Salwinski L, Miller CS, Smith AJ, Pettit
FK, Bowie JU and Eisenberg D: The database of interacting proteins:
2004 update. Nucleic Acids Res. 32(Database Issue): D449–D451.
2004. View Article : Google Scholar : PubMed/NCBI
|
|
25
|
Isserlin R, El-Badrawi RA and Bader GD:
The biomolecular interaction network database in PSI-MI 2.5.
Database (Oxford). 2011:baq0372011. View Article : Google Scholar : PubMed/NCBI
|
|
26
|
Chatr-Aryamontri A, Breitkreutz BJ,
Oughtred R, Boucher L, Heinicke S, Chen D, Stark C, Breitkreutz A,
Kolas N, O'Donnell L, et al: The BioGRID interaction database: 2015
update. Nucleic Acids Res. 43(Database Issue): D470–D478. 2015.
View Article : Google Scholar : PubMed/NCBI
|
|
27
|
Blechacz B, Komuta M, Roskams T and Gores
GJ: Clinical diagnosis and staging of cholangiocarcinoma. Nat Rev
Gastroenterol Hepatol. 8:512–522. 2011. View Article : Google Scholar : PubMed/NCBI
|
|
28
|
Hass HG, Nehls O, Jobst J, Frilling A,
Vogel U and Kaiser S: Identification of osteopontin as the most
consistently over-expressed gene in intrahepatic
cholangiocarcinoma: Detection by oligonucleotide microarray and
real-time PCR analysis. World J Gastroenterol. 14:2501–2510. 2008.
View Article : Google Scholar : PubMed/NCBI
|
|
29
|
Sulpice L, Rayar M, Desille M, Turlin B,
Fautrel A, Boucher E, Llamas-Gutierrez F, Meunier B, Boudjema K,
Clément B and Coulouarn C: Molecular profiling of stroma identifies
osteopontin as an independent predictor of poor prognosis in
intrahepatic cholangiocarcinoma. Hepatology. 58:1992–2000. 2013.
View Article : Google Scholar : PubMed/NCBI
|
|
30
|
Tongtawee T, Kaewpitoon SJ, Loyd R,
Chanvitan S, Leelawat K, Praditpol N, Jujinda S and Kaewpitoon N:
High expression of matrix metalloproteinase-11 indicates poor
prognosis in human cholangiocarcinoma. Asian Pac J Cancer Prev.
16:3697–3701. 2015. View Article : Google Scholar : PubMed/NCBI
|
|
31
|
Huang QX, Cui JY, Ma H, Jia XM, Huang FL
and Jiang LX: Screening of potential biomarkers for
cholangiocarcinoma by integrated analysis of microarray data sets.
Cancer Gene Ther. 23:48–53. 2016. View Article : Google Scholar : PubMed/NCBI
|
|
32
|
Sawanyawisuth K, Wongkham C, Araki N, Zhao
Q, Riggins GJ and Wongkham S: Serial analysis of gene expression
reveals promising therapeutic targets for liver fluke-associated
cholangiocarcinoma. Asian Pac J Cancer Prev. 13 Suppl:S89–S93.
2012.
|
|
33
|
Batmunkh E, Tátrai P, Szabó E, Lódi C,
Holczbauer A, Páska C, Kupcsulik P, Kiss A, Schaff Z and Kovalszky
I: Comparison of the expression of agrin, a basement membrane
heparan sulfate proteoglycan, in cholangiocarcinoma and
hepatocellular carcinoma. Hum Pathol. 38:1508–1515. 2007.
View Article : Google Scholar : PubMed/NCBI
|
|
34
|
Wang H, Jiang S, Zhang Y, Pan K, Xia J and
Chen M: High expression of thymosin beta 10 predicts poor prognosis
for hepatocellular carcinoma after hepatectomy. World J Surg Oncol.
12:2262014. View Article : Google Scholar : PubMed/NCBI
|
|
35
|
Zhang X, Ren D, Guo L, Wang L, Wu S, Lin
C, Ye L, Zhu J, Li J, Song L, et al: Thymosin beta 10 is a key
regulator of tumorigenesis and metastasis and a novel serum marker
in breast cancer. Breast Cancer Res. 19:152017. View Article : Google Scholar : PubMed/NCBI
|
|
36
|
Mattu S, Fornari F, Quagliata L, Perra A,
Angioni MM, Petrelli A, Menegon S, Morandi A, Chiarugi P,
Ledda-Columbano GM, et al: The metabolic gene HAO2 is downregulated
in hepatocellular carcinoma and predicts metastasis and poor
survival. J Hepatol. 64:891–898. 2016. View Article : Google Scholar : PubMed/NCBI
|
|
37
|
Fan K, Li N, Qi J, Yin P, Zhao C, Wang L,
Li Z and Zha X: Wnt/β-catenin signaling induces the transcription
of cystathionine-γ-lyase, a stimulator of tumor in colon cancer.
Cell Signal. 26:2801–2808. 2014. View Article : Google Scholar : PubMed/NCBI
|
|
38
|
You J, Shi X, Liang H, Ye J, Wang L, Han
H, Fang H, Kang W and Wang T: Cystathionine-γ-lyase promotes
process of breast cancer in association with STAT3 signaling
pathway. Oncotarget. 8:65677–65686. 2017. View Article : Google Scholar : PubMed/NCBI
|
|
39
|
Nakagawa S, Okabe H, Sakamoto Y, Hayashi
H, Hashimoto D, Yokoyama N, Sakamoto K, Kuroki H, Mima K, Nitta H,
et al: Enhancer of zeste homolog 2 (EZH2) promotes progression of
cholangiocarcinoma cells by regulating cell cycle and apoptosis.
Ann Surg Oncol. 20 Suppl 3:S667–S675. 2013. View Article : Google Scholar : PubMed/NCBI
|
|
40
|
Giussani M, Merlino G, Cappelletti V,
Tagliabue E and Daidone MG: Tumor-extracellular matrix
interactions: Identification of tools associated with breast cancer
progression. Semin Cancer Biol. 35:3–10. 2015. View Article : Google Scholar : PubMed/NCBI
|
|
41
|
Kuo DS, Labelle-Dumais C and Gould DB:
COL4A1 and COL4A2 mutations and disease: Insights into pathogenic
mechanisms and potential therapeutic targets. Hum Mol Genet.
21:R97–R110. 2012. View Article : Google Scholar : PubMed/NCBI
|
|
42
|
Razumilava N and Gores GJ:
Cholangiocarcinoma. Lancet. 383:2168–2179. 2014. View Article : Google Scholar : PubMed/NCBI
|
|
43
|
Morine Y, Shimada M, Iwahashi S,
Utsunomiya T, Imura S, Ikemoto T, Mori H, Hanaoka J and Miyake H:
Role of histone deacetylase expression in intrahepatic
cholangiocarcinoma. Surgery. 151:412–419. 2012. View Article : Google Scholar : PubMed/NCBI
|