Introduction
Lung cancer is one of the highly malignant tumors
and a serious threat to human health. The incidence and mortality
rates of lung cancer are the highest of any type of cancer,
particularly in China (1). Despite
the advances and developments in the treatments for lung cancer,
the 5-year survival rate of patients with lung cancer remains only
16%, and the 5-year recurrence rate is 50% (2). Based on differences in presentation
and behavior, primary lung cancer is divided into two main
histological subtypes: Small cell lung cancer (SCLC) and non-SCLC
(NSCLC) (3). Although SCLC only
accounts for 15% of lung cancers, it is an aggressive high-grade
neuroendocrine tumor associated with early and widespread
metastasis and development of resistance to chemotherapy, which
contribute to the extremely poor prognosis of patients with the
disease (4,5). Previously, several common genetic
alterations in SCLC have been identified, including functional
inactivation of the tumor-suppressor genes tumor protein p53 and RB
transcriptional corepressor 1, as well as amplification of genes
encoding Myc family members, enhancer of zeste homolog 2 (EZH2)
involved in chromatin remodeling, epidermal growth factor receptor
and B-cell lymphoma 2 receptor tyrosine kinases, their downstream
effectors, and Notch family proteins (4,6–10).
These may provide opportunities for classification and therapeutic
intervention, including poly (ADP-ribose) polymerase (PARP)
inhibitors, EZH2 inhibition and Wee1 inhibitor (11–15).
Therefore, more effort needs to be invested towards the
investigation and understanding of molecular mechanisms in
development and progression of SCLC, which are crucial for the
development of more effective diagnostic and therapeutic
strategies.
Recently, the gene expression profile chip, a
high-throughput and effective technique, has been widely used in a
variety of disease research fields to reveal the association
between disease and genes, and provide the valuable clues for the
pathogenesis of the diseases, including lung cancer (16–18).
Kikuchi et al (19)
identified several genes, which may be used for the prediction of
lymph-node metastasis and sensitivity to anti-cancer drugs.
Yanaihara et al (20)
identified that high hsa-mir-155 and low hsa-let-7a-2 expression
levels correlated with poor survival, which indicated that micro
(mi)RNA expression profiles are diagnostic and prognostic markers
of lung cancer. Furthermore lung adenocarcinoma has been defined to
represent distinct molecular subclasses according to the miRNA
expression profiling data (21).
Although the cellular and molecular genetic alterations underlying
SCLC have become better understood, the molecular mechanisms of
SCLC have yet to be fully elucidated.
In order to investigate the molecular mechanisms of
SCLC, the present study re-analyzed the gene expression profiles of
GSE6044 and GSE11969 (22,23) and identified the differentially
expressed genes (DEGs) between normal lung tissue and SCLC.
Subsequently, comprehensive bioinformatics analysis was used for
biological process (BP) annotation and biological pathway
enrichment analysis. The protein-protein interaction (PPI) network
of common DEGs was constructed and analysis performed on the hub
genes and modules of the PPI network. Therefore, the findings of
the present study may provide further understanding of SCLC
development and lead to an improved diagnosis of SCLC.
Materials and methods
Expression profile microarray
Data was downloaded from the Gene Expression Omnibus
(GEO), a public repository for data storage (www.ncbi.nlm.nih.gov/geo) (24). A total of 2 mRNA expression
datasets of SCLC, GSE6044 and GSE11969, were included in the
present study (22,23). The dataset GSE6044 based on GPL201
(HG-Focus) Affymetrix Human HG-Focus Target Array platform
(Affymetrix; Thermo Fisher Scientific, Inc., Waltham, MA, USA),
included 5 normal lung and 9 SCLC samples; the dataset GSE11969
also included 5 normal lung and 9 SCLC samples based on the
platform of GPL7015 Agilent Homo sapiens 21.6K custom array
(Agilent Technologies, Inc., Santa Clara, CA, USA).
Identification of DEGs
The DEGs between normal lung and SCLC samples were
screened by an interactive web tool, GEO2R (www.ncbi.nlm.nih.gov/geo/geo2r) (25). The adjusted P-value using the
Benjamini and Hochberg false discovery rate (FDR) method was
applied to correct for the occurrence of false positive results.
The adjusted P-value <0.05 and |logFC| >0.5 were set as the
cut-off criteria. The heat map of DEGs was generated using the
gplots package for R (http://cran.r-project.org/web/packages/gplots/;
version 3.4.3).
Gene ontology (GO) terms and kyoto
encyclopedia of genes and genomes (KEGG) pathway enrichment
analysis
The Database for Annotation, Visualization and
Integrated Discovery (DAVID, david.abcc.ncifcrf.gov) is an online program that
provides a comprehensive set of functional annotation tools for
researchers to understand the biological meaning behind numerous
genes (26). GO, including
molecular function, biological processes (BP) and cellular
components and KEGG pathway enrichment analyses were performed for
identified DEGs using the DAVID database (version 6.7). FDR
<0.05 was used as a cutoff for significance.
Construction of PPI, hub gene
identification and module analysis of the PPI network
The Search Tool for the Retrieval of Interacting
Genes (STRING) database (version 10.5; http://string-db.org/), is an online tool designed to
explore and analyze PPI information. To evaluate the interactive
associations among common DEGs, the common DEGs were mapped using
STRING, and interactions with a combined score >0.4 were
selected. Then, the PPI network was constructed and visualized
using Cytoscape software (version 3.5.1; www.cytoscape.org). In order to identify key elements
in BP, the hub genes in the network defined as possessing a
connective degree >10, were identified using CentiScaPe v2.0
plugin for Cytoscape (version 3.5.1; www.cytoscape.org). The topological properties of the
PPI network, including average clustering coefficients, topological
coefficients and shortest path lengths, were investigated using a
Network Analyzer (version 2.7; med.bioinf.mpi-inf.mpg.de/netanalyzer/download.php)
and Cytoscape (version 3.5.1; www.cytoscape.org) plugin app (27). Finally, module analysis was carried
out by the plug-in Molecular Complex Detection (MCODE; version
1.5.1) with cut-off criterion: MCODE score >4 and number
>5.
Validation of the expression of hub
genes in oncomine database
Oncomine (www.oncomine.org; Ion Torrent; Thermo Fisher
Scientific, Inc.) is an online cancer microarray database to
facilitate the discovery of genome-wide expression analyses
(28). To validate the expression
level of hub genes in SCLC, Garber et al (29) and Bhattacharjee et al
(21) lung cancer gene expression
data in the Oncomine database were searched for expression levels
of hub genes in the network with a P-value <0.05. Thresholds for
fold-change and gene rank were set to ‘all’, whereas the data type
was restricted to mRNA. Statistical significance was provided by
Oncomine in the form of a Student's t-test.
Results
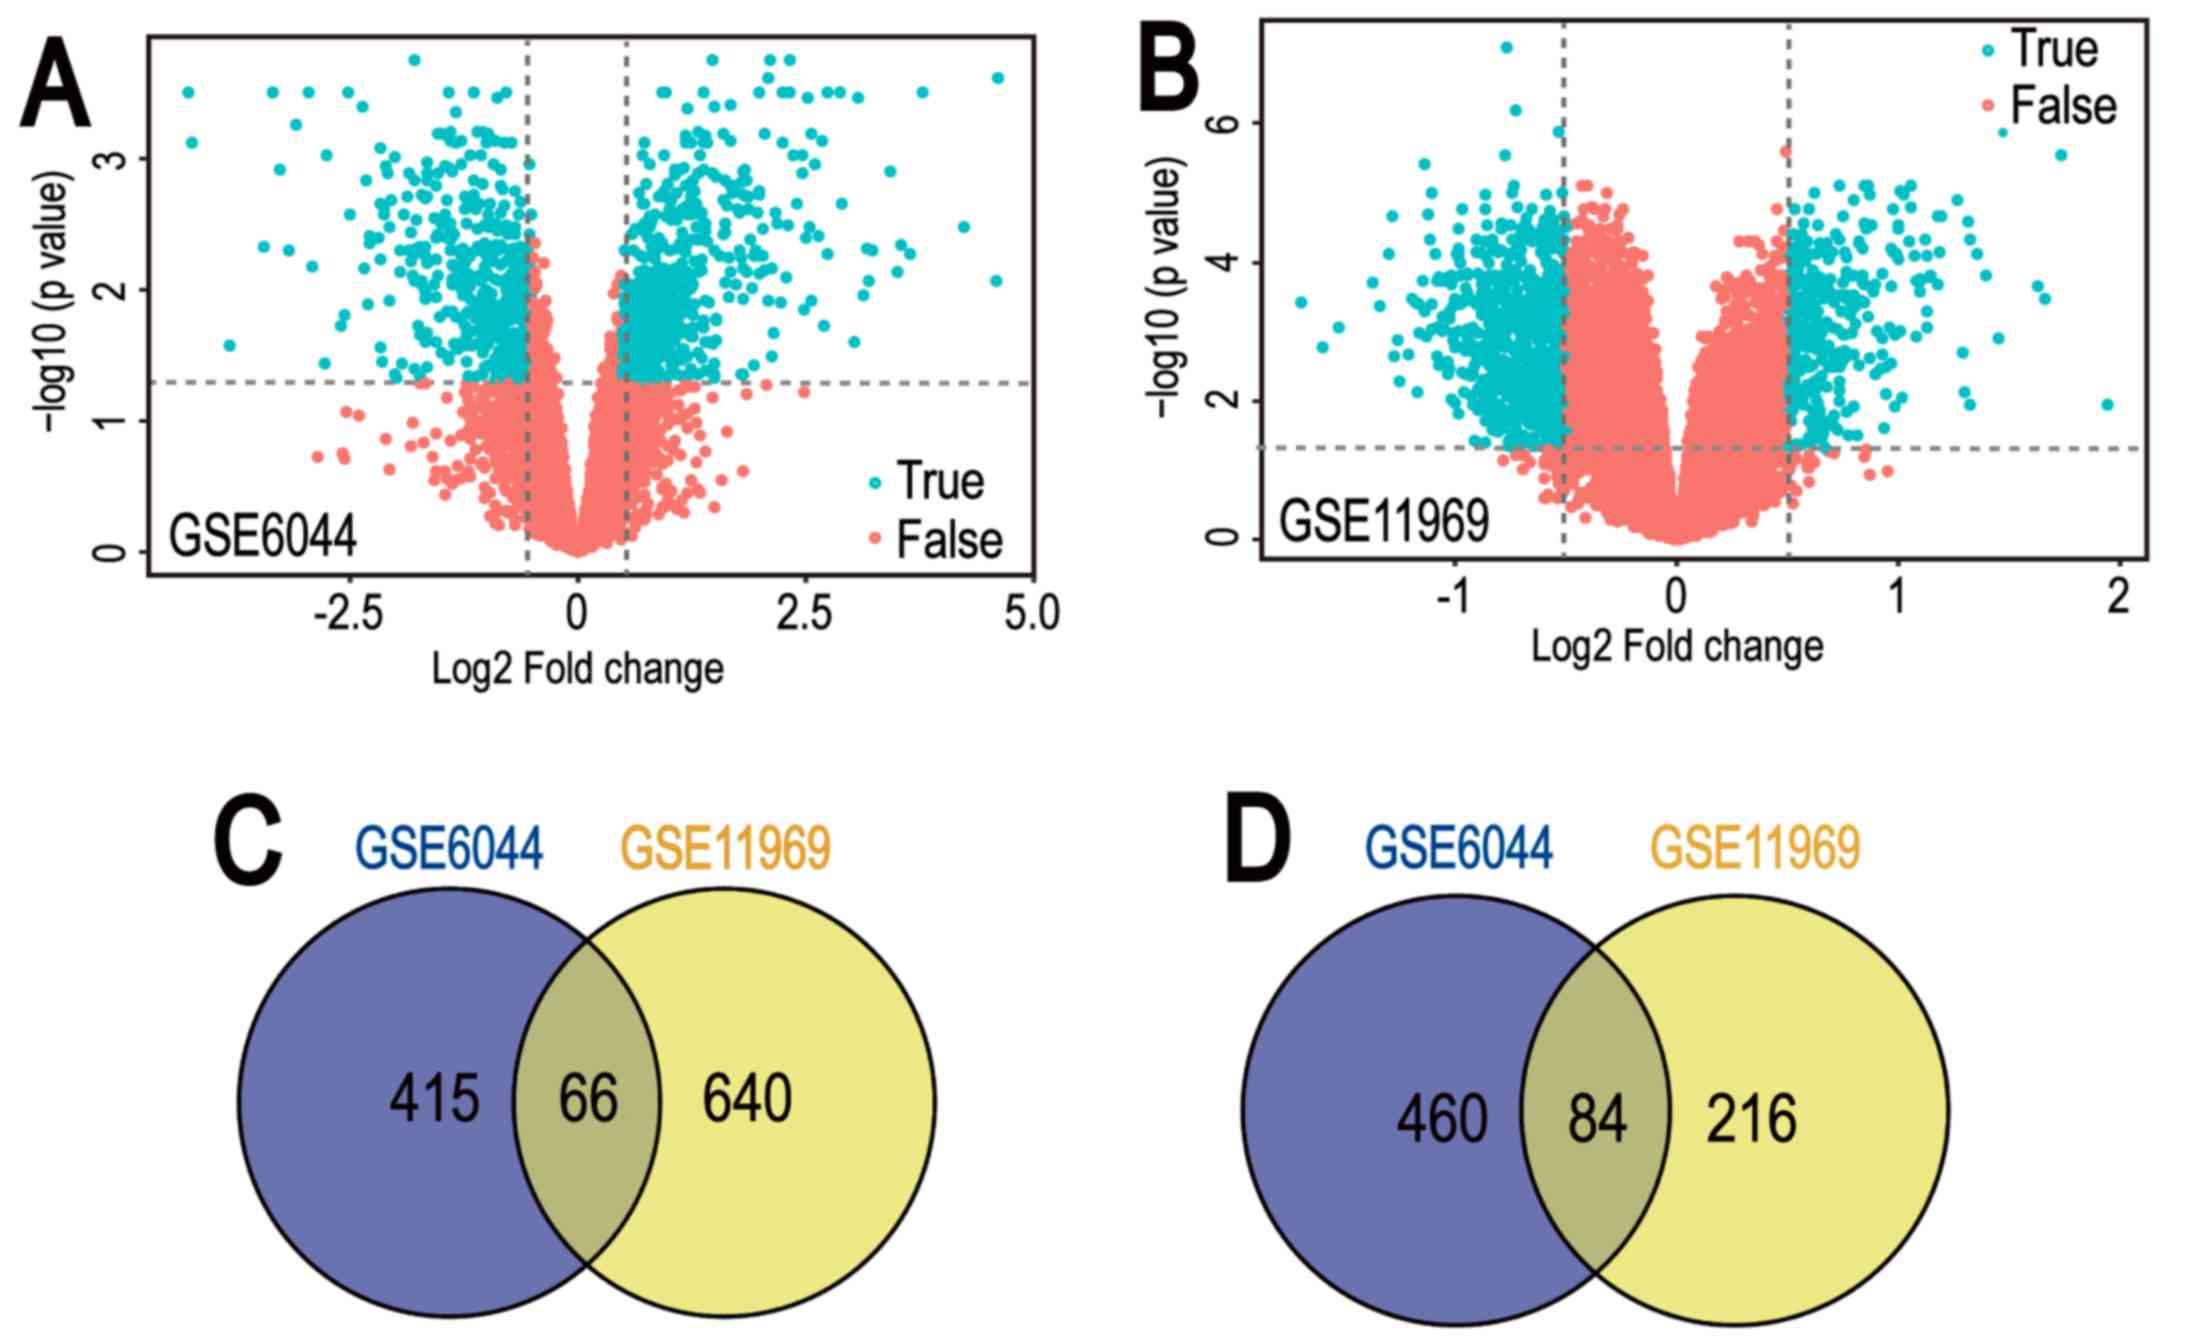
Identification of DEGs
Gene expression datasets GSE6044 and GSE11969 were
downloaded from GEO datasets. GEO2R was applied to screen DEGs
between normal lung tissue and SCLC samples. A total of 1,025 and
1,006 DEGs were identified from GSE6044 and GSE11969 datasets,
respectively (Fig. 1A and B).
Among them, 481 downregulated genes and 544 upregulated genes in
the GSE6044 dataset, and 706 downregulated genes and 300
upregulated genes in the GSE11969 dataset, were identified. In
addition, 150 common DEGs were obtained (Tables I and II), comprising 66 co-downregulated genes
and 84 co-upregulated genes (Fig. 1C
and D).
 | Table I.The 150 common DEGs in the GSE6044
dataset. |
Table I.
The 150 common DEGs in the GSE6044
dataset.
| A, Downregulated
DEGs |
|---|
|
|---|
| Gene symbol | Log
fold-change | Adjusted
P-value |
|---|
| CYP4B1 | −4.26 |
3.14×10⁻⁴ |
| CX3CL1 | −4.23 |
7.58×10⁻⁴ |
| FBLN5 | −3.26 |
1.22×10⁻³ |
| SCGB1A1 | −3.16 |
5.10×10⁻³ |
| AQP3 | −2.76 |
3.70×10⁻² |
| ADH1C | −2.75 |
9.50×10⁻⁴ |
| CSTA | −2.60 |
1.87×10⁻² |
| ALDH1A1 | −2.49 |
2.66×10⁻³ |
| CFH | −2.32 |
1.49×10⁻³ |
| CLU | −2.08 |
1.28×10⁻³ |
| ADH1B | −2.07 |
3.39×10⁻³ |
| PTGDS | −1.94 |
5.01×10⁻³ |
| PROS1 | −1.87 |
1.93×10⁻³ |
| TGFBR3 | −1.80 |
7.75×10⁻³ |
| ANXA11 | −1.73 |
4.77×10⁻³ |
| LAMB3 | −1.73 |
4.78×10⁻³ |
| DMBT1 | −1.72 |
4.59×10⁻² |
| F13A1 | −1.72 |
2.19×10⁻² |
| FLRT3 | −1.72 |
4.58×10⁻² |
| RRAD | −1.70 |
1.88×10⁻³ |
| TACSTD2 | −1.67 |
2.54×10⁻² |
| C3 | −1.66 |
1.03×10⁻² |
| PLK2 | −1.66 |
5.62×10⁻³ |
| EPAS1 | −1.65 |
6.31×10⁻³ |
| PZP | −1.57 |
2.83×10⁻³ |
| CXCL1 | −1.55 |
4.10×10⁻³ |
| CAST | −1.49 |
3.13×10⁻³ |
| ANXA1 | −1.42 |
3.49×10⁻² |
| RNASE4 | −1.39 |
7.39×10⁻⁴ |
| CTSH | −1.33 |
7.49×10⁻⁴ |
| CD9 | −1.31 |
2.85×10⁻² |
| ADRB2 | −1.30 |
2.62×10⁻² |
| PTGER4 | −1.26 |
1.13×10⁻² |
| FOLR1 | −1.22 |
5.56×10⁻³ |
| BAG3 | −1.21 |
1.50×10⁻² |
| CAPN2 | −1.21 |
5.21×10⁻³ |
| CD81 | −1.21 |
2.21×10⁻² |
| SERPINA1 | −1.21 |
2.26×10⁻² |
| VAMP8 | −1.21 |
1.51×10⁻² |
| GPX3 | −1.19 |
1.45×10⁻² |
| MYO5C | −1.19 |
1.46×10⁻² |
| PCSK5 | −1.19 |
2.10×10⁻³ |
| HLA-E | −1.18 |
5.52×10⁻³ |
| FBLN1 | −1.12 |
1.24×10⁻² |
| A2M | −1.11 |
1.67×10⁻² |
| TGM2 | −1.07 |
7.86×10⁻³ |
| TGFBR2 | −1.06 |
1.98×10⁻² |
| PXMP2 | 0.50 |
4.38×10⁻² |
| NOL4 | 0.51 |
4.98×10⁻³ |
| MKI67 | 0.52 |
4.11×10⁻² |
| LYN | −1.04 |
3.06×10⁻² |
| C6 | −1.02 |
4.37×10⁻³ |
| HNMT | −1.01 |
4.43×10⁻³ |
| PRNP | −1.01 |
2.72×10⁻² |
| CCND1 | −0.98 |
1.31×10⁻² |
| TCF21 | −0.96 |
6.18×10⁻³ |
| CST3 | −0.95 |
2.20×10⁻³ |
| CNN2 | −0.95 |
1.07×10⁻² |
| NEDD9 | −0.91 |
1.29×10⁻² |
| IL4R | −0.91 |
3.37×10⁻² |
| THBD | −0.90 |
4.91×10⁻² |
| EPHA2 | −0.87 |
2.92×10⁻² |
| ZFP36L2 | −0.86 |
4.88×10⁻² |
| SLC16A5 | −0.83 |
2.59×10⁻³ |
| STAT6 | −0.83 |
2.09×10⁻² |
| SP110 | −0.69 |
3.10×10⁻² |
| TLR2 | −0.63 |
4.12×10⁻² |
| CFTR | −0.61 |
2.77×10⁻² |
| VAV1 | −0.53 |
3.77×10⁻³ |
|
| B, Upregulated
DEGs |
|
| Gene
symbol | Log
fold-change | Adjusted
P-value |
|
| KCNH2 | 0.52 |
2.49×10⁻² |
| RAD54L | 0.52 |
2.49×10⁻² |
| CBX5 | 0.59 |
1.01×10⁻² |
| DDC | 0.61 |
3.27×10⁻² |
| RECQL4 | 0.62 |
5.10×10⁻³ |
| CHEK1 | 0.64 |
4.79×10⁻² |
| ENC1 | 0.64 |
2.00×10⁻² |
| SOX11 | 0.67 |
1.92×10⁻² |
| BIRC5 | 0.69 |
5.60×10⁻³ |
| CKS1B | 0.69 |
1.87×10⁻² |
| GNG4 | 0.70 |
2.24×10⁻² |
| EZH2 | 0.71 |
9.45×10⁻⁴ |
| FANCA | 0.71 |
9.45×10⁻⁴ |
| STMN1 | 0.71 |
9.45×10⁻⁴ |
| EXO1 | 0.71 |
7.39×10⁻³ |
| GRP | 0.71 |
7.39×10⁻³ |
| CDKN3 | 0.73 |
7.18×10⁻³ |
| FKBP3 | 0.78 |
7.93×10⁻³ |
| NRTN | 0.79 |
2.86×10⁻² |
| ASCL1 | 0.81 |
8.66×10⁻³ |
| CENPF | 0.81 |
5.56×10⁻³ |
| PCSK1 | 0.83 |
5.62×10⁻³ |
| MYBL2 | 0.86 |
2.27×10⁻² |
| TRIM36 | 0.86 |
2.26×10⁻² |
| MSH6 | 0.86 |
5.21×10⁻³ |
| TPD52 | 0.89 |
1.64×10⁻² |
| CDC7 | 0.90 |
1.98×10⁻³ |
| PSIP1 | 0.90 |
1.98×10⁻³ |
| PRDX2 | 0.91 |
2.19×10⁻² |
| FZD3 | 0.91 |
4.66×10⁻³ |
| HDAC2 | 0.94 |
3.14×10⁻⁴ |
| MCM6 | 0.94 |
3.14×10⁻⁴ |
| MEST | 0.94 |
3.14×10⁻⁴ |
| SOX4 | 0.94 |
3.14×10⁻⁴ |
| TOP2A | 0.94 |
3.14×10⁻⁴ |
| TYMS | 0.94 |
3.14×10⁻⁴ |
| CDC20 | 0.95 |
1.88×10⁻³ |
| LHX2 | 0.97 |
2.16×10⁻² |
| HPRT1 | 0.99 |
9.71×10⁻³ |
| PARP1 | 0.99 |
9.71×10⁻³ |
| CDC6 | 1.02 |
2.97×10⁻³ |
| PCNA | 1.08 |
1.84×10⁻³ |
| NELL1 | 1.09 |
1.92×10⁻² |
| SHMT2 | 1.11 |
9.89×10⁻³ |
| FANCG | 1.19 |
1.62×10⁻³ |
| TTK | 1.19 |
1.62×10⁻³ |
| BUB1 | 1.20 |
2.72×10⁻³ |
| PAFAH1B3 | 1.23 |
2.62×10⁻³ |
| SPAG5 | 1.25 |
4.19×10⁻³ |
| CELSR3 | 1.26 |
2.51×10⁻³ |
| ITGB3BP | 1.27 |
1.56×10⁻² |
| DTYMK | 1.29 |
1.77×10⁻³ |
| DLK1 | 1.31 |
3.32×10⁻³ |
| DEK | 1.33 |
6.17×10⁻⁴ |
| RFC5 | 1.39 |
1.21×10⁻³ |
| KIF11 | 1.41 |
3.53×10⁻³ |
| NEK2 | 1.41 |
3.09×10⁻³ |
| UNG | 1.48 |
1.28×10⁻³ |
| MCM3 | 1.52 |
1.39×10⁻³ |
| CAMK2B | 1.53 |
2.43×10⁻² |
| TIMELESS | 1.60 |
2.07×10⁻³ |
| USP1 | 1.60 |
6.35×10⁻⁴ |
| CCNB2 | 1.61 |
3.13×10⁻³ |
| FBXO5 | 1.62 |
1.46×10⁻³ |
| ZWINT | 1.67 |
7.39×10⁻⁴ |
| GMNN | 1.79 |
1.52×10⁻³ |
| COCH | 1.83 |
1.45×10⁻³ |
| PTTG1 | 1.85 |
7.46×10⁻³ |
| MCM2 | 1.90 |
4.17×10⁻³ |
| MAD2L1 | 1.98 |
2.59×10⁻³ |
| CCNE2 | 1.99 |
7.62×10⁻³ |
| RACGAP1 | 2.00 |
1.77×10⁻³ |
| CHGB | 2.04 |
3.42×10⁻³ |
| ASNS | 2.16 |
2.61×10⁻³ |
| RRM2 | 2.40 |
2.24×10⁻³ |
| RFC4 | 2.52 |
3.41×10⁻⁴ |
| CKS2 | 2.60 |
1.09×10⁻³ |
| RBP1 | 2.75 |
5.41×10⁻³ |
| UCHL1 | 3.08 |
3.37×10⁻⁴ |
| ISL1 | 3.17 |
4.91×10⁻³ |
| INSM1 | 3.65 |
5.28×10⁻³ |
| Table II.The 150 common DEGs in the GSE11969
dataset. |
Table II.
The 150 common DEGs in the GSE11969
dataset.
| A, Downregulated
DEGs |
|---|
|
|---|
| Gene symbol | Log
fold-change | Adjusted
P-value |
|---|
| TGFBR2 | −1.19 |
3.30×10⁻⁴ |
| CFTR | −1.16 |
1.03×10⁻³ |
| CXCL1 | −1.14 |
5.16×10⁻⁴ |
| TGM2 | −1.11 |
4.73×10⁻⁵ |
| THBD | −1.11 |
4.73×10⁻⁵ |
| EPAS1 | −1.10 |
4.13×10⁻⁴ |
| AQP3 | −1.10 |
1.00×10⁻⁵ |
| CD9 | −1.07 |
3.03×10⁻³ |
| ALDH1A1 | −1.03 |
4.22×10⁻³ |
| RRAD | −1.01 |
1.52×10⁻⁴ |
| NEDD9 | −0.99 |
3.32×10⁻⁴ |
| CX3CL1 | −0.98 |
6.32×10⁻⁵ |
| ANXA1 | −0.97 |
4.15×10⁻⁴ |
| CNN2 | −0.95 |
3.65×10⁻⁴ |
| SLC16A5 | −0.95 |
1.53×10⁻⁴ |
| LAMB3 | −0.94 |
2.82×10⁻⁴ |
| PROS1 | −0.93 |
1.49×10⁻³ |
| FBLN1 | −0.92 |
8.81×10⁻⁴ |
| SP110 | −0.89 |
1.36×10⁻² |
| TGFBR3 | −0.88 |
7.00×10⁻⁵ |
| RNASE4 | −0.87 |
1.76×10⁻⁴ |
| DMBT1 | −0.86 |
6.02×10⁻³ |
| CSTA | −0.85 |
5.07×10⁻³ |
| GPX3 | −0.85 |
1.10×10⁻³ |
| CTSH | −0.85 |
3.15×10⁻³ |
| PTGER4 | −0.85 |
3.15×10⁻³ |
| VAV1 | −0.84 |
8.80×10⁻³ |
| TCF21 | −0.83 |
4.99×10⁻⁴ |
| F13A1 | −0.83 |
1.22×10⁻³ |
| TACSTD2 | −0.83 |
5.82×10⁻⁴ |
| CST3 | −0.83 |
2.69×10⁻² |
| STAT6 | −0.83 |
1.02×10⁻² |
| ADH1B | −0.81 |
3.64×10⁻³ |
| ZFP36L2 | −0.81 |
6.86×10⁻⁴ |
| PZP | −0.81 |
5.75×10⁻³ |
| C3 | −0.80 |
2.70×10⁻² |
| CLU | −0.76 |
4.60×10⁻² |
| CYP4B1 | −0.75 |
3.74×10⁻³ |
| SCGB1A1 | −0.75 |
5.88×10⁻³ |
| FLRT3 | −0.74 |
3.15×10⁻² |
| PCSK5 | −0.74 |
2.91×10⁻³ |
| CFH | −0.72 |
2.45×10⁻² |
| LYN | −0.72 |
1.19×10⁻² |
| ADRB2 | −0.71 |
6.46×10⁻⁵ |
| HLA-E | −0.71 |
9.33×10⁻³ |
| CAPN2 | −0.70 |
8.30×10⁻³ |
| BAG3 | −0.69 |
1.44×10⁻³ |
| TLR2 | −0.69 |
1.15×10⁻³ |
| FBLN5 | −0.69 |
3.74×10⁻⁴ |
| A2M | −0.66 |
2.23×10⁻² |
| C6 | −0.66 |
1.32×10⁻⁴ |
| FOLR1 | −0.65 |
9.53×10⁻⁴ |
| PLK2 | −0.65 |
1.92×10⁻⁴ |
| HNMT | −0.63 |
1.23×10⁻² |
| MYO5C | −0.61 |
1.28×10⁻² |
| CAST | −0.61 |
1.05×10⁻² |
| PTGDS | −0.61 |
4.53×10⁻³ |
| ANXA11 | −0.59 |
2.59×10⁻² |
| CCND1 | −0.58 |
3.88×10⁻⁵ |
| EPHA2 | −0.58 |
3.88×10⁻⁵ |
| SERPINA1 | −0.58 |
5.84×10⁻⁴ |
| PRNP | −0.57 |
4.65×10⁻² |
| VAMP8 | −0.56 |
5.03×10⁻³ |
| ADH1C | −0.54 |
1.74×10⁻³ |
| CD81 | −0.52 |
3.13×10⁻³ |
| IL4R | −0.51 |
3.98×10⁻⁴ |
|
| B, Upregulated
DEGs |
|
| Gene
symbol | Log
fold-change | Adjusted
P-value |
|
| CCNB2 | 0.50 |
1.59×10⁻⁴ |
| DDC | 0.50 |
1.59×10⁻⁴ |
| HPRT1 | 0.50 |
1.59×10⁻⁴ |
| CDC20 | 0.50 |
3.39×10⁻⁴ |
| PARP1 | 0.51 |
3.92×10⁻³ |
| FANCG | 0.51 |
3.74×10⁻⁴ |
| PSIP1 | 0.51 |
3.74×10⁻⁴ |
| ENC1 | 0.51 |
4.43×10⁻² |
| DEK | 0.52 |
2.91×10⁻³ |
| FZD3 | 0.52 |
6.44×10⁻³ |
| ZWINT | 0.52 |
2.34×10⁻⁴ |
| UNG | 0.52 |
3.02×10⁻⁴ |
| CDC7 | 0.53 |
3.98×10⁻⁵ |
| MCM3 | 0.53 |
8.82×10⁻³ |
| CHEK1 | 0.53 |
5.88×10⁻³ |
| NRTN | 0.53 |
1.43×10⁻³ |
| RBP1 | 0.53 |
5.99×10⁻⁴ |
| MSH6 | 0.53 |
2.16×10⁻⁴ |
| DTYMK | 0.54 |
6.60×10⁻⁵ |
| MCM2 | 0.55 |
4.74×10⁻⁴ |
| CHGB | 0.56 |
3.30×10⁻⁴ |
| EXO1 | 0.56 |
3.30×10⁻⁴ |
| CELSR3 | 0.56 |
8.00×10⁻⁴ |
| CDKN3 | 0.56 |
7.01×10⁻³ |
| SHMT2 | 0.56 |
1.85×10⁻⁴ |
| TRIM36 | 0.56 |
1.58×10⁻³ |
| BUB1 | 0.56 |
1.23×10⁻³ |
| CDC6 | 0.56 |
4.94×10⁻⁵ |
| USP1 | 0.57 |
5.25×10⁻⁴ |
| PXMP2 | 0.57 |
3.87×10⁻⁵ |
| RACGAP1 | 0.57 |
3.87×10⁻⁵ |
| FKBP3 | 0.57 |
1.01×10⁻³ |
| MAD2L1 | 0.57 |
1.01×10⁻³ |
| DLK1 | 0.58 |
1.17×10⁻² |
| HDAC2 | 0.58 |
9.39×10⁻⁵ |
| ASCL1 | 0.60 |
3.29×10⁻³ |
| SOX4 | 0.60 |
1.89×10⁻² |
| COCH | 0.60 |
4.20×10⁻⁴ |
| PRDX2 | 0.61 |
7.76×10⁻⁵ |
| FANCA | 0.62 |
4.21×10⁻⁴ |
| RFC5 | 0.62 |
1.00×10⁻⁵ |
| ITGB3BP | 0.63 |
1.14×10⁻³ |
| LHX2 | 0.64 |
8.68×10⁻⁴ |
| MCM6 | 0.64 |
5.32×10⁻⁵ |
| CKS2 | 0.65 |
1.92×10⁻³ |
| CCNE2 | 0.66 |
2.14×10⁻⁴ |
| ASNS | 0.68 |
5.25×10⁻⁵ |
| CKS1B | 0.69 |
1.55×10⁻³ |
| FBXO5 | 0.69 |
9.25×10⁻⁵ |
| KCNH2 | 0.71 |
2.95×10⁻³ |
| TPD52 | 0.75 |
1.99×10⁻⁴ |
| STMN1 | 0.75 |
2.13×10⁻⁵ |
| TYMS | 0.75 |
2.13×10⁻⁵ |
| RRM2 | 0.76 |
6.99×10⁻⁵ |
| CBX5 | 0.76 |
2.44×10⁻³ |
| KIF11 | 0.76 |
1.09×10⁻³ |
| SOX11 | 0.77 |
1.42×10⁻² |
| RECQL4 | 0.79 |
3.77×10⁻⁴ |
| PCNA | 0.79 |
4.39×10⁻⁴ |
| GMNN | 0.80 |
1.27×10⁻⁵ |
| MYBL2 | 0.81 |
7.84×10⁻⁴ |
| TTK | 0.83 |
5.23×10⁻⁵ |
| TOP2A | 0.84 |
1.95×10⁻⁴ |
| EZH2 | 0.85 |
7.70×10⁻⁶ |
| PAFAH1B3 | 0.85 |
7.70×10⁻⁶ |
| RAD54L | 0.85 |
7.70×10⁻⁶ |
| TIMELESS | 0.85 |
2.82×10⁻⁵ |
| GNG4 | 0.87 |
1.04×10⁻⁵ |
| SPAG5 | 0.87 |
1.04×10⁻⁵ |
| PTTG1 | 0.88 |
3.01×10⁻⁵ |
| NELL1 | 0.92 |
3.40×10⁻³ |
| MEST | 0.93 |
1.25×10⁻³ |
| NOL4 | 0.93 |
2.14×10⁻³ |
| UCHL1 | 0.94 |
3.18×10⁻³ |
| INSM1 | 0.97 |
2.25×10⁻⁴ |
| MKI67 | 0.98 |
1.13×10⁻³ |
| PCSK1 | 0.98 |
1.20×10⁻² |
| BIRC5 | 1.00 |
3.28×10⁻⁵ |
| RFC4 | 1.01 |
9.53×10⁻⁶ |
| NEK2 | 1.01 |
9.94×10⁻⁴ |
| CENPF | 1.08 |
1.84×10⁻⁴ |
| CAMK2B | 1.10 |
1.89×10⁻⁴ |
| ISL1 | 1.30 |
7.31×10⁻³ |
| GRP | 1.32 |
1.16×10⁻² |
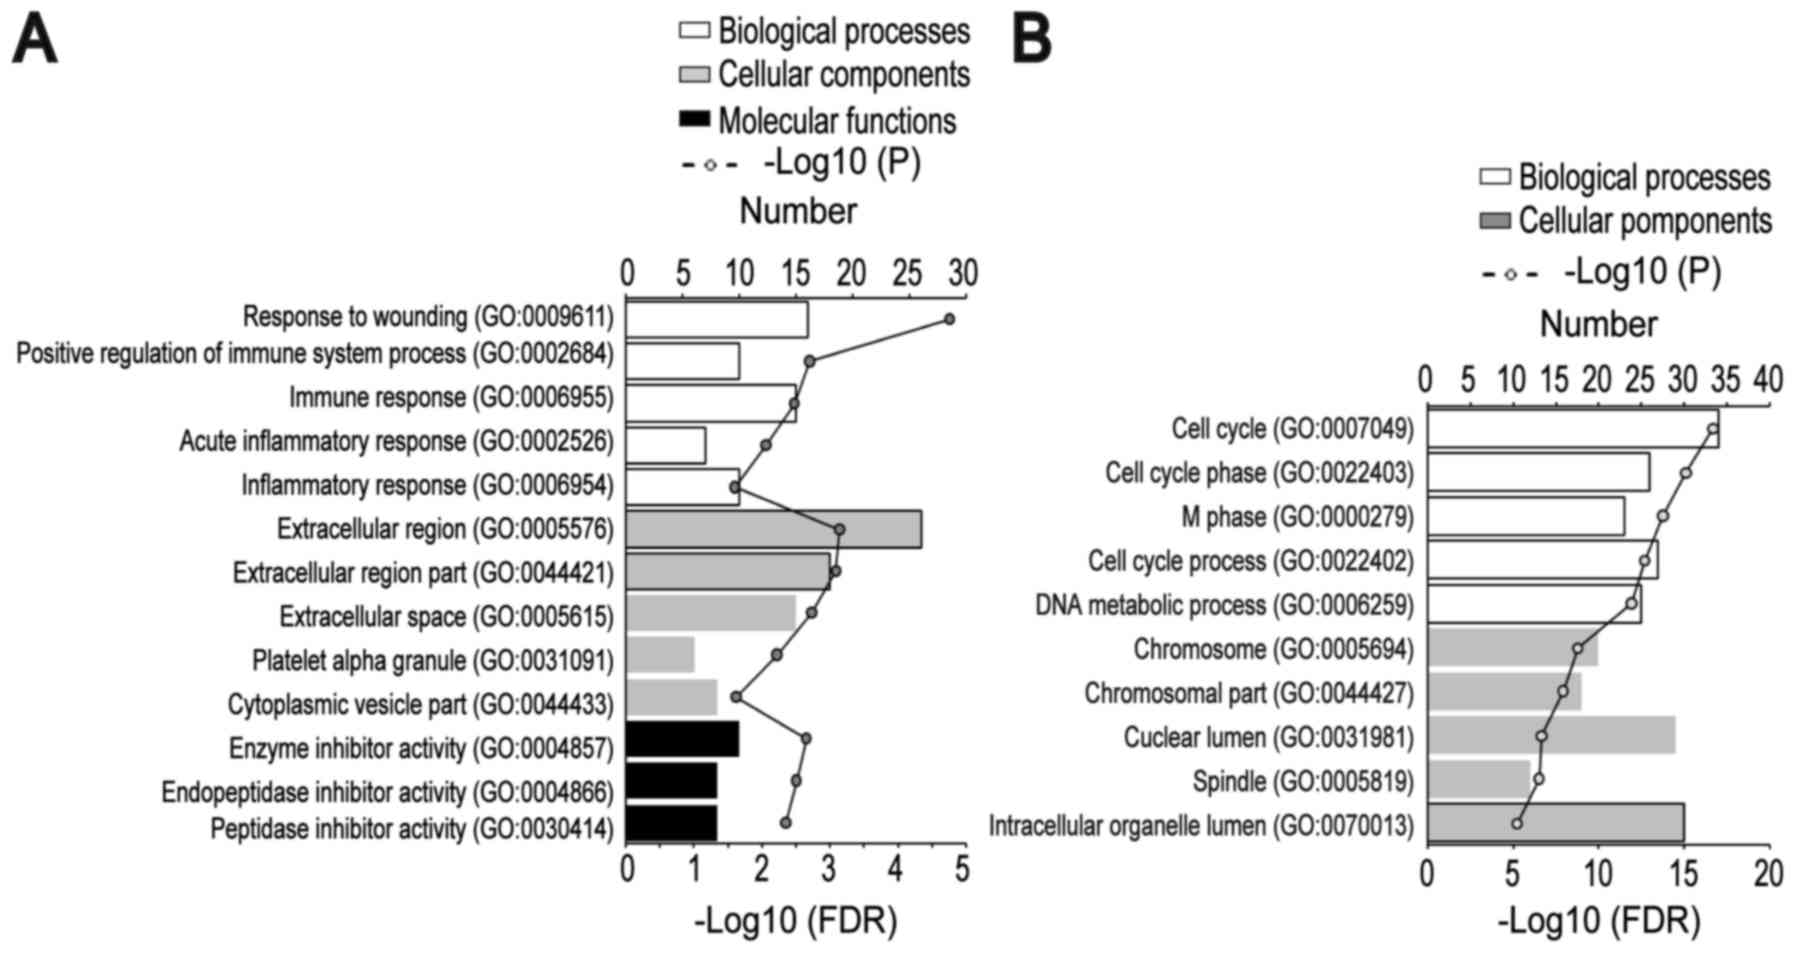
Biological classification and pathway
enrichment analysis of common DEGs
To gain an understanding of the GO categories of
common DEGs, all common DEGs were uploaded to the DAVID database.
The downregulated DEGs were significantly enriched in BPs,
including ‘response to wounding’, ‘positive regulation of immune
system process’, ‘immune response’, ‘acute inflammatory response’
and ‘inflammatory response’; the upregulated genes were
significantly enriched in ‘cell cycle’, ‘cell cycle phase’, ‘M
phase’, ‘cell cycle process’ and ‘DNA metabolic process’. For
cellular component, the downregulated DEGs were significantly
enriched in the ‘extracellular region’, ‘extracellular region
part’, ‘extracellular space’, ‘platelet α-granule’, and
‘cytoplasmic vesicle part’; and the upregulated DEGs were
significantly enriched in ‘chromosome’, ‘chromosomal part’,
‘nuclear lumen’, ‘spindle’ and ‘intracellular organelle lumen’. In
addition, MF analysis also indicated that the downregulated DEGs
were significantly enriched in ‘enzyme inhibitor activity’,
‘endopeptidase inhibitor activity’ and ‘peptidase inhibitor
activity’ (Fig. 2A and B).
Following KEGG pathway enrichment analysis, the
common downregulated DEGs were identified to be primarily enriched
in the ‘complement and coagulation cascades’ signaling pathways;
the common upregulated DEGs were mainly enriched in ‘cell cycle’,
‘DNA replication’, ‘oocyte meiosis’ and ‘mismatch repair’ signaling
pathways (Table III). Therefore,
these significantly enriched GO terms and pathways could aid
further understanding of the roles of these DEGs, involved in the
occurrence and development of SCLC.
| Table III.Signaling pathway enrichment analysis
of common DEGs in normal lung and small cell lung cancer. |
Table III.
Signaling pathway enrichment analysis
of common DEGs in normal lung and small cell lung cancer.
| Pathway | Name | Gene count | Genes | FDR |
|---|
| Common
downregulated DEGs |
|
KEGG_PATHWAY: hsa04610 | Complement and
coagulation cascades | 8 | A2M, THBD, C3, C6,
F13A1, CFH, SERPINA1, PROS1 |
3.17×10⁻⁴ |
| Common upregulated
DEGs |
|
KEGG_PATHWAY: hsa04110 | Cell cycle | 15 | CDC7, CDC6, TTK,
CHEK1, CDC20, PTTG1, MCM2, MCM3, MCM6, CCNE2, CCNB2, HDAC2, MAD2L1,
PCNA, BUB1 |
5.06×10⁻¹¹ |
|
KEGG_PATHWAY: hsa03030 | DNA
replication | 6 | RFC5, RFC4, PCNA,
MCM2, MCM3, MCM6 |
4.67×10⁻³ |
|
KEGG_PATHWAY: hsa04114 | Oocyte meiosis | 8 | CCNE2, MAD2L1,
CCNB2, BUB1, FBXO5, CDC20, CAMK2B, PTTG1 |
1.04×10⁻⁴ |
|
KEGG_PATHWAY: hsa03430 | Mismatch
repair | 5 | RFC5, EXO1, MSH6,
RFC4, PCNA |
1.80×10⁻² |
Construction of PPI network and module
analysis
PPI network of common DEGs was constructed using the
STRING online database and Cytoscape software (Fig. 3). A total of 123 DEGs (50
downregulated and 73 upregulated) of the 150 commonly altered DEGs
were filtered into the DEGs PPI network complex, containing 123
nodes and 869 edges, and 27 of the 150 DEGs fell outside the DEGs
PPI network (Fig. 3A). Then, the
hub genes in the networks with a connectivity degree >10 were
identified. The most significant 10 node degree genes were
topoisomerase IIα (TOP2A), proliferating cell nuclear antigen
(PCNA), replication factor C subunit 4 (RFC4), checkpoint kinase 1
(CHEK1), thymidylate synthase (TYMS), minichromosome maintenance
protein (MCM) 2, cell division cycle (CDC) 20, cyclin dependent
kinase inhibitor 3 (CDKN3), MCM3 and CDC6. The heat map of the most
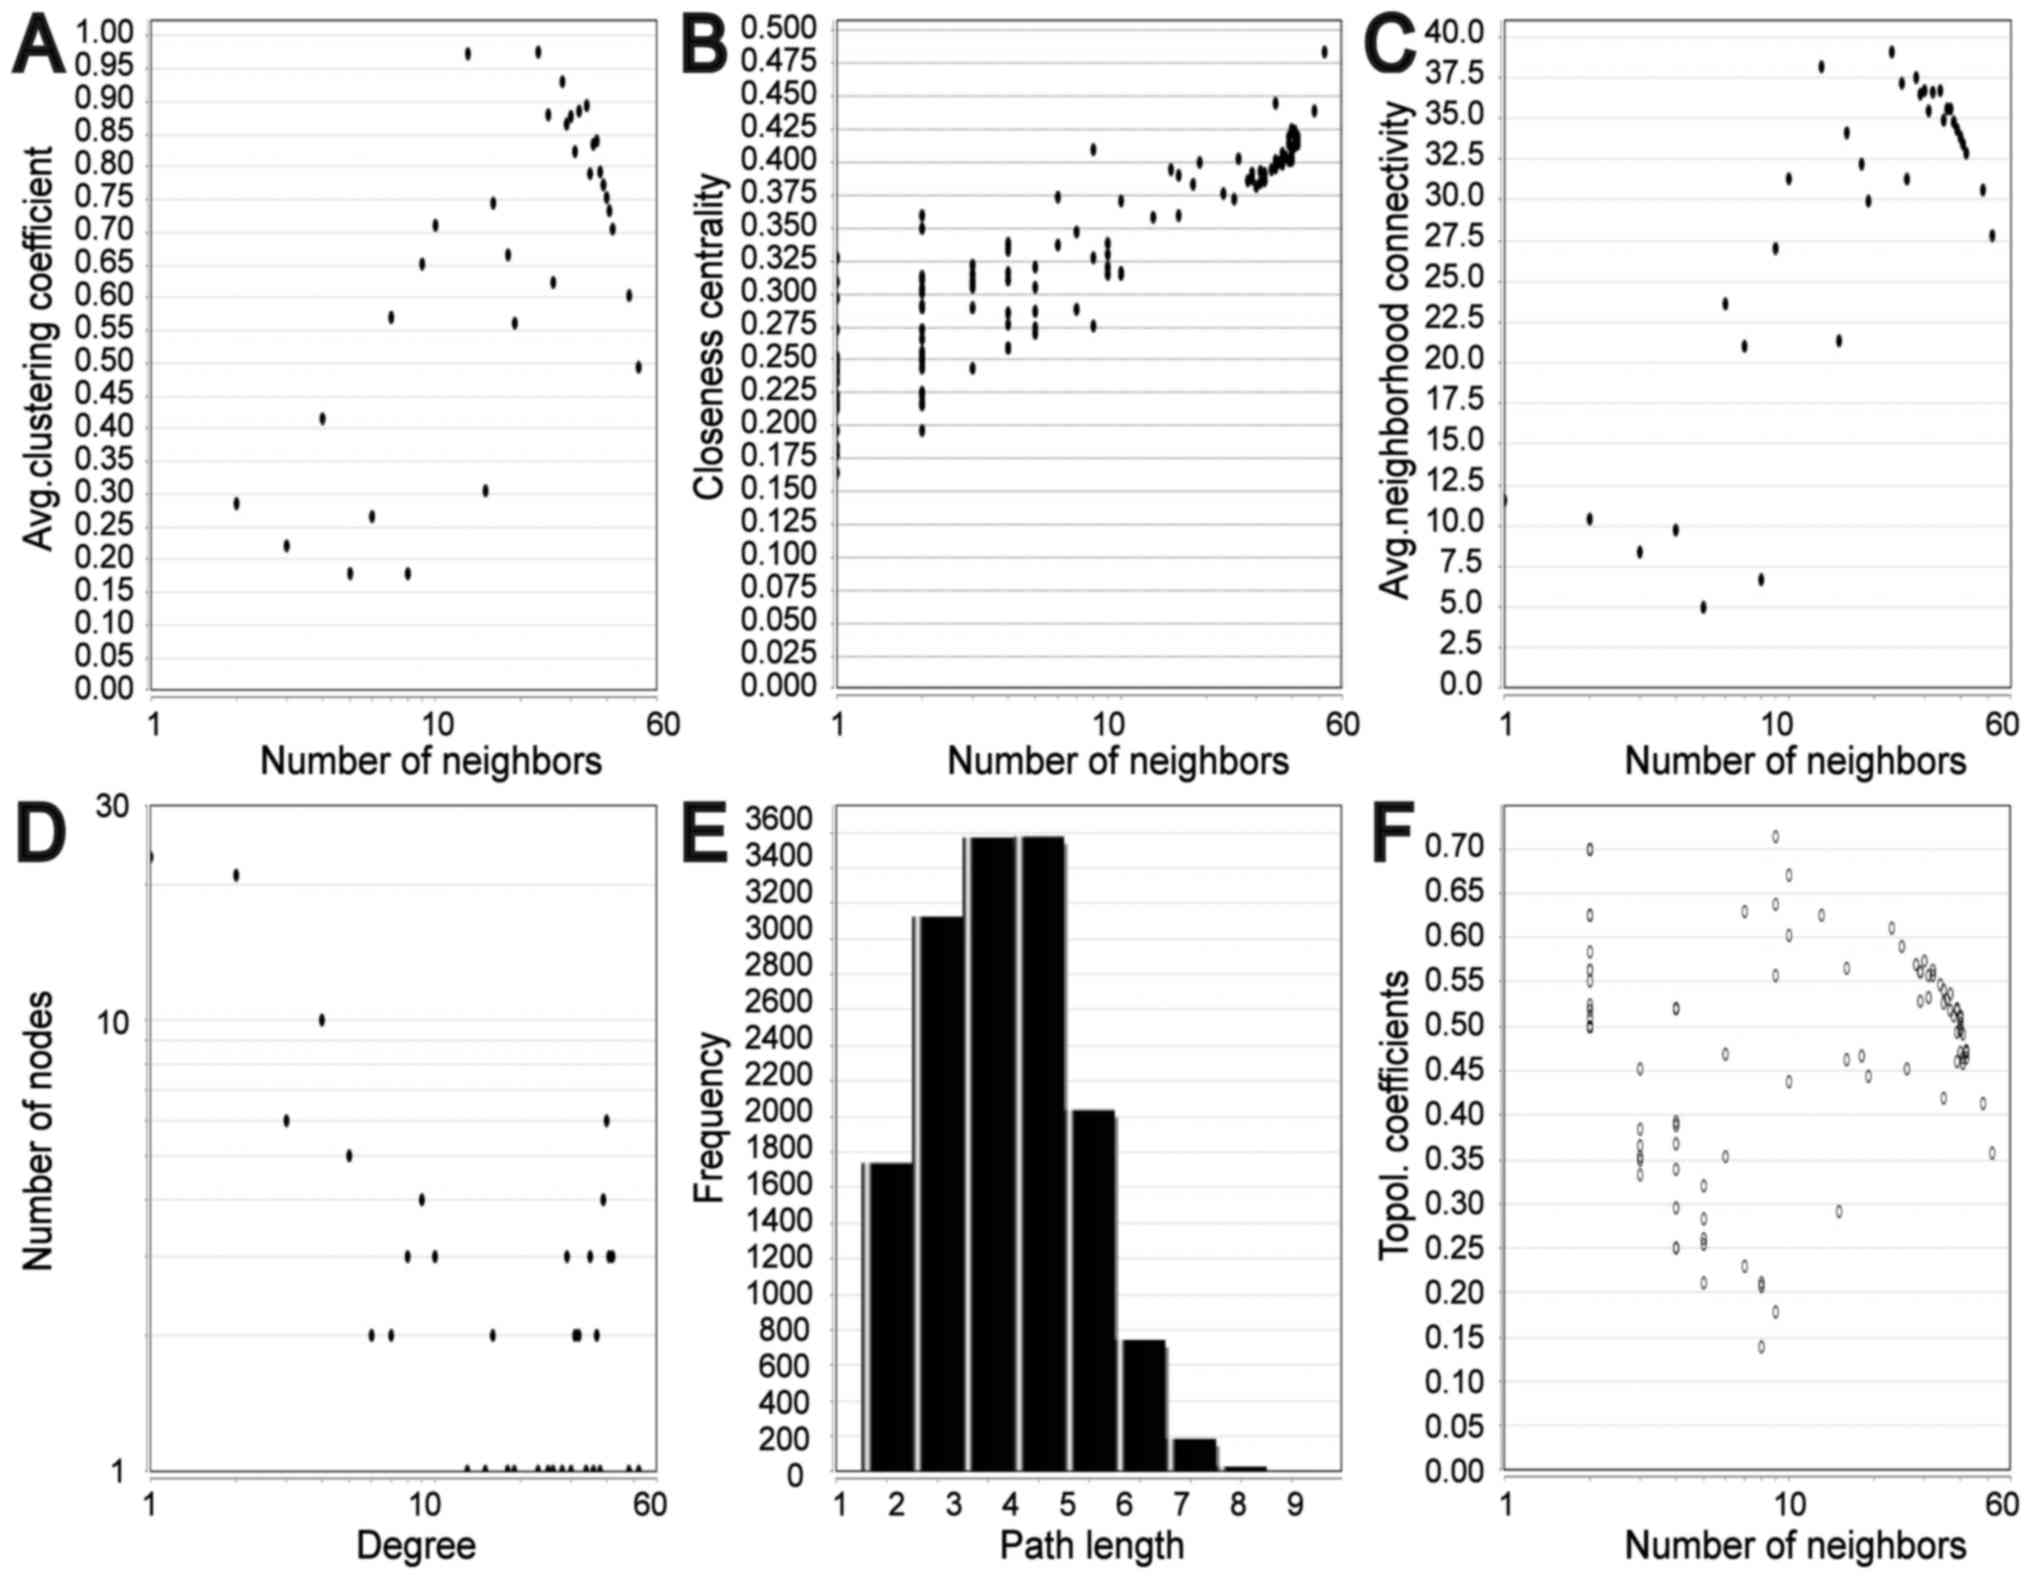
significant hub genes expression in GSE11969 is shown in Fig. 3B. To assess the basic properties of
the PPI network, the Network Analyzer was used to compute several
indices, including average clustering coefficient distribution,
closeness centrality, average neighborhood connectivity, node
degree distribution, shortest path length distribution and
topological coefficients. In scale-free networks, the majority of
nodes have a low degree, increasing the likely accuracy of the
network (30). The computed
parameters revealed that the constructed network was scale-free and
stable (Fig. 4). In addition, one
significant module was obtained from the PPI network of DEGs using
MCODE, consisting of 35 nodes and 550 edges (Fig. 3C). Functional and KEGG pathway
enrichment analysis revealed that genes in this module were
primarily associated with ‘cell cycle’, ‘DNA replication’ and
‘oocyte meiosis’ signaling pathways (Table IV).
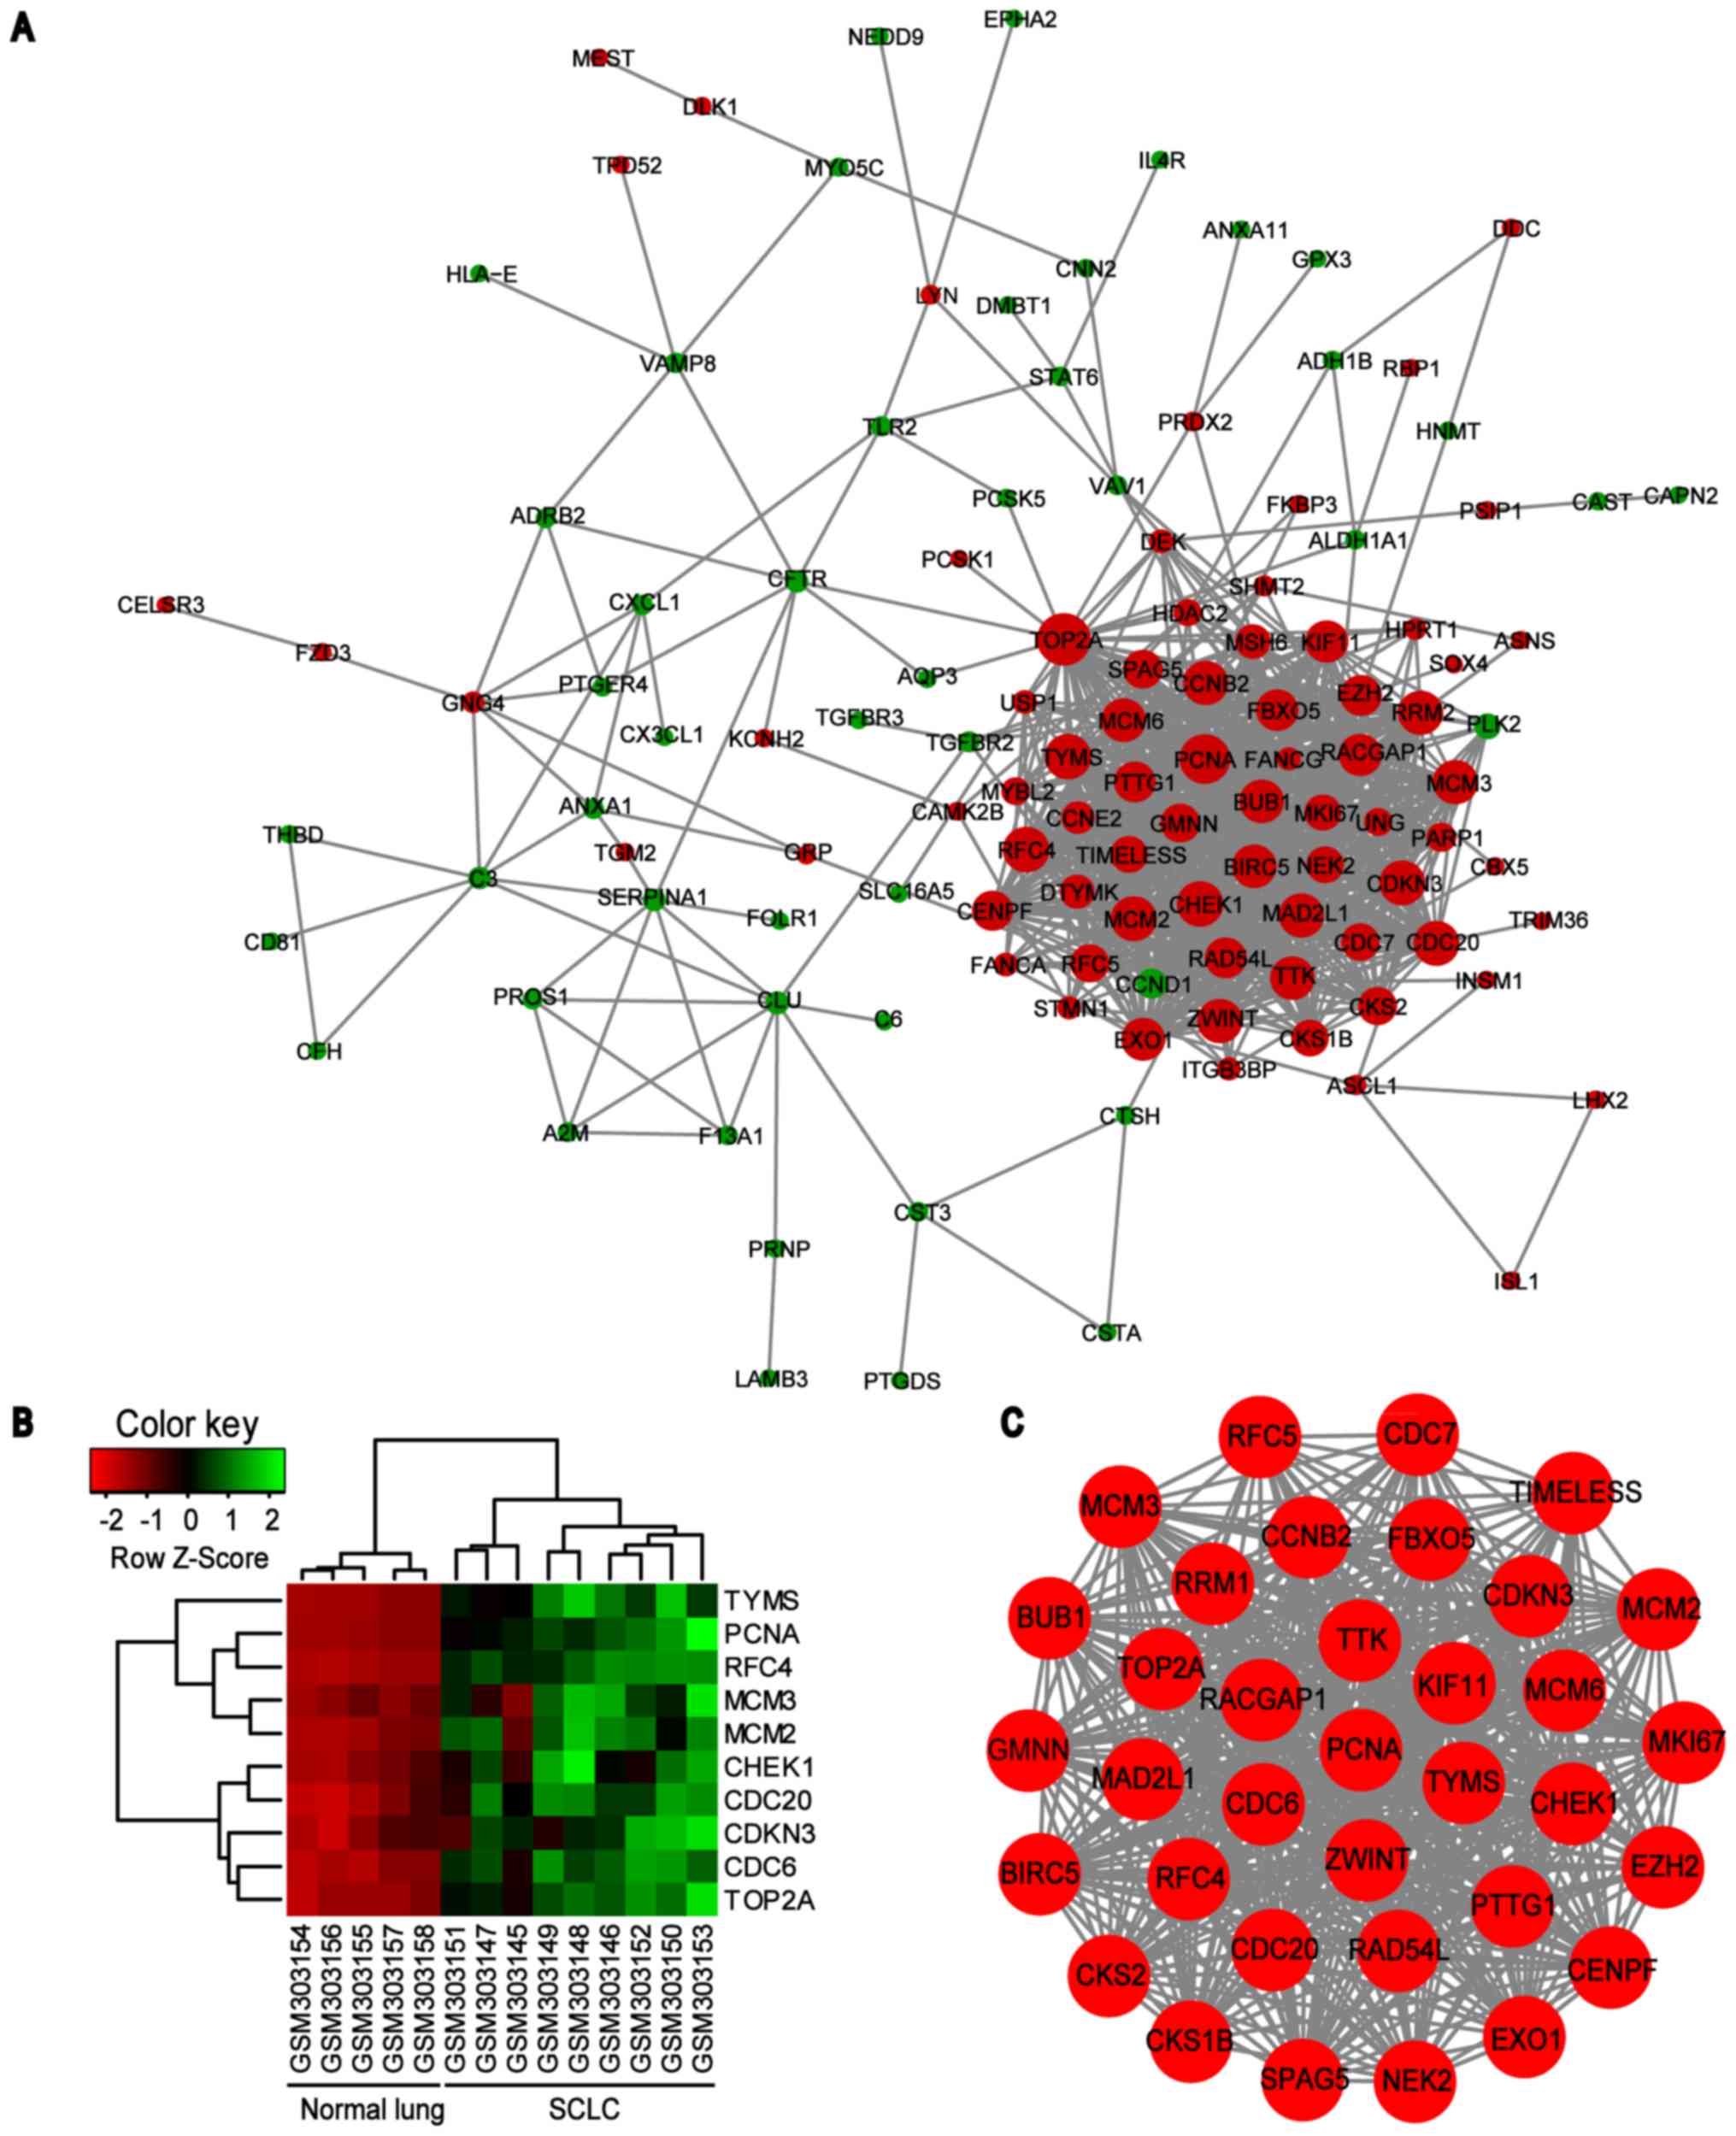 | Figure 3.PPI network constructed from the
common DEGs, module analysis and hub genes. (A) Using the STRING
online database, a total of 123 DEGs were filtered into the DEGs
PPI network complex. The nodes represent proteins, the edges
represent the interaction of proteins and green circles and red
circles indicate downregulated and upregulated DEGs, respectively.
(B) Expression heat map of the top 10 hub genes in GSE11969. (C)
The most significant module in the PPI network with MCODE score ≥4
and node >5. PPI, protein-protein interaction; DEG,
differentially expressed genes; MCODE, Molecular Complex Detection
plug in; SCLC, small cell lung cancer; TYMS, thymidylate synthase;
PCNA, proliferating cell nuclear antigen; RFC4, replication factor
C subunit 4; MCM, minichromosome maintenance protein; CHEK1,
checkpoint kinase 1; CDC, cell division cycle; CDKN3, cyclin
dependent kinase inhibitor 3; TOP2A, topoisomerase IIα. |
| Table IV.GO function enrichment analysis of
gene in module. |
Table IV.
GO function enrichment analysis of
gene in module.
| Category | Term | Description | Count | Genes | FDR |
|---|
| KEGG | hsa04110 | Cell cycle | 13 | CDC7, CDC6, TTK,
CDC20, CHEK1, PTTG1, MCM2, MCM3, MCM6, CCNB2, MAD2L1, PCNA,
BUB1 |
5.06×10⁻¹² |
| KEGG | hsa03030 | DNA
replication | 6 | RFC5, RFC4, PCNA,
MCM2, MCM3, MCM6 |
1.81×10⁻⁴ |
| KEGG | hsa04114 | Oocyte meiosis | 6 | CCNB2, MAD2L1,
BUB1, FBXO5, CDC20, PTTG1 |
4.83×10⁻² |
Validation of hub genes mRNA level in
the oncomine database
Based on the Oncomine database, it was identified
that the mRNA expression levels of TOP2A, PCNA, RFC4, CHEK1, TYMS,
CDC20, CDKN3, MCM3 and CDC6 were significantly increased in SCLC
samples compared with normal lung samples, while MCM2 was not
significantly differentially expressed, which was inconsistent with
the bioinformatics investigation (Fig.
5).
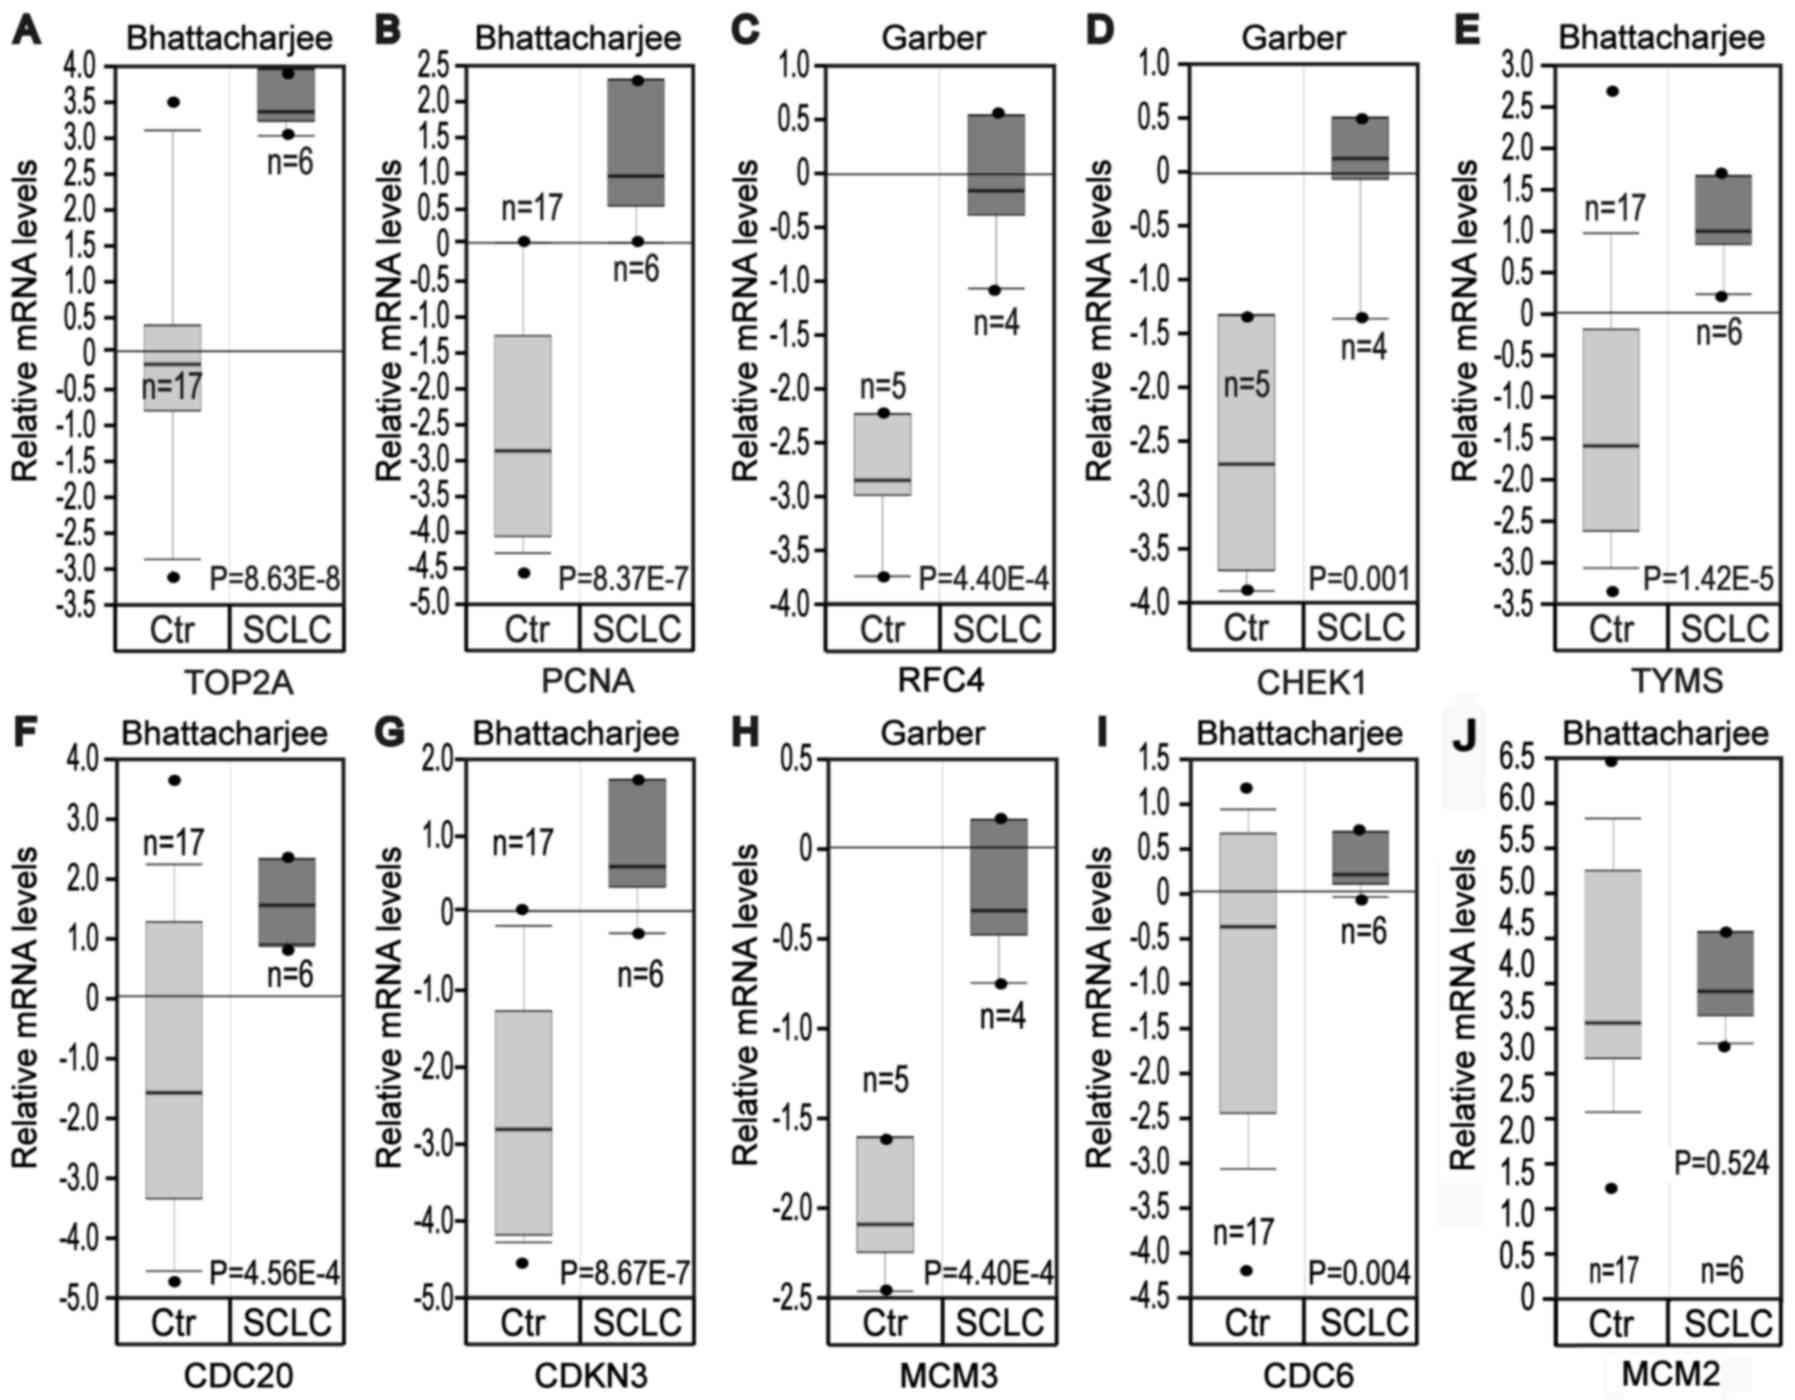 | Figure 5.Analysis of expression of hub genes
in the Oncomine database. Gene expression data was obtained from
Garber and Bhattacharjee lung datasets and analyzed with Oncomine.
mRNA expression levels of (A) TOP2A, (B) PCNA, (C) RFC4, (D) CHEK1,
(E) TYMS, (F) CDC20, (G) CDKN3, (H) MCM3, (I) CDC6 and (J) MCM2 in
normal lung vs. SCLC were compared. Pre-processed expression levels
are Log2 normalized and median centered. Data are
presented as box plot with minimum (from bottom to top), 10th
percentile, 25th percentile, median, 75th percentile, 90th
percentile and maximum. Ctr, control; TOP2A, topoisomerase IIα;
PCNA, proliferating cell nuclear antigen; RFC4, replication factor
C subunit 4; CHEK1, checkpoint kinase 1; TYMS, thymidylate
synthase; CDC, cell division cycle; CDKN3, cyclin dependent kinase
inhibitor 3; MCM, minichromosome maintenance protein; SCLC, small
cell lung cancer. |
Discussion
Although research on SCLC has made great progress in
the past decade (31,32), the pathogenesis of SCLC has yet to
be fully elucidated due to its complexity of biological traits and
high heterogeneity. As a result, the early diagnosis and treatment
of SCLC remains a problem. Therefore, understanding of molecular
mechanisms of SCLC based on microarray technology, which has
developed rapidly and has been widely used to reveal the general
genetic alteration in progression of diseases (16–18),
may aid the identification of the key gene targets or signaling
pathways for diagnosis, treatment, and prognosis of SCLC.
In the present study, two microarray datasets were
obtained to identify the DEGs common to normal lung tissues and
SCLC samples. A total of 150 common DEGs, including 66
significantly downregulated DEGs and 84 upregulated DEGs were
identified and used for further analysis. To interpret the
biological functions of these common DEGs, GO and pathway analysis
based on the DAVID tool was performed. GO and pathway analysis for
the common DEGs indicated that the common upregulated DEGs were
mainly enriched in cell cycle, cell cycle phase, M phase, cell
cycle process and DNA metabolic process, and the common
downregulated genes were significantly enriched in response to
wounding, positive regulation of immune system process, immune
response, acute inflammatory response and inflammatory response.
These results are consistent with the evidence that disorders in
cell cycle regulation and alterations of immune response contribute
to carcinogenesis and development of tumor (33–35).
KEGG pathway analysis indicated that the common downregulated DEGs
were mainly enriched in the complement and coagulation cascades
signaling pathways. Previous studies have shown that the tissue
factor-activated coagulation cascade in the tumor microenvironment,
in addition to coagulation, can facilitate the spreading of tumor
cell in the pulmonary vasculature during early metastatic colony
formation (36,37). Conversely, the common upregulated
DEGs were mainly enriched in cell cycle, DNA replication, oocyte
meiosis and mismatch repair signaling pathway, consistent with the
results from GO and pathway analysis.
To predict the associations of protein functions of
the identified 110 common interacting genes, a PPI network was
constructed in which the top 10 hub genes with the highest
connective degree were selected, including TOP2A, PCNA, RFC4,
CHEK1, TYMS, MCM2, CDC20, CDKN3, MCM3 and CDC6, which were also
primarily associated with ‘cell cycle’, ‘DNA replication’ and
‘oocyte meiosis’ signaling pathways. In addition, to validate the
expression levels of these hub genes, the mRNA expression level of
hub genes was searched for by mining the Oncomine database, which
further supported the bioinformatics data. Although previous
research has suggested that the majority of these deregulated hub
genes correlated with diagnosis, treatment and prognosis of the
various malignancies, the precise roles and molecular mechanism of
them in the occurrence and development of SCLC have not yet been
fully elucidated.
The TOP2A gene encodes a 170 kDa nuclear enzyme that
catalyzes the ATP-dependent transport of one intact DNA double
helix through another, by which TOP2A is involved in the chromosome
segregation and cell cycle progression (38), and numerous studies indicated that
the expression, genetic alteration and enzyme activity of TOP2A
have been identified in several types of malignancies; therefore,
it TOP2A should be investigated to determine whether it
represents an effective therapeutic target for a wide variety of
malignancies, such as SCLC, testicular cancer, neuroblastoma,
leukemia and lymphoma (39–41).
PCNA encodes a nuclear protein acting as a subunit
of DNA polymerase δ, which is essential for DNA replication
(42). Although several studies
have been performed to investigate the association between PCNA
expression and clinical properties of NSCLC, the data is
controversial; certain studies claimed that patients with increased
expression of PCNA had a worse outcome compared with patients with
a lower expression of PCNA (43–45),
however, a subsequent study indicated that PCNA cannot predict
disease-free survival in patients with lung adenocarcinoma
(46). Furthermore, no correlation
has been observed between PCNA expression in biopsy specimens and
tumor responsiveness to chemotherapy (47).
RFC4 encodes the fourth largest subunit of the RFC
complex, which helps PCNA load onto DNA in an ATP-dependent process
during DNA synthesis and serves an important role in DNA repair
activities following DNA damage. It has been reported that the
expression level of RFC4 is upregulated in colorectal cancer,
correlates with tumor progression and can predict the prognosis for
colorectal cancer (48).
CHEK1 is an evolutionarily conserved Ser/Thr kinase,
which mediates cell-cycle arrest following DNA damage (49). Previous results demonstrated that
upregulated CHEK1 has been considered a potential target for cancer
therapy (50,51). Therefore, CHEK1 inhibitors
(including LY2606368) have been tested as treatment for several
types of cancer including lung cancer, and the inhibitors may
affect the sensitivity of radiotherapy and chemotherapy, including
cisplatin or the PARP inhibitor olaparib (52–55).
TYMS is a key enzyme in the de novo synthesis
of thymidine and is upregulated in different histological types of
lung cancer, particularly in SCLC (56). In addition, the expression level of
TYMS is considered to be associated with the prognosis and
treatment efficacy of chemotherapy (57,58).
MCM2 is a component of the prereplicative complex,
which is essential for eukaryotic DNA replication and is only
expressed in proliferating cells. Several studies indicated that
the expression of MCM2 is also upregulated in NSCLC and is a
predictor of survival in patients with NSCLC (59). Recently, Cheung et al
(60) performed a
multi-dimensional proteomic analysis to investigate the biological
networks of MCM2 in the lung cancer and the results indicated that
the deregulation of MCM2 is involved in lung cancer cell
proliferation, the cell cycle and migration.
MCM3, another family member of MCMs, has been proved
to be overexpressed in various human cancers, including leukemia,
malignant melanoma, lymphoma, and carcinomas of the uterine cervix,
colon, lung, stomach, kidney and breast (61).
CDC20, a homolog of Saccharomyces cerevisiae
cell division cycle 20 protein, is an activator for the
anaphase-promoting complex. Evidence has demonstrated that CDC20 is
essential to govern cell cycle progression for cell division by
targeting several key substrates including securin, cyclin B1,
cyclin A, Nek2A, p21 and myeloid cell leukemia-1 for degradation
(62,63). Subsequent studies have indicated
that CDC20 is frequently upregulated in numerous types of
malignancies, including NSCLC, and is associated with the prognosis
of patients with tumors (64,65).
CDKN3 is a negative regulator of CDK1 and CDK2
(66). Since CDK-driven cell cycle
is essential for proliferation of cancer cells and CDKN3 inhibits
CDK activities, CDKN3 was initially perceived as a tumor suppressor
(66). However, the overexpression
of CNKN3 in a number of types of cancers has recently demonstrated
that CDKN3 mRNA overexpression in cancer is due to the presence of
dominant-negative CDKN3 mutations (67,68).
Although upregulated CDKN3 may be a prognostic marker in lung
adenocarcinoma and serve functional roles in the pathogenesis and
diagnosis of SCLC, it has not been investigated other aggressive
forms of lung tumors (69).
CDC6, initially identified to participate in the
assembly of pre-replication complexes, is essential for DNA
replication in mammalian cells (70). CDC6 expression represses E-cadherin
transcription, and loss of this gene occurs frequently in
carcinogenesis, contributing to invasion and metastasis (71). In addition, previous studies have
confirmed the association between CDC6 and prognosis and the
treatment sensitivity of patients with tumors (72,73).
Therefore, given the key roles, associated signaling
pathways and results of the present study on the hub genes
mentioned above, future studies may focus on these to explore their
roles in the pathogenesis and diagnosis of SCLC. However, the
present study has certain limitations: One is that the microarray
data were obtained from GEO database, not generated by the authors.
Another limitation of the study is the relatively small sample
size.
In summary, based on the gene expression profile
analysis of microarray datasets, the present study identified the
common deregulated DEGs between normal lung tissues and SCLC
tissues, associated signaling pathways and hub genes in the network
in different datasets, which may possess important roles in the
carcinogenesis and development of SCLC. These findings may provide
new clues for the investigation of the potential biomarkers and
biological mechanisms of SCLC, further developing the potential
diagnosis and therapeutic intervention methods of SCLC.
Acknowledgements
Not applicable.
Funding
The present study was supported by the National
Natural Science Foundation of China (grant no. 81501959), Doctoral
Scientific Research Starting Foundation of Liaoning Province (grant
no. 2015010911-301), Technological Project of Liaoning Province
(grant no. 20170540392), Innovation Foundation for the University
Students (grant no. 201510160000013) and Biological Anthropology
Innovation Team Project of JZMU (grant no. JYLJ201702).
Availability of data and materials
The datasets used and/or analyzed in the present
study are available from the corresponding authors on reasonable
request.
Authors' contributions
YL and JG designed the study. PW, TC, ZS and TW
analyzed the microarray datasets and interpreted the results. HG
and NW downloaded the gene expression profile from the Gene
Expression Omnibus. TC and TW wrote and edited the manuscript. All
authors critically reviewed the content and approved the final
version for publication.
Ethics approval and consent to
participate
Not applicable.
Consent for publication
Not applicable.
Competing interests
The authors declare that they have no competing
interests.
References
|
1
|
Chen W, Zheng R, Baade PD, Zhang S, Zeng
H, Bray F, Jemal A, Yu XQ and He J: Cancer statistics in China,
2015. CA Cancer J Clin. 66:115–132. 2016. View Article : Google Scholar : PubMed/NCBI
|
|
2
|
Ferlay J, Shin HR, Bray F, Forman D,
Mathers C and Parkin DM: Estimates of worldwide burden of cancer in
2008: GLOBOCAN 2008. Int J Cancer. 127:2893–2917. 2010. View Article : Google Scholar : PubMed/NCBI
|
|
3
|
Luchtenborg M, Riaz SP, Lim E, Page R,
Baldwin DR, Jakobsen E, Vedsted P, Lind M, Peake MD, Mellemgaard A,
et al: Survival of patients with small cell lung cancer undergoing
lung resection in England, 1998–2009. Thorax. 69:269–273. 2014.
View Article : Google Scholar : PubMed/NCBI
|
|
4
|
Sabari JK, Lok BH, Laird JH, Poirier JT
and Rudin CM: Unravelling the biology of SCLC: Implications for
therapy. Nat Rev Clin Oncol. 14:549–561. 2017. View Article : Google Scholar : PubMed/NCBI
|
|
5
|
Nicholson AG, Chansky K, Crowley J,
Beyruti R, Kubota K, Turrisi A, Eberhardt WE, van Meerbeeck J and
Rami-Porta R: Staging and Prognostic Factors Committee, Advisory
Boards, and Participating Institutions; Staging and Prognostic
Factors Committee Advisory Boards and Participating Institutions:
The international association for the study of lung cancer lung
cancer staging project: Proposals for the revision of the clinical
and pathologic staging of small cell lung cancer in the forthcoming
eighth edition of the TNM classification for lung cancer. J Thorac
Oncol. 11:300–311. 2016. View Article : Google Scholar : PubMed/NCBI
|
|
6
|
George J, Lim JS, Jang SJ, Cun Y, Ozretić
L, Kong G, Leenders F, Lu X, Fernández-Cuesta L, Bosco G, Müller C,
et al: Comprehensive genomic profiles of small cell lung cancer.
Nature. 524:47–53. 2015. View Article : Google Scholar : PubMed/NCBI
|
|
7
|
Mori N, Yokota J, Akiyama T, Sameshima Y,
Okamoto A, Mizoguchi H, Toyoshima K, Sugimura T and Terada M:
Variable mutations of the RB gene in small-cell lung carcinoma.
Oncogene. 5:1713–1717. 1990.PubMed/NCBI
|
|
8
|
Rudin CM, Durinck S, Stawiski EW, Poirier
JT, Modrusan Z, Shames DS, Bergbower EA, Guan Y, Shin J, Guillory
J, et al: Comprehensive genomic analysis identifies SOX2 as a
frequently amplified gene in small-cell lung cancer. Nat Genet.
44:1111–1116. 2012. View
Article : Google Scholar : PubMed/NCBI
|
|
9
|
Brambilla E, Negoescu A, Gazzeri S,
Lantuejoul S, Moro D, Brambilla C and Coll JL: Apoptosis-related
factors p53, Bcl2, and Bax in neuroendocrine lung tumors. Am J
Pathol. 149:1941–1952. 1996.PubMed/NCBI
|
|
10
|
Arriola E, Canadas I, Arumi M, Rojo F,
Rovira A and Albanell J: Genetic changes in small cell lung
carcinoma. Clin Transl Oncol. 10:189–197. 2008. View Article : Google Scholar : PubMed/NCBI
|
|
11
|
de Bono J, Ramanathan RK, Mina L, Chugh R,
Glaspy J, Rafii S, Kaye S, Sachdev J, Heymach J, Smith DC, et al:
Phase I, Dose-escalation, Two-Part trial of the PARP inhibitor
talazoparib in patients with advanced germline BRCA1/2 mutations
and selected sporadic cancers. Cancer Discov. 7:620–629. 2017.
View Article : Google Scholar : PubMed/NCBI
|
|
12
|
Byers LA, Wang J, Nilsson MB, Fujimoto J,
Saintigny P, Yordy J, Giri U, Peyton M, Fan YH, Diao L, et al:
Proteomic profiling identifies dysregulated pathways in small cell
lung cancer and novel therapeutic targets including PARP1. Cancer
Discov. 2:798–811. 2012. View Article : Google Scholar : PubMed/NCBI
|
|
13
|
Borromeo MD, Savage TK, Kollipara RK, He
M, Augustyn A, Osborne JK, Girard L, Minna JD, Gazdar AF, Cobb MH
and Johnson JE: ASCL1 and NEUROD1 reveal heterogeneity in pulmonary
neuroendocrine tumors and regulate distinct genetic programs. Cell
Rep. 16:1259–1272. 2016. View Article : Google Scholar : PubMed/NCBI
|
|
14
|
Gardner EE, Lok BH, Schneeberger VE,
Desmeules P, Miles LA, Arnold PK, Ni A, Khodos I, de Stanchina E,
Nguyen T, et al: Chemosensitive relapse in small cell lung cancer
proceeds through an EZH2-SLFN11 Axis. Cancer Cell. 31:286–299.
2017. View Article : Google Scholar : PubMed/NCBI
|
|
15
|
Hirai H, Iwasawa Y, Okada M, Arai T,
Nishibata T, Kobayashi M, Kimura T, Kaneko N, Ohtani J, Yamanaka K,
et al: Small-molecule inhibition of Wee1 kinase by MK-1775
selectively sensitizes p53-deficient tumor cells to DNA-damaging
agents. Mol Cancer Ther. 8:2992–3000. 2009. View Article : Google Scholar : PubMed/NCBI
|
|
16
|
Albertson DG and Pinkel D: Genomic
microarrays in human genetic disease and cancer. Hum Mol Genet.
12:R145–R152. 2003. View Article : Google Scholar : PubMed/NCBI
|
|
17
|
Singhal S, Miller D, Ramalingam S and Sun
SY: Gene expression profiling of non-small cell lung cancer. Lung
Cancer. 60:313–324. 2008. View Article : Google Scholar : PubMed/NCBI
|
|
18
|
Al Zeyadi M, Dimova I, Ranchich V, Rukova
B, Nesheva D, Hamude Z, Georgiev S, Petrov D and Toncheva D: Whole
genome microarray analysis in non-small cell lung cancer.
Biotechnol Biotechnol Equip. 29:111–118. 2015. View Article : Google Scholar : PubMed/NCBI
|
|
19
|
Kikuchi T, Daigo Y, Katagiri T, Tsunoda T,
Okada K, Kakiuchi S, Zembutsu H, Furukawa Y, Kawamura M, Kobayashi
K, et al: Expression profiles of non-small cell lung cancers on
cDNA microarrays: Identification of genes for prediction of
lymph-node metastasis and sensitivity to anti-cancer drugs.
Oncogene. 22:2192–2205. 2003. View Article : Google Scholar : PubMed/NCBI
|
|
20
|
Yanaihara N, Caplen N, Bowman E, Seike M,
Kumamoto K, Yi M, Stephens RM, Okamoto A, Yokota J, Tanaka T, et
al: Unique microRNA molecular profiles in lung cancer diagnosis and
prognosis. Cancer Cell. 9:189–198. 2006. View Article : Google Scholar : PubMed/NCBI
|
|
21
|
Bhattacharjee A, Richards WG, Staunton J,
Li C, Monti S, Vasa P, Ladd C, Beheshti J, Bueno R, Gillette M, et
al: Classification of human lung carcinomas by mRNA expression
profiling reveals distinct adenocarcinoma subclasses. Proc Natl
Acad Sci USA. 98:13790–13795. 2001. View Article : Google Scholar : PubMed/NCBI
|
|
22
|
Edgar R, Domrachev M and Lash AE: Gene
expression omnibus: NCBI gene expression and hybridization array
data repository. Nucleic Acids Res. 30:207–210. 2002. View Article : Google Scholar : PubMed/NCBI
|
|
23
|
Rohrbeck A, Neukirchen J, Rosskopf M,
Pardillos GG, Geddert H, Schwalen A, Gabbert HE, von Haeseler A,
Pitschke G, Schott M, et al: Gene expression profiling for
molecular distinction and characterization of laser captured
primary lung cancers. J Transl Med. 6:692008. View Article : Google Scholar : PubMed/NCBI
|
|
24
|
Takeuchi T, Tomida S, Yatabe Y, Kosaka T,
Osada H, Yanagisawa K, Mitsudomi T and Takahashi T: Expression
profile-defined classification of lung adenocarcinoma shows close
relationship with underlying major genetic changes and
clinicopathologic behaviors. J Clin Oncol. 24:1679–1688. 2006.
View Article : Google Scholar : PubMed/NCBI
|
|
25
|
Barrett T, Wilhite SE, Ledoux P,
Evangelista C, Kim IF, Tomashevsky M, Marshall KA, Phillippy KH,
Sherman PM, Holko M, et al: NCBI GEO: Archive for functional
genomics data sets-update. Nucleic Acids Res. 41:(Database Issue).
D991–D995. 2013. View Article : Google Scholar : PubMed/NCBI
|
|
26
|
da Huang W, Sherman BT and Lempicki RA:
Systematic and integrative analysis of large gene lists using DAVID
bioinformatics resources. Nat Protoc. 4:44–57. 2009. View Article : Google Scholar : PubMed/NCBI
|
|
27
|
Assenov Y, Ramírez F, Schelhorn SE,
Lengauer T and Albrecht M: Computing topological parameters of
biological networks. Bioinformatics. 24:282–284. 2008. View Article : Google Scholar : PubMed/NCBI
|
|
28
|
Rhodes DR, Kalyana-Sundaram S, Mahavisno
V, Varambally R, Yu J, Briggs BB, Barrette TR, Anstet MJ,
Kincead-Beal C, Kulkarni P, et al: Oncomine 3.0: Genes, pathways,
and networks in a collection of 18,000 cancer gene expression
profiles. Neoplasia. 9:166–180. 2007. View Article : Google Scholar : PubMed/NCBI
|
|
29
|
Garber ME, Troyanskaya OG, Schluens K,
Petersen S, Thaesler Z, Pacyna-Gengelbach M, van de Rijn M, Rosen
GD, Perou CM, Whyte RI, et al: Diversity of gene expression in
adenocarcinoma of the lung. Proc Natl Acad Sci USA. 98:13784–13789.
2001. View Article : Google Scholar : PubMed/NCBI
|
|
30
|
Diez D, Wheelock AM, Goto S, Haeggström
JZ, Paulsson-Berne G, Hansson GK, Hedin U, Gabrielsen A and
Wheelock CE: The use of network analyses for elucidating mechanisms
in cardiovascular disease. Mol Biosyst. 6:289–304. 2010. View Article : Google Scholar : PubMed/NCBI
|
|
31
|
Karachaliou N, Pilotto S, Lazzari C, Bria
E, de Marinis F and Rosell R: Cellular and molecular biology of
small cell lung cancer: An overview. Transl Lung Cancer Res.
5:2–15. 2016.PubMed/NCBI
|
|
32
|
Pietanza MC, Byers LA, Minna JD and Rudin
CM: Small cell lung cancer: Will recent progress lead to improved
outcomes? Clin Cancer Res. 21:2244–2255. 2015. View Article : Google Scholar : PubMed/NCBI
|
|
33
|
Sica A and Bronte V: Altered macrophage
differentiation and immune dysfunction in tumor development. J Clin
Invest. 117:1155–1166. 2007. View Article : Google Scholar : PubMed/NCBI
|
|
34
|
Mantovani A, Allavena P, Sica A and
Balkwill F: Cancer-related inflammation. Nature. 454:436–444. 2008.
View Article : Google Scholar : PubMed/NCBI
|
|
35
|
Reiche EM, Nunes SO and Morimoto HK:
Stress, depression, the immune system, and cancer. Lancet Oncol.
5:617–625. 2004. View Article : Google Scholar : PubMed/NCBI
|
|
36
|
Liu Y, Jiang P, Capkova K, Xue D, Ye L,
Sinha SC, Mackman N, Janda KD and Liu C: Tissue factor-activated
coagulation cascade in the tumor microenvironment is critical for
tumor progression and an effective target for therapy. Cancer Res.
71:6492–6502. 2011. View Article : Google Scholar : PubMed/NCBI
|
|
37
|
Im JH, Fu W, Wang H, Bhatia SK, Hammer DA,
Kowalska MA and Muschel RJ: Coagulation facilitates tumor cell
spreading in the pulmonary vasculature during early metastatic
colony formation. Cancer Res. 64:8613–8619. 2004. View Article : Google Scholar : PubMed/NCBI
|
|
38
|
Champoux JJ: DNA topoisomerases:
Structure, function, and mechanism. Annu Rev Biochem. 70:369–413.
2001. View Article : Google Scholar : PubMed/NCBI
|
|
39
|
Chen T, Sun Y, Ji P, Kopetz S and Zhang W:
Topoisomerase IIα in chromosome instability and personalized cancer
therapy. Oncogene. 34:4019–4031. 2015. View Article : Google Scholar : PubMed/NCBI
|
|
40
|
Jain M, Zhang L, He M, Zhang YQ, Shen M
and Kebebew E: TOP2A is overexpressed and is a therapeutic target
for adrenocortical carcinoma. Endocr Relat Cancer. 20:361–370.
2013. View Article : Google Scholar : PubMed/NCBI
|
|
41
|
O'Malley FP, Chia S, Tu D, Shepherd LE,
Levine MN, Bramwell VH, Andrulis IL and Pritchard KI: Topoisomerase
II Alpha and responsiveness of breast cancer to adjuvant
chemotherapy. J Natl Cancer Inst. 101:644–650. 2009. View Article : Google Scholar : PubMed/NCBI
|
|
42
|
Maga G and Hubscher U: Proliferating cell
nuclear antigen (PCNA): A dancer with many partners. J Cell Sci.
116:3051–3060. 2003. View Article : Google Scholar : PubMed/NCBI
|
|
43
|
del Giglio A, O'Brien S, Ford R, Saya H,
Manning J, Keating M, Johnston D, Khetan R, el-Naggar A and
Deisseroth A: Prognostic value of proliferating cell nuclear
antigen expression in chronic lymphoid leukemia. Blood.
79:2717–2720. 1992.PubMed/NCBI
|
|
44
|
Kinugasa S, Tachibana M, Hishikawa Y, Abe
S, Yoshimura H, Monden N, Dhar DK and Nagasue N: Prognostic
significance of proliferating cell nuclear antigen (PCNA) in
squamous cell carcinoma of the esophagus. Jpn J Clin Oncol.
26:405–410. 1996. View Article : Google Scholar : PubMed/NCBI
|
|
45
|
Caputi M, Esposito V, Groger AM, Pacilio
C, Murabito M, Dekan G, Baldi F, Wolner E and Giordano A:
Prognostic role of proliferating cell nuclear antigen in lung
cancer: An immunohistochemical analysis. In Vivo. 12:85–88.
1998.PubMed/NCBI
|
|
46
|
Oka S, Uramoto H, Shimokawa H, Iwanami T
and Tanaka F: The expression of Ki-67, but not proliferating cell
nuclear antigen, predicts poor disease free survival in patients
with adenocarcinoma of the lung. Anticancer Res. 31:4277–4282.
2011.PubMed/NCBI
|
|
47
|
Zdunek M and Korobowicz E: Expression of
PCNA in non-small cell lung cancer before and after treatment with
cisplatin and vepeside. Pol J Pathol. 51:77–81. 2000.PubMed/NCBI
|
|
48
|
Xiang J, Fang L, Luo Y, Yang Z, Liao Y,
Cui J, Huang M, Yang Z, Huang Y, Fan X, et al: Levels of human
replication factor C4, a clamp loader, correlate with tumor
progression and predict the prognosis for colorectal cancer. J
Transl Med. 12:3202014. View Article : Google Scholar : PubMed/NCBI
|
|
49
|
Dai Y and Grant S: New insights into
checkpoint kinase 1 in the DNA damage response signaling network.
Clin Cancer Res. 16:376–383. 2010. View Article : Google Scholar : PubMed/NCBI
|
|
50
|
Doerr F, George J, Schmitt A, Beleggia F,
Rehkämper T, Hermann S, Walter V, Weber JP, Thomas RK, Wittersheim
M, et al: Targeting a non-oncogene addiction to the ATR/CHK1 axis
for the treatment of small cell lung cancer. Sci Rep. 7:155112017.
View Article : Google Scholar : PubMed/NCBI
|
|
51
|
Garrett MD and Collins I: Anticancer
therapy with checkpoint inhibitors: What, where and when? Trends
Pharmacol Sci. 32:308–316. 2011. View Article : Google Scholar : PubMed/NCBI
|
|
52
|
Xie Y, Wei RR, Huang GL, Zhang MY, Yuan YF
and Wang HY: Checkpoint kinase 1 is negatively regulated by miR-497
in hepatocellular carcinoma. Med Oncol. 31:8442014. View Article : Google Scholar : PubMed/NCBI
|
|
53
|
Liu B, Qu J, Xu F, Guo Y, Wang Y, Yu H and
Qian B: MiR-195 suppresses non-small cell lung cancer by targeting
CHEK1. Oncotarget. 6:9445–9456. 2015.PubMed/NCBI
|
|
54
|
McNeely S, Beckmann R and Lin Bence AK:
CHEK again: Revisiting the development of CHK1 inhibitors for
cancer therapy. Pharmacol Ther. 142:1–10. 2014. View Article : Google Scholar : PubMed/NCBI
|
|
55
|
Sen T, Tong P, Stewart CA, Cristea S,
Valliani A, Shames DS, Redwood AB, Fan YH, Li L, Glisson BS, et al:
CHK1 Inhibition in small-cell lung cancer produces Single-agent
activity in Biomarker-defined disease subsets and combination
activity with cisplatin or olaparib. Cancer Res. 77:3870–3884.
2017. View Article : Google Scholar : PubMed/NCBI
|
|
56
|
Tanaka F, Wada H, Fukui Y and Fukushima M:
Thymidylate synthase (TS) gene expression in primary lung cancer
patients: A large-scale study in Japanese population. Ann Oncol.
22:1791–1797. 2011. View Article : Google Scholar : PubMed/NCBI
|
|
57
|
Chen CY, Chang YL, Shih JY, Lin JW, Chen
KY, Yang CH, Yu CJ and Yang PC: Thymidylate synthase and
dihydrofolate reductase expression in non-small cell lung
carcinoma: The association with treatment efficacy of pemetrexed.
Lung Cancer. 74:132–138. 2011. View Article : Google Scholar : PubMed/NCBI
|
|
58
|
Chamizo C, Zazo S, Domine M, Cristóbal I,
García-Foncillas J, Rojo F and Madoz-Gúrpide J: Thymidylate
synthase expression as a predictive biomarker of pemetrexed
sensitivity in advanced non-small cell lung cancer. BMC Pulm Med.
15:1322015. View Article : Google Scholar : PubMed/NCBI
|
|
59
|
Ramnath N, Hernandez FJ, Tan DF, Huberman
JA, Natarajan N, Beck AF, Hyland A, Todorov IT, Brooks JS and
Bepler G: MCM2 is an independent predictor of survival in patients
with non-small-cell lung cancer. J Clin Oncol. 19:4259–4266. 2001.
View Article : Google Scholar : PubMed/NCBI
|
|
60
|
Cheung CHY, Hsu CL, Chen KP, Chong ST, Wu
CH, Huang HC and Juan HF: MCM2-regulated functional networks in
lung cancer by multi-dimensional proteomic approach. Sci Rep.
7:133022017. View Article : Google Scholar : PubMed/NCBI
|
|
61
|
Ha SA, Shin SM, Namkoong H, Lee H, Cho GW,
Hur SY, Kim TE and Kim JW: Cancer-associated expression of
minichromosome maintenance 3 gene in several human cancers and its
involvement in tumorigenesis. Clin Cancer Res. 10:8386–8395. 2004.
View Article : Google Scholar : PubMed/NCBI
|
|
62
|
Kidokoro T, Tanikawa C, Furukawa Y,
Katagiri T, Nakamura Y and Matsuda K: CDC20, a potential cancer
therapeutic target, is negatively regulated by p53. Oncogene.
27:1562–1571. 2008. View Article : Google Scholar : PubMed/NCBI
|
|
63
|
Wang L, Zhang J, Wan L, Zhou X, Wang Z and
Wei W: Targeting Cdc20 as a novel cancer therapeutic strategy.
Pharmacol Ther. 151:141–151. 2015. View Article : Google Scholar : PubMed/NCBI
|
|
64
|
Chang DZ, Ma Y, Ji B, Liu Y, Hwu P,
Abbruzzese JL, Logsdon C and Wang H: Increased CDC20 expression is
associated with pancreatic ductal adenocarcinoma differentiation
and progression. J Hematol Oncol. 5:152012. View Article : Google Scholar : PubMed/NCBI
|
|
65
|
Kato T, Daigo Y, Aragaki M, Ishikawa K,
Sato M and Kaji M: Overexpression of CDC20 predicts poor prognosis
in primary non-small cell lung cancer patients. J Surg Oncol.
106:423–430. 2012. View Article : Google Scholar : PubMed/NCBI
|
|
66
|
Fan C, Chen L, Huang Q, Shen T, Welsh EA,
Teer JK, Cai J, Cress WD and Wu J: Overexpression of major CDKN3
transcripts is associated with poor survival in lung
adenocarcinoma. Br J Cancer. 113:1735–1743. 2015. View Article : Google Scholar : PubMed/NCBI
|
|
67
|
Yu Y, Jiang X, Schoch BS, Carroll RS,
Black PM and Johnson MD: Aberrant splicing of cyclin-dependent
kinase-associated protein phosphatase KAP increases proliferation
and migration in glioblastoma. Cancer Res. 67:130–138. 2007.
View Article : Google Scholar : PubMed/NCBI
|
|
68
|
Yeh CT, Lu SC, Chen TC, Peng CY and Liaw
YF: Aberrant transcripts of the cyclin-dependent kinase-associated
protein phosphatase in hepatocellular carcinoma. Cancer Res.
60:4697–4700. 2007.
|
|
69
|
Zang X, Chen M, Zhou Y, Xiao G, Xie Y and
Wang X: Identifying CDKN3 gene expression as a prognostic biomarker
in lung adenocarcinoma via Meta-analysis. Cancer Inform. 14 Suppl
2:S183–S191. 2015.
|
|
70
|
Borlado LR and Méndez J: CDC6: From DNA
replication to cell cycle checkpoints and oncogenesis.
Carcinogenesis. 29:237–243. 2007. View Article : Google Scholar : PubMed/NCBI
|
|
71
|
Sideridou M, Zakopoulou R, Evangelou K,
Liontos M, Kotsinas A, Rampakakis E, Gagos S, Kahata K, Grabusic K,
Gkouskou K, et al: Cdc6 expression represses E-cadherin
transcription and activates adjacent replication origins. J Cell
Biol. 195:1123–1140. 2011. View Article : Google Scholar : PubMed/NCBI
|
|
72
|
Zhang X, Xiao D, Wang Z, Zou Y, Huang L,
Lin W, Deng Q, Pan H, Zhou J, Liang C and He J: MicroRNA-26a/b
regulate DNA replication licensing, tumorigenesis, and prognosis by
targeting CDC6 in lung cancer. Mol Cancer Res. 12:1535–1546. 2014.
View Article : Google Scholar : PubMed/NCBI
|
|
73
|
Mahadevappa R, Neves H, Yuen SM, Bai Y,
McCrudden CM, Yuen HF, Wen Q, Zhang SD and Kwok HF: The prognostic
significance of Cdc6 and Cdt1 in breast cancer. Sci Rep. 7:9852017.
View Article : Google Scholar : PubMed/NCBI
|