Introduction
Gastric cancer (GC) is the fifth most common
malignancy in the world, especially in developing countries
(1). GC has been the leading cause
of cancer death worldwide until the mid-1990s, after which the
occurrence has been substantially declining. However, certain
countries in Eastern Asia, such as China, Korea and Japan, remain
as highly endemic areas (2). In
China, the 5-year survival rate of GC has improved 16% for patients
diagnosed during 1995–2009 (3).
However, GC is still the third leading cause of cancer death in the
world and its prognosis is relatively poor (1).
In recent years, a growing number of researchers
devoted to GC research and achieved considerable achievements. In
the previous studies, various molecular mechanisms and biomarkers
related to GC have been identified. Through a retrospective study,
Pectasides et al (4) found
that using carcinoembryonic antigen (CEA), carbohydrate antigen
19-9 (CA 19-9) and carbohydrate antigen 50 (CA-50) as GC biomarkers
had significant value in early detection of recurrence and
monitoring progression. Ara et al (5), discovered that non-canonical Wnt
signaling pathway contributed to GC progression, which may serve as
a new potential therapeutic target for GC. Despite of these
advances, the mechanisms of GC occurrence and development are yet
to be clearly elaborated. Furthermore, the biomarkers commonly used
for GC diagnosis and treatment, including carbohydrate antigen 125
(CA125), CA19-9 and CEA, have significant sensitivity and
specificity issues (6). As such,
further research on revealing genetic alterations, identification
of new biomarkers and exploration of pathways associated with GC is
critically needed.
DNA microarray analysis is a rather powerful method
to screen out cancer-related genes as novel diagnostic and
prognostic markers and disclose genetic alterations of cancer
evolution and progression. For example, Yang et al (7) found that Chromogranin A (CHGA) and
Thy-1 cell surface antigen (THY1) were novel biomarkers in the
diagnosis of cancer via DNA microarray analysis. Similarly, Sun
et al (8) identified the
COL family as promising prognostic markers for GC. Often used in
combination with DNA microarray analysis, gene ontology (GO)
enrichment analysis is a strategy to characterize the function
categories affected by cancer and Kyoto Encyclopedia of Genes and
Genomes (KEGG) pathway enrichment analysis is an approach used to
find out biologic pathways enriched in cancer. For example, with
the above analysis methods, Hu et al (9) confirmed that several pathways,
including focal adhesion, ECM-receptor interactions and the
metabolism of xenobiotics by cytochrome P450, were associated with
the progression of GC. Another important technique, modules
analysis, is more crucial to study the specific behavior of modules
and identify functional genes as cancer biomarkers compared with
genes with straightforward high interaction degree (10).
In the present study, we selected expression profile
(GSE79973) to perform DNA microarray analysis to reveal genetic
alterations, identify new biomarkers and explore novel pathways
associated with GC. In addition to biomarkers previously reported,
we identified four novel biomarkers, COL12A1, GSTA3, FGA,
and FGG, as significant poor prognostic factors. Most of the
enriched GO terms and KEGG pathways of those genes are related to
GC, such as chemical carcinogenesis, metabolism of xenobiotics by
cytochrome P450, ECM-receptor interaction, focal adhesion, and
platelet activation. These findings may provide insights on GC
occurrence and development, as well as potential therapeutic
targets for future research.
Materials and methods
Microarray data
To account for tumor heterogeneity, we conducted DNA
microarray analysis with the new gene profiles, GSE79973, to
identify genes as novel biomarkers. In the present study, the
expression profiles associated with GC, GSE79973, were downloaded
from GEO (www.ncbi.nlm.nih.gov/geo/), which is a public
functional genomic data repository. GSE79973 containing 20 tissues
(10 pairs of GC tissues and adjacent non-tumor tissues) were
obtained from Zhejiang Provincial People's Hospital, Zhejiang,
China. The platform was based on GPL570 [HG-U133_Plus_2] Affymetrix
Human Genome U133 Plus 2.0.
Preprocess microarray data
The Microarray Data was preprocessed by affy package
in R (11). The purpose of this
step was to filter out unwanted noise of the raw microarray and
ensure background and data were standardized (12). Furthermore, for these genes that
corresponded with multiple probes, we used the average expression
values of those probes as the expression value of each gene.
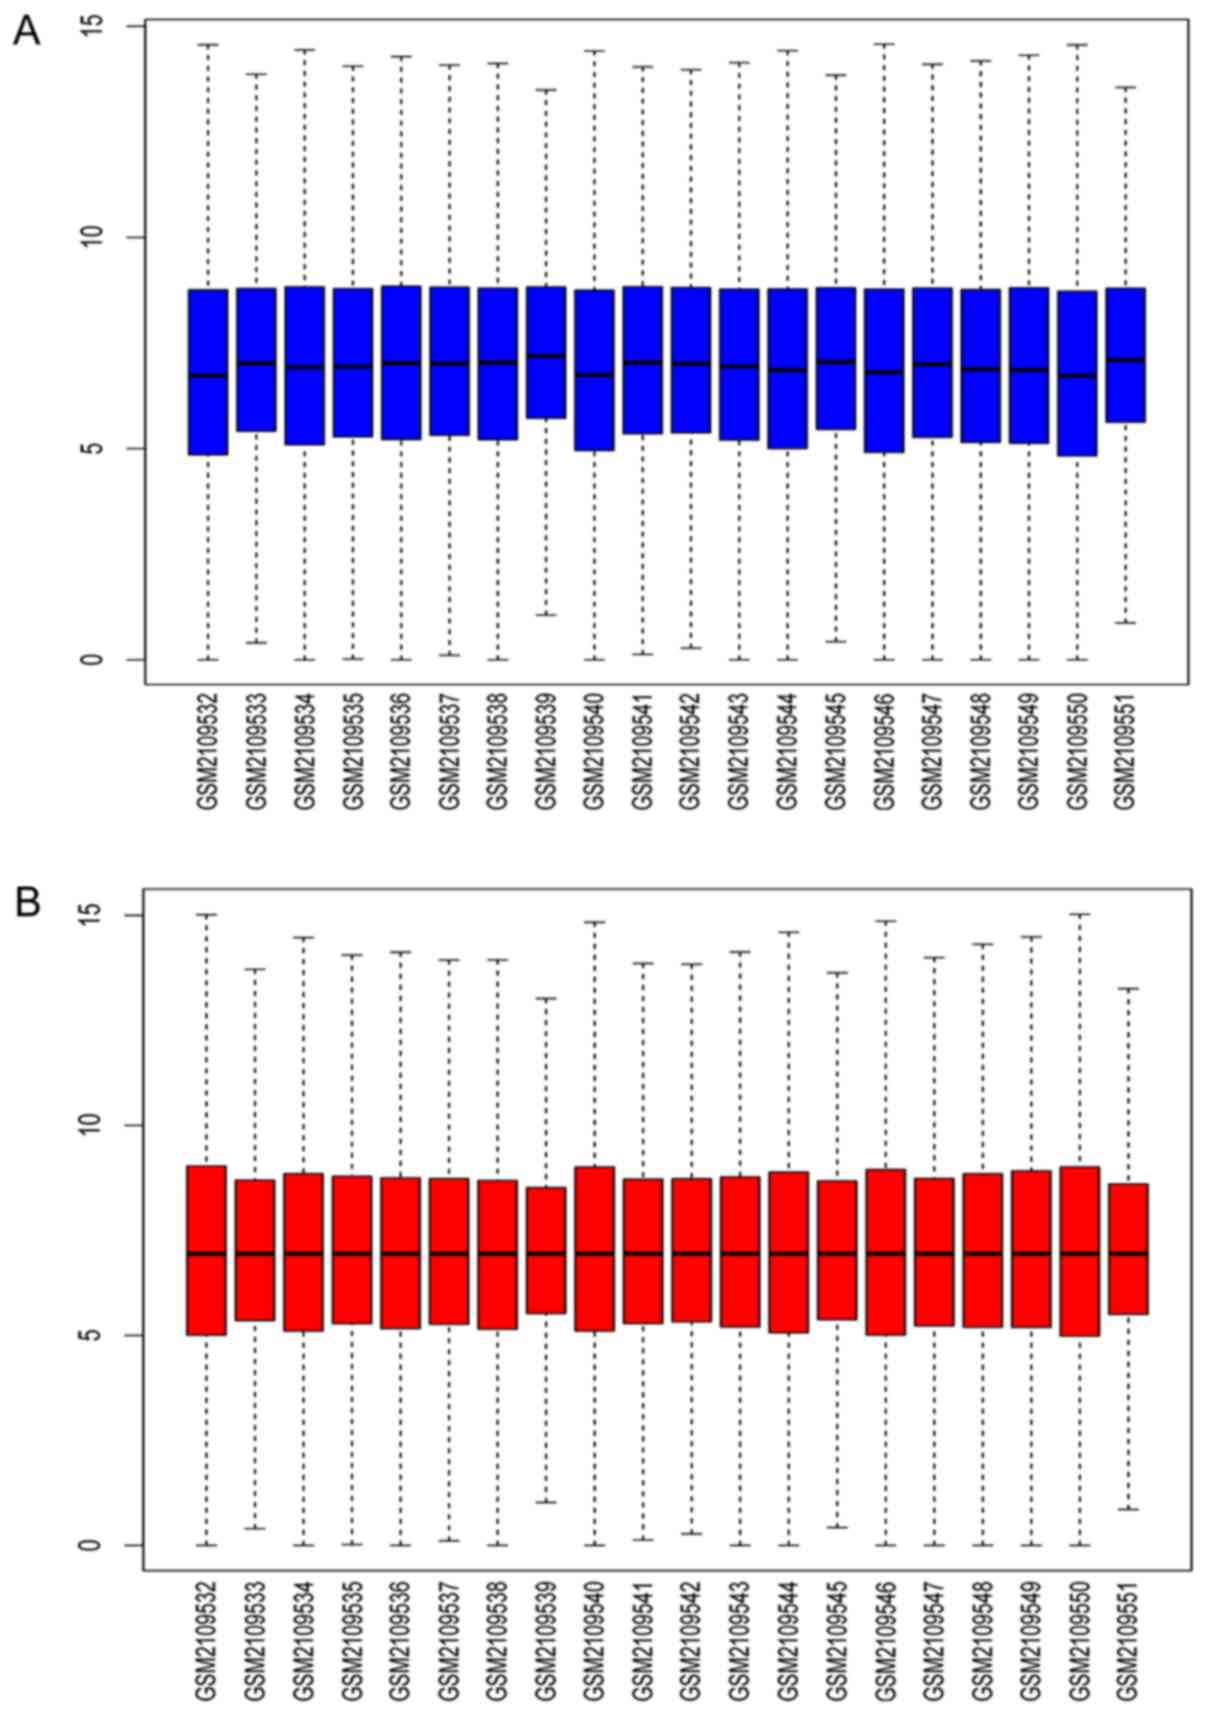
Furthermore, to visualize the difference before and after
normalization, we constructed box plots of raw and normalization
data.
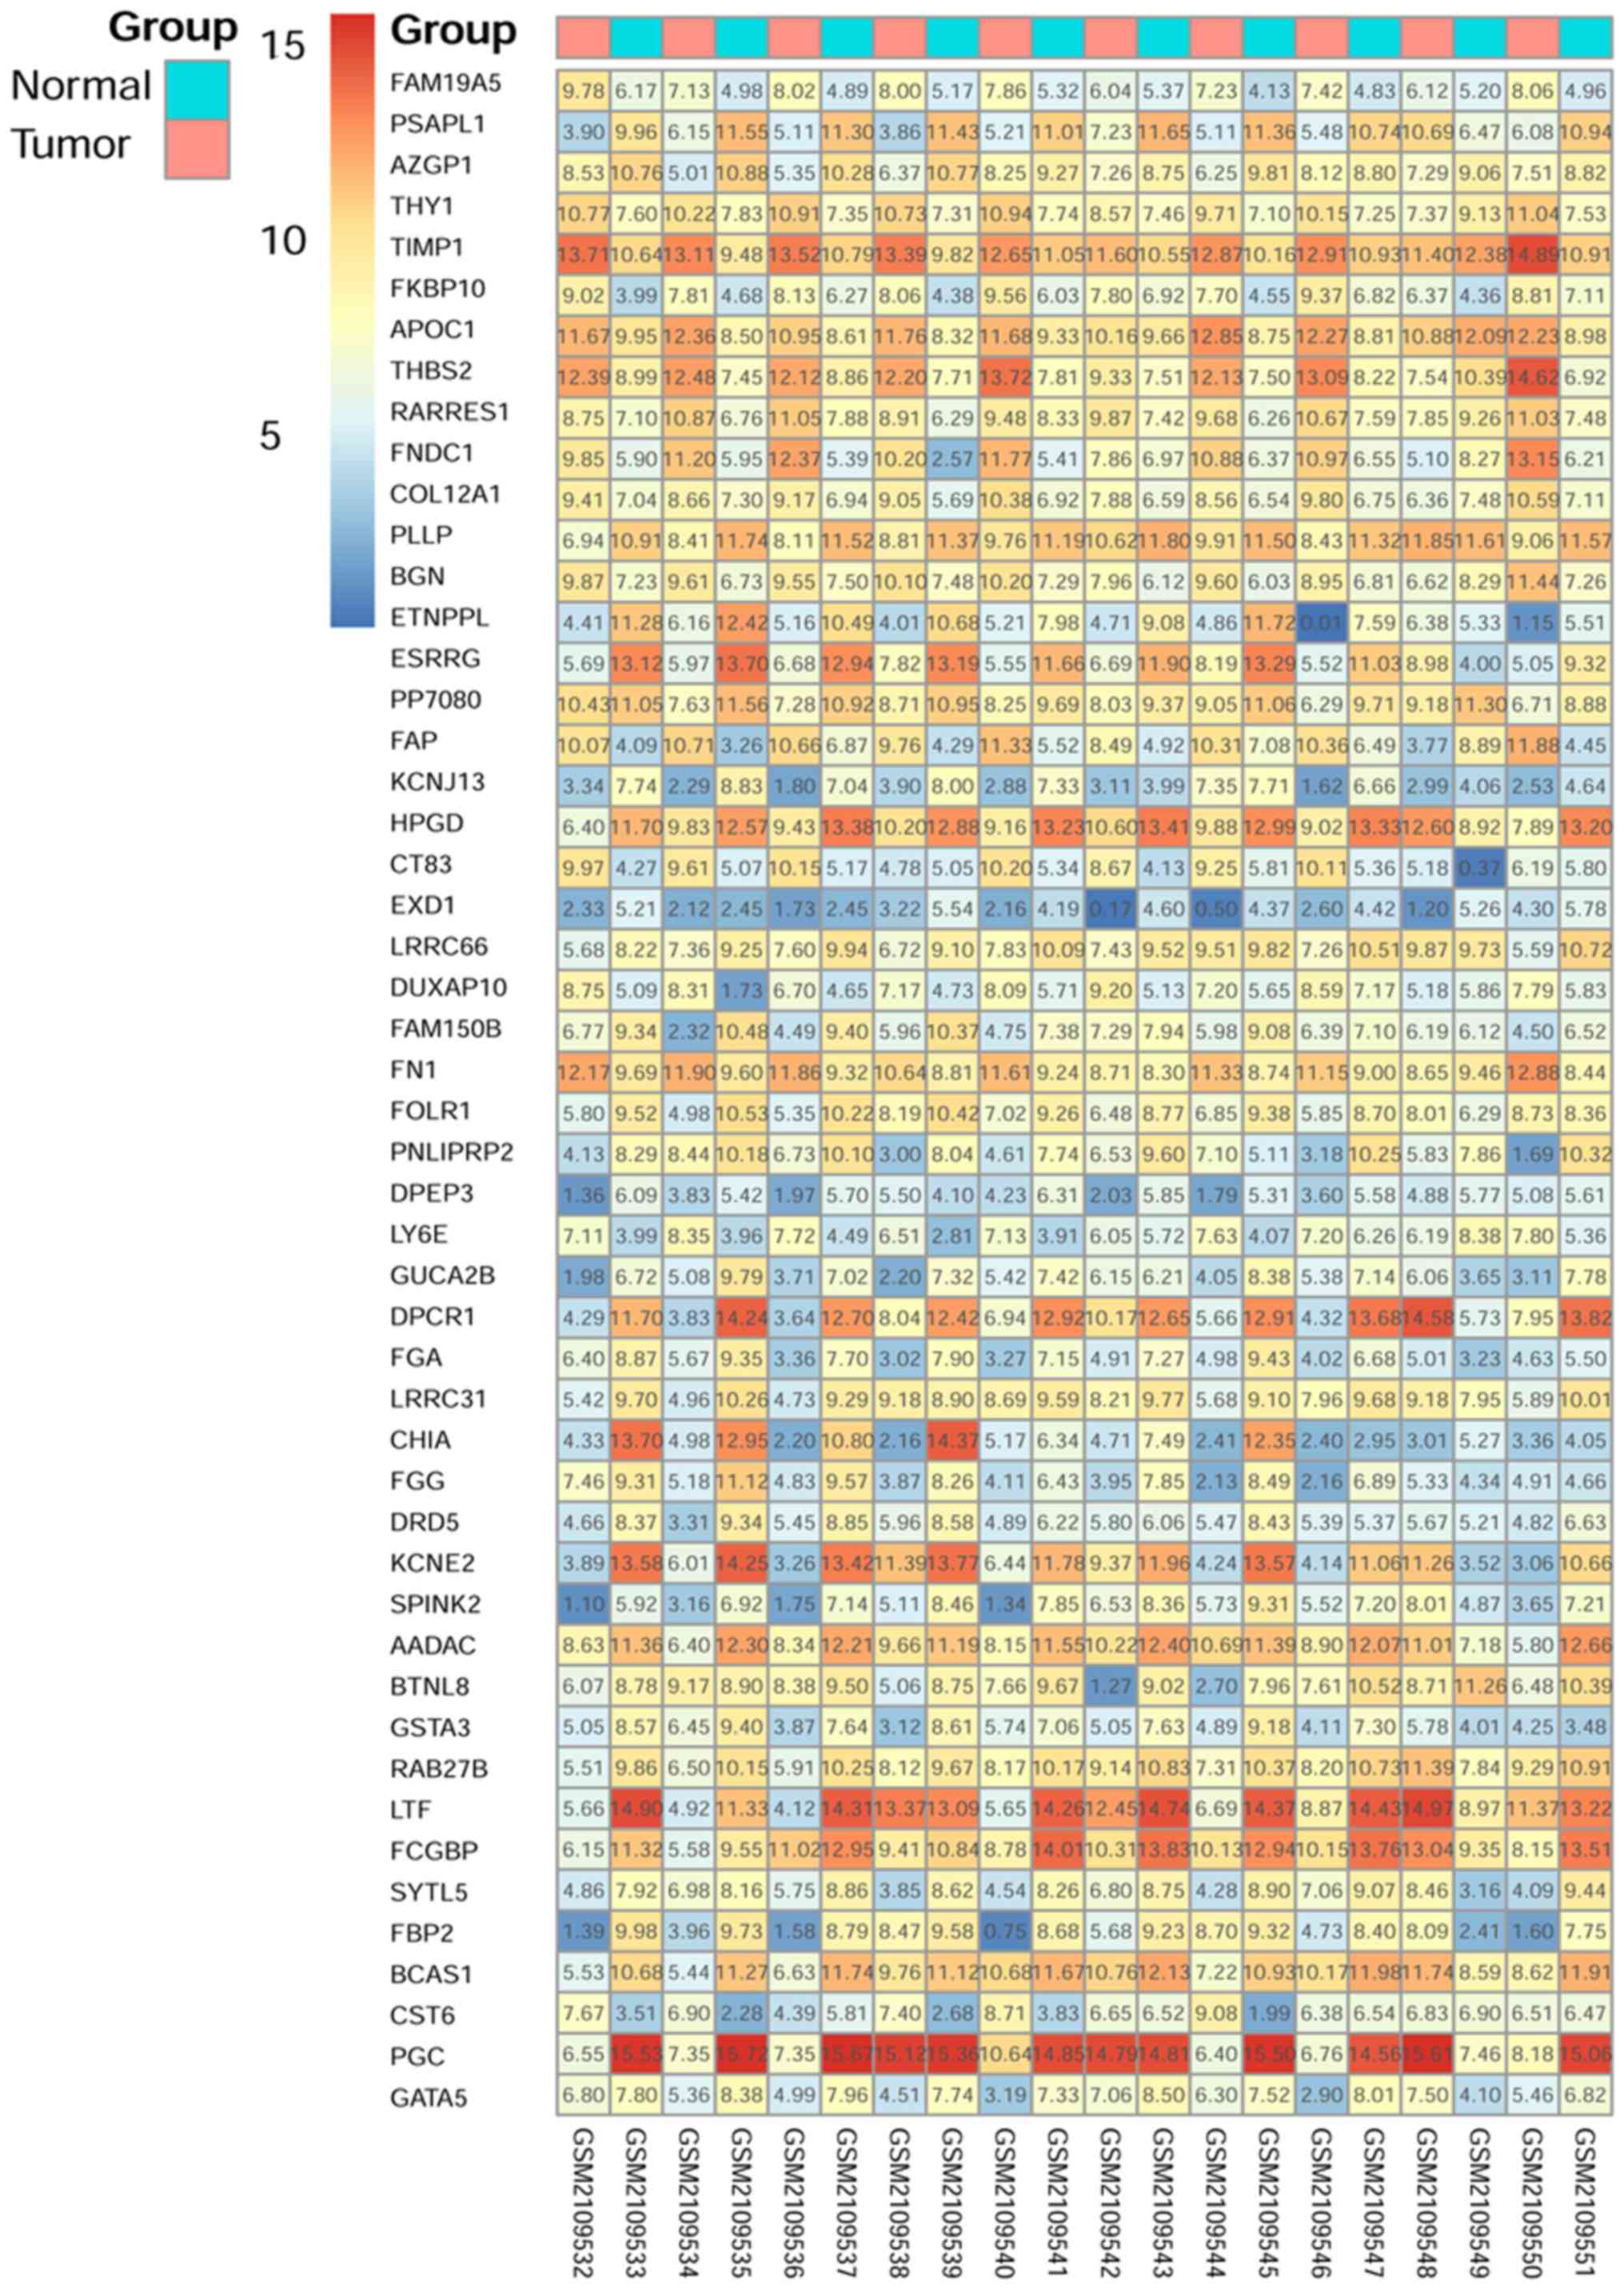
Identification of the DEGs
Using LIMMA package in R, we collected a data list
from GSE79973 (13). We then
screened out these DEGs by means of t-test with P-value <0.05
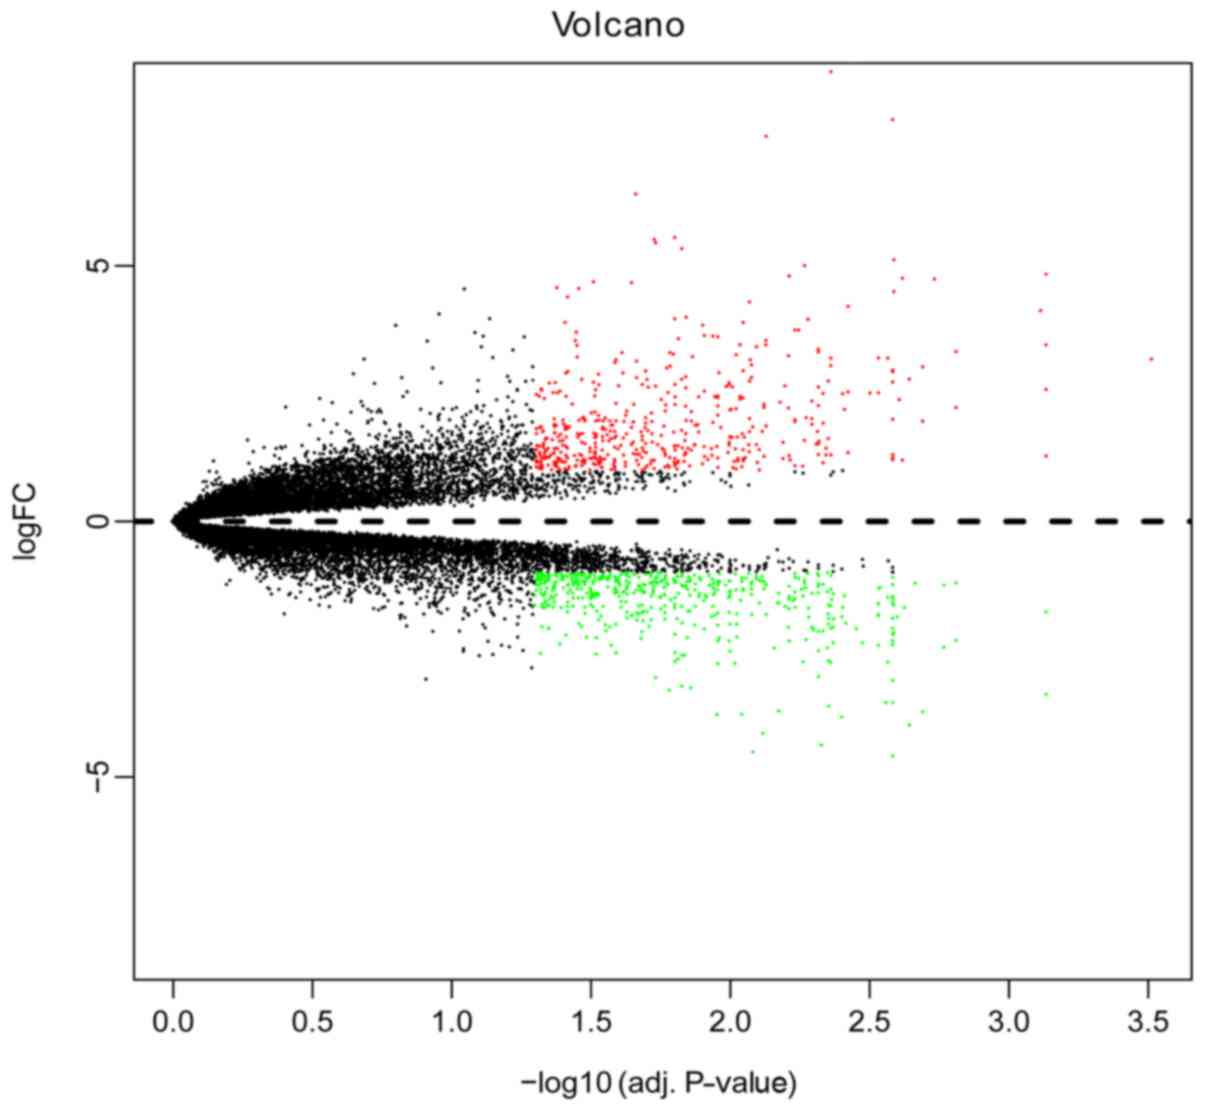
and |log2(fold change) |>2. The heatmap and volcano map of these
DEGs were constructed using pheatmap package in R and gplots
package in R, respectively.
GO terms and KEGG pathways of
DEGs
To elaborate how DEGs affected the GC cells, GO and
KEGG pathway enrichment analyses of DEGs were conducted using DAVID
(david.abcc.ncifcrf.gov/). The DAVID
database includes a total of four modules (functional annotation,
gene functional classification, gene ID conversion and gene name
batch viewer). The database for annotation was used in the presnt
study. The GO terms and pathways of DEGs with P<0.05 and at
least five genes were screened out as significant function
annotation of DEGs.
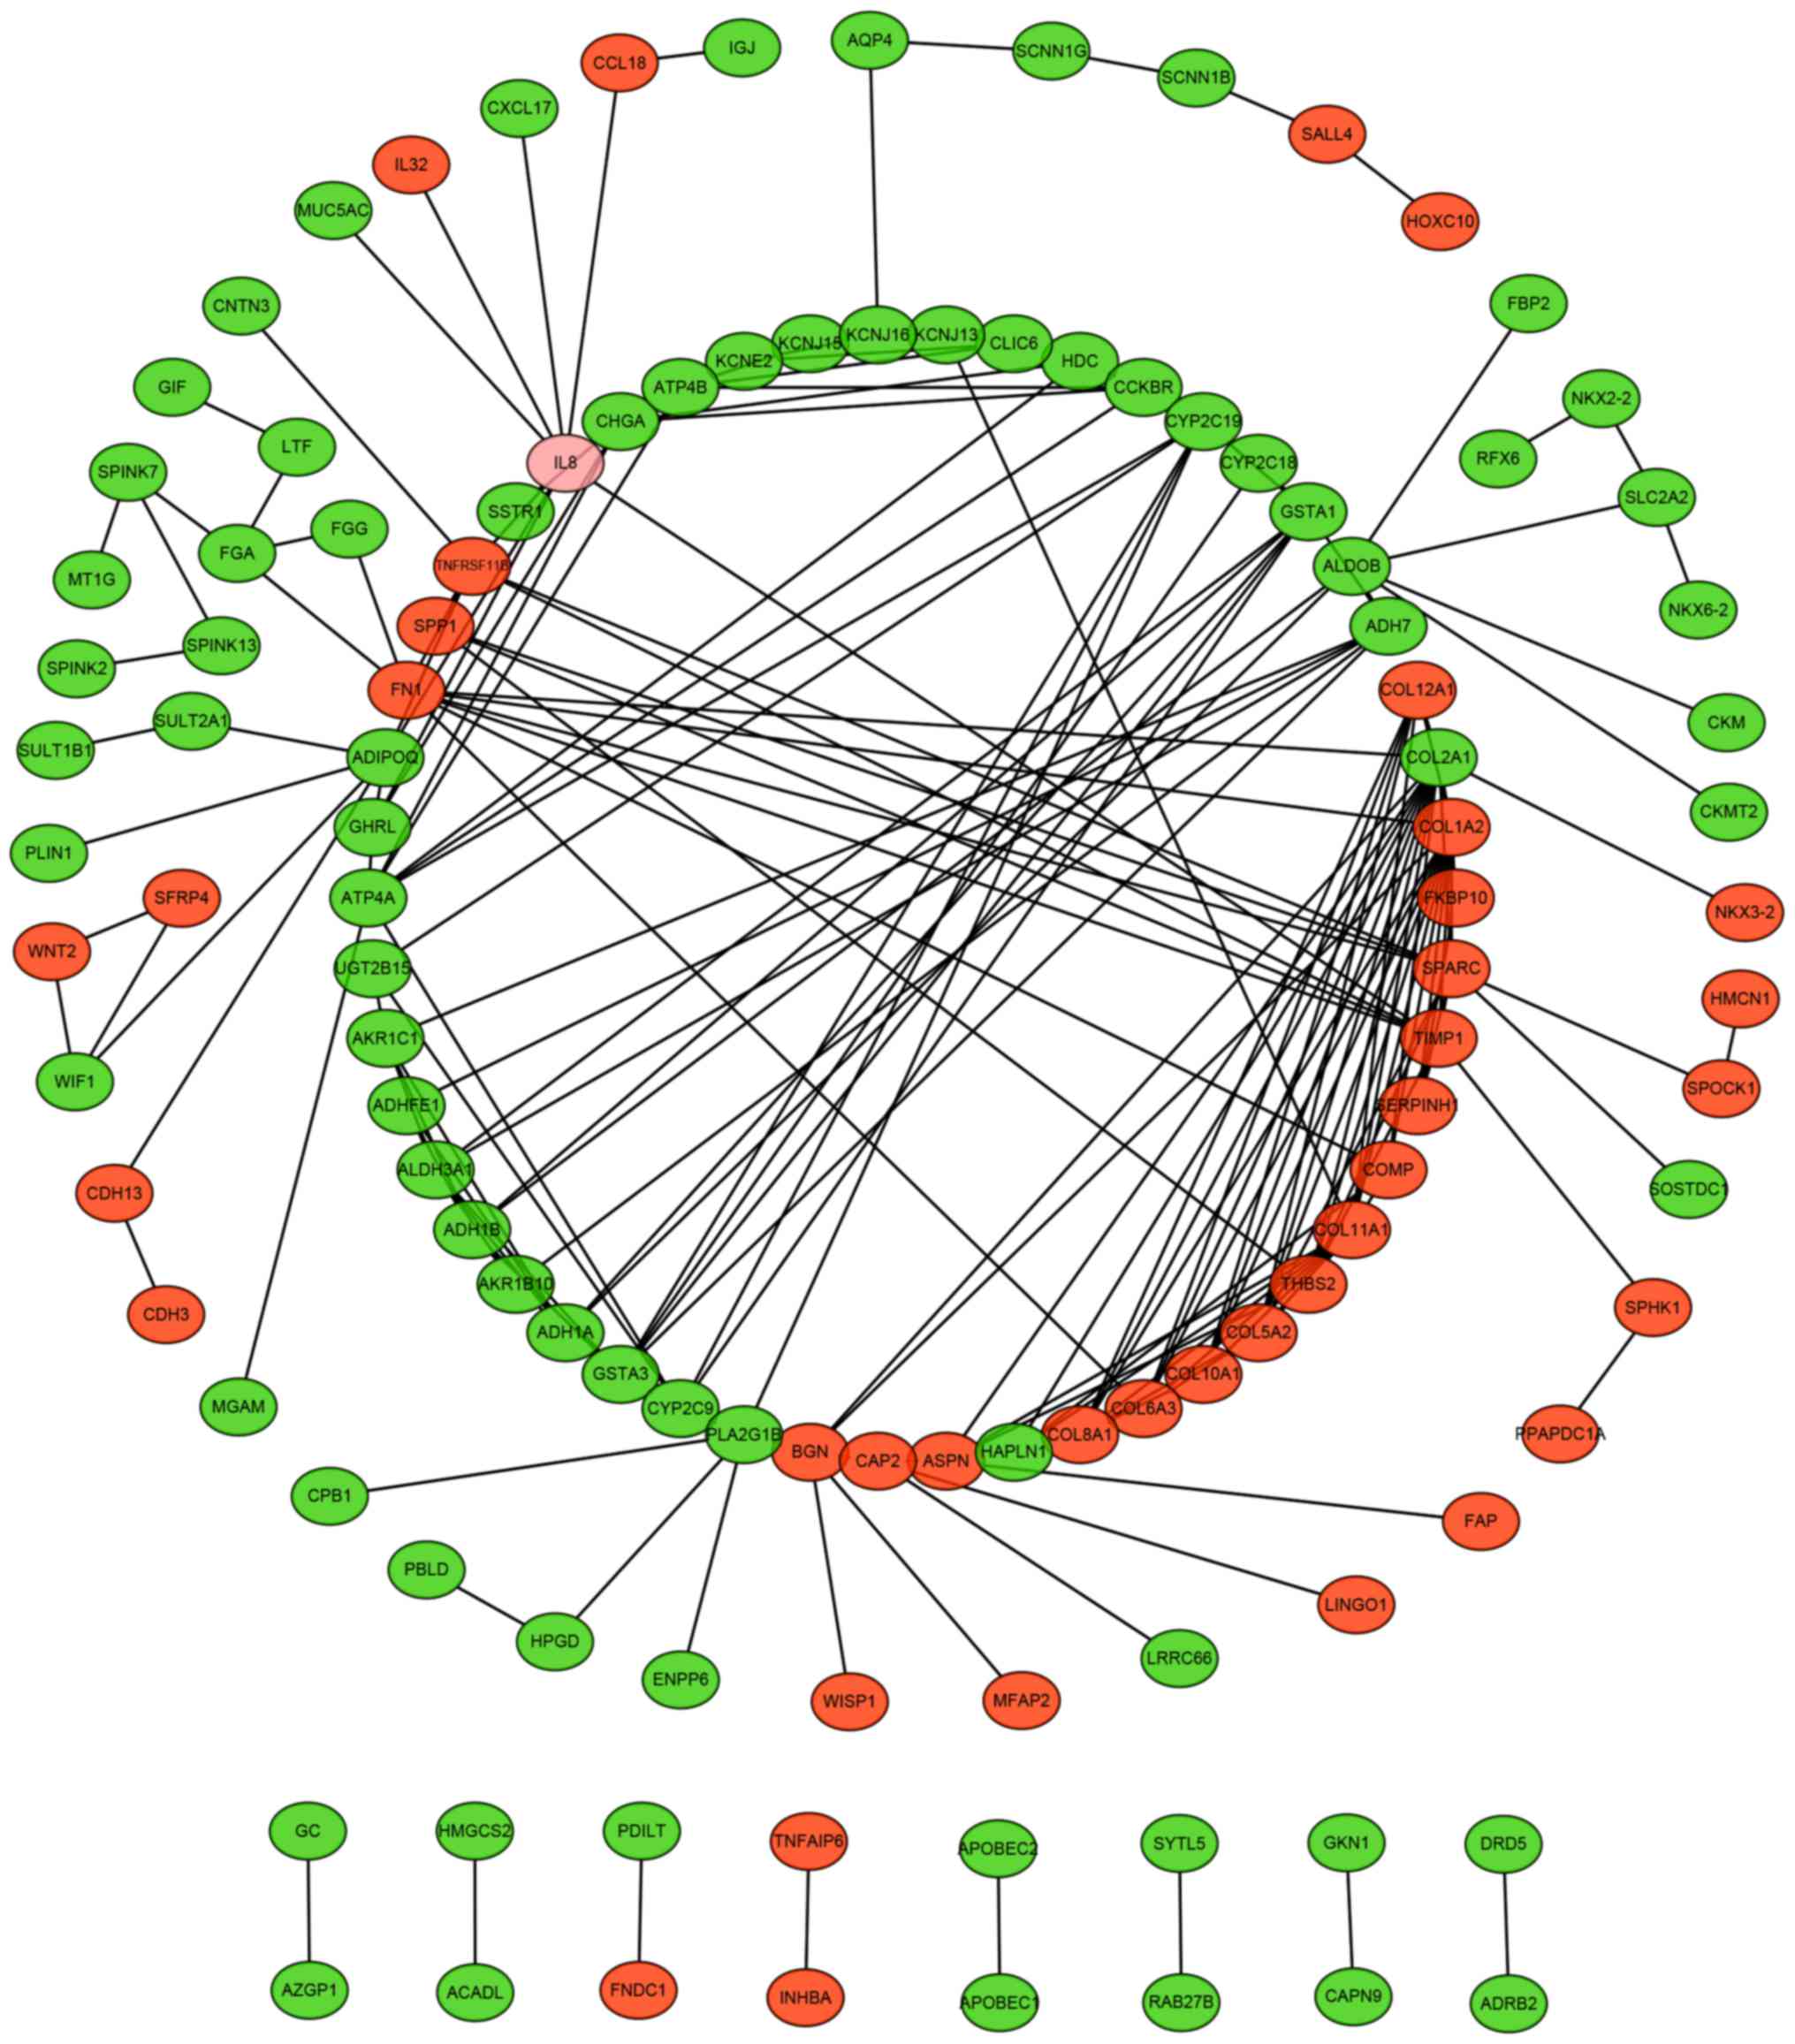
PPI network analysis of the DEGs
To study the molecular interactions between DEGs, we
built the PPI network using the STRING (www.string-db.org/) database (14). The PPI network includes direct
(physical) and indirect (functional) associations and stem from
computational prediction, knowledge transfer between organisms, and
interactions aggregated from other (primary) databases. Using the
STRING database, we could obtain certain integrated scores of
interactions among DEGs and select out the genes whose integrated
scores were bigger than 0.4 (the default threshold in the STRING
database). The PPI networks were then visualized by the Cytoscape
software (15).
Sub-network modeling analysis of PPI
networks
In PPI networks, genes in the same module typically
show the same or similar function and work together to implement
their biological function. To visualize the network and identify
the modules in the network, MCODE plug-in on the Cytospace software
(www.cytoscape.org/) was used. The
parameters were set as follows: Degree cutoff ≥2 (degrees of each
node in module were at least larger than 2), K-core ≥2 (subgraphs
of each node in module were at least more than 2). After that, the
GO enrichment analysis was performed using DAVID and the functional
core genes of subsets were selected in each module.
Survival analysis of core genes
The survival analysis of core genes was conducted by
Kaplan-Meier plotter (KM plotter, www.kmplot.com), whose gene expression data as well as
relapse free and overall survival information are downloaded from
the well-known public database, including GEO (Affymetrix
microarrays only), EGA and TCGA. The Kaplan Meier (KM) plotter is
capable of assessing the effect of 54,675 genes on survival using
10,461 cancer samples, 1,065 of which are GC patients with a mean
follow-up of 69/40/49/33 months. Based on the KM plotter on the
webpage, the hazard ratio (HR) with 95% confidence intervals and
log rank P-values were calculated and the curves were
generated.
Results
Data preprocessing
Genes with systematic bias among original data were
removed after preprocessing using the Affy package in R software.
The expression data of genes before and after normalization are
shown in Fig. 1. The black lines
in each of the boxes represent the medians of each dataset. The
black lines are shown at almost the same level in the box plots,
indicating a significant effect of standardization.
Get the DEGs
Using the R package LIMMA, we identified the DEGs
between the GC and normal samples. A total of 256 DEGs in the data
list were identified from GSE79973, including 169 down-regulated
and 87 up-regulated genes. We ranked these DEGs by P-value and
constructed the heatmap (Fig. 2)
as well as volcano map (Fig. 3).
Based on the heatmap and volcano map, the gene expressions of these
DEGs exhibit significant differences.
GO term enrichment analysis of the
DEGs
Using the DAVID and pathway enrichment analysis of
the DEGs, we identified a total of 100 GO terms and 16 pathways.
The top 10 enriched GO terms of the DEGs based on the P-values are
listed (Table I). As shown in
Table I, DEGs were significantly
enriched in biological processes (BP), including extracellular
matrix organization, skeletal system development, cell adhesion and
xenobiotic metabolic process. For molecular function (MF), DEGs
were significantly enriched in extracellular matrix structural
constituent and extracellular matrix binding. In addition, GO cell
component (CC) analysis indicated that the DEGs were significantly
enriched in extracellular space, extracellular region,
proteinaceous extracellular matrix and collagen trimer.
 | Table I.Top 10 enriched GO terms, which were
sorted by P-value in ascending order. |
Table I.
Top 10 enriched GO terms, which were
sorted by P-value in ascending order.
| Category | GO ID | GO name | P-value | Gene number |
|---|
| CC | GO:0005615 | Extracellular
space |
1.07×10⁻¹⁵ | 55 |
| CC | GO:0005576 | Extracellular
region |
4.88×10⁻¹⁵ | 59 |
| BP | GO:0030198 | Extracellular
matrix organization |
1.99×10⁻¹¹ | 19 |
| CC | GO:0005578 | Proteinaceous
extracellular matrix |
3.87×10⁻⁹ | 19 |
| CC | GO:0005581 | Collagen
trimer |
1.12×10⁻⁸ | 12 |
| BP | GO:0001501 | Skeletal system
development |
9.95×10⁻⁹ | 14 |
| BP | GO:0007155 | Cell adhesion |
2.95×10⁻⁸ | 23 |
| MF | GO:0005201 | Extracellular
matrix structural constituent |
9.78×10⁻⁷ | 9 |
| BP | GO:0006805 | Xenobiotic
metabolic process |
3.84×10⁻⁵ | 8 |
| MF | GO:0050840 | Extracellular
matrix binding |
2.09×10⁻⁴ | 5 |
KEGG pathway analysis of the DEGs
A total of 16 enriched pathways with P<0.05 were
shown in Table II. The first
enriched pathway, chemical carcinogenesis, was directly related to
cancer and all the others have been reported to play an important
role in cancer progression via certain biological processes, such
as protein digestion and absorption, metabolism of xenobiotics by
cytochrome P450, ECM-receptor interaction, focal adhesion,
metabolic pathways, and platelet activation.
| Table II.KEGG pathways enriched in DEGs. |
Table II.
KEGG pathways enriched in DEGs.
| Category | Pathway name | Gene number | P-value |
|---|
| KEGG_PATHWAY | hsa05204:Chemical
carcinogenesis | 11 |
1.65×10⁻⁷ |
| KEGG_PATHWAY | hsa04974:Protein
digestion and absorption | 11 |
4.12×10⁻⁷ |
| KEGG_PATHWAY | hsa00980:Metabolism
of xenobiotics by cytochrome P450 | 10 |
9.02×10⁻⁷ |
| KEGG_PATHWAY |
hsa04512:ECM-receptor interaction | 10 |
3.59×10⁻⁶ |
| KEGG_PATHWAY | hsa00982:Drug
metabolism-cytochrome P450 | 9 |
4.86×10⁻⁶ |
| KEGG_PATHWAY | hsa00830:Retinol
metabolism | 7 |
3.10×10⁻⁴ |
| KEGG_PATHWAY | hsa04971:Gastric
acid secretion | 7 |
5.83×10⁻⁴ |
| KEGG_PATHWAY |
hsa00010:Glycolysis/Gluconeogenesis | 6 | 0.0027 |
| KEGG_PATHWAY | hsa04510:Focal
adhesion | 10 | 0.0027 |
| KEGG_PATHWAY | hsa04978:Mineral
absorption | 5 | 0.0041 |
| KEGG_PATHWAY | hsa00350:Tyrosine
metabolism | 4 | 0.0134 |
| KEGG_PATHWAY |
hsa05146:Amoebiasis | 6 | 0.0177 |
| KEGG_PATHWAY | hsa00071:Fatty acid
degradation | 4 | 0.0247 |
| KEGG_PATHWAY | hsa01100:Metabolic
pathways | 26 | 0.0379 |
| KEGG_PATHWAY | hsa04611:Platelet
activation | 6 | 0.0383 |
| KEGG_PATHWAY | hsa04972:Pancreatic
secretion | 5 | 0.0440 |
PPI network of DEGs
The whole PPI network shown in Fig. 4 contained 116 nodes and 197 edges.
The nodes represent DEGs with higher integrated scores of
interactions and the edges represent interactions among the DEGs.
The genes with interaction degree ≥5 were shown in Table III. COL1A2, COL2A1,
COL11A1 and SPARC, whose corresponding degree was beyond
10, were hub genes in the PPI network and closely related to
cancer.
| Table III.Core genes with corresponding degree
≥5. |
Table III.
Core genes with corresponding degree
≥5.
| Gene | Degree |
|---|
| COL1A2 | 15 |
| COL2A1 | 15 |
| COL11A1 | 12 |
| SPARC | 11 |
| COL5A2 | 9 |
| FN1 | 9 |
| IL8 | 9 |
| TIMP1 | 9 |
| ALDH3A1 | 8 |
| ATP4A | 8 |
| COL6A3 | 8 |
| GSTA1 | 8 |
| GSTA3 | 8 |
| THBS2 | 8 |
| ADH1A | 7 |
| ADH1B | 7 |
| ADH7 | 7 |
| ADIPOQ | 7 |
| ALDOB | 7 |
| COL10A1 | 7 |
| COL12A1 | 7 |
| COL8A1 | 7 |
| TNFRSF11B | 7 |
| BGN | 6 |
| CYP2C19 | 6 |
| CYP2C9 | 6 |
| PLA2G1B | 6 |
| AKR1C1 | 5 |
| ASPN | 5 |
| CHGA | 5 |
| COMP | 5 |
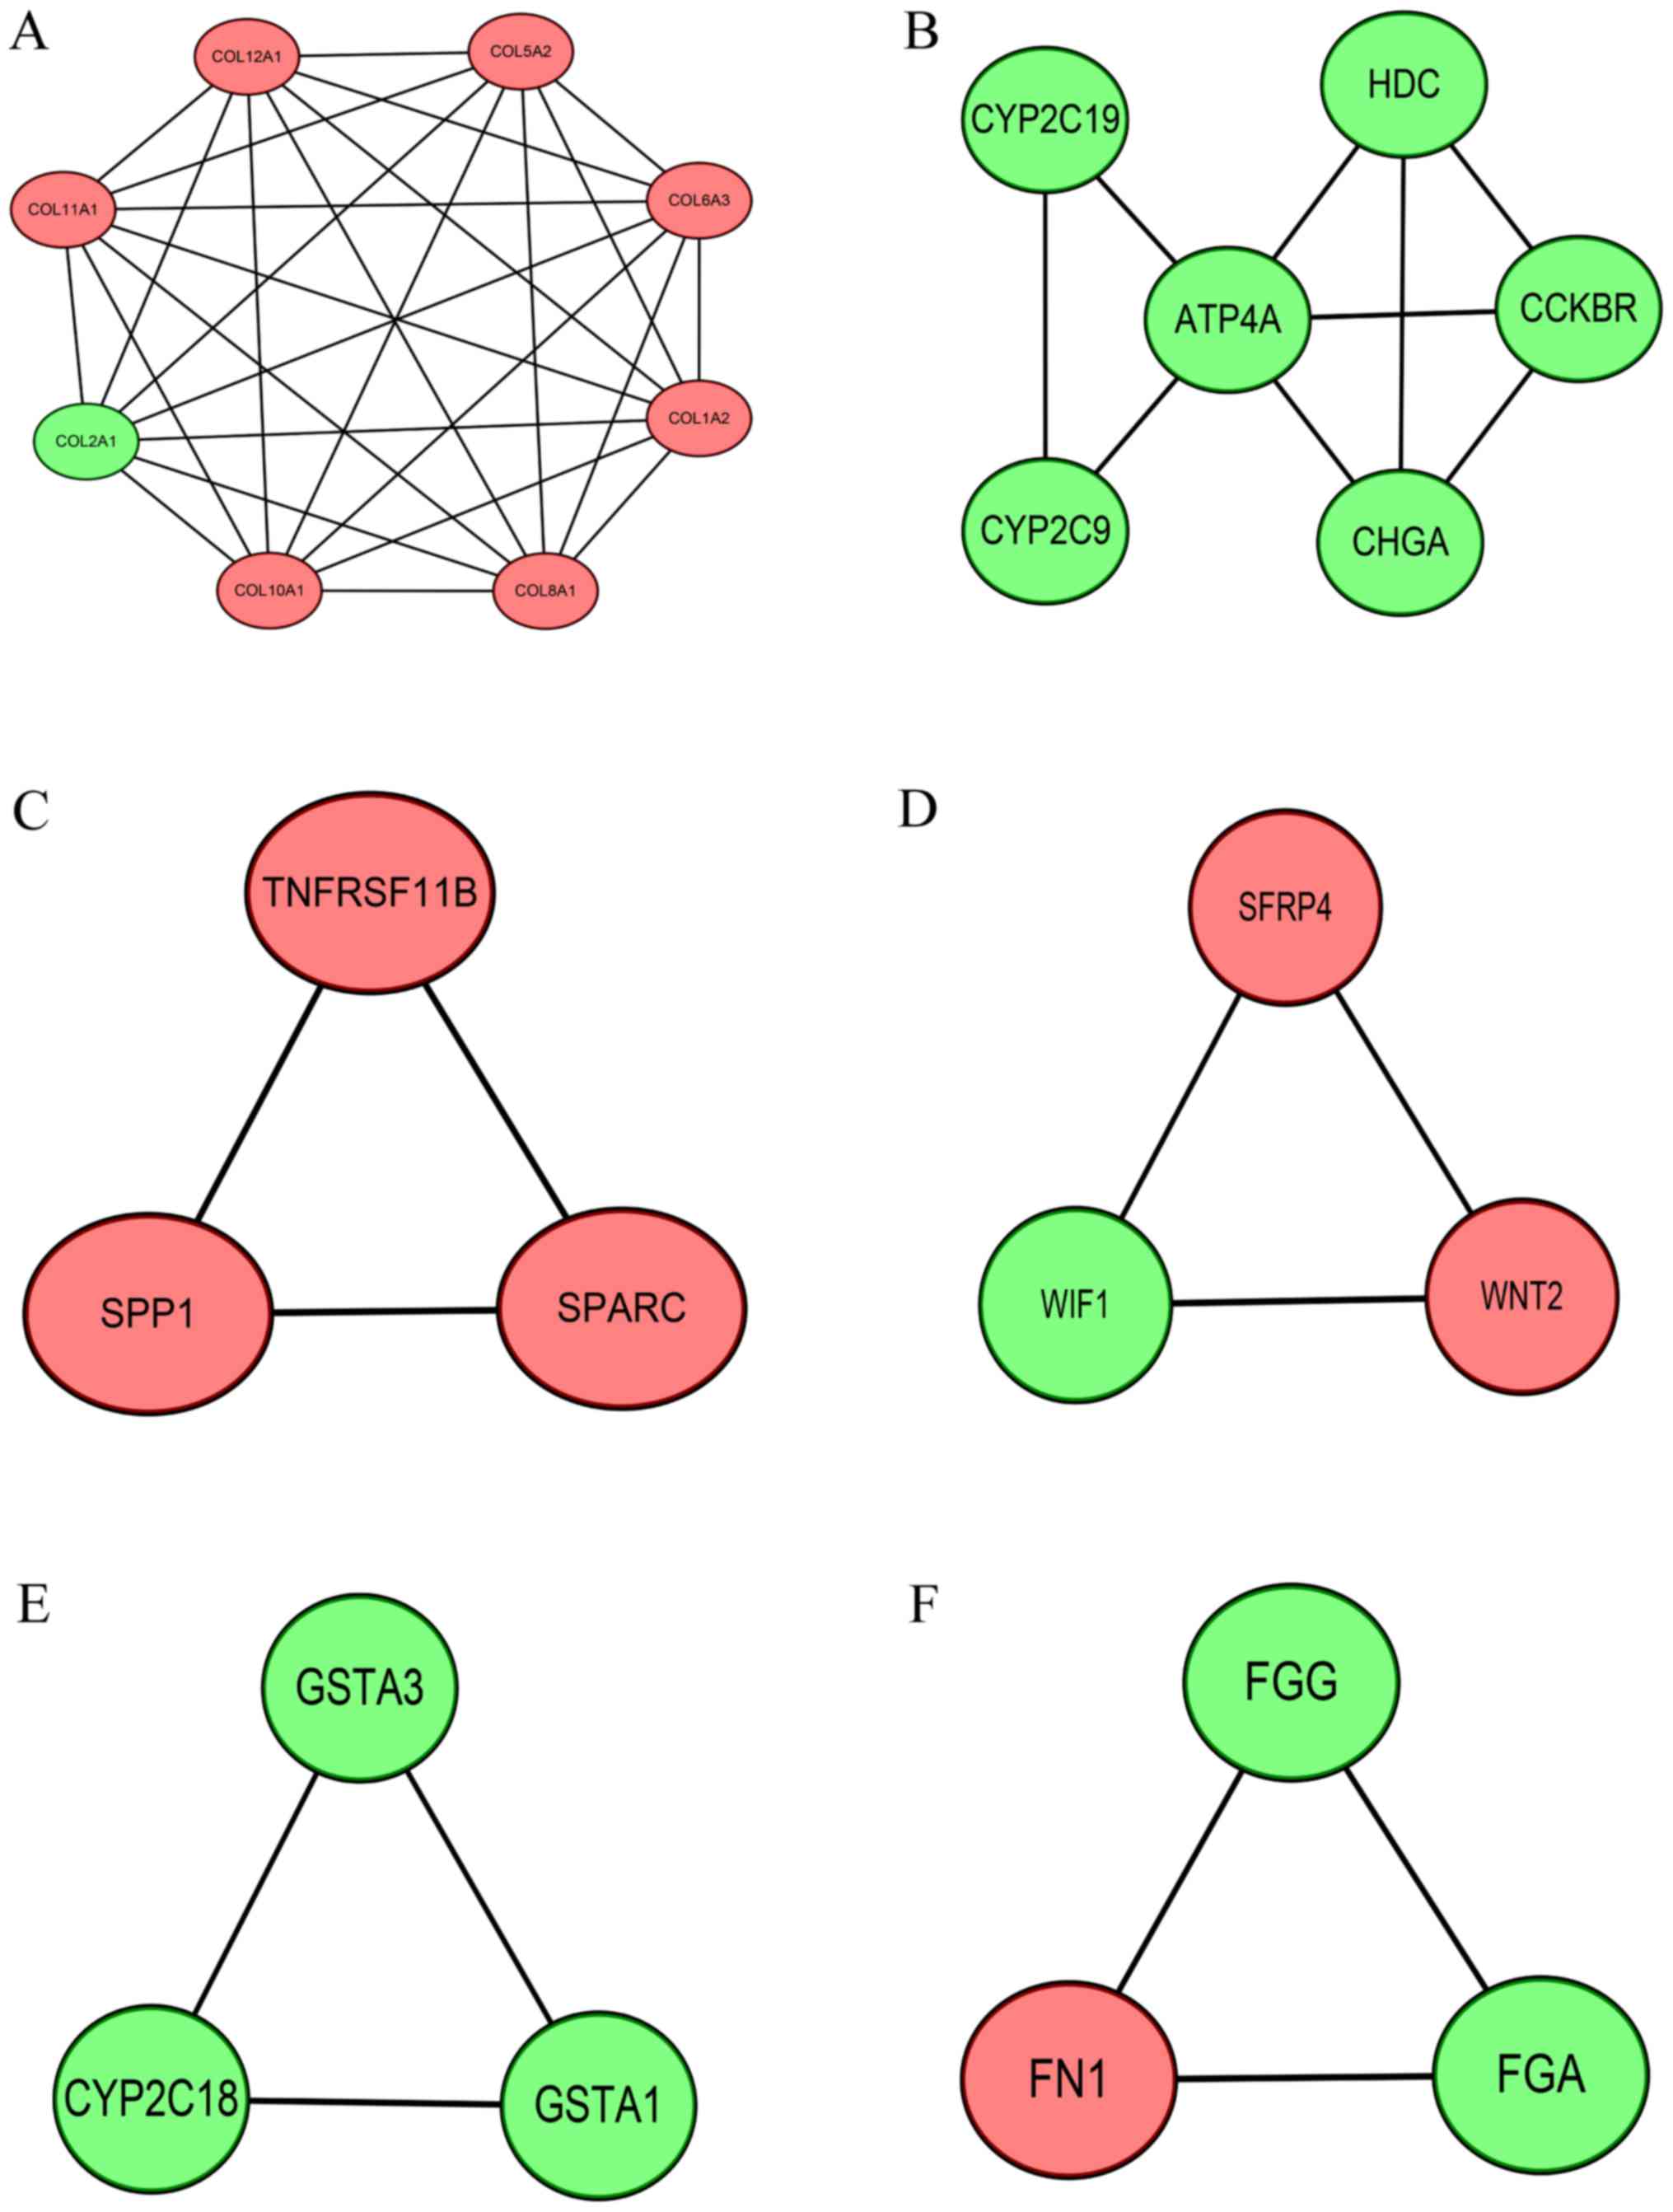
Modules in PPI network
Six modules were identified in this study, including
8, 6, 3, 3, 3 and 3 genes, respectively (Fig. 5). The top three GO terms of each
modules are shown in Table IV.
Interestingly, the GO terms of these modules were mainly associated
with collagen trimer, (S)-limonene 7-monooxygenase activity,
extracellular matrix organization, multicellular organism
development, glutathione derivative biosynthetic process and
fibrinogen complex, respectively. Among the core genes involved in
these modules, COL12A1, GSTA3, FGA and FGG were
firstly reported to be associated with GC.
| Table IV.Top three GO terms in each
module. |
Table IV.
Top three GO terms in each
module.
| GOID | GO name | P-value | Genes ID |
|---|
| Module A |
|
0005581 | Collagen
trimer |
2.49×10⁻⁹ | COL6A3, COL1A2,
COL2A1, COL8A1, COL10A1 |
|
0030199 | Collagen fibril
organization |
1.17×10⁻⁷ | COL1A2, COL2A1,
COL5A2, COL11A1 |
|
0005201 | Extracellular
matrix structural constituent |
1.19×10⁻⁷ | COL1A2, COL2A1,
COL5A2, COL11A1 |
| Module B |
|
0018676 | (S)-limonene
7-monooxygenase activity |
4.74×10⁻⁴ | CYP2C19,
CYP2C9 |
|
0018675 | Limonene
6-monooxygenase activity |
4.74×10⁻⁴ | CYP2C19,
CYP2C9 |
|
0052741 | (R)-limonene
6-monooxygenase activity |
4.74×10⁻⁴ | CYP2C19,
CYP2C9 |
| Module C |
|
0030198 | Extracellular
matrix organization |
1.36×10⁻⁴ | TNFRSF11B, SPARC,
SPP1 |
|
0050840 | Extracellular
matrix binding | 0.0031 | SPARC, SPP1 |
|
0005615 | Extracellular
space | 0.0055 | TNFRSF11B, SPARC,
SPP1 |
| Module D |
|
0007275 | Multicellular
organism development |
9.61×10⁻⁴ | WNT2, SFRP4,
WIF1 |
|
0017147 | Wnt-protein
binding | 0.0037 | SFRP4, WIF1 |
|
0030178 | Negative regulation
of Wnt signaling pathway | 0.0062 | SFRP4, WIF1 |
| Module E |
|
1901687 | Glutathione
derivative biosynthetic process | 0.0026 | GSTA1, GSTA3 |
|
0004364 | Glutathione
transferase activity | 0.0041 | GSTA1, GSTA3 |
|
0006749 | Glutathione
metabolic process | 0.0067 | GSTA1, GSTA3 |
| Module F |
|
0005577 | Fibrinogen
complex |
2.17×10⁻⁷ | FGG, FGA, FN1 |
|
0031093 | Platelet α granule
lumen |
8.94×10⁻⁶ | FGG, FGA, FN1 |
|
0002576 | Platelet
degranulation |
3.73×10⁻⁵ | FGG, FGA, FN1 |
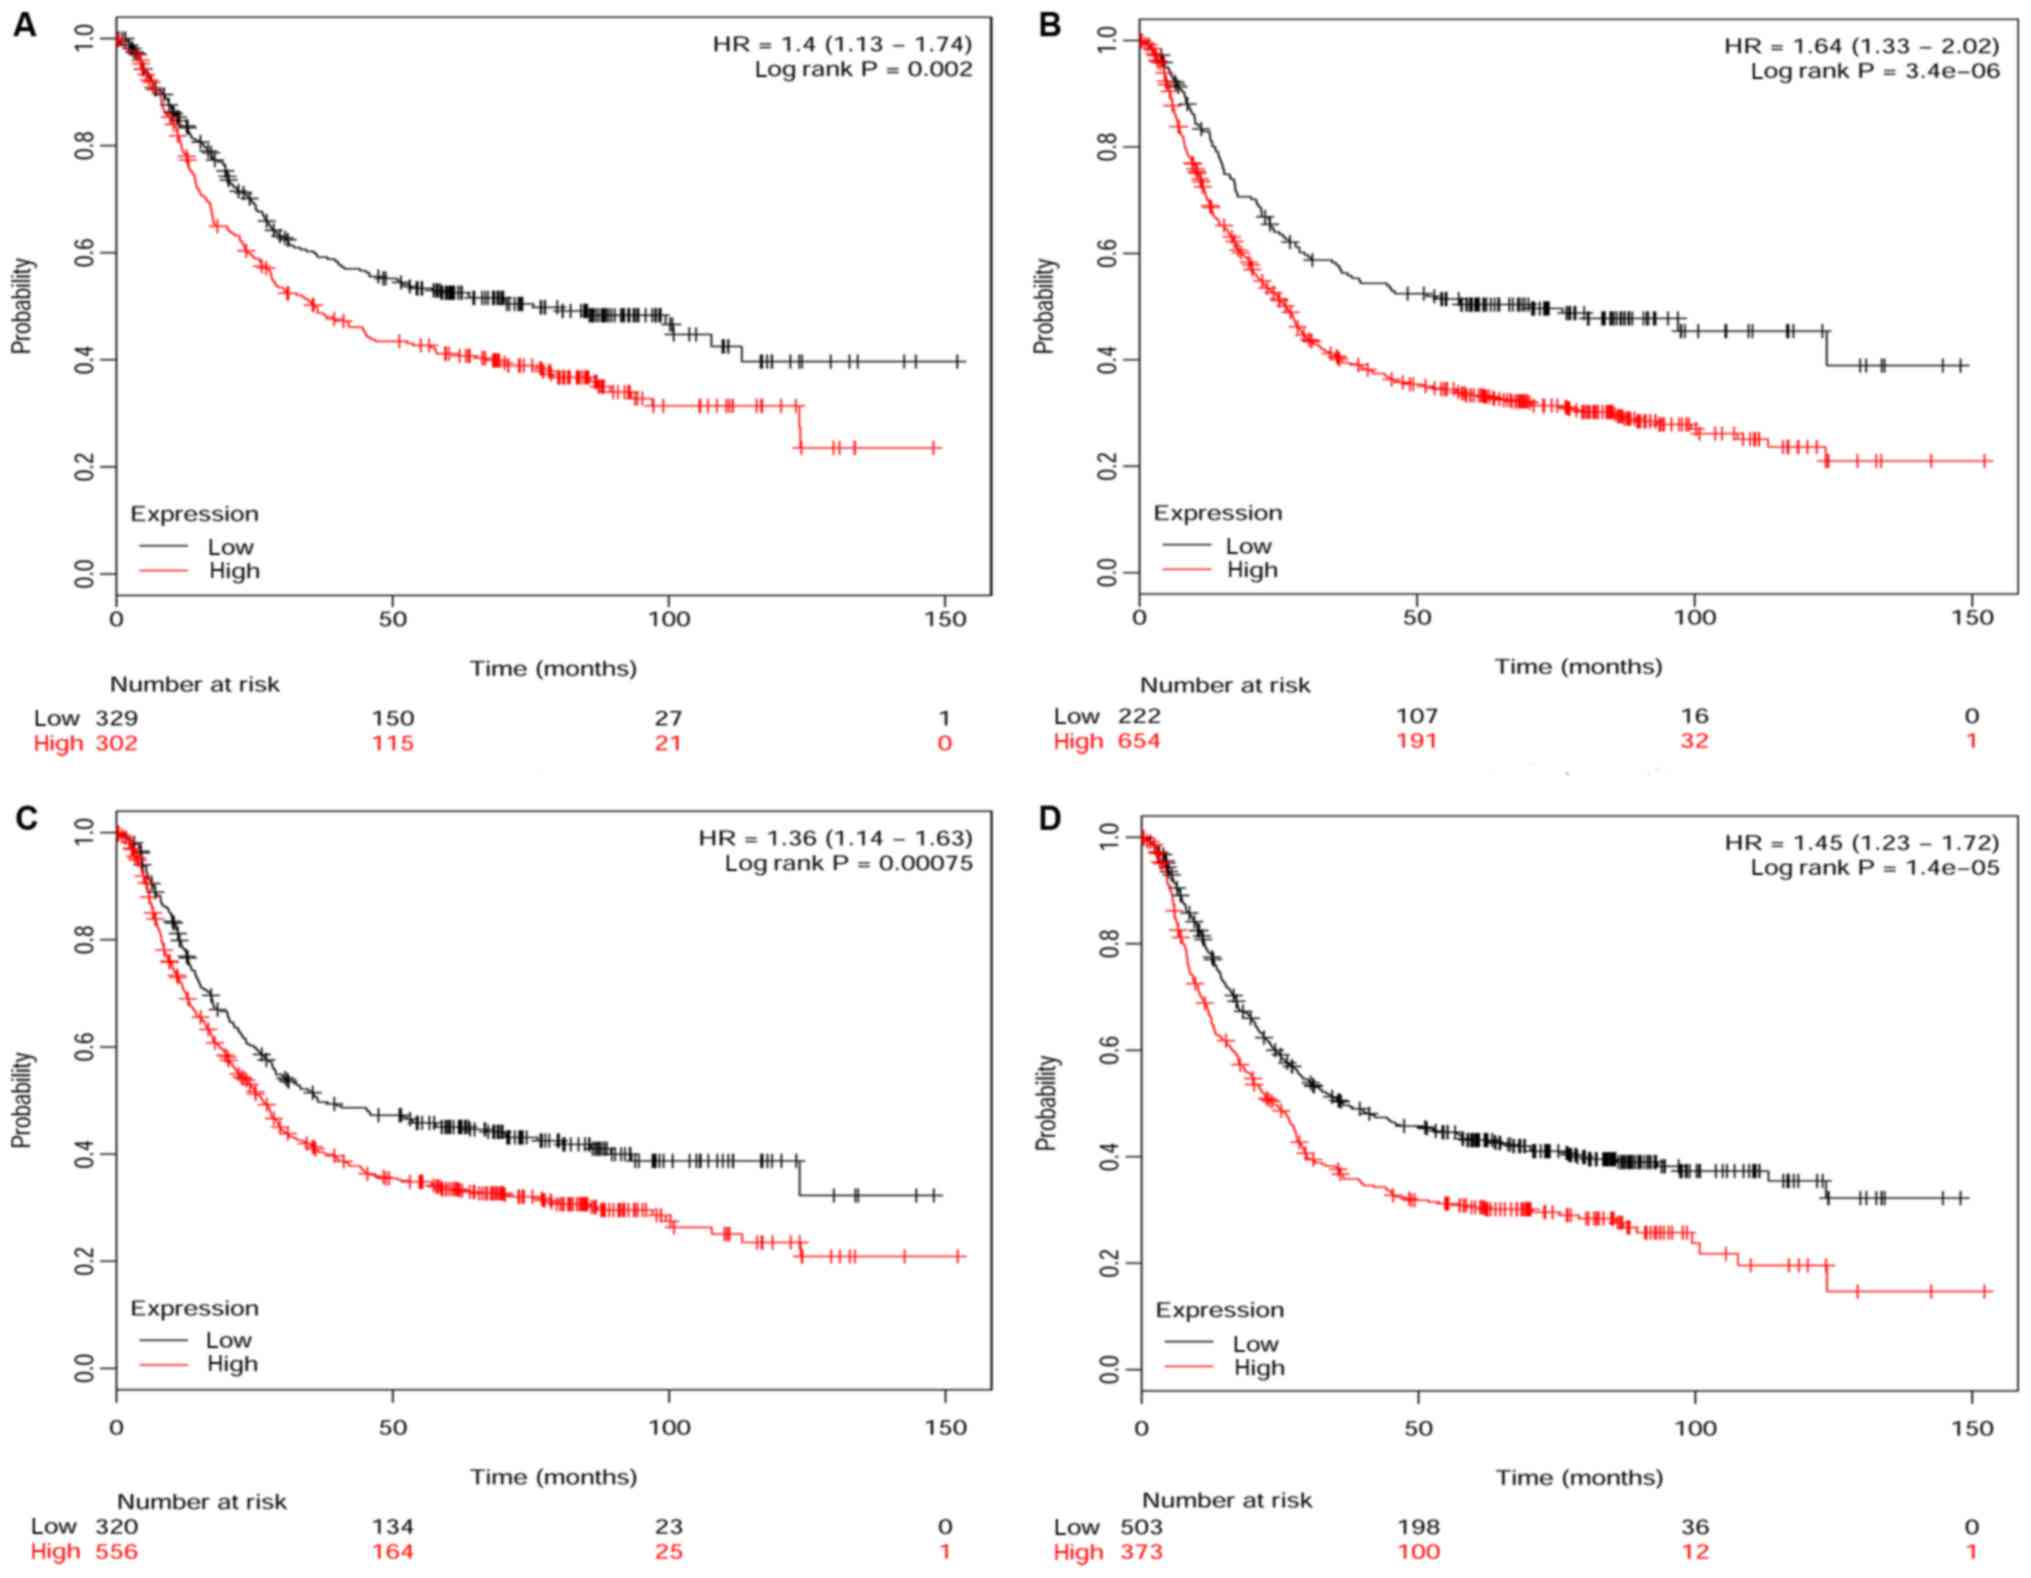
Kaplan-Meier survival curves
The Kaplan-Meier (KM) survival curves are shown in
Fig. 6. Using the KM plotter
platform, the GC patients were divided into two groups, with low
and high expression of the four core genes, respectively. We found
that each of the four core genes, COL12A1 [HR 1.4
(1.13–1.74) P=0.002], GSTA3 [HR 1.64 (1.33–2.02) P=3.4e-06],
FGA [HR 1.36 (1.14–1.63) P=0.00075] and FGG [HR 1.45
(1.23–1.72) P=1.4e-05], was a poor prognostic factor of overall
survival.
Discussion
GC, as one of the most malignant tumor, was a
typical heterogeneous cancer with molecular complexity and
heterogeneity (16,17). Recently, a substantial number of
effort have been paid in exploring the underwent molecular
mechanism of GC and several genetic and epigenetic alterations have
been identified as biomarkers with effect on diagnosis, treatment,
stratification and prognosis (18–20).
However, with the technological improvement, its heterogeneity was
found to be more complex than previous imagined, regarding genomic
instability, differentially expressed genes (DEGs), genetic
variations, epigenetic heterogeneity, protein heterogeneity and so
on (21,22). The heterogeneity of GC presented
some complex biological characteristics, such as recurrence and
metastasis of cancer, sensitivity to adjuvant therapy, and so on
(23–25). Therefore, these identified
biomarkers still were ineffective and inconstant, which slow their
clinical application (17,26). Even so, it still should not be
neglected that exploring novel biomarkers was helpful to further
construct the molecular network of GC, improve our understanding on
heterogeneity, and identify more meaningful genetic subtypes
related to individual characteristics, such as prognosis,
sensitivity of adjuvant therapy and so on (21).
In our study, a total of six modules were
identified. These modules were analyzed with these DEGs that met
with the default parameters. And the expression data of these DEGs
were identified based on the gene profiles (GSE79973). Therefore,
as a result of the tumor heterogeneity, these modules were
associated with this gene profiles. Interestingly, from the
function annotation of these modules, on the one hand, these
modules were enriched in some common cancer signaling pathway such
as PI3K-Akt signaling pathway, Wnt signaling pathway and so on
(27,28). On the other hand, these modules
also were enriched in the processes, such as gastric acid
secretion, protein digestion and absorption and so on, which were
specific in the GC.
We also found that certain well-known gastric
prognosis factors, such as some non-canonical Wnt signaling genes
and PICT1, were not included in the identified modules (29). In fact, these well-known gastric
prognosis factors were identified as DEGs in our study. But they
were not included in further module analysis for their expression
level without meeting with the default parameter. This issue
resulted from the tumor heterogeneity. It is the heterogeneity that
restricts these well-known prognostic factors as sites of targeted
therapy, for example trastuzumab for the GC patients with HER-2
positive (30). The trastuzumab
has been a standard treatment strategy for the GC patients with
HER-2 positive (31). However,
only a small number of patients can benefit from it, which mainly
results from HER-2 in a fraction of GC patients (~7–34%) being
overexpression due to the heterogeneity (32). Even so, the tumor heterogeneity
makes it possible to explore some novel genes related to prognosis
of patients with GC as the candidates of biomarkers. These novel
genes may not be as important as these well-known prognostic genes.
But It is helpful to construct tumor molecular network and provide
more accurate individualized treatment plan. Remarkably, we
identified four GC-associated functional core genes, COL12A1 in
Module A, GSTA3 in Module E and FGA, FGG in Module F, and the level
of these genes correlate with poor prognosis.
COL12A1 was reported to be related to several
types of cancers, such as subungual exostosis, ovarian, breast and
colon cancer, which suggest that COL12A1 may be a new
potential cancer biomarker (33–36).
As a member of the FACIT (fibril associated collagens with
interrupted triple helices) collagen family, COL12A1,
together with COL6A3, COL8A1, COL1A2, COL5A2, COL10A1,
COL11A1 and COL2A1, has the molecular function of
extracellular matrix structural constituent. These FACIT members
take part in the biological processes of collagen fibril
organization and construct the cellular component of collagen
trimer. Although COL12A is expressed in a variety of tumor
tissues, its exact function remains poorly understood. Januchowski
et al (34) found that
COL12A1 played a role in the drug resistance of cancer cells
and tumor progression. Based on our observed GO terms and pathways
in module A (Fig. 5),
COL12A1 appear to participate in pathways of protein
digestion and absorption as well as focal adsorption, which may
allow tumor cells to invade into the surrounding microenvironment.
In addition, high expression of COL12A1 is associated with
poor prognosis. Thus, COL12A1 may be a new potential marker
and prognostic factor of GC and its pathways may be potential
treatment targets.
GSTA3 was identified to be a down-regulated
gene in our study. Together with GSTA1 and CYP2C18,
GSTA3 constructed the Module E (Fig. 5). They interact with each other and
participate in chemical carcinogenesis, glutathione metabolism and
drug metabolism-cytochrome P450. GSTA3 and GSTA1
encode a superfamily of glutathione S-transferases (GST), which are
involved in biotransformation of toxic xenobiotics and endobiotics,
as well as arachidonic acid metabolism via conjugation with reduced
glutathione (GSH) (37). The
expression level of GST are associated with the resistance of cells
to toxic chemicals, such as carcinogens, antitumor drugs,
environmental pollutants, and products of oxidative stress
(38). Therefore, GSTA3 may
be a potential marker in selecting chemotherapy drug (39). Further research on the association
of these molecules is needed to help us better understand the exact
role of GSTA3 in GC regulation.
FGA and FGG encode the alpha and gamma
components of fibrinogen, which are constituent parts of
blood-borne glycoprotein (40).
They were reported to differentially express in many types of
cancer, such as prostate cancer, lung cancer, hepatocellular
carcinoma, and pancreatic cancer (40–43).
Plasma fibrinogen levels before surgery together with histological
grade and lymph node involvement have been defined as independent
prognostic factors in patients with colorectal cancer (44). Ghezzi et al (45), reported that plasma fibrinogen
level might be a potential index to predict prognosis, improve the
early diagnosis of endometrial cancer and optimize the treatment
schedule. The possible mechanisms behind the association of plasma
fibrinogen level with cancer include (1) the soluble form of fibrinogen may
serve as the bridging molecule between tumor cells and host cells;
(2) tumor cells and platelets may
form large aggregates, which prevent tumor cells from being
attacked by the innate immune system and (3) fibrinogen is essential to the
sustained adherence of tumor cells to the endothelia of target
tissues (46–48). In GC, fibrinogen plays a key role
in hematogenous and lymphatic metastasis of cancer cells through
spontaneous metastasis, facilitating the stable adhesion and/or
survival of metastatic emboli after tumor cell intravasation
(49). The plasma fibrinogen level
on the prognosis was based on staging of tumor with worse prognosis
in T2 GC as well as lymphatic and hematogenous metastasis, however,
not in T3/T4 GC (50). However,
they were directly reported to be associated with GC for the first
time in this study. There still existed debate in expression level
about these genes in tissues of cancer (51–53).
In our study, FGA and FGG were identified to be
down-regulated genes, while their high expression indicated poor
prognosis for patients with GC. Besides tumor, many other factors
may influence the alteration of expression level of FGG and
FGA, such as acute-phase reactant and binding sites in
tissues (40,54). Furthermore, levels of fibrinogen
genes (FGA and FGG) changed following a circadian
rhythms pattern and this additional level of fibrinogen
transcriptional regulation has not yet been characterized (55). Considering pulmonary infarction as
one of the most serious complications after GC surgery and the
relationships between plasma fibrinogen level and GC, we should
take it into consideration whether postoperative patients need a
routine prophylactic anticoagulation. As evaluation indexes of
blood coagulation state, FGG and FAG are potential
biomarkers to improve diagnosis, optimize treatment and predict
prognosis.
We have a lot of limitations in the universality and
applicability of these novel biomarkers for the observational
nature of this article. Our study was conducted based on the gene
profiles, GSE79973, which contained 10 pairs of GC tissues and
adjacent non-tumor tissues. The association of the identified genes
and GC, their value to predict prognosis and molecular interactions
among these genes were not verified in clinical samples by
experiments. For above reasons, the further experiments and studies
are needed to measure the identified genes in clinical practice and
investigate the biological mechanisms of the interactions among
these identified genes.
In conclusion, COL12A1, GSTA3, FGA and
FGG have been identified to be associated with GC in this
study and were selected as the core genes. Through GO and pathway
enrichment of modules, we identified the functions and pathways of
these core genes. Furthermore, based on survival analysis, the four
genes were found to be significant poor prognostic factors. These
core genes might be potential markers to improve diagnosis,
optimize chemotherapy plan and predict prognosis. In addition, the
pathways related to these genes may be potential therapeutic
targets for GC. We plan to embark on validating the potential
functions and pathways of these genes in our future studies.
Acknowledgements
Not applicable.
Funding
The present study was supported by the National
Natural Science Foundation of China (grant no. 81001092),
CSCO-Merck Serono Cancer Research Fund (grant no. Y-MX2016-013) and
the Natural Science Foundation of Liaoning Province of China (grant
no. 2013021097).
Availability of data and materials
The datasets analyzed during the present study are
available from the corresponding author on reasonable request.
Authors' contributions
FL conceived and designed the study. SD and BG
analyzed the data and wrote the manuscript. PW performed
statistical analysis and prepared the figures. HH and LL collected
the data and critically revised the manuscript for important
intellectual content. FL takes responsibility for the honesty and
accuracy of the present study. All authors have read and approved
the final manuscript.
Ethics approval and consent to
participate
Not applicable.
Patient consent for publication
Not applicable.
Competing interests
The authors declare that they have no competing
interests.
Glossary
Abbreviations
Abbreviations:
|
GC
|
gastric cancer
|
|
DEGs
|
differentially expressed genes
|
|
GO
|
Gene Ontology
|
|
KEGG
|
Kyoto Encyclopedia of Genes and
Genomes
|
|
PPI
|
protein-protein interaction
|
|
CEA
|
carcinoembryonic antigen
|
|
CA 19-9
|
carbohydrate antigen 19-9
|
|
CA-50
|
carbohydrate antigen 50
|
|
CHGA
|
Chromogranin A
|
|
THY1
|
Thy-1 cell surface antigen
|
|
BP
|
biological process
|
|
CC
|
cellular component
|
|
MF
|
molecular function
|
|
GST
|
glutathione S-transferases
|
|
KM
|
Kaplan-Meier
|
References
|
1
|
Ferlay J, Soerjomataram I, Dikshit R, Eser
S, Mathers C, Rebelo M, Parkin DM, Forman D and Bray F: Cancer
incidence and mortality worldwide: Sources, methods and major
patterns in GLOBOCAN 2012. Int J Cancer. 136:E359–E386. 2015.
View Article : Google Scholar : PubMed/NCBI
|
|
2
|
Bertuccio P, Chatenoud L, Levi F, Praud D,
Ferlay J, Negri E, Malvezzi M and La Vecchia C: Recent patterns in
gastric cancer: A global overview. Int J Cancer. 125:666–673. 2009.
View Article : Google Scholar : PubMed/NCBI
|
|
3
|
Allemani C, Weir HK, Carreira H, Harewood
R, Spika D, Wang XS, Bannon F, Ahn JV, Johnson CJ, Bonaventure A,
et al: Global surveillance of cancer survival 1995–2009: Analysis
of individual data for 25,676,887 patients from 279
population-based registries in 67 countries (CONCORD-2). Lancet.
385:977–1010. 2015. View Article : Google Scholar : PubMed/NCBI
|
|
4
|
Pectasides D, Mylonakis A, Kostopoulou M,
Papadopoulou M, Triantafillis D, Varthalitis J, Dimitriades M and
Athanassiou A: CEA, CA 19-9 and CA-50 in monitoring gastric
carcinoma. Am J Clin Oncol. 20:348–353. 1997. View Article : Google Scholar : PubMed/NCBI
|
|
5
|
Ara H, Takagishi M, Enomoto A, Asai M,
Ushida K, Asai N, Shimoyama Y, Kaibuchi K, Kodera Y and Takahashi
M: Role for Daple in non-canonical Wnt signaling during gastric
cancer invasion and metastasis. Cancer Sci. 107:133–139. 2016.
View Article : Google Scholar : PubMed/NCBI
|
|
6
|
Yang AP, Liu J, Lei HY, Zhang QW, Zhao L
and Yang GH: CA72-4 combined with CEA, CA125 and CAl9-9 improves
the sensitivity for the early diagnosis of gastric cancer. Clin
Chim Acta. 437:183–186. 2014. View Article : Google Scholar : PubMed/NCBI
|
|
7
|
Yang S and Chung HC: Novel biomarker
candidates for gastric cancer. Oncol Rep. 19:675–680.
2008.PubMed/NCBI
|
|
8
|
Sun H: Identification of key genes
associated with gastric cancer based on DNA microarray data. Oncol
Lett. 11:525–530. 2016. View Article : Google Scholar : PubMed/NCBI
|
|
9
|
Hu K and Chen F: Identification of
significant pathways in gastric cancer based on protein-protein
interaction networks and cluster analysis. Genet Mol Biol.
35:701–708. 2012. View Article : Google Scholar : PubMed/NCBI
|
|
10
|
Zhang MH, Shen QH, Qin ZM, Wang QL and
Chen X: Systematic tracking of disrupted modules identifies
significant genes and pathways in hepatocellular carcinoma. Oncol
Lett. 12:3285–3295. 2016. View Article : Google Scholar : PubMed/NCBI
|
|
11
|
Gautier L, Cope L, Bolstad BM and Irizarry
RA: Affy-analysis of Affymetrix GeneChip data at the probe level.
Bioinformatics. 20:307–315. 2004. View Article : Google Scholar : PubMed/NCBI
|
|
12
|
Benito M, Parker J, Du Q, Wu J, Xiang D,
Perou CM and Marron JS: Adjustment of systematic microarray data
biases. Bioinformatics. 20:105–114. 2004. View Article : Google Scholar : PubMed/NCBI
|
|
13
|
Shen ZG, Guo JL and Li DS: Screening of
differentially expressed genes related to severe sepsis induced by
multiple trauma with DNA microarray. Eur Rev Med Pharmacol Sci.
18:734–739. 2014.PubMed/NCBI
|
|
14
|
von Mering C, Huynen M, Jaeggi D, Schmidt
S, Bork P and Snel B: STRING: A database of predicted functional
associations between proteins. Nucleic Acids Res. 31:258–261. 2003.
View Article : Google Scholar : PubMed/NCBI
|
|
15
|
Shannon P, Markiel A, Ozier O, Baliga NS,
Wang JT, Ramage D, Amin N, Schwikowski B and Ideker T: Cytoscape: A
software environment for integrated models of biomolecular
interaction networks. Genome Res. 13:2498–2504. 2003. View Article : Google Scholar : PubMed/NCBI
|
|
16
|
Jin Z, Jiang W and Wang L: Biomarkers for
gastric cancer: Progression in early diagnosis and prognosis
(Review). Oncol Lett. 9:1502–1508. 2015. View Article : Google Scholar : PubMed/NCBI
|
|
17
|
Uppal DS and Powell SM:
Genetics/genomics/proteomics of gastric adenocarcinoma.
Gastroenterol Clin North Am. 42:241–260. 2013. View Article : Google Scholar : PubMed/NCBI
|
|
18
|
Fan B, Dachrut S, Coral H, Yuen ST, Chu
KM, Law S, Zhang L, Ji J, Leung SY and Chen X: Integration of DNA
copy number alterations and transcriptional expression analysis in
human gastric cancer. PLoS One. 7:e298242012. View Article : Google Scholar : PubMed/NCBI
|
|
19
|
Takeno A, Takemasa I, Doki Y, Yamasaki M,
Miyata H, Takiguchi S, Fujiwara Y, Matsubara K and Monden M:
Integrative approach for differentially overexpressed genes in
gastric cancer by combining large-scale gene expression profiling
and network analysis. Br J Cancer. 99:1307–1315. 2008. View Article : Google Scholar : PubMed/NCBI
|
|
20
|
Bauer L, Langer R, Becker K, Hapfelmeier
A, Ott K, Novotny A, Hofler H and Keller G: Expression profiling of
stem cell-related genes in neoadjuvant-treated gastric cancer: A
NOTCH2, GSK3B and beta-catenin gene signature predicts survival.
PLoS One. 7:e445662012. View Article : Google Scholar : PubMed/NCBI
|
|
21
|
Hudler P: Challenges of deciphering
gastric cancer heterogeneity. World J Gastroenterol.
21:10510–10527. 2015. View Article : Google Scholar : PubMed/NCBI
|
|
22
|
Cancer Genome Atlas Research Network, .
Comprehensive molecular characterization of gastric adenocarcinoma.
Nature. 513:202–209. 2014. View Article : Google Scholar : PubMed/NCBI
|
|
23
|
Zhang XP, Bai ZB, Chen BA, Feng JF, Yan F,
Jiang Z, Zhong YJ, Wu JZ, Chen L, Lu ZH, et al: Polymorphisms of
dihydropyrimidine dehydrogenase gene and clinical outcomes of
gastric cancer patients treated with fluorouracil-based adjuvant
chemotherapy in Chinese population. Chin Med J (Engl). 125:741–746.
2012.PubMed/NCBI
|
|
24
|
McGranahan N and Swanton C: Biological and
therapeutic impact of intratumor heterogeneity in cancer evolution.
Cancer Cell. 27:15–26. 2015. View Article : Google Scholar : PubMed/NCBI
|
|
25
|
Gerashchenko TS, Denisov EV, Litviakov NV,
Zavyalova MV, Vtorushin SV, Tsyganov MM, Perelmuter VM and
Cherdyntseva NV: Intratumor heterogeneity: Nature and biological
significance. Biochemistry (Mosc). 78:1201–1215. 2013. View Article : Google Scholar : PubMed/NCBI
|
|
26
|
Pinheiro Ddo R, Ferreira WA, Barros MB,
Araujo MD, Rodrigues-Antunes S and Borges Bdo N: Perspectives on
new biomarkers in gastric cancer: Diagnostic and prognostic
applications. World J Gastroenterol. 20:11574–11585. 2014.
View Article : Google Scholar : PubMed/NCBI
|
|
27
|
Chang F, Lee JT, Navolanic PM, Steelman
LS, Shelton JG, Blalock WL, Franklin RA and Mccubrey JA:
Involvement of PI3K/Akt pathway in cell cycle progression,
apoptosis and neoplastic transformation: A target for cancer
chemotherapy. Leukemia. 17:590–603. 2003. View Article : Google Scholar : PubMed/NCBI
|
|
28
|
Kikuchi A: Tumor formation by genetic
mutations in the components of the Wnt signaling pathway. Cancer
Sci. 94:225–229. 2010. View Article : Google Scholar
|
|
29
|
Uchi R, Kogo R, Kawahara K, Sudo T,
Yokobori T, Eguchi H, Sugimachi K, Maehama T, Mori M, Suzuki A, et
al: PICT1 regulates TP53 via RPL11 and is involved in gastric
cancer progression. Br J Cancer. 109:2199–2206. 2013. View Article : Google Scholar : PubMed/NCBI
|
|
30
|
Kim HJ and Oh SC: Novel systemic therapies
for advanced gastric cancer. J Gastric Cancer. 18:1–19. 2018.
View Article : Google Scholar : PubMed/NCBI
|
|
31
|
Bang YJ, Van Cutsem E, Feyereislova A,
Chung HC, Shen L, Sawaki A, Lordick F, Ohtsu A, Omuro Y, Satoh T,
et al: Trastuzumab in combination with chemotherapy versus
chemotherapy alone for treatment of HER2-positive advanced gastric
or gastro-oesophageal junction cancer (ToGA): A phase 3,
open-label, randomised controlled trial. Lancet. 376:687–697. 2010.
View Article : Google Scholar : PubMed/NCBI
|
|
32
|
Rüschoff J, Hanna W, Bilous M, Hofmann M,
Osamura RY, Penault-Llorca F, van de Vijver M and Viale G: HER2
testing in gastric cancer: A practical approach. Mod Pathol.
25:637–650. 2012. View Article : Google Scholar : PubMed/NCBI
|
|
33
|
Storlazzi CT, Wozniak A, Panagopoulos I,
Sciot R, Mandahl N, Mertens F and Debiec-Rychter M: Rearrangement
of the COL12A1 and COL4A5 genes in subungual exostosis: molecular
cytogenetic delineation of the tumor-specific translocation
t(X;6)(q13-14;q22). Int J Cancer. 118:1972–1976. 2006. View Article : Google Scholar : PubMed/NCBI
|
|
34
|
Januchowski R, Świerczewska M, Sterzyńska
K, Wojtowicz K, Nowicki M and Zabel M: Increased expression of
several collagen genes is associated with drug resistance in
ovarian cancer cell lines. J Cancer. 7:1295–1310. 2016. View Article : Google Scholar : PubMed/NCBI
|
|
35
|
Verghese ET, Drury R, Green CA, Holliday
DL, Lu X, Nash C, Speirs V, Thorne JL, Thygesen HH, Zougman A, et
al: MiR-26b is down-regulated in carcinoma-associated fibroblasts
from ER-positive breast cancers leading to enhanced cell migration
and invasion. J Pathol. 231:388–399. 2013. View Article : Google Scholar : PubMed/NCBI
|
|
36
|
Mikula M, Rubel T, Karczmarski J, Goryca
K, Dadlez M and Ostrowski J: Integrating proteomic and
transcriptomic high-throughput surveys for search of new biomarkers
of colon tumors. Funct Integr Genomics. 11:215–224. 2011.
View Article : Google Scholar : PubMed/NCBI
|
|
37
|
Hayes JD and Strange RC: Glutathione
S-transferase polymorphisms and their biological consequences.
Pharmacology. 61:154–166. 2000. View Article : Google Scholar : PubMed/NCBI
|
|
38
|
Hayes JD and Pulford DJ: The glutathione
S-transferase supergene family: Regulation of GST and the
contribution of the isoenzymes to cancer chemoprotection and drug
resistance. Crit Rev Biochem Mol Biol. 30:445–600. 1995. View Article : Google Scholar : PubMed/NCBI
|
|
39
|
Drozd E, Krzysztoń-Russjan J, Marczewska
J, Drozd J, Bubko I, Bielak M, Lubelska K, Wiktorska K, Chilmonczyk
Z, Anuszewska E and Gruber-Bzura B: Up-regulation of
glutathione-related genes, enzyme activities and transport proteins
in human cervical cancer cells treated with doxorubicin. Biomed
Pharmacother. 83:397–406. 2016. View Article : Google Scholar : PubMed/NCBI
|
|
40
|
Wang H, Meyer CA, Fei T, Wang G, Zhang F
and Liu XS: A systematic approach identifies FOXA1 as a key factor
in the loss of epithelial traits during the
epithelial-to-mesenchymal transition in lung cancer. BMC Genomics.
14:6802013. View Article : Google Scholar : PubMed/NCBI
|
|
41
|
Chen C, Zhang LG, Liu J, Han H, Chen N,
Yao AL, Kang SS, Gao WX, Shen H, Zhang LJ, et al: Bioinformatics
analysis of differentially expressed proteins in prostate cancer
based on proteomics data. Onco Targets Ther. 9:1545–1557. 2016.
View Article : Google Scholar : PubMed/NCBI
|
|
42
|
Fan BL, Zhu WL, Zou GL, Luo GS, Xu CL and
Zhao WX: Cloning and identification of fibrinogen gamma polypeptide
(FGG) gene differentially expressed in human hepatocellular
carcinoma. Ai Zheng. 23:249–253. 2004.PubMed/NCBI
|
|
43
|
Bloomston M, Zhou JX, Rosemurgy AS,
Frankel W, Muro-Cacho CA and Yeatman TJ: Fibrinogen gamma
overexpression in pancreatic cancer identified by large-scale
proteomic analysis of serum samples. Cancer Res. 66:2592–2599.
2006. View Article : Google Scholar : PubMed/NCBI
|
|
44
|
Tang L, Liu K, Wang J, Wang C, Zhao P and
Liu J: High preoperative plasma fibrinogen levels are associated
with distant metastases and impaired prognosis after curative
resection in patients with colorectal cancer. J Surg Oncol.
102:428–432. 2010. View Article : Google Scholar : PubMed/NCBI
|
|
45
|
Ghezzi F, Cromi A, Siesto G, Giudici S,
Serati M, Formenti G and Franchi M: Prognostic significance of
preoperative plasma fibrinogen in endometrial cancer. Gynecol
Oncol. 119:309–313. 2010. View Article : Google Scholar : PubMed/NCBI
|
|
46
|
Yano H, Kitayama J, Hatano K, Tsuno N,
Osada T, Watanabe T, Tsuruo T, Muto T and Nagawa H: Clustered
cancer cells show a distinct adhesion behavior from single cell
form under physiological shear conditions. J Exp Clin Cancer Res.
20:407–412. 2001.PubMed/NCBI
|
|
47
|
Nieswandt B, Hafner M, Echtenacher B and
Mannel DN: Lysis of tumor cells by natural killer cells in mice is
impeded by platelets. Cancer Res. 59:1295–1300. 1999.PubMed/NCBI
|
|
48
|
Palumbo JS, Kombrinck KW, Drew AF, Grimes
TS, Kiser JH, Degen JL and Bugge TH: Fibrinogen is an important
determinant of the metastatic potential of circulating tumor cells.
Blood. 96:3302–3309. 2000.PubMed/NCBI
|
|
49
|
Palumbo JS, Potter JM, Kaplan LS, Talmage
K, Jackson DG and Degen JL: Spontaneous hematogenous and lymphatic
metastasis, but not primary tumor growth or angiogenesis, is
diminished in fibrinogen-deficient mice. Cancer Res. 62:6966–6972.
2002.PubMed/NCBI
|
|
50
|
Yamashita H, Kitayama J, Kanno N, Yatomi Y
and Nagawa H: Hyperfibrinogenemia is associated with lymphatic as
well as hematogenous metastasis and worse clinical outcome in T2
gastric cancer. BMC Cancer. 6:1472006. View Article : Google Scholar : PubMed/NCBI
|
|
51
|
Davalieva K, Kiprijanovska S, Komina S,
Petrusevska G, Zografska NC and Polenakovic M: Proteomics analysis
of urine reveals acute phase response proteins as candidate
diagnostic biomarkers for prostate cancer. Proteome Sci. 13:22015.
View Article : Google Scholar : PubMed/NCBI
|
|
52
|
Zhu WL, Fan BL, Liu DL and Zhu WX:
Abnormal expression of fibrinogen gamma (FGG) and plasma level of
fibrinogen in patients with hepatocellular carcinoma. Anticancer
Res. 29:2531–2534. 2009.PubMed/NCBI
|
|
53
|
Chan KY, Lai PB, Squire JA, Beheshti B,
Wong NL, Sy SM and Wong N: Positional expression profiling
indicates candidate genes in deletion hotspots of hepatocellular
carcinoma. Mod Pathol. 19:1546–1554. 2006. View Article : Google Scholar : PubMed/NCBI
|
|
54
|
Son HJ, Park JW, Chang HJ, Kim DY, Kim BC,
Kim SY, Park SC, Choi HS and Oh JH: Preoperative plasma
hyperfibrinogenemia is predictive of poor prognosis in patients
with nonmetastatic colon cancer. Ann Surg Oncol. 20:2908–2913.
2013. View Article : Google Scholar : PubMed/NCBI
|
|
55
|
Fort A, Borel C, Migliavacca E,
Antonarakis SE, Fish RJ and Neerman-Arbez M: Regulation of
fibrinogen production by microRNAs. Blood. 116:2608–2615. 2010.
View Article : Google Scholar : PubMed/NCBI
|