Introduction
Ribosomal proteins (RPs) are a family of RNA-binding
proteins that have primary roles in ribosome biogenesis and protein
translation (1). Previous data
suggested a close association of the extraribosomal functions of
RPs with cell growth and proliferation (2,3),
apoptosis (4,5), DNA repair (6), cellular development (7) and differentiation (8,9).
Ribosomal protein S15A (RPS15A), a member of the RP gene family,
was highly expressed in hepatic cancer (10), glioblastoma (11,12),
non-small cell lung (13) and
colorectal cancer (14).
In colorectal cancer, RPS15A depletion contributed
to cell cycle arrest and cell growth suppression via p21
upregulation and cyclin-dependent kinase (CDK)1 downregulation
(14). The p53 pathway, well
documented for its anticancer functions (15), was significantly activated in
RPS15A-specific short hairpin RNA (shRNA)-expressing lentivirus
(Lv)-shRPS15A-infected A549 cells (16). In another previous study, the
knockdown of RPS15A induced lung cancer cell apoptosis (13). RPS15A may additionally contribute
to glioblastoma growth, proliferation and migration via the protein
kinase B pathway, and the knockdown of RPS15A may significantly
inhibit B cell lymphoma 2 and activate caspase-3 and poly
(ADP-ribose) polymerase (11,12).
Overall, the majority of the previous studies indicated that the
dysfunction of RPS15A is significantly associated with
tumorigenesis in human malignancies. However, the role of RPS15A in
the development of renal cell carcinoma (RCC) remains unknown.
RCC was reported to be the seventh most common
cancer, with >350,000 people diagnosed worldwide in 2013
(17). Despite numerous advances
in the systemic treatment of RCC over the past years, including
targeted therapies, the life expectancy of patients remains
generally unsatisfactory due to the side effects and tolerance of
these drugs. Based on the increasing number of patients with RCC
and prevalence of resistance to currently available drugs (18), the identification of novel target
pathways remains an active area of RCC (17).
The aim of the present study was to investigate the
expression levels and functions of RPS15A in RCC. Through analysing
data from multiple patient cohorts, and validating its expression
in RCC cell lines, the results revealed that RPS15A was
overexpressed in RCC. Additionally, the function of RPS15A in RCC
was further examined in vitro and in vivo using RCC
cells transfected with Lv-shRPS15A. A regulatory network of RPS15A
was also constructed. Thus, the present study provided evidence
that RPS15A may serve a potential role in the tumorigenesis of
RCC.
Materials and methods
Data collection and analysis
The gene expression data of RPS15A in kidney cancer
tissues were collected from The Cancer Genome Atlas (TCGA;
cancergenome.nih.gov) and included 507
cancer samples and 72 adjacent normal tissues. Differential
analysis was performed and visualized using starBase V2.0 (19). In the validation tests, data from
the Oncomine database (www.oncomine.org) were collected (20), with a cut-off value of a fold
change >1.5 and P<0.05.
Cell culture
Normal human renal cells (HK-2), 293T and the RCC
cell lines 786-O and Caki-1 were obtained from The Shanghai
Biological Institute (Shanghai, China). The 786-O, 293T and HK-2
cells were cultured in RPMI 1640 medium with 10% foetal bovine
serum, and Caki-1 cells were grown as a monolayer to a subconfluent
state in Falcon tissue culture dishes in McCoy's 5A medium (all
Gibco; Thermo Fisher Scientific, Inc., Waltham, MA, USA)
supplemented with 10% FBS. All cells were cultured in a 37°C
humidified incubator with 95% air and 5% CO2. The
cultured cells were washed briefly with PBS, harvested with a
rubber policeman, frozen in liquid nitrogen and stored at −80°C
until further use.
RNA extraction and reverse
transcription-quantitative polymerase chain reaction (RT-qPCR)
analysis
Total RNA was isolated from the cells using
TRIzol® reagent (Invitrogen; Thermo Fisher Scientific,
Inc.), and RT of 2.0 µg total RNA was performed using the M-MLV kit
(Promega Corporation, Madison, WI, USA), both according to the
manufacturer's protocol. The primers used for qPCR were as follows:
RPS15A forward, 5′-CTCCAAAGTCATCGTCCGGTT-3′ and reverse,
5′-TGAGTTGCACGTCAAATCTGG-3′; GAPDH forward,
5′-TGACTTCAACAGCGACACCCA-3′ and reverse,
5′-CACCCTGTTGCTGTAGCCAAA-3′. GAPDH was used as an endogenous
control. qPCR was performed using SYBR-Green Real-Time PCR Master
Mix (Agilent Technologies, Inc., Santa Clara, CA, USA) and measured
using a CFX96 Real-Time PCR system (Bio-Rad Laboratories, Inc.,
Hercules, CA, USA) to quantify RPS15A expression levels. The thermo
cycling conditions were as follows: 30 sec at 95°C, followed by 45
cycles of 5 sec at 95°C and 30 sec at 60°C. Following
amplification, melting curve analysis was performed to calculate
the product melting temperature. Relative gene expression levels
were calculated using the 2−ΔΔCq method and normalized
to GAPDH (21).
Lentiviral vector construction and
cell infection
To knockdown RPS15A expression, an shRNA sequence
targeting the human RPS15A gene (shRPS15A; NM_001019) was designed:
Sense,
5′-CCGGGTGCAACTCAAAGACCTGGAATTCAAGAGATTCCAGGTCTTTGAGTTGCACTTTTTG-3′,
antisense,
3′-CACGTTGAGTTTCTGGACCTTAAGTTCTCTAAGGTCCAGAAACTCAACGTGAAAAACTTAA-5′.
A non-targeting shRNA was designed as the control:
5′-GCGGAGGGTTTGAAAGAATATCTCGAGATATTCTTTCAAACCCTCCGCTTTTTT-3′. The
stem-loop-stem oligos were subsequently synthesized, annealed and
inserted into the linearized vector GV115 (Shanghai GeneChem Co.,
Ltd., Shanghai, China) to generate the reconstructed vector.
Recombinant lentiviral vectors and packaging vectors
(1.8×10⁹ TU/ml) were subsequently co-transfected into
293T cells (>1×10⁶ cells/ml) at 37°C for 48–72 h
using Lipofectamine® 2000 (Invitrogen; Thermo Fisher
Scientific, Inc.), according to the manufacturer's protocol for the
generation of recombinant lentiviruses Lv-shRPS15A and negative
control Lv-shCtrl. Following centrifugation (50,000 × g; 4°C; 2 h)
and purification, recombinant lentiviruses were collected, and the
viral titre was counted according to the percentage of green
fluorescent protein (GFP)-positive cells, observed under a
fluorescence microscope (magnification, ×100). 786-O cells at
30–45% confluency were transfected with the Lv-shRPS15A and
Lv-shCtrl (8 µg/ml) to obtain cell lines stably expressing the
shRPS15A. At 72 h following transfection, cells were observed under
fluorescence microscope to confirm successful establishment and
were used in subsequent experiments. The target gene knockdown
efficiency in 786-O cells was verified by RT-qPCR, and the
expression levels of RPS15A protein was detected by western blot
analysis.
Western blot analysis
Lv-shRNA-transduced cells were washed twice with
ice-cold PBS and lysed in 2X lysis buffer (100 mM Tris-HCl, pH 6.8;
2% mercaptoethanol; 20% glycerinum; 4% SDS). The lysates were
centrifuged at 12,000 × g for 15 min at 4°C, and the supernatant
was collected and stored at −80°C prior to use. BCA Protein
Quantitation kit used for protein determination. Proteins were
loaded (30 µg each well) and separated by 10% SDS-PAGE and
transferred onto polyvinylidene membranes (Merck KGaA, Darmstadt,
Germany). The membranes were blocked for 1 h at room temperature
with 5% non-fat milk. Subsequently, the membranes were incubated
with the following primary antibodies overnight at 4°C: Mouse
anti-Flag (1:2,000; cat. no. F1804; Sigma-Aldrich; Merck KGaA),
rabbit anti-RPS15A (1:1,000; cat. no. AP4804a; Abgent, Inc., San
Diego, CA, USA) and mouse anti-GAPDH (1:2,000; cat. no. sc-32233;
Santa Cruz Biotechnology, Inc., Dallas, TX, USA). On the second
day, the membranes were washed using TBS + 0.1% Tween-20 and
incubated with the following horseradish peroxidase-conjugated
secondary antibodies: Goat anti-rabbit immunoglobulin (Ig)G
(1:2,000; cat. no. sc-2004) and rabbit anti-mouse IgG (1:2,000;
cat. no. sc-2005; both Santa Cruz Biotechnology, Inc.) for 2 h at
room temperature. Proteins were visualized using the Enhanced
Chemiluminescence-PLUS/kit (cat. no. RPN2132; Amersham; GE
Healthcare, Chicago, IL, USA) according to the manufacturer's
protocol. GAPDH served as the loading control.
Cell proliferation and
apoptosis/necrosis detection
A Celigo Fluorescent Scanner (Nexcelom Bioscience,
Lawrence, MA, USA) was used to detect the number of
lentivirus-transduced 786-O cells expressing GFP for 5 consecutive
days, and growth curves of cells and colonies were constructed. For
the MTT proliferation assay, lentivirus-transduced 786-O cells were
seeded into 96-well plates with 2,000 cells/well. MTT (20 µl; 5
mg/ml; Gen-View Scientific, Inc., El Monte, CA, USA) was used
according to the manufacturer's protocol, and DMSO was used to
dissolve the purple formazan crystals. The absorbance of each well
was measured at 490 nm using a microplate reader, and cell
proliferation curves were plotted according to the optical density
values.
For the apoptosis/necrosis assays, the collected
cells were washed with binding buffer at room temperature and
subsequently stained with Annexin V-APC (cat. no. 88-8007;
eBioscience; Thermo Fisher Scientific, Inc.) in the dark at room
temperature for 15 min prior to flow cytometric analysis.
Apoptosis/necrosis was measured using the FACSAria III flow
cytometer (BD Biosciences, San Jose, CA, USA).
Xenograft model
For tumorigenesis evaluation in vivo, female
BALB/c nude mice (age, 4 weeks; weight, 20–22 g) were purchased
from Shanghai Linchang Biotechnology (Shanghai, China). Mice were
raised in a specific pathogen-free environment at 25°C, 40–70%
humidity with a 12-h light/dark cycle; the mice were allowed to
move freely and had free access to food and water. The mice were
divided randomly into two groups (n=8/group), including the
shRPS15A group and the Lv-shCtrl group. In total, ~2×10⁷
shRPS15A and shCtrl cells were inoculated into the right armpit of
mouse in each group. The body weights of the mice and
bi-dimensional tumour measurements were taken once each week for 7
weeks, and the tumour size was estimated using the standard formula
π/6 × L × W × W; where L represents length and W represents width.
The mice were sacrificed following seven measurement periods, and
the tumour tissues were measured and weighed. All experimental
procedures and animal work were conducted under the principles and
procedures by The National Institutes of Health (Bethesda, MA, USA)
and approved by the Animal Ethics Committee of West China Hospital
(Chengdu, China).
Gene chip and bioinformatic
analyses
Total RNA was isolated from shRPS15A- and
shCtrl-transduced 786-O as aforementioned. The quality of total RNA
was evaluated by its concentration and A260/A280 ratio, and the
integrity was evaluated using the Agilent RNA 6000 Nano kit
(Affymetrix; Thermo Fisher Scientific, Inc.). Gene expression
profiling was performed using the GeneChip® PrimeView™
Human Gene Expression Array (cat. no. 901838; Affymetrix; Thermo
Fisher Scientific, Inc.) covering >36,000 transcripts and
variants. Subsequent to preparing a total RNA/Poly-A RNA control
mixture, 100 ng total RNA was reverse transcribed (2 h at 42°C,
followed by 1 h at 16°C and 10 min at 65°C), labelled, purified and
fragmented using the GeneChip 3′IVT PLUS kit (Affymetrix; Thermo
Fisher Scientific, Inc.), according to the manufacturer's protocol.
Hybridization, washing and staining were performed using the
GeneChip Hybridization Wash and Stain kit (Affymetrix; Thermo
Fisher Scientific, Inc.) in a GeneChip Hybridization Oven 645 and a
GeneChip Fluidics Station 450. The arrays were subsequently scanned
using a GeneChip Scanner 3000 7G (Thermo Fisher Scientific, Inc.).
The signal histogram, relative signal box plot and Pearson's
correlation (signal) methods were used to control the quality of
the gene chip analysis. All the data analyses were first performed
in R (v3.2.2; www.r-project.org) using Bioconductor (www.bioconductor.org) to verify the differential
expression of genes. The probe number and fold change (FC)
information (ratio of the expression amounts of the treatment and
control groups) of the gene chip was analysed using Ingenuity
Pathway Analysis (IPA; Ingenuity Systems; Qiagen, Inc., Valencia,
CA, USA). Interaction networks were constructed using the model of
network creation algorithm in IPA with a cut-off of |FC| >1.5
and P<0.05.
Statistical analysis
All values are presented as the mean ± standard
deviation, and experiments were repeated in triplicate. The data of
two groups were compared with an unpaired standard Student's t-test
using SPSS 16.0 (SPSS, Inc., Chicago, IL, USA). For comparisons
that involved >2 groups, one-way analysis of variance with the
Tukey-Kramer post-hoc test was used. P<0.05 was considered to
indicate a statistically significant difference.
Results
Expression of RPS15A in RCC samples
and cell lines
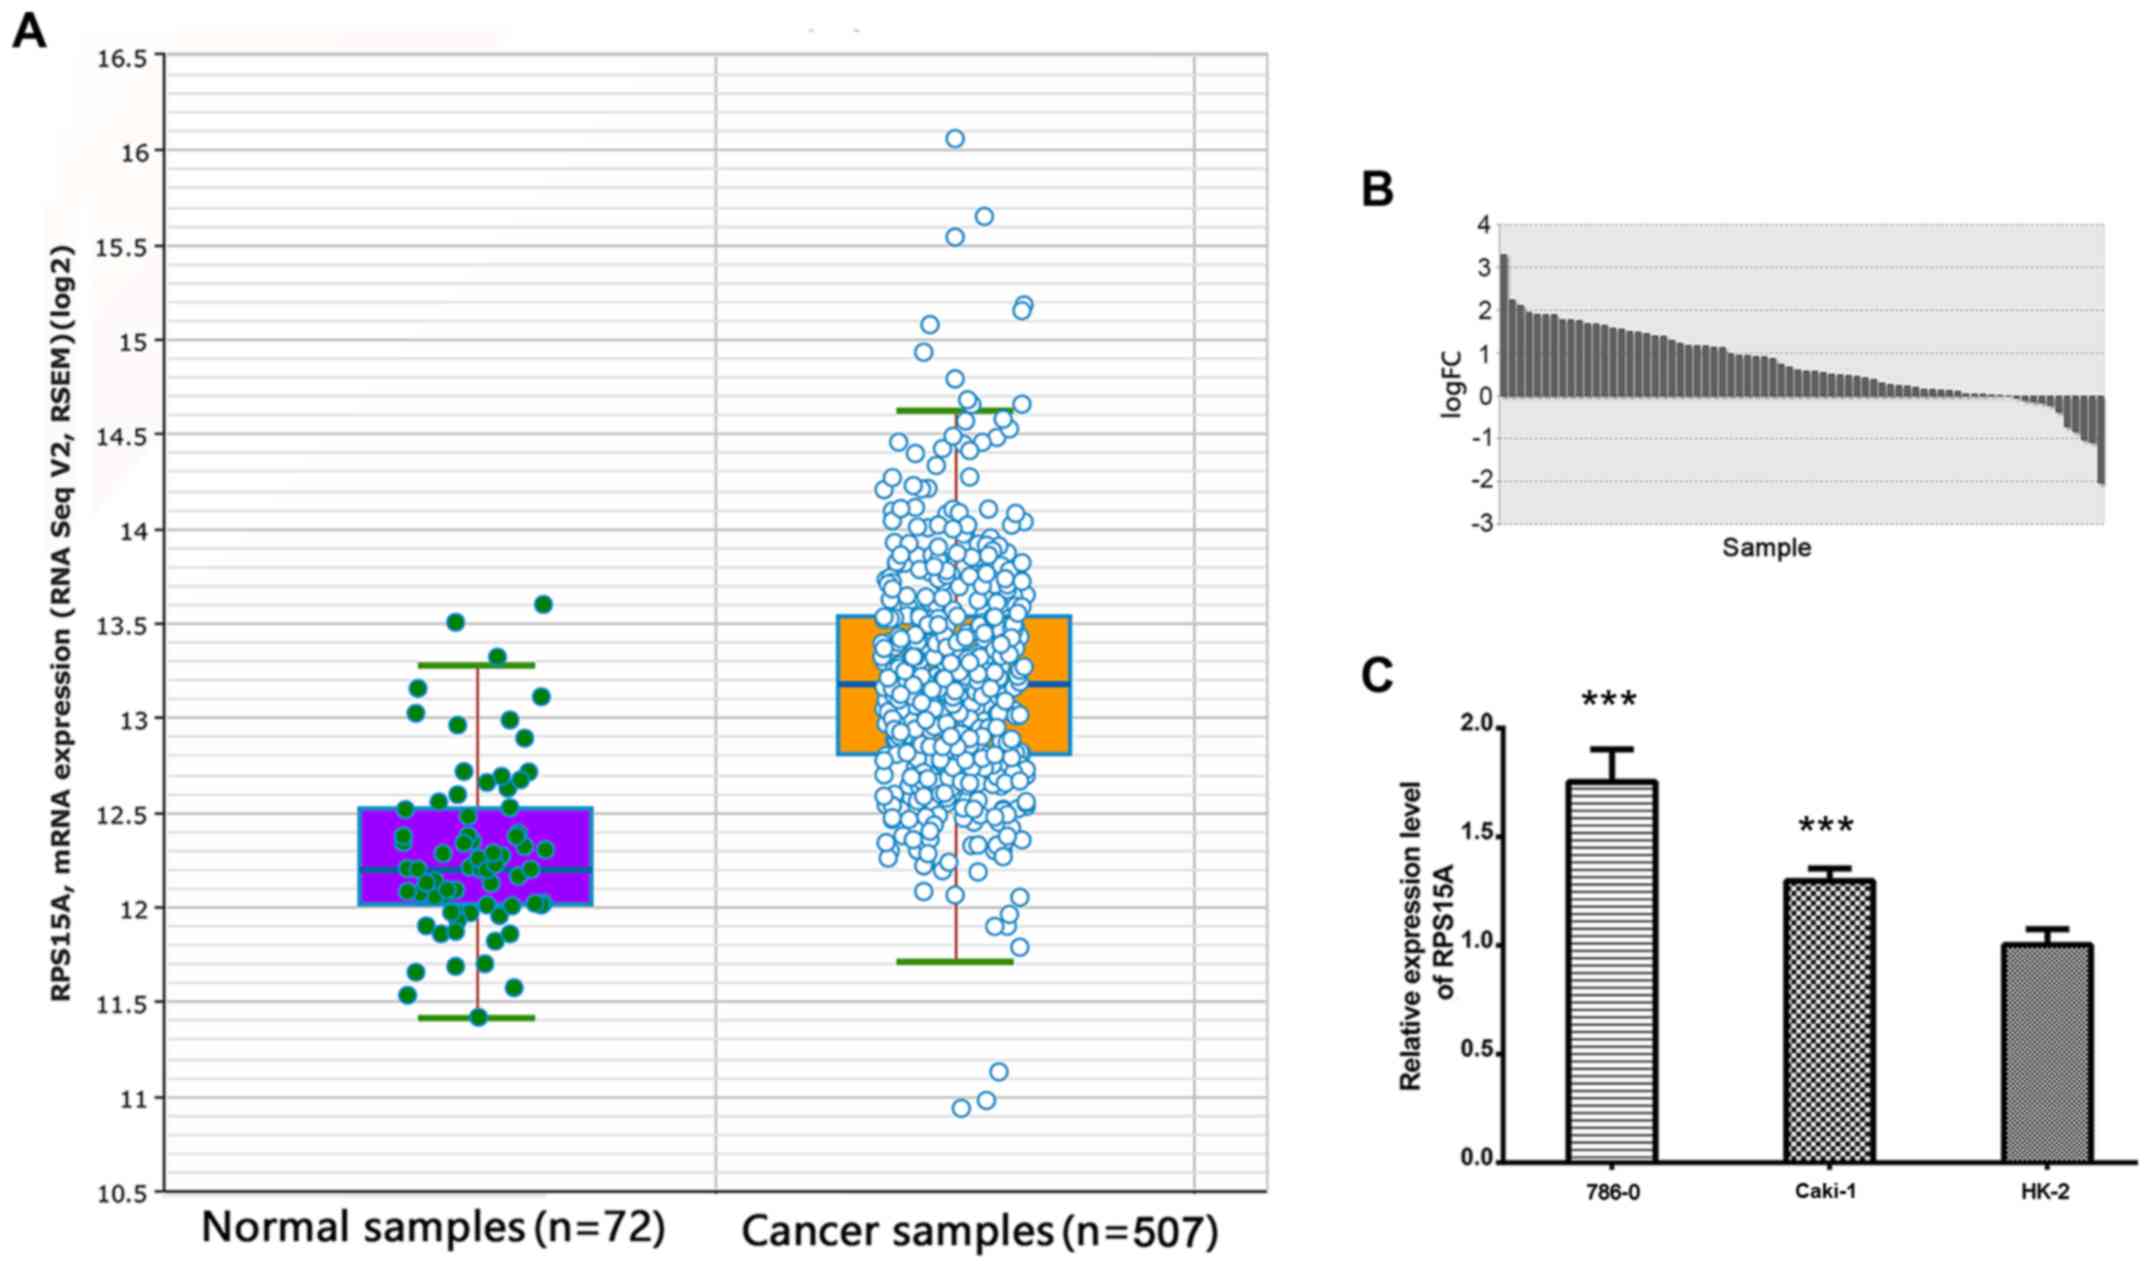
The RNA-seq data from TCGA was analysed, and the
expression of RPS15A was identified to be significantly higher in
RCC compared with the normal group (FC=1.89; P<0.001; Fig. 1A). In the 72 paired RCC tissues,
RPS15A expression was further identified to be higher in RCC
compared with the adjacent normal tissues (FC=1.73; P<0.001;
Fig. 1B). Subsequently, the
overexpression of RPS15A was validated in multiple RCC cohorts from
the Oncomine database (P<0.05; Table I). These data suggested that RPS15A
was highly expressed in RCC tissues.
 | Table I.Ribosomal protein S15A differential
transcript expression in renal cell carcinoma extracted from
multiple studies in the Oncomine databases. |
Table I.
Ribosomal protein S15A differential
transcript expression in renal cell carcinoma extracted from
multiple studies in the Oncomine databases.
| Author, year | Comparison between
groups | Fold change | P-value | (Refs.) |
|---|
| Jones et al,
2005 | Papillary renal
cell carcinoma (n=11) vs. normal (n=23) | 2.123 |
9.33×10⁻¹⁶ | (36) |
| Jones et al,
2005 | Clear cell renal
cell carcinoma (n=23) vs. normal (n=23) | 1.840 |
4.93×10⁻¹² | (36) |
| Higgins et
al, 2003 | Clear cell renal
cell carcinoma (n=24) vs. normal (n=3) | 1.788 |
3.0×10⁻² | (37) |
| Yusenko et
al, 2009 | Chromophobe renal
cell carcinoma (n=4) vs. normal (n=5) | 1.514 |
2.6×10⁻² | (38) |
To determine whether the high expression of RPS15A
transcripts exists in RCC cell lines, RT-qPCR was performed to
detect the RPS15A mRNA expression levels in 786-O, Caki-1 and HK-2
cells. Among them, the 786-O and Caki-1 cell lines highly expressed
RPS15A mRNA compared with the HK-2 cells (P<0.001; Fig. 1C).
Lv-shRPS15A-mediated knockdown of
RPS15A inhibits the growth and proliferation of 786-O cells
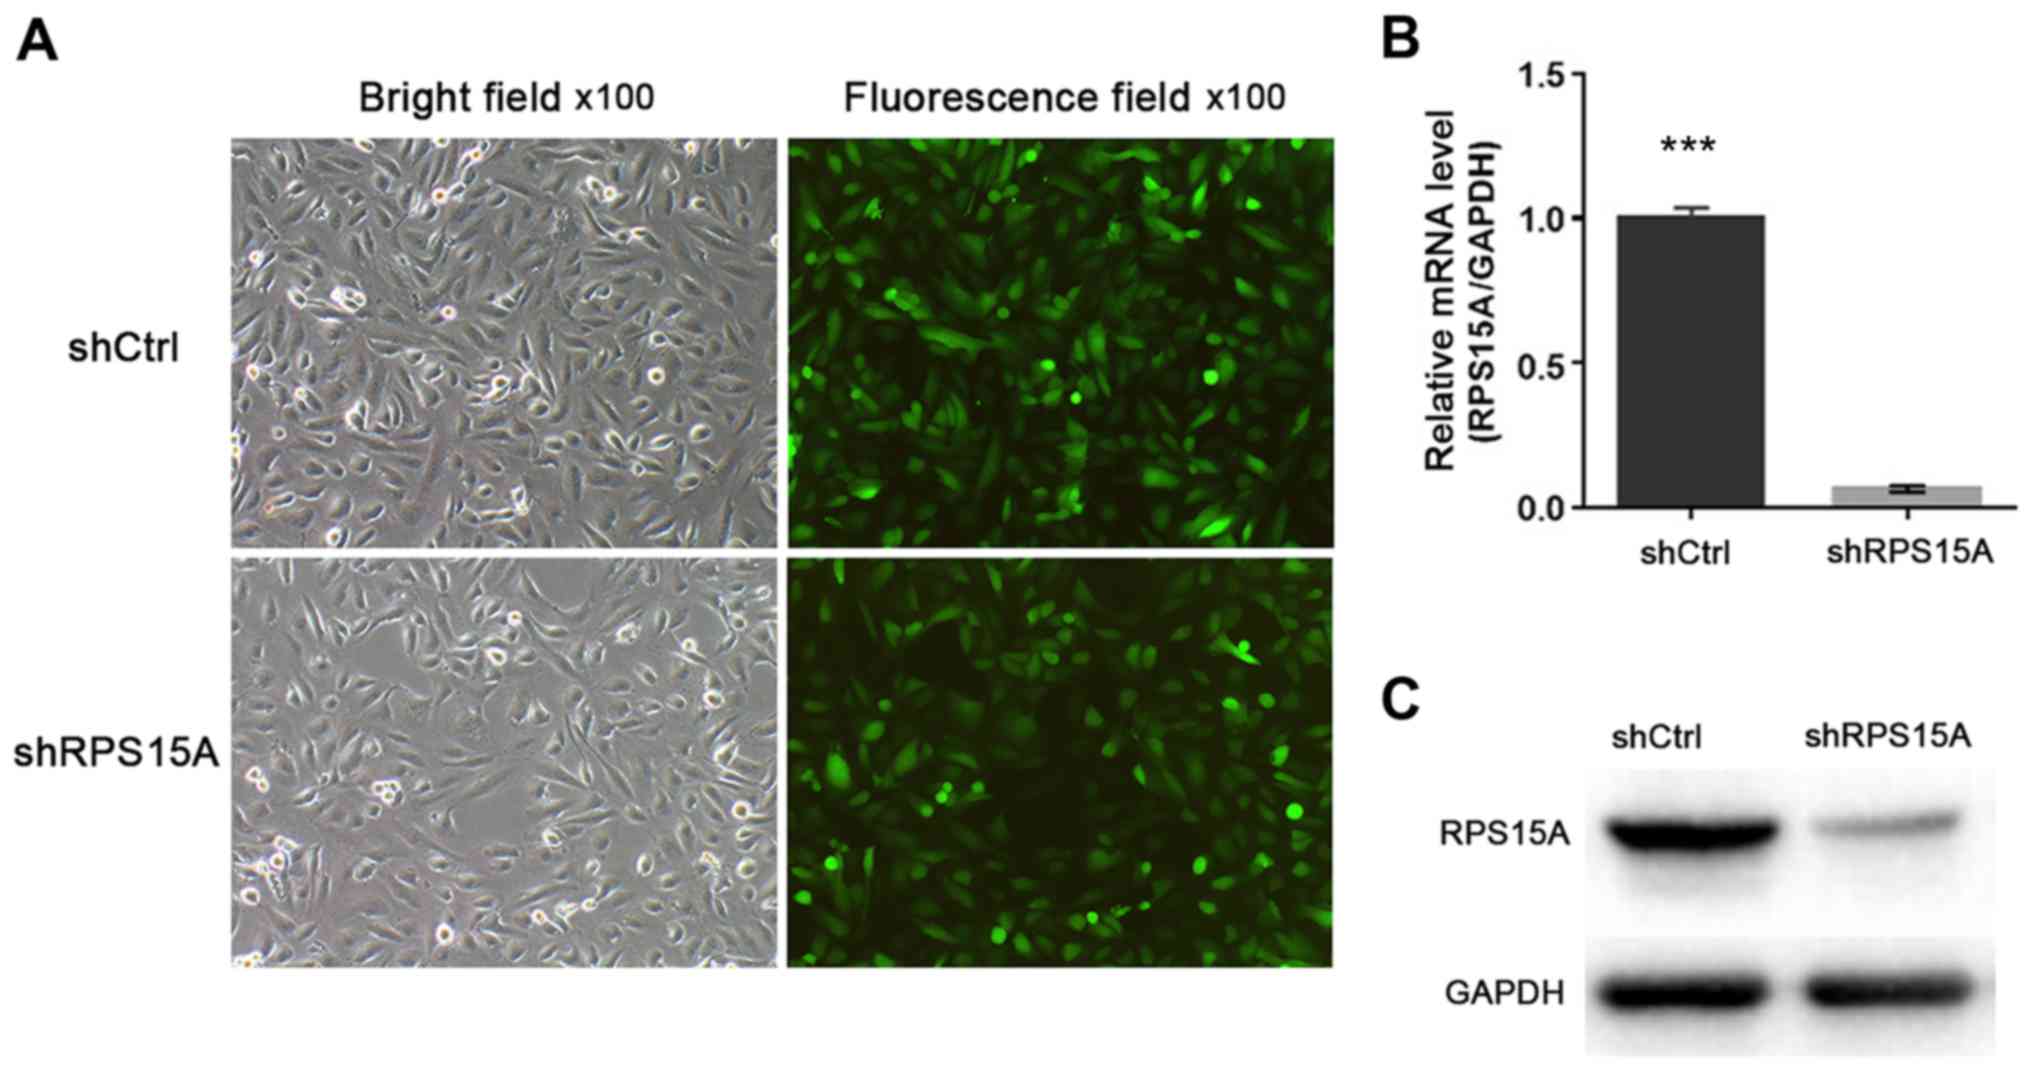
To study the function of RPS15A in RCC, RPS15A
expression in 786-O cells was knocked down using stable
Lv-shRPS15A. The 786-O cells were infected with Lv-shRPS15A or
Lv-shCtrl. Subsequently, the infection efficiency was calculated to
be >80% according to the ratio of GFP-expressing cells to total
cells under a fluorescence microscope at 72 h post-transduction
(Fig. 2A). RT-qPCR and western
blot assays were used to examine the targeted gene silencing
effects of Lv-shRPS15A in 786-O cells (Fig. 2B and C).
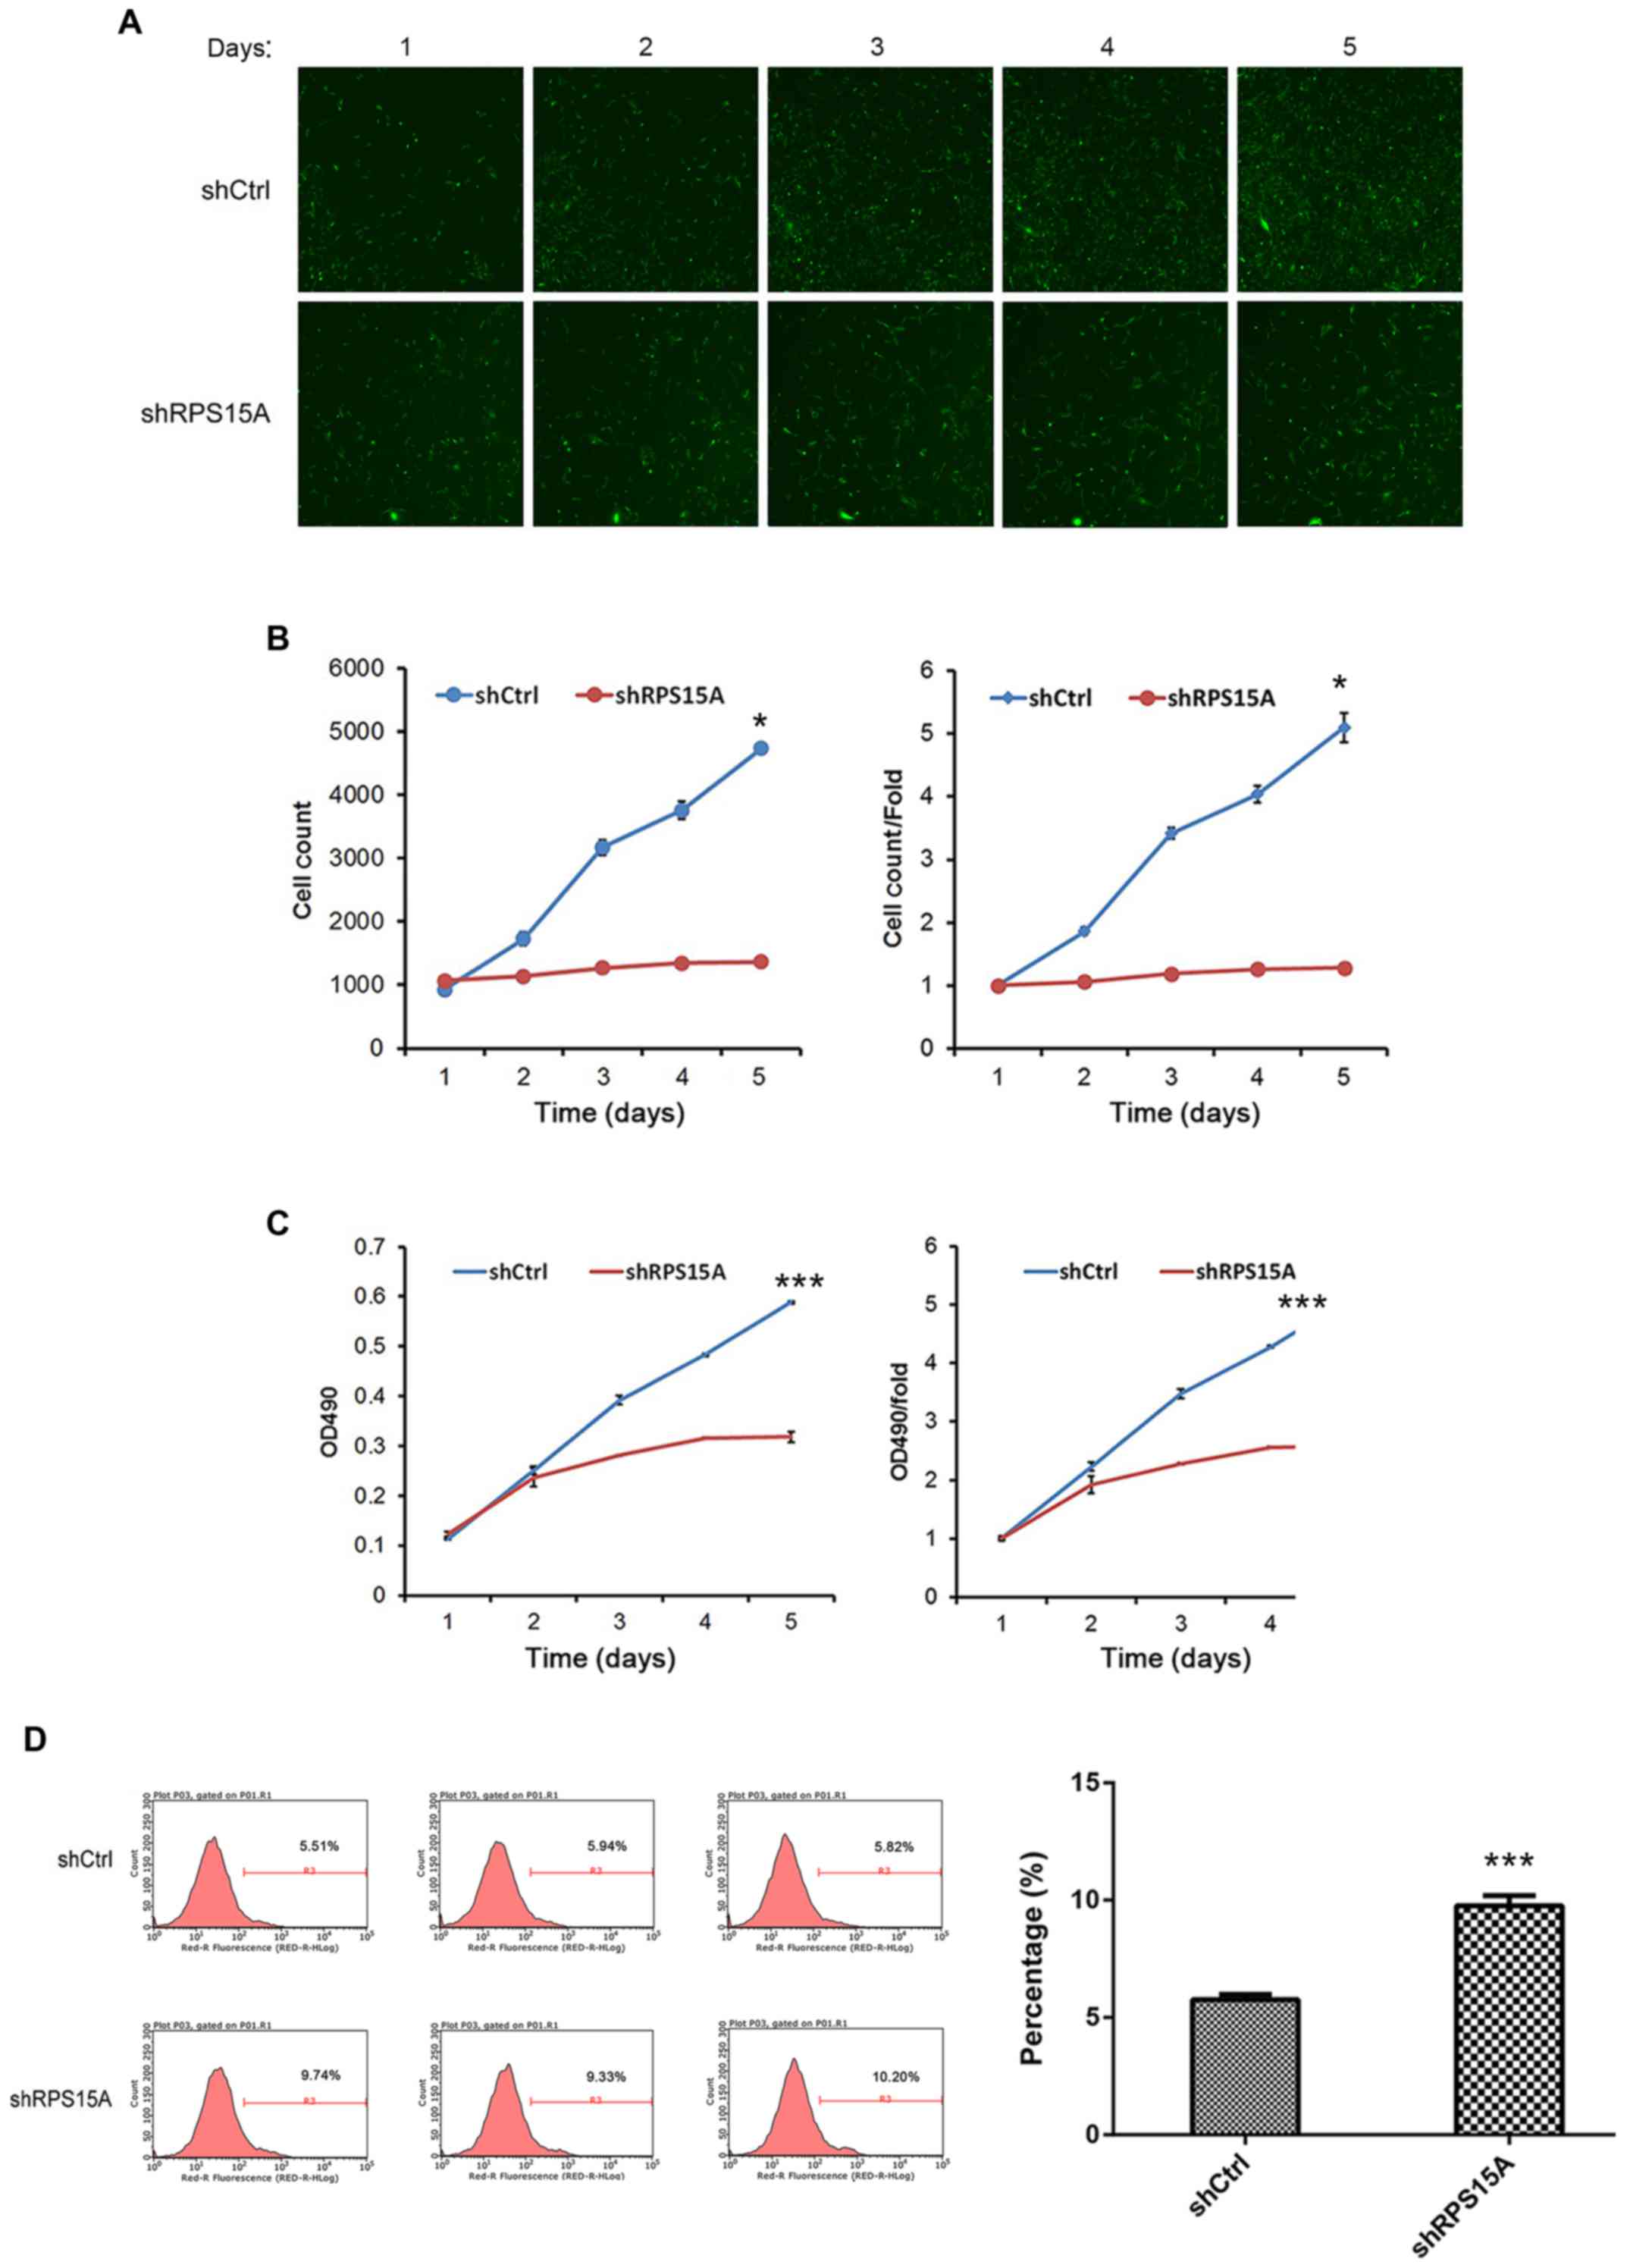
Subsequently, the growth and proliferative abilities
of Lv-shRPS15A-infected and Lv-shCtrl-infected 786-O cells were
examined by Celigo counting and MTT assay, respectively. From the
cell fluorescence images and cell growth curve diagrams, the cell
growth rate in the Lv-shRPS15A group was significantly inhibited
compared with the Lv-shCtrl group (P<0.05; Fig. 3A and B). Additionally, the MTT
assay was performed, and the proliferation of Lv-shRPS15A-infected
cells was decreased compared with the Lv-shCtrl-infected cells at
the time points of 2, 3, 4 and 5 days (P<0.001; Fig. 3C). The results suggested that the
depletion of RPS15A significantly inhibited the growth and
proliferative abilities of 786-O cells in vitro.
Lv-shRPS15A-mediated knockdown induces
the apoptosis and necrosis of 786-O cells
To examine the underlying mechanism of RPS15A in RCC
cell apoptosis/necrosis, Annexin V-APC staining was performed, and
the percentage of apoptotic/necrotic cells was assessed by flow
cytometry. Compared with the Lv-shCtrl group, the proportion of
apoptotic/necrotic cells was significantly higher in the
Lv-shRPS15A group (9.75±0.44% vs. 5.76±0.22%; P=0.0001; Fig. 3D). This result suggested an
association between RPS15A and 786-O cell apoptosis/necrosis; the
knockdown of RPS15A may trigger apoptosis in RCC cells; however,
this requires further investigation.
Lv-shRPS15A-mediated knockdown of
RPS15A inhibits tumour formation and growth in vivo
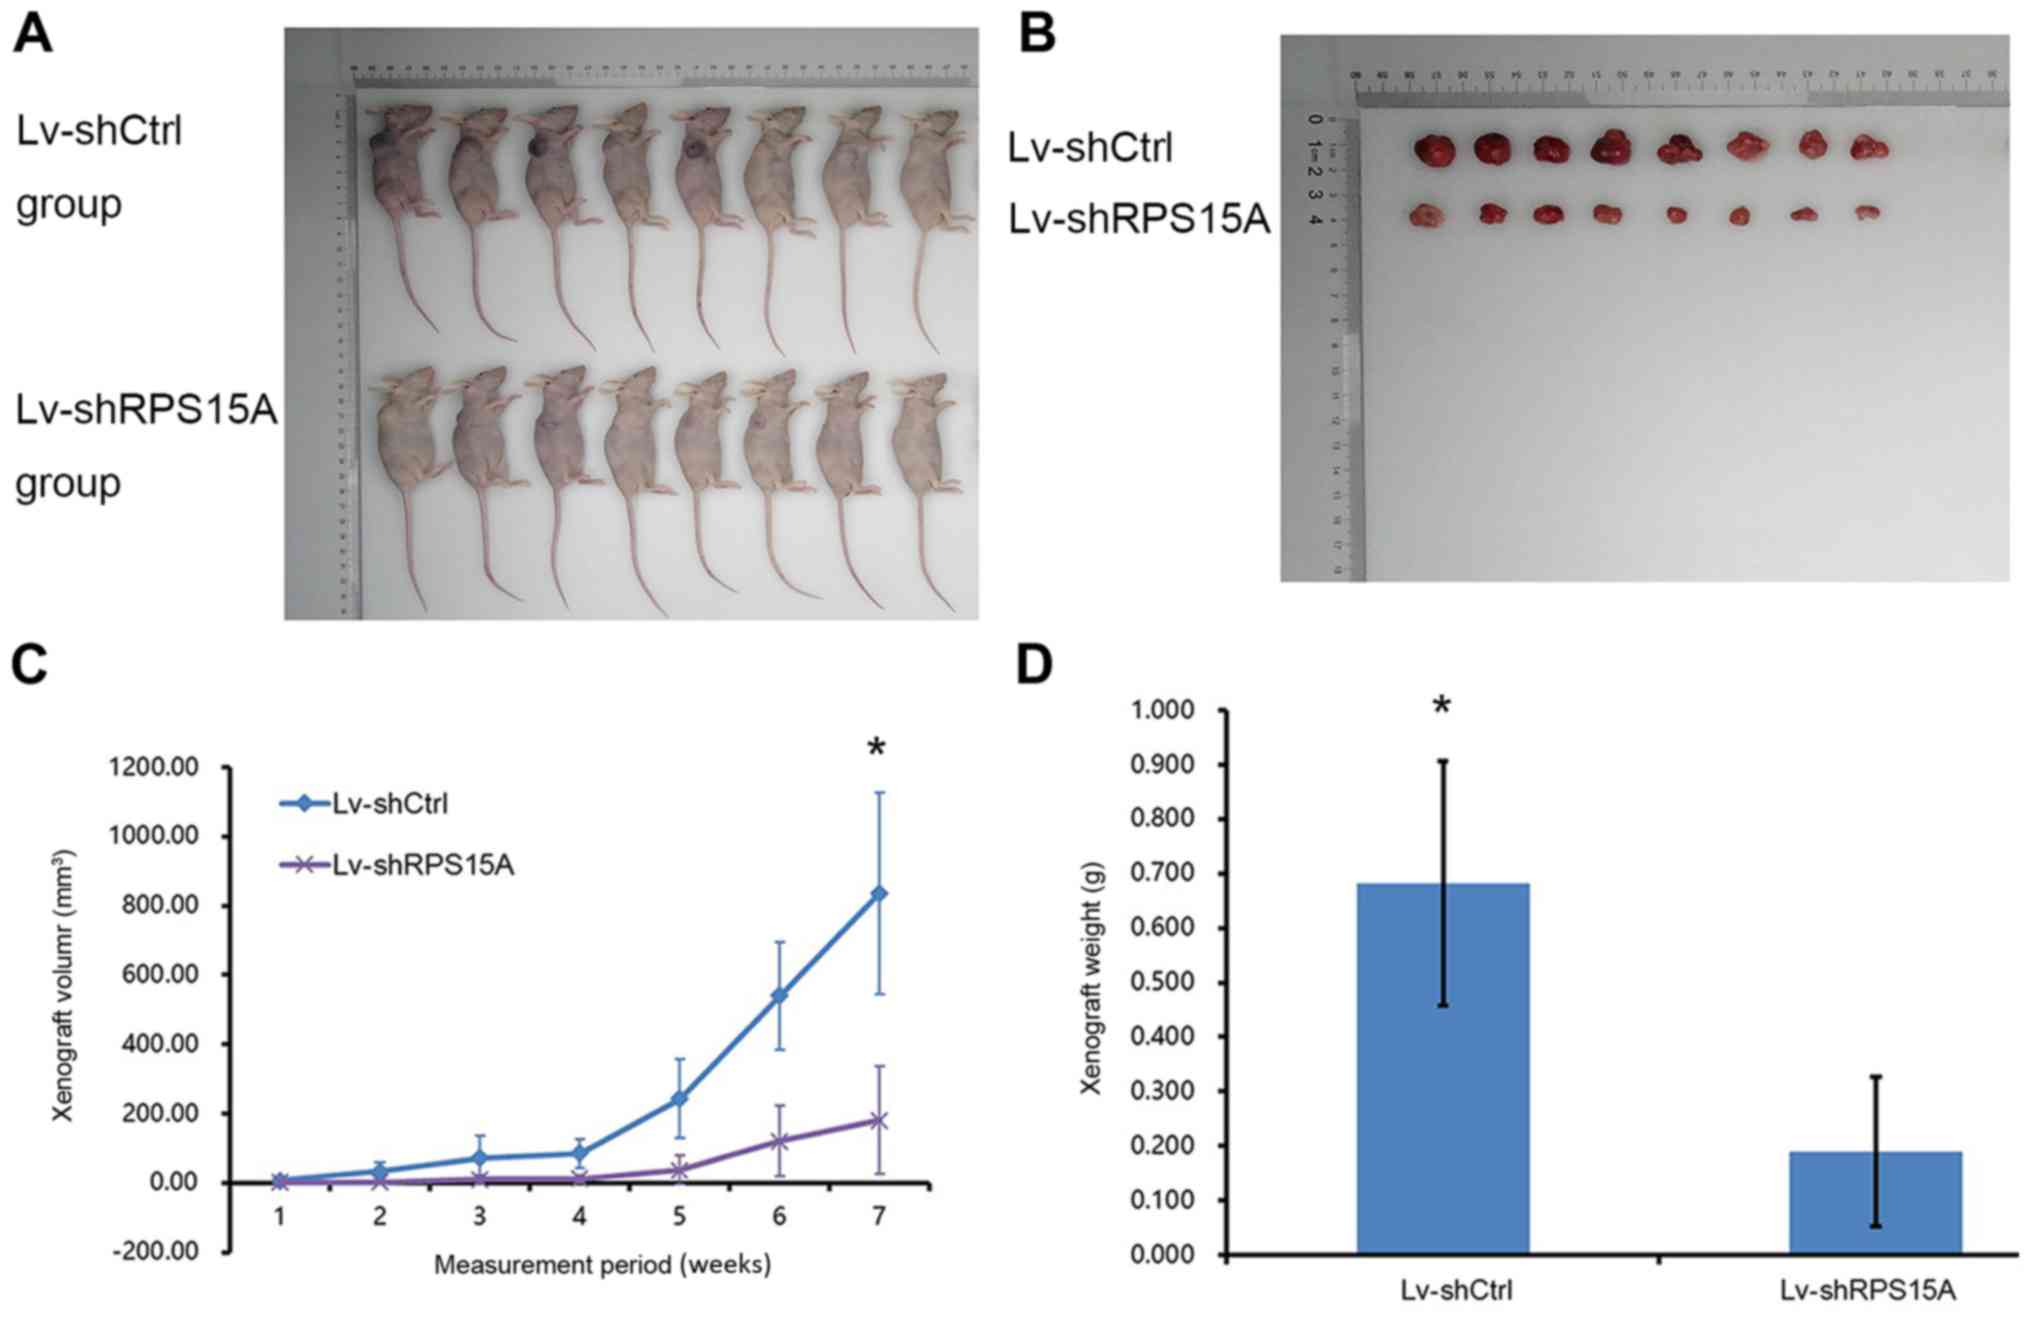
To test the potential role of RPS15A in RCC cell
growth in vivo, a nude mouse xenograft model was established
(Fig. 4A and B). From the curves
of tumour formation, it was observed that the daily xenograft
growth volume of the Lv-shRPS15A group was significantly decreased
compared with the Lv-shCtrl group (P<0.05; Fig. 4C). Additionally, the average weight
of xenografts from Lv-shRPS15A-injected mice was 0.189±0.137 g,
which was decreased compared with the control group (0.683±0.225 g)
at week 7 post-injection (P<0.05; Fig. 4D). These results demonstrated that
the knockdown of RPS15A expression decreased the growth of tumours
in size and weight, which suggested an important function of RPS15A
in RCC tumour formation in vivo.
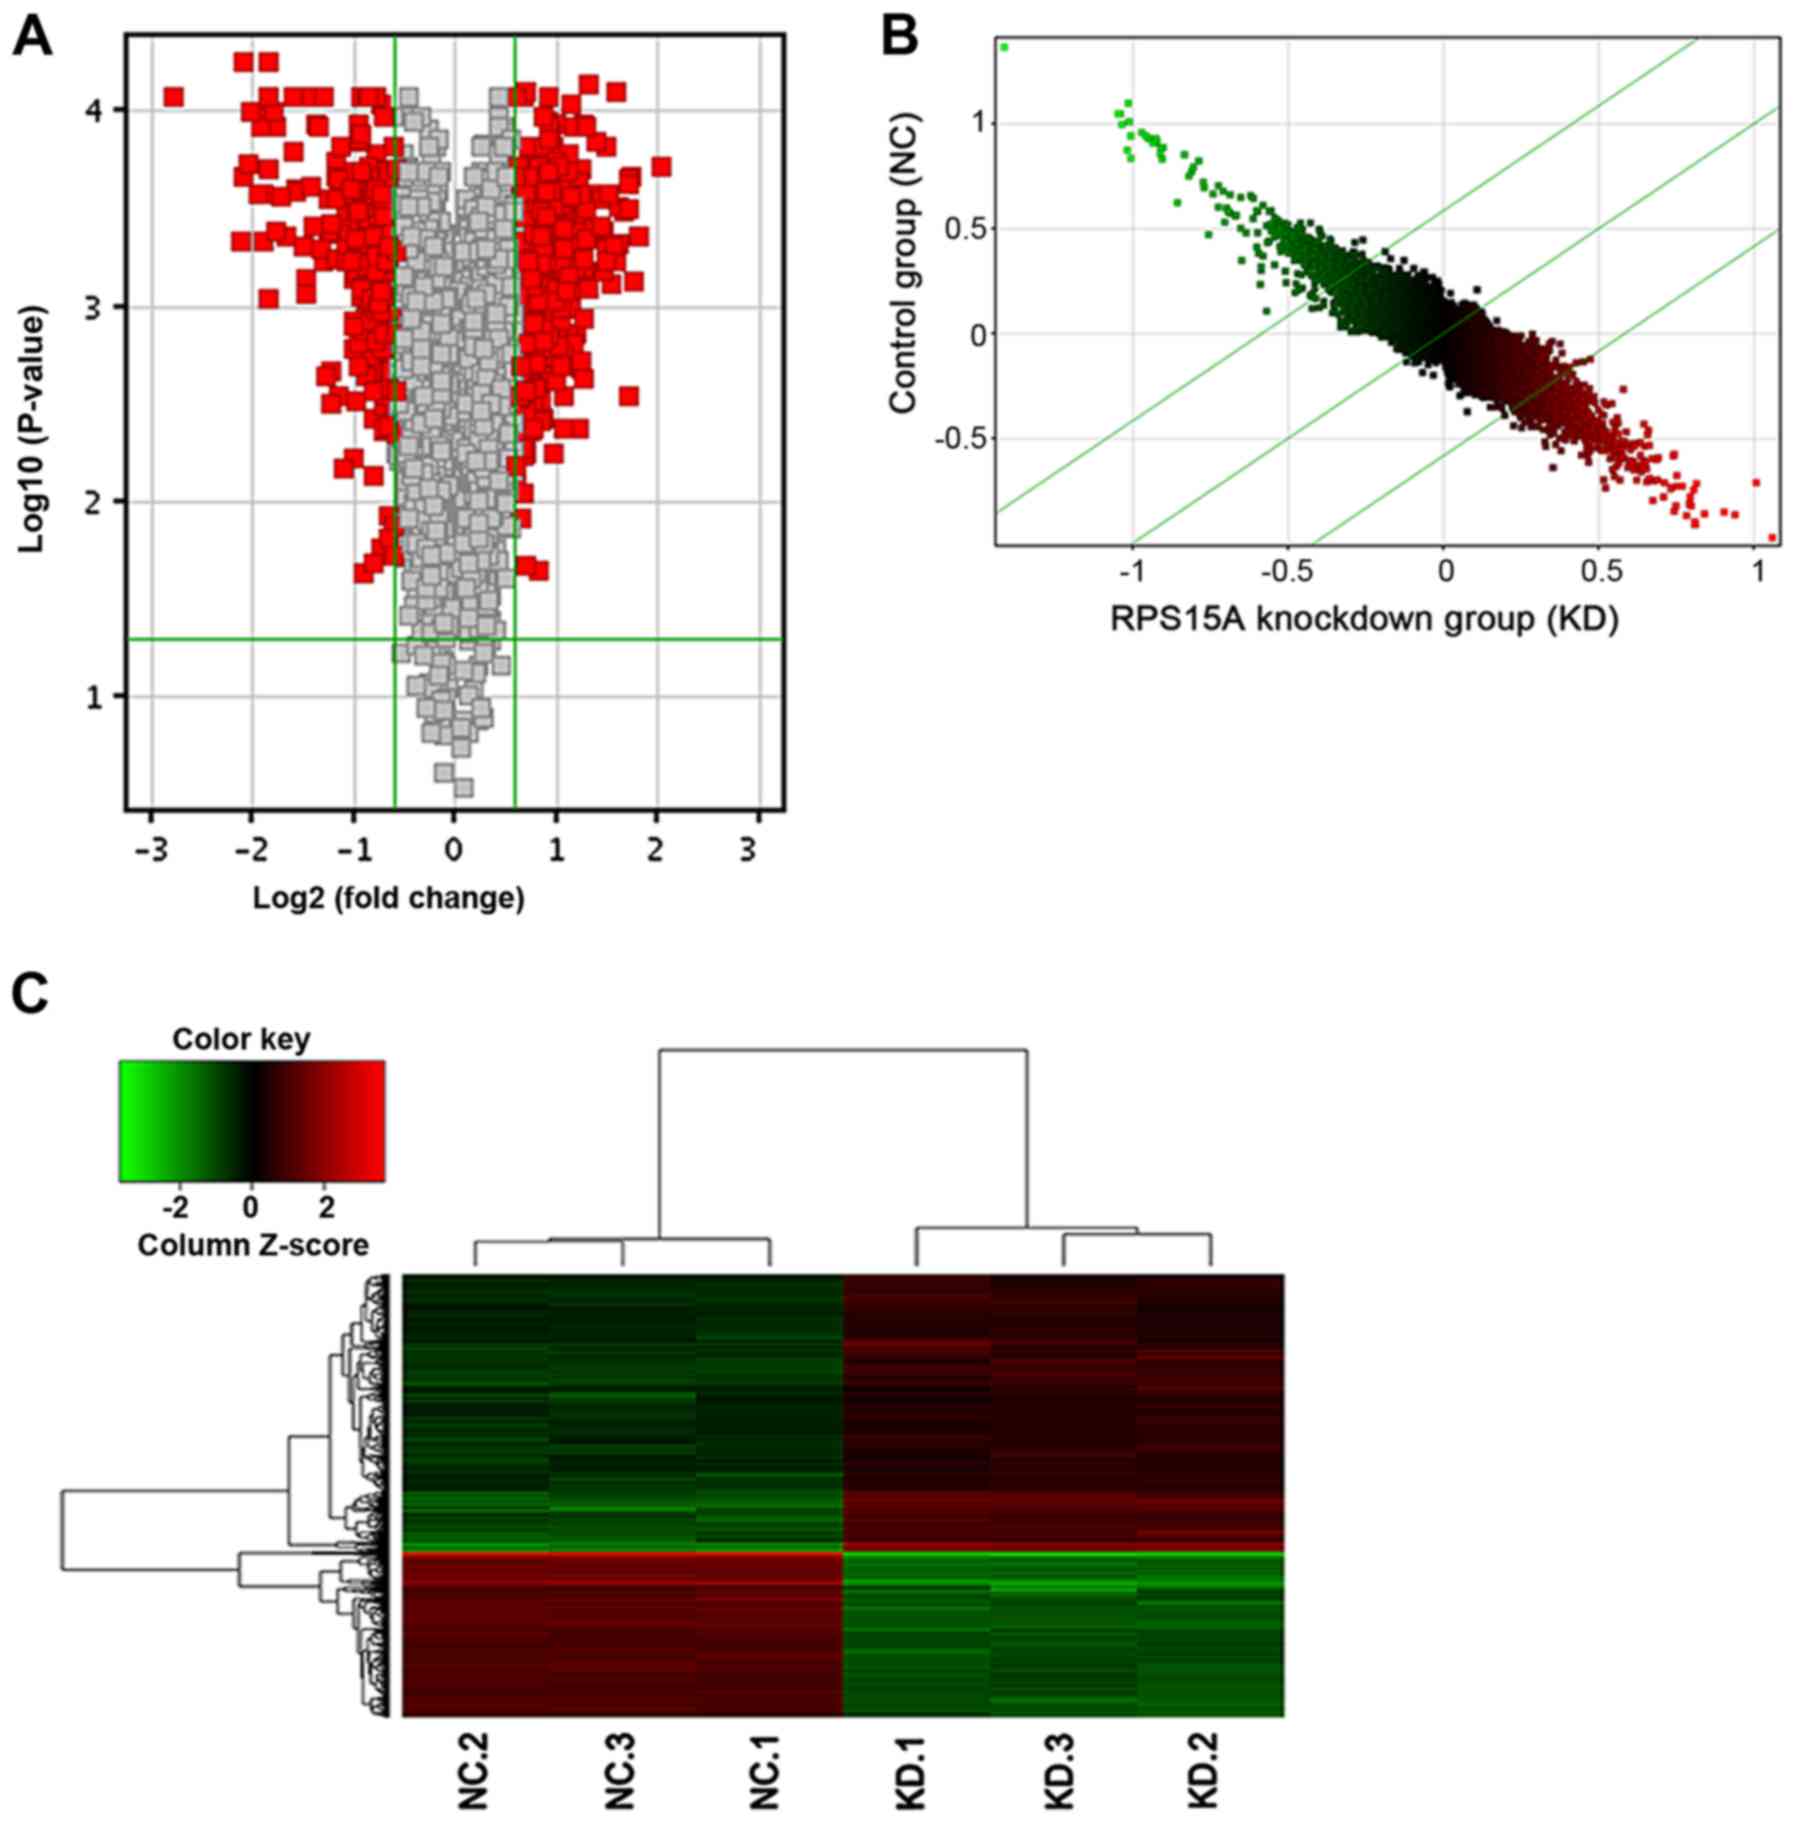
Identification of differentially
expressed genes in lentiviral-transduced 786-O cells
The Affymetrix GeneChip® PrimeView™ Human
Gene Expression Arrays were used to determine differences in gene
expression levels in total RNA samples between Lv-shRPS15A- and
Lv-shCtrl-infected 786-O cells. In total, 747 genes were identified
as differentially expressed. Among these, the expression levels of
469 genes were upregulated and 278 genes were downregulated
(Fig. 5).
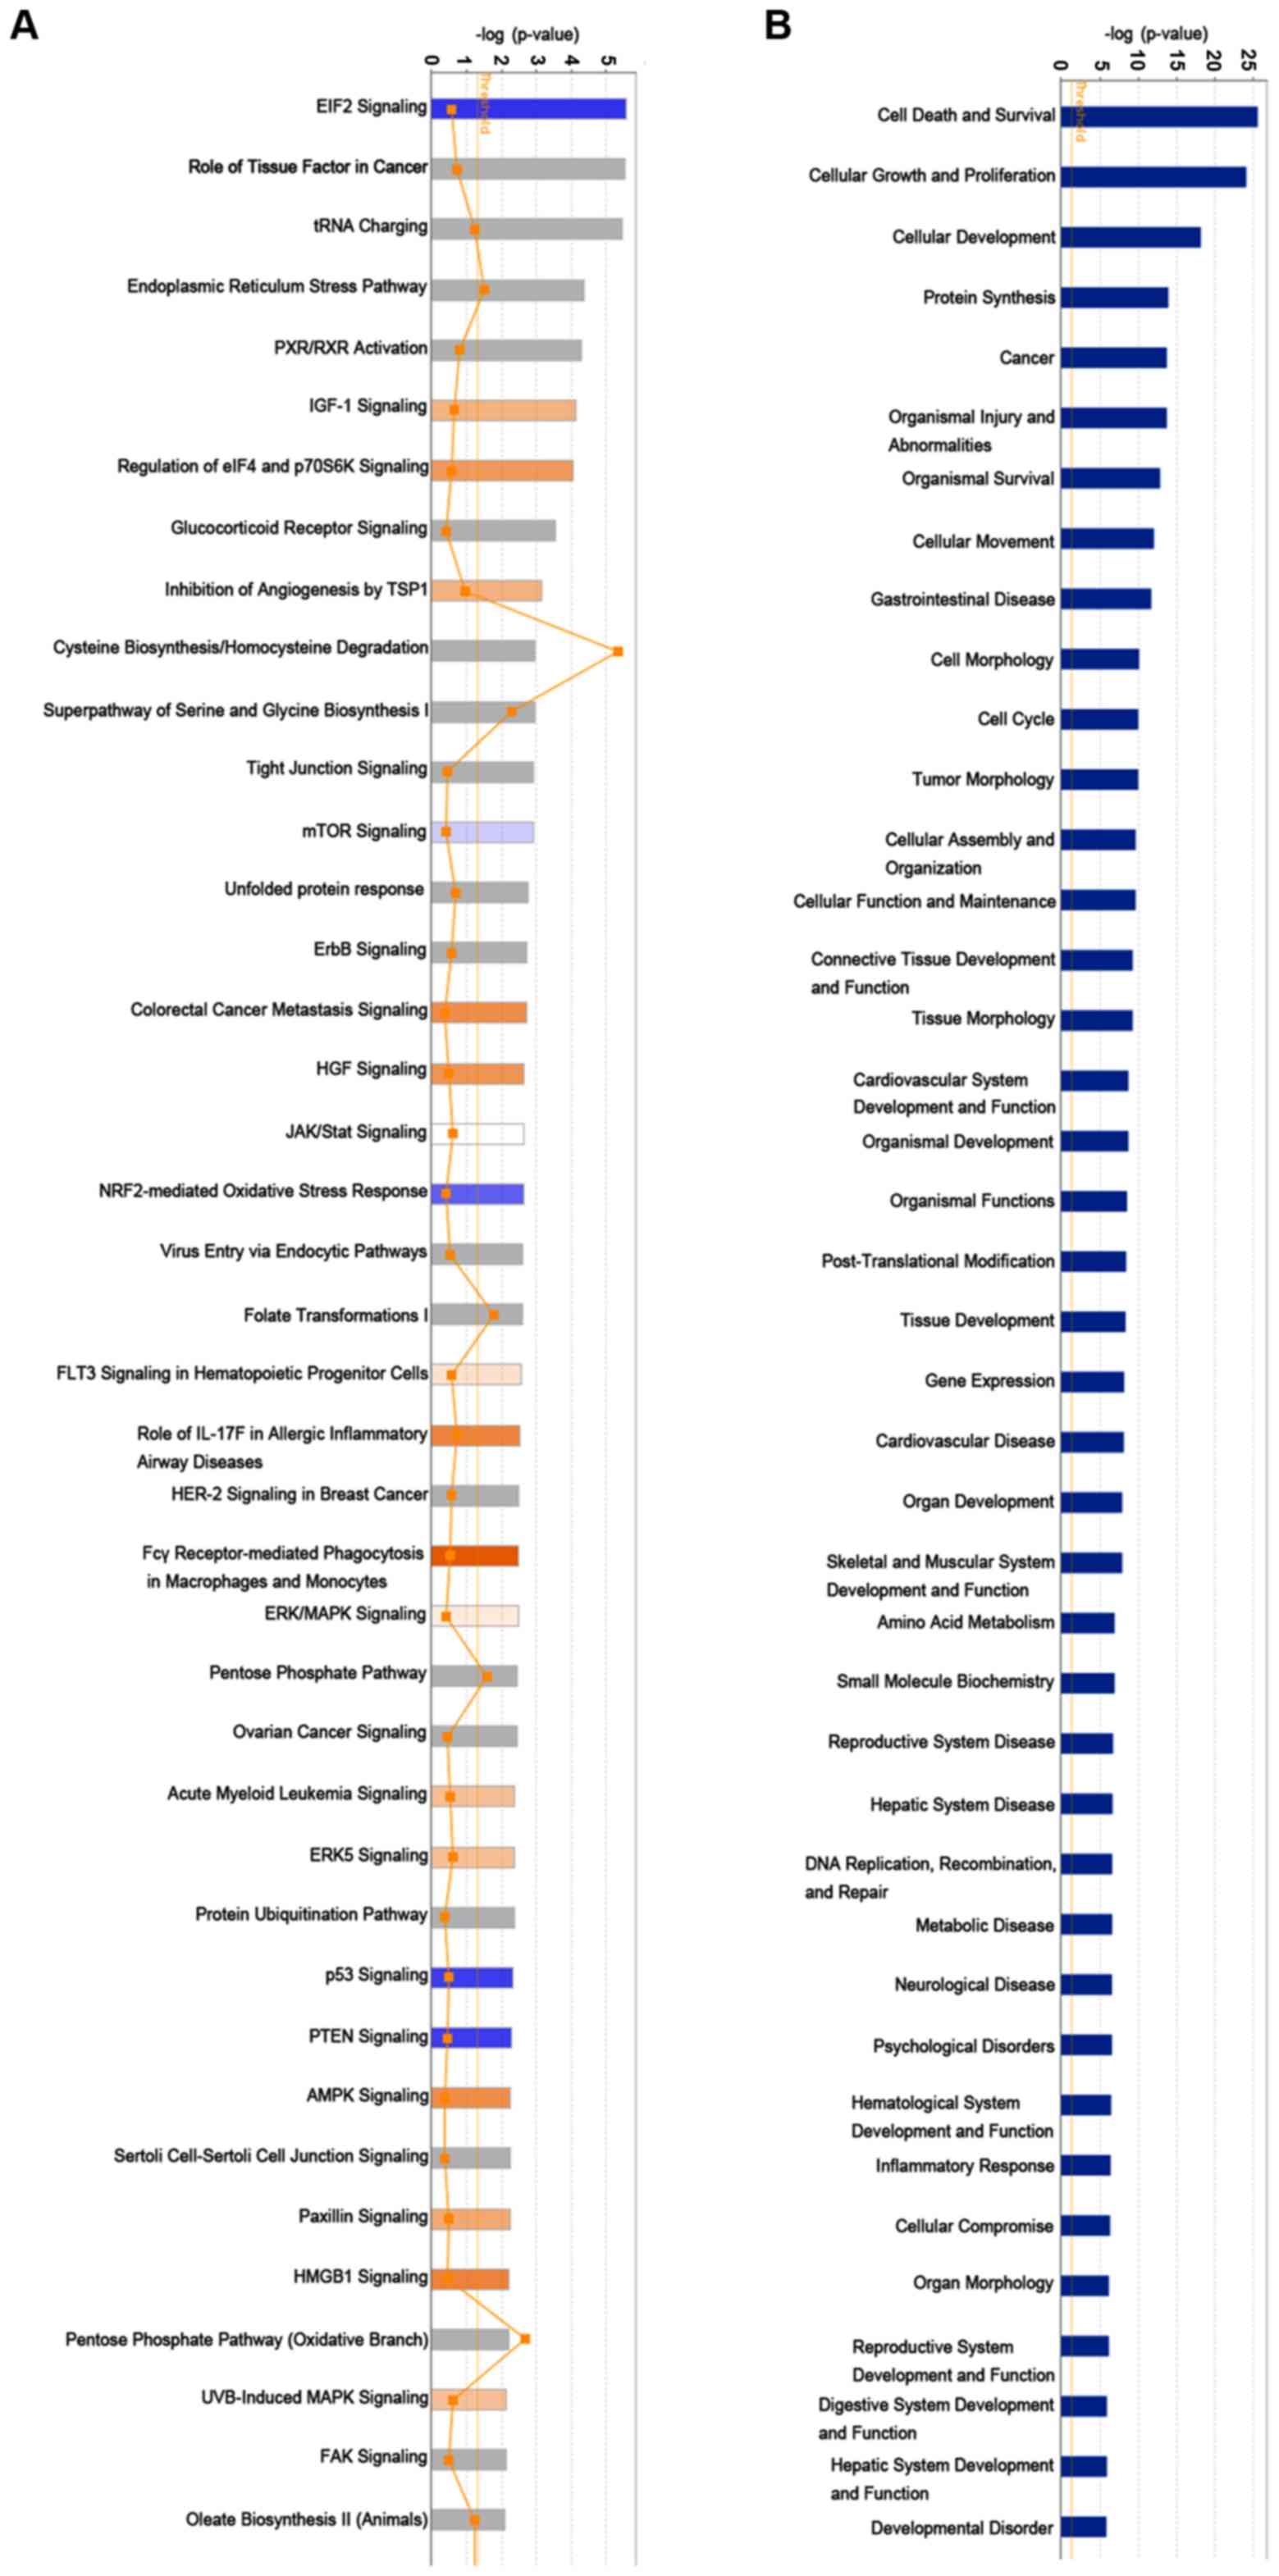
Pathway, functional enrichment and
interaction network analyses of RPS15A
To further examine the associated signatures and
functions of RPS15A in RCC, the microarray information was analysed
by IPA. The data demonstrate the enrichment condition of
differentially expressed genes in canonical signalling pathways
(Fig. 6A), and it was identified
that subsequent to silencing RPS15A, multiple signalling pathways
were enriched, including the ‘Fcγ receptor-mediated phagocytosis in
macrophages and monocytes’ and ‘EIF2 signaling’ pathways.
Additionally, in the disease and functions enrichment analysis it
was identified that the knockdown of RPS15A may induce the
alteration of numerous biological functions, such as ‘cell death
and survival’, ‘cellular growth and proliferation’ and ‘cellular
development’ (Fig. 6B).
Subsequently, the interaction networks of genes were
integrated based on microarray data and previous reports (Fig. 7). The results demonstrated a
multiple gene network of RPS15A in RCC. In this network, no
upregulated genes were noted. Among the downregulated genes, cell
division cycle 42, cyclin dependent kinase inhibitor 1C (CDKN1C),
DNA damage inducible transcript 3 (DDIT3), eukaryotic translation
initiation factor 4E binding protein 1 (EIF4EBP1), heat shock
protein family A (Hsp70) member 5 and MYC proto-oncogene, bHLH
transcription factor (MYC) were predicted to be the upstream genes
of RPS15A, but also detected to be downregulated following the
silencing of RPS15A. These data further suggested an indirect and
complicated association between RPS15A and these signatures in the
regulation of proliferation and apoptosis in RCC cells.
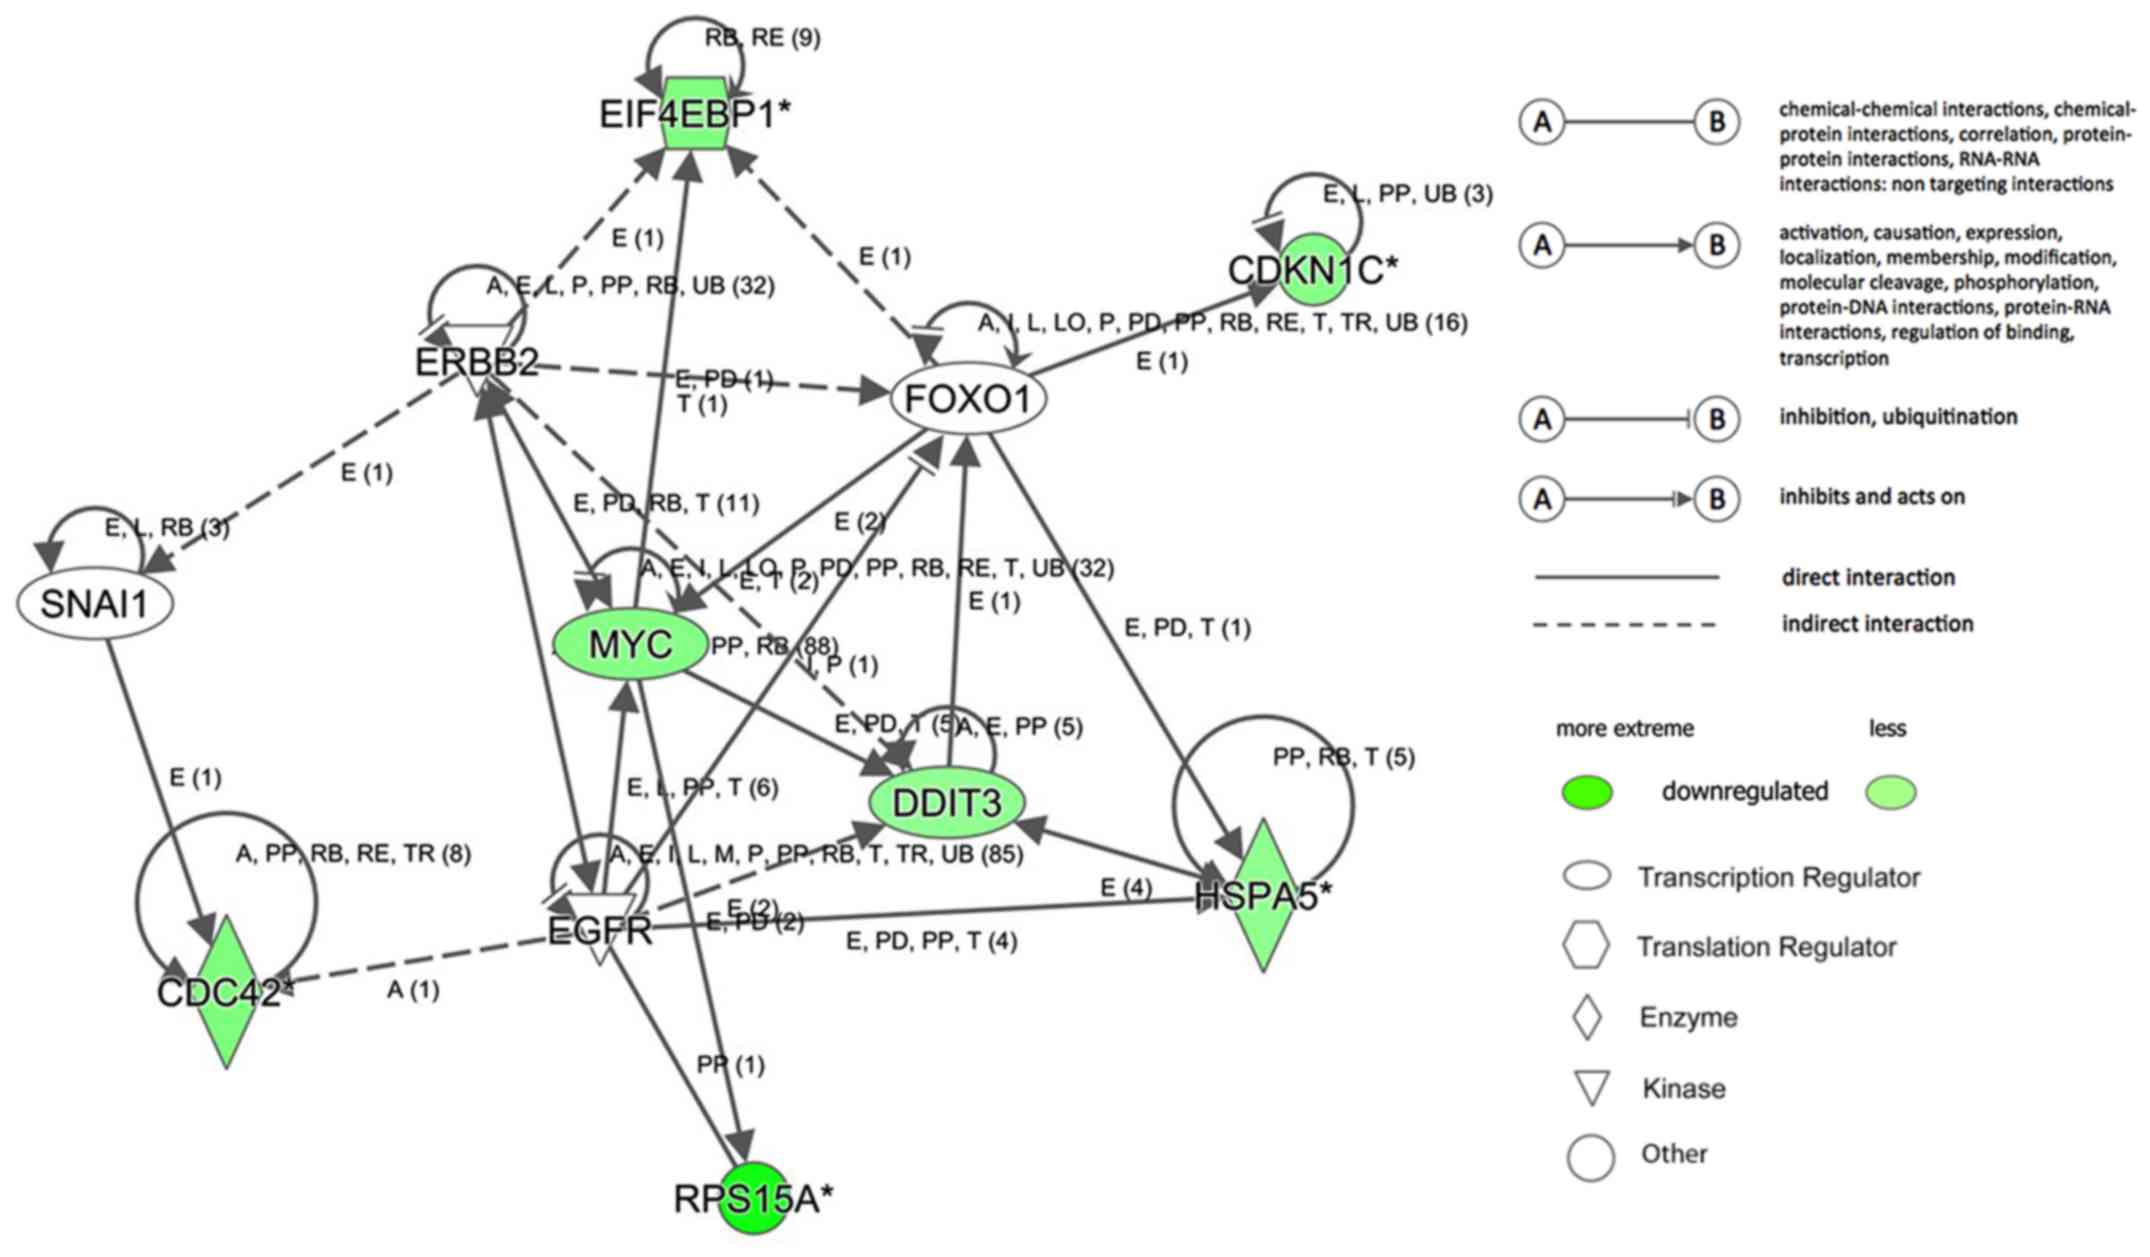 | Figure 7.Networks and RPS15A downstream genes.
Regulator effects analysis and interaction networks of genes. The
predicted downregulated molecules are marked in green. CDKN1C,
cyclin dependent kinase inhibitor 1C; DDIT3, DNA damage inducible
transcript 3; EGFR, epidermal growth factor receptor 1; EIF4EBP1,
eukaryotic translation initiation factor 4E binding protein 1;
ERBB2, erb-b2 receptor tyrosine kinase 2; FOXO1, forkhead box O1;
HSPA5, heat shock protein family A (Hsp70) member 5; MYC, MYC
proto-oncogene, bHLH transcription factor; RPS15A, ribosomal
protein S15A; SNAI1, snail family transcriptional repressor 1. |
Discussion
RPs, initially thought to be ‘housekeeping’ genes,
are now considered to be associated with tumorigenesis due to their
diverse extraribosomal functions (9). The dysregulation of RPS15A was
observed to serve a key role in multiple tumours (22). The present study aimed to examine
the function of RPS15A in RCC, and detected abnormally high
expression levels of RPS15A in RCC samples and cell lines. This
high expression suggested a malignant function of RPS15A in RCC.
Using an Lv-mediated RNA interference system, the suppression of
RPS15A notably inhibited 786-O cell proliferation and induced its
apoptosis and necrosis. Additionally, the transfected cells
demonstrated a decreased ability of tumour formation and growth
in vivo. Furthermore, it was identified that 469 genes were
upregulated and 278 were downregulated in the Lv-shRPS15A group
using gene chip analysis and a genetic interaction network of
RPS15A in RCC was mapped using IPA analysis.
By summarizing the IPA outcomes, it was observed
that subsequent to knocking down RPS15A in 786-O cells, the
functional signalling pathway of ‘cell death and survival’ and
‘cellular growth and proliferation’ were altered. Furthermore, the
possible signalling pathways involved were evaluated, such as ‘Fcγ
receptor-mediated phagocytosis in macrophages and monocytes’. Fc
receptor (FcR) activation was demonstrated to be tightly regulated
to prevent immune responses, and cytokines associated with
inflammation were able to increase FcR avidity (23). Additionally, in the inflammation
environment, tumour-associated macrophages contribute to RCC
progression and tumour angiogenesis (24). These data demonstrated that
multiple regulatory signalling pathways are involved in the RPS15A
network, which were important in RCC development.
Downstream of RPS15A, CDKN1C was recognized as a
negative regulator of cell proliferation and tumour invasion
(25), and DDIT3 was activated by
endoplasmic reticulum stress, which was responsible for an
anti-proliferative effect (26).
These genes were downregulated, suggesting decreased activities.
Additionally, MYC was identified as a hallmark gene in multiple
cancer cells (27). The MYC/EIF4E
axis was previously observed to induce mammalian target of
rapamycin (mTOR) inhibition in small cell lung cancer, and
EIF4EBP1, the upstream direct inhibitor of EIF4E, was observed to
be unaltered in this axis (28).
However, these genes were identified to be downregulated in
RPS15A-knockdown 786-O cells and the findings provided preliminary
evidence on the changes in signalling pathways and related
molecules. MYC is a key inducer of the oncogenic pathway,
regulating the antitumor immune response through cluster of
differentiation 47 and programmed death-ligand 1, and its gene
expression is closely associated with disease stage and an adverse
prognosis (28–30). EIF4EBP1 encodes a member of the
family of translation repressor proteins. The expression levels of
phosphorylated EIF4EBP1 was demonstrated to be a prognostic
predictor in patients with RCC (31,32),
and it may serve as a funnel factor that converges the upstream
proliferative oncogenic signals (33). Previous studies have indicated that
eukaryotic translation initiation factor 4E-binding proteins (which
have three family members: EIF4EBP1, 2 and 3) mediate the effect of
mTORC1 to promote cell proliferation; however, not growth (thus
regulating the number, but not the size), of mammalian cells
(34,35).
There are some limitations for the present study.
Only 786-O cells were used in the functional experiments owing to
the potential tumour heterogeneity in different cell lines, such as
metastatic RCC cell line, Caki-1 cells. However, the results
provide new evidence that enriched the interaction relationships of
RPS15A, in which the specific molecular mechanisms are still
waiting to be explored.
In conclusion, the present study confirmed that
RPS15A is highly expressed in RCC samples and cell lines.
Suppression of RPS15A successfully inhibited 786-O cell growth and
induced cell apoptosis and necrosis. The direct effects of RPS15A
on promoting tumour progression through various potential
intracellular signalling pathways indicated RPS15A as a potential
therapeutic target in RCC.
Acknowledgements
The abstract of the present study was presented at
the 38th congress of the Société Internationale d'Urologie Seoul
Dragon City, October 4–7, 2018 and published in World Journal of
Urology 36 (Suppl 1): 2018.
Funding
The present study was supported by The Science and
Technology Foundation of Sichuan Province (grant no. 2014JY0183 to
Yiping Lu and grant no. 2017SZ0123 to Zhihong Liu) and 1.3.5
Project for Disciplines of Excellence, West China Hospital, Sichuan
University (Chengdu, China).
Availability of data and materials
The results from the present study are based partly
on data generated by The Cancer Genome Atlas Research Network
(cancergenome.nih.gov). The analysed data
sets generated during the current study are available from the
corresponding author on reasonable request.
Authors' contributions
JL, ZL and YL conceived and designed the present
study. JL, ZL, ZZ, XW and CZ developed the methodology. JL, ZL, YT,
FZ, KW and CZ analysed and interpreted the data. JL, ZL and YL
wrote the manuscript. All authors read and approved the final
manuscript.
Ethics approval and consent to
participate
All data in the present study involving human
participants were collected from a publicly available database. For
this type of study, formal consent was not required. All
experimental procedures and animal work were conducted under the
principles and procedures by The National Institutes of Health
(Bethesda, MD, USA) and approved by the Animal Ethics Committee of
West China Hospital.
Patient consent for publication
Not applicable.
Competing interests
The authors declare that they have no competing
interests.
References
|
1
|
Warner JR and McIntosh KB: How common are
extraribosomal functions of ribosomal proteins? Mol Cell. 34:3–11.
2009. View Article : Google Scholar : PubMed/NCBI
|
|
2
|
Lindstrom MS and Zhang Y: Ribosomal
protein S9 is a novel B23/NPM-binding protein required for normal
cell proliferation. J Biol Chem. 283:15568–15576. 2008. View Article : Google Scholar : PubMed/NCBI
|
|
3
|
Volarevic S, Stewart MJ, Ledermann B,
Zilberman F, Terracciano L, Montini E, Grompe M, Kozma SC and
Thomas G: Proliferation, but not growth, blocked by conditional
deletion of 40S ribosomal protein S6. Science. 288:2045–2047. 2000.
View Article : Google Scholar : PubMed/NCBI
|
|
4
|
He H and Sun Y: Ribosomal protein S27L is
a direct p53 target that regulates apoptosis. Oncogene.
26:2707–2716. 2007. View Article : Google Scholar : PubMed/NCBI
|
|
5
|
Jang CY, Lee JY and Kim J: RpS3, a DNA
repair endonuclease and ribosomal protein, is involved in
apoptosis. FBS Lett. 560:81–85. 2004. View Article : Google Scholar
|
|
6
|
Hegde V, Wang M and Deutsch WA: Human
ribosomal protein S3 interacts with DNA base excision repair
proteins hAPE/Ref-1 and hOGG1. Biochemistry. 43:14211–14217. 2004.
View Article : Google Scholar : PubMed/NCBI
|
|
7
|
Anderson SJ, Lauritsen JP, Hartman MG,
Foushee AM, Lefebvre JM, Shinton SA, Gerhardt B, Hardy RR, Oravecz
T and Wiest DL: Ablation of ribosomal protein L22 selectively
impairs αβ T cell development by activation of a p53-dependent
checkpoint. Immunity. 26:759–772. 2007. View Article : Google Scholar : PubMed/NCBI
|
|
8
|
Zhan Y, Melian NY, Pantoja M, Haines N,
Ruohola-Baker H, Bourque CW, Rao Y and Carbonetto S: Dystroglycan
and mitochondrial ribosomal protein L34 regulate differentiation in
the Drosophila eye. PLoS One. 5:e104882010. View Article : Google Scholar : PubMed/NCBI
|
|
9
|
Wang W, Nag S, Zhang X, Wang MH, Wang H,
Zhou J and Zhang R: Ribosomal proteins and human diseases:
Pathogenesis, molecular mechanisms, and therapeutic implications.
Med Res Rev. 35:225–285. 2015. View Article : Google Scholar : PubMed/NCBI
|
|
10
|
Xu M, Wang Y, Chen L, Pan B, Chen F, Fang
Y, Yu Z and Chen G: Down-regulation of ribosomal protein S15A mRNA
with a short hairpin RNA inhibits human hepatic cancer cell growth
in vitro. Gene. 536:84–89. 2014. View Article : Google Scholar : PubMed/NCBI
|
|
11
|
Yao Y, Liu Y, Lv X, Dong B, Wang F, Li J,
Zhang Q, Xu R and Xu Y: Down-regulation of ribosomal protein S15A
inhibits proliferation of human glioblastoma cells in vivo and in
vitro via AKT pathway. Tumour Biol. 37:4979–4990. 2016. View Article : Google Scholar : PubMed/NCBI
|
|
12
|
Zhang C, Fu J, Xue F, Ryu B, Zhang T,
Zhang S, Sun J, Xu X, Shen Z, Zheng L and Chen X: Knockdown of
ribosomal protein S15A induces human glioblastoma cell apoptosis.
World J Surg Oncol. 14:1292016. View Article : Google Scholar : PubMed/NCBI
|
|
13
|
Zhao X, Shen L, Feng Y, Yu H, Wu X, Chang
J, Shen X, Qiao J and Wang J: Decreased expression of RPS15A
suppresses proliferation of lung cancer cells. Tumour Biol.
36:6733–6740. 2015. View Article : Google Scholar : PubMed/NCBI
|
|
14
|
Chen J, Wei Y, Feng Q, Ren L, He G, Chang
W, Zhu D, Yi T, Lin Q, Tang W, et al: Ribosomal protein S15A
promotes malignant transformation and predicts poor outcome in
colorectal cancer through misregulation of p53 signaling pathway.
Int J Oncol. 48:1628–1638. 2016. View Article : Google Scholar : PubMed/NCBI
|
|
15
|
Levine AJ and Oren M: The first 30 years
of p53: Growing ever more complex. Nat Rev Cancer. 9:749–758. 2009.
View Article : Google Scholar : PubMed/NCBI
|
|
16
|
Zhang Y, Zhang G, Li X, Li B and Zhang X:
The effect of ribosomal protein S15a in lung adenocarcinoma. Peer
J. 4:e17922016. View Article : Google Scholar : PubMed/NCBI
|
|
17
|
Capitanio U and Montorsi F: Renal cancer.
Lancet. 387:894–906. 2016. View Article : Google Scholar : PubMed/NCBI
|
|
18
|
Abu Aboud O, Wettersten HI and Weiss RH:
Inhibition of PPARα induces cell cycle arrest and apoptosis, and
synergizes with glycolysis inhibition in kidney cancer cells. PLoS
One. 8:e711152013. View Article : Google Scholar : PubMed/NCBI
|
|
19
|
Li JH, Liu S, Zhou H, Qu LH and Yang JH:
starBase v2.0: Decoding miRNA-ceRNA, miRNA-ncRNA and protein-RNA
interaction networks from large-scale CLIP-Seq data. Nucleic Acids
Res. 42:(Database Issue). D92–D97. 2014. View Article : Google Scholar : PubMed/NCBI
|
|
20
|
Rhodes DR, Yu J, Shanker K, Deshpande N,
Varambally R, Ghosh D, Barrette T, Pandey A and Chinnaiyan AM:
ONCOMINE: A cancer microarray database and integrated data-mining
platform. Neoplasia. 6:1–6. 2004. View Article : Google Scholar : PubMed/NCBI
|
|
21
|
Livak KJ and Schmittgen TD: Analysis of
relative gene expression data using real-time quantitative PCR and
the 2(-Delta Delta C(T)) method. Methods. 25:402–408. 2001.
View Article : Google Scholar : PubMed/NCBI
|
|
22
|
Xu X, Xiong X and Sun Y: The role of
ribosomal proteins in the regulation of cell proliferation,
tumorigenesis, and genomic integrity. Sci China Life Sci.
59:656–672. 2016. View Article : Google Scholar : PubMed/NCBI
|
|
23
|
Brandsma AM, Jacobino SR, Meyer S, ten
Broeke T and Leusen JH: Fc receptor inside-out signaling and
possible impact on antibody therapy. Immunol Rev. 268:74–87. 2015.
View Article : Google Scholar : PubMed/NCBI
|
|
24
|
Yang Z, Xie H, He D and Li L: Infiltrating
macrophages increase RCC epithelial mesenchymal transition (EMT)
and stem cell-like populations via AKT and mTOR signaling.
Oncotarget. 7:44478–44491. 2016.PubMed/NCBI
|
|
25
|
Guo H, Li Y, Tian T, Han L, Ruan Z, Liang
X, Wang W and Nan K: The role of cytoplasmic p57 in invasion of
hepatocellular carcinoma. BMC Gastroenterol. 15:1042015. View Article : Google Scholar : PubMed/NCBI
|
|
26
|
Shimizu T, Kamel WA, Yamaguchi-Iwai S,
Fukuchi Y, Muto A and Saya H: Calcitriol exerts an anti-tumor
effect in osteosarcoma by inducing the endoplasmic reticulum stress
response. Cancer Sci. 108:1793–1802. 2017. View Article : Google Scholar : PubMed/NCBI
|
|
27
|
Casey SC, Tong L, Li Y, Do R, Walz S,
Fitzgerald KN, Gouw AM, Baylot V, Gütgemann I, Eilers M and Felsher
DW: MYC regulates the antitumor immune response through CD47 and
PD-L1. Science. 352:227–231. 2016. View Article : Google Scholar : PubMed/NCBI
|
|
28
|
Matsumoto M, Seike M, Noro R, Soeno C,
Sugano T, Takeuchi S, Miyanaga A, Kitamura K, Kubota K and Gemma A:
Control of the MYC-eIF4E axis plus mTOR inhibitor treatment in
small cell lung cancer. BMC Cancer. 15:2412015. View Article : Google Scholar : PubMed/NCBI
|
|
29
|
Pelengaris S, Khan M and Evan G: c-MYC:
More than just a matter of life and death. Nat Rev Cancer.
2:764–776. 2002. View
Article : Google Scholar : PubMed/NCBI
|
|
30
|
Vogelstein B and Kinzler KW: Cancer genes
and the pathways they control. Nat Med. 10:789–799. 2004.
View Article : Google Scholar : PubMed/NCBI
|
|
31
|
Nishikawa M, Miyake H, Harada K and
Fujisawa M: Expression level of phosphorylated-4E-binding protein 1
in radical nephrectomy specimens as a prognostic predictor in
patients with metastatic renal cell carcinoma treated with
mammalian target of rapamycin inhibitors. Med Oncol. 31:7922014.
View Article : Google Scholar : PubMed/NCBI
|
|
32
|
Nishikawa M, Miyake H, Harada K and
Fujisawa M: Expression of molecular markers associated with the
mammalian target of rapamycin pathway in nonmetastatic renal cell
carcinoma: Effect on prognostic outcomes following radical
nephrectomy. Urol Oncol. 32:49.e15–e21. 2014. View Article : Google Scholar
|
|
33
|
Qu Y, Zhao R, Wang H, Chang K, Yang X,
Zhou X, Dai B, Zhu Y, Shi G, Zhang H and Ye D: Phosphorylated 4EBP1
is associated with tumor progression and poor prognosis in Xp11.2
translocation renal cell carcinoma. Sci Rep. 6:235942016.
View Article : Google Scholar : PubMed/NCBI
|
|
34
|
Xu J, Chen J, Dong Z, Meyuhas O and Chen
JK: Phosphorylation of ribosomal protein S6 mediates compensatory
renal hypertrophy. Kidney Int. 87:543–556. 2015. View Article : Google Scholar : PubMed/NCBI
|
|
35
|
Dowling RJ, Topisirovic I, Alain T,
Bidinosti M, Fonseca BD, Petroulakis E, Wang X, Larsson O, Selvaraj
A, Liu Y, et al: mTORC1-mediated cell proliferation, but not cell
growth, controlled by the 4E-BPs. Science. 328:1172–1176. 2010.
View Article : Google Scholar : PubMed/NCBI
|
|
36
|
Jones J, Otu H, Spentzos D, Kolia S, Inan
M, Beecken WD, Fellbaum C, Gu X, Joseph M, Pantuck AJ, et al: Gene
signatures of progression and metastasis in renal cell cancer. Clin
Cancer Res. 11:5730–5739. 2005. View Article : Google Scholar : PubMed/NCBI
|
|
37
|
Higgins JP, Shinghal R, Gill H, Reese JH,
Terris M, Cohen RJ, Fero M, Pollack JR, van de Rijn M and Brooks
JD: Gene expression patterns in renal cell carcinoma assessed by
complementary DNA microarray. Am J Pathol. 162:925–932. 2003.
View Article : Google Scholar : PubMed/NCBI
|
|
38
|
Yusenko MV, Kuiper RP, Boethe T, Ljungberg
B, van Kessel AG and Kovacs G: High-resolution DNA copy number and
gene expression analyses distinguish chromophobe renal cell
carcinomas and renal oncocytomas. BMC Cancer. 9:1522009. View Article : Google Scholar : PubMed/NCBI
|