Introduction
Renal cell carcinoma (RCC) is one of the 10 most
frequent types of cancer in women and men, accounting for ≤3% of
all adult cancers. Types of RCC include clear cell (70%), papillary
(10–15%), and chromophobe (5%) (1,2).
Clear cell RCC (ccRCC) is the main pathological type of primary
renal tumor, which is associated with increased incidence, and high
morbidity and mortality (3).
Through the use of abdominal imaging, patients with ccRCC are being
more frequently identified (4);
however, this type of cancer is insensitive to radiotherapy and
chemotherapy, and the 5-year survival rate of advanced stage
patients following diagnosis is <10% (5). Several multi-center international
studies have demonstrated that local or distant recurrence occurs
in 20–40% of patients with localized tumors following nephrectomy
(6). Therefore, uncovering the
underlying molecular mechanisms, and identifying effective
diagnostic and prognostic molecular markers may help explore novel
drug targets to control the proliferation, metastasis and drug
resistance of ccRCC.
With the development of improved computer
technology, high-throughput platforms have been widely applied for
gene expression analysis. Microarray analysis and next-generation
sequencing are increasingly utilized as essential tools in the
field of medical oncology, with numerous clinical applications,
including molecular classification of cancer, molecular diagnosis,
prognosis prediction, patient stratification, tumor response
prediction and novel drug target discovery (7,8).
Furthermore, various tumor-associated databases have been
established, including the Gene Expression Omnibus (GEO) and The
Cancer Genome Atlas (TCGA). The GEO is an international public
repository that contains a number of high-throughput microarray and
next-generation sequencing datasets (9). TCGA is a public database that
includes 33 cancer types with matched clinical data, mRNA data and
microRNA data (10,11). The methods associated with
bioinformatics analysis are constantly changing. The present study
used GEO and TCGA databases to analyze mRNA alterations, and search
for efficient diagnostic and prognostic biomarkers in ccRCC.
In the present study, four ccRCC datasets (GSE46699,
GSE36895, GSE53000 and GSE53757) were downloaded from the GEO.
Subsequently, the differentially expressed genes (DEGs) were
screened by comparing adjacent normal kidney samples with ccRCC
samples. The Robust Rank Aggregation (RRA) method was used to
identify the statistically significant genes based on their ranks
in each profile. Tumor-associated genetic alterations are known to
result in tumorigenesis and the progression of ccRCC (12). Therefore, the present study used
the tumor-associated gene (TAG) database to identify the DEGs
associated with cancer. Through this analysis, Erb-B2 receptor
tyrosine kinase 4 (ERBB4), centrosomal protein 55 (CEP55) and
vascular endothelial growth factor A (VEGFA) were identified as
oncogenes. Furthermore, all three oncogenes were associated with
the stage of ccRCC, whereas only CEP55 was associated with tumor
prognosis according to Gene Expression Profiling Interactive
Analysis (GEPIA). The oncogenic role of CEP55 in ccRCC remains
unclear. TCGA data were used to analyze the expression levels, and
potential diagnostic and prognostic values of CEP55 in ccRCC. Gene
set enrichment analysis (GSEA) was also used to explore the
underlying molecular mechanisms of CEP55 in ccRCC. The present
study revealed that CEP55 may serve as a novel potential diagnostic
and prognostic marker, and a potential therapeutic target for
ccRCC.
Materials and methods
Microarray and TCGA ccRCC data
The key phrase ‘renal cell carcinoma’ was used to
search GEO datasets (www.ncbi.nlm.nih.gov/geo), and the GSE46699, GSE36895,
GSE53000 and GSE53757 microarray datasets were downloaded. The
GSE46699 data were obtained using the GPL570 platform and included
63 adjacent normal kidney specimens and 67 ccRCC samples. The
platform used to obtain the GSE36895 data was also GPL570, and this
dataset consisted of 23 adjacent normal kidney samples and 29 ccRCC
samples. The GSE53000 data were obtained using the GPL6244 platform
and included six adjacent normal kidney samples and 28 ccRCC
samples. The platform used to obtain the GSE53757 data was GPL570,
and this dataset consisted of 72 adjacent normal kidney samples and
72 ccRCC samples. The data were calibrated, standardized and
log2 transformed. TCGA contains DNA, RNA and protein
data for human cancers, and can be used to analyze expression of
these components in various types of cancer (10). In the present study, the
RNA-sequencing (RNA-seq) data of patients diagnosed with ccRCC were
downloaded from TCGA on May 9th, 2018. The RNA-seq data based on
the Illumina HiSeq RNA-seq platform included 74 adjacent normal
kidney tissues and 536 ccRCC tissues. Additionally, there were 416
ccRCC patients with full clinical information including age, sex,
histological type, Tumor-Node-Metastasis stage (13) and overall survival (OS) time. The
dataset information is presented in Table I (14–17).
R software (version 3.5.0, http://www.r-project.org/) was used for further
analysis.
 | Table I.Summary of GEO and TCGA clear cell
renal cell carcinoma datasets. |
Table I.
Summary of GEO and TCGA clear cell
renal cell carcinoma datasets.
| Author, year | Sample | GEO no. | Platform | Normal | Tumor | (Refs.) |
|---|
| Eckel-Passow et
al, 2014 | ccRCC | GSE46699 | GPL570 | 63 | 67 | (14) |
| Peña-Llopis et
al, 2012 | ccRCC | GSE36895 | GPL570 | 23 | 29 | (15) |
| Gerlinger et
al, 2014 | ccRCC | GSE53000 | GPL6244 | 6 | 28 | (16) |
| von Roemeling et
al, 2014 | ccRCC | GSE53757 | GPL570 | 72 | 72 | (17) |
| TCGA | ccRCC | – | – | 74 | 536 | – |
Integration of microarray data
Limma package analysis (18) was used to identify DEGs from the
four microarray datasets. The RRA package (19) from R language was used to analyze
the list of up- and downregulated genes from the four profiles. The
RRA method is used to compare the expression of different genes
based on their ranks (20). The
higher the rank of a gene is in the selected datasets, the smaller
its P-value is (21).
Functional annotation of DEGs
The present study downloaded all of the
tumor-associated genes from the TAG database to assess whether the
screened DEGs were associated with cancer (22). Subsequently, GEPIA (http://gepia.cancer-pku.cn/) was applied to validate
the different expression and prognostic values of the selected
genes in ccRCC.
Reverse transcription-polymerase chain
reaction (RT-PCR)
A total of 15 paired fresh ccRCC tissues and
adjacent tissues were obtained from patients (nine men and six
women; age, 58±11 years). All patients underwent partial or radical
nephrectomy at the Department of Urology, Ningbo Medical Centre
Lihuili Hospital (Ningbo, China) between May and June 2018. Written
informed consent was obtained from the patients and the present
study was approved by the Ethics Committee of Ningbo Medical Centre
Lihuili Hospital. RNA extraction, reverse transcription and
amplification were conducted according to our previous study
(5). The primers used were as
follows: CEP55, forward 5′-GCCATTGGGCGAGACCTACCT-3′, reverse
5′-GTTCGGGACTTCGCTCACCTT-3′; and GAPDH, forward
5′-ACAACTTTGGTATCGTGGAAGG-3′ and reverse 5′-GCCATCACGCCACAGTTTC-3′.
GAPDH was used as the control. Data were presented as the means ±
standard deviation from three experiments and were analyzed using
the 2−ΔΔCq method (23).
Diagnosis analysis
All 610 adjacent normal kidney and ccRCC tissue
samples from TCGA dataset were randomly and equally divided into
the training set (total n=305; number of adjacent normal kidney
samples=37; and number of ccRCC samples=268) and the validation set
(total n=305; number of adjacent normal kidney samples=37; and
number of ccRCC samples=268). The training set was used to identify
the potential diagnostic value of CEP55 expression, and the
validation set was used to verify it. Area under the curve (AUC)
values obtained from the receiver operating characteristic (ROC)
curve analysis were utilized to assess the diagnostic effectiveness
of CEP55. Generally, an AUC value of >0.85 is considered to
indicate diagnostic value (24).
The cut-off value is the detection value corresponding to the
maximum value of the sum of sensitivity and specificity.
GSEA
The c2.cp.kegg.gmt annotated gene set from the Java
GSEA application was used to conduct the Kyoto Encyclopedia of
Genes and Genomes (KEGG) enrichment analysis (25,26).
Normal P<0.05 and false discovery rate q-value <0.25 were
chosen to indicate statistical significance.
Statistical analysis
Student's t-test was used to analyze the
significance between two groups. The associations between CEP55 and
clinical factors were analyzed by χ2 test. Spearman's
rank correlation coefficient was performed to access bivariate
correlations. In addition, Kaplan-Meier analysis was used to assess
OS and significance was determined using the log-rank test.
Furthermore, the prognostic value of CEP55 in patients with ccRCC
was evaluated by univariate and multivariate Cox regression
analyses (27). All tests were
two-sided and P<0.05 was considered to indicate a statistically
significant difference. All statistical analyses were carried out
using SPSS 23.0 (IBM, Corp., Armonk, NY, USA) and GraphPad Prism
7.0 (GraphPad Software, Inc., La Jolla, CA, USA).
Results
Microarray data resources and DEGs in
ccRCC
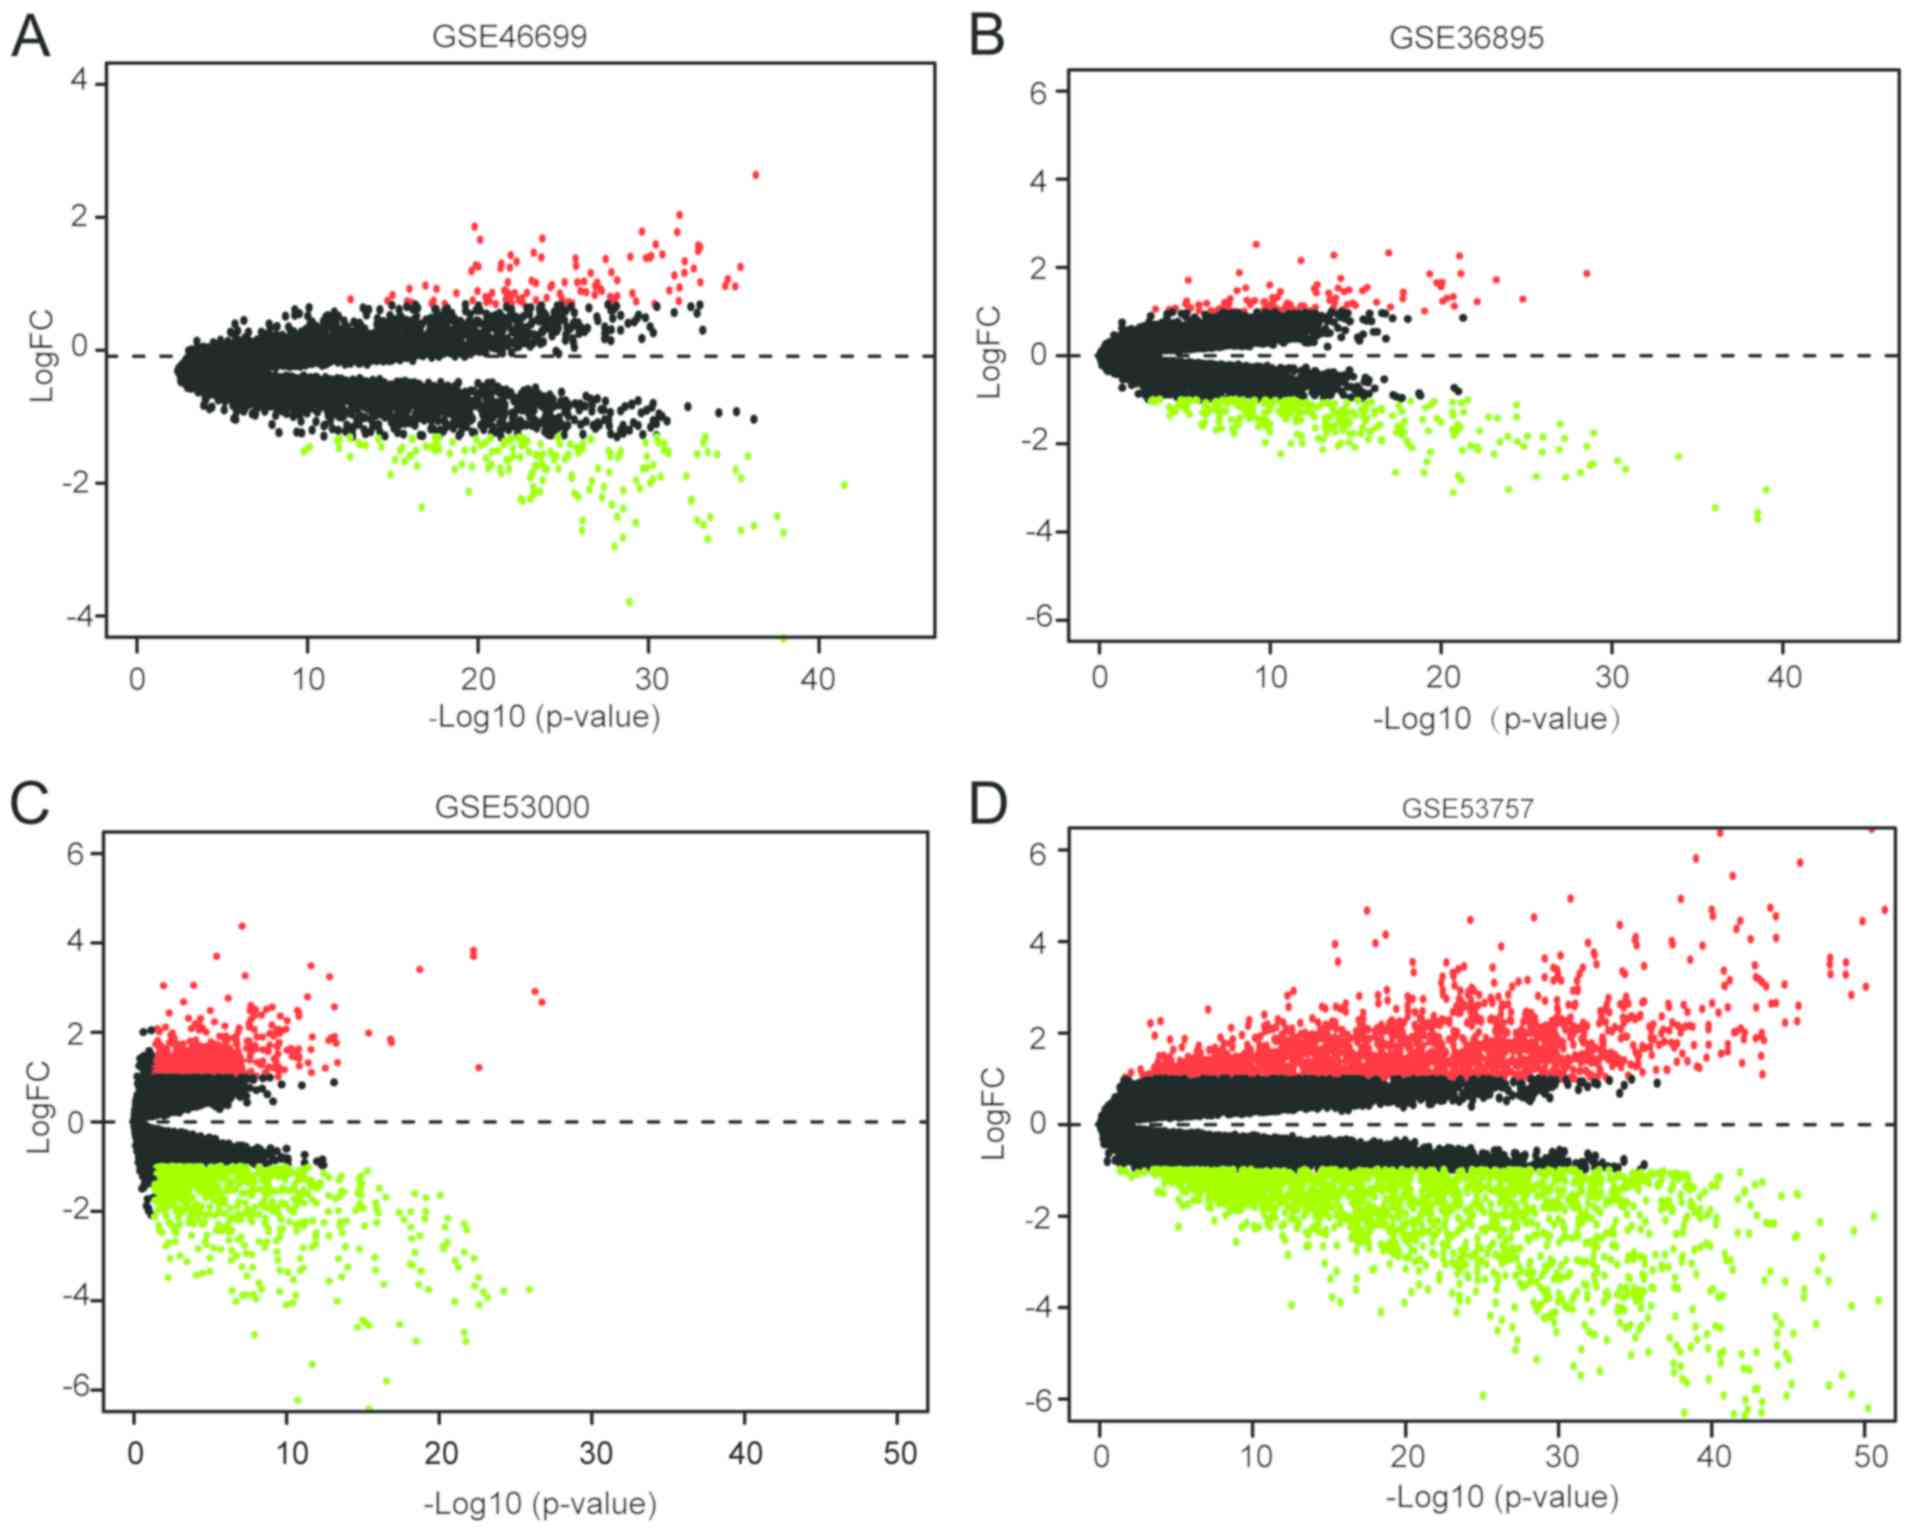
The ccRCC expression microarray datasets GSE46699,
GSE36895, GSE53000 and GSE53757 were downloaded from the GEO and
were analyzed using limma package (adjusted P<0.05,
|logFC|>1). A total of 271 DEGs were screened from the GSE46699;
of which, 104 and 167 genes were up- and downregulated,
respectively. In addition, 100 upregulated genes and 290
downregulated genes were obtained from the GSE36895 dataset.
Furthermore, 532 upregulated genes and 649 downregulated genes,
respectively, were detected from the GSE53000 dataset. Overall,
there were 1,552 upregulated genes and 1,821 downregulated genes
among the 3,373 DEGs screened from the GSE53757 dataset. All
of the DEGs from the four microarrays are presented in Fig. 1.
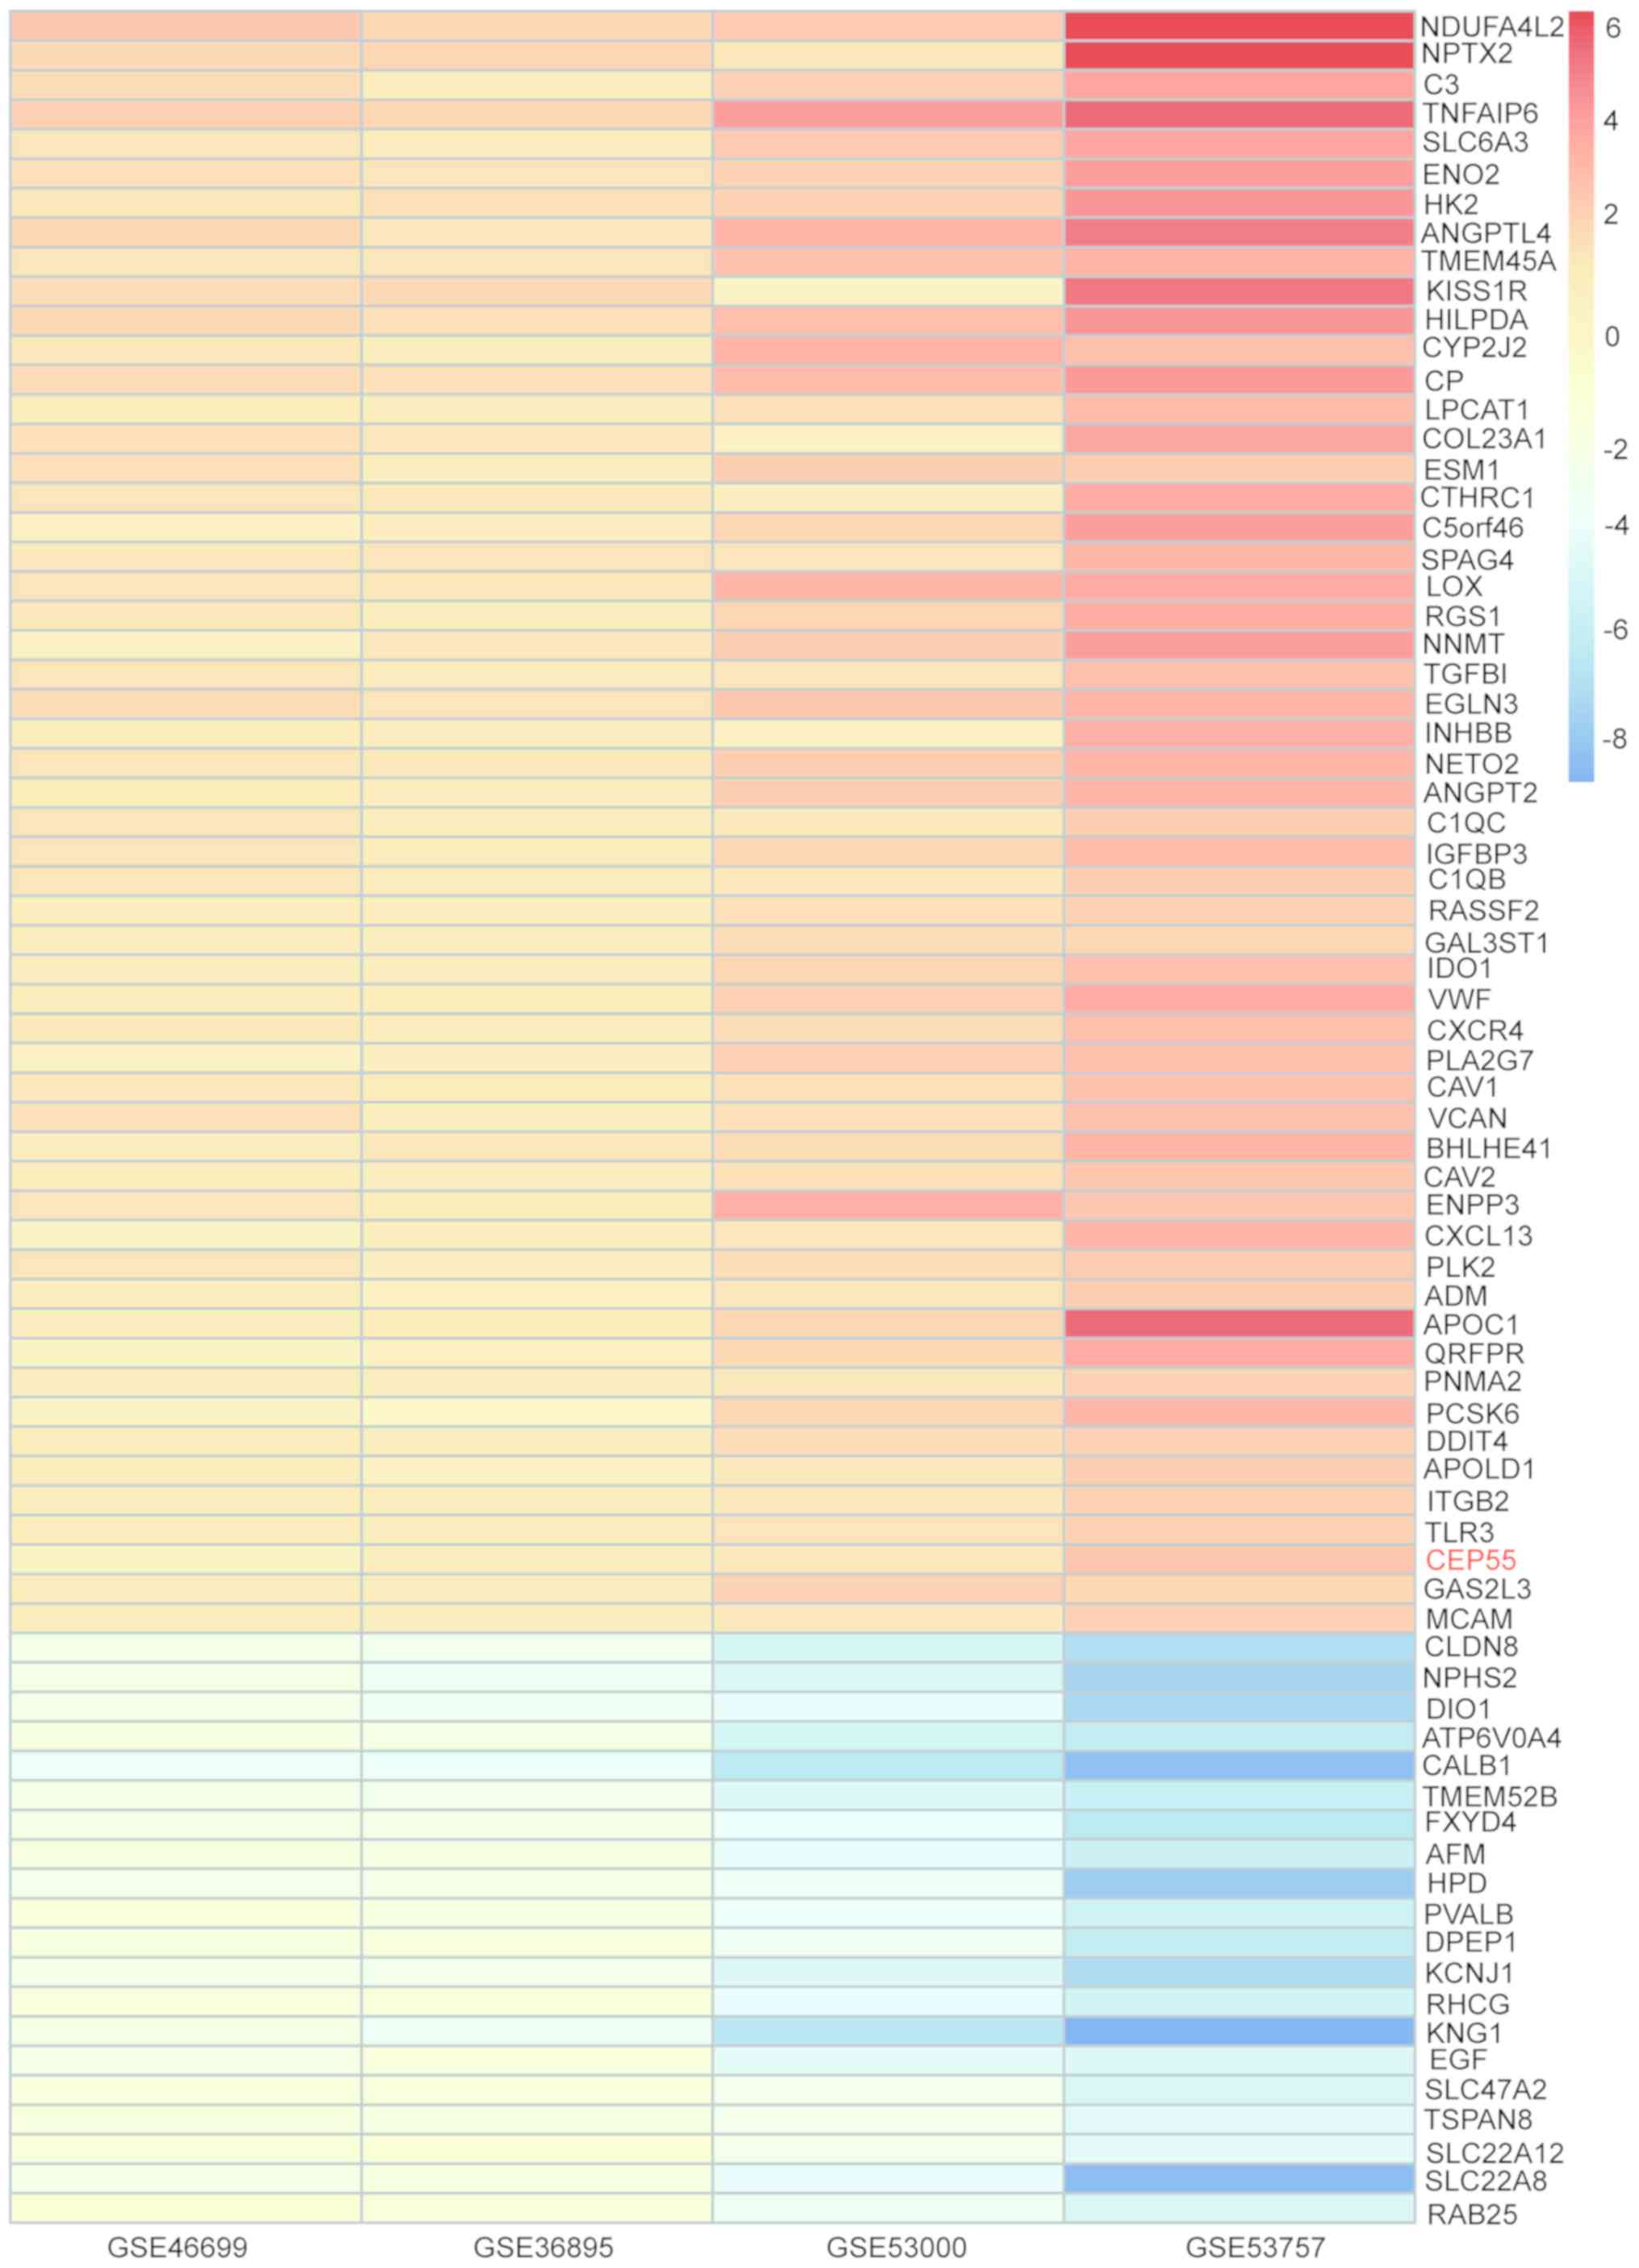
Identification of DEGs in ccRCC by
integrated bioinformatics
DEGs from each of the four ccRCC gene microarrays
were identified based on the logFC value and then analyzed using
the RRA method. A total of 223 DEGs were identified, including 78
upregulated genes and 145 downregulated genes according to the
cut-off criterion of corrected P<0.05 (Table II). The heatmap presents the top
55 upregulated and 20 downregulated genes (Fig. 2).
| Table II.DEGs in clear cell renal cell
carcinoma, as determined using the Robust Rank Aggregation
method. |
Table II.
DEGs in clear cell renal cell
carcinoma, as determined using the Robust Rank Aggregation
method.
| DEGs | Gene names |
|---|
| Upregulated | DIRAS2, MCAM,
IGFBP3, FABP5, C1QA, LAMA4, TNFAIP6, NDUFA4L2, VCAN, CXCR4, CEP55,
CD163, NPTX2, IDO1, ITGB2, GAL3ST1, CTHRC1, C1QC, HK2, VEGFA,
SEMA5B, APOLD1, DNAH11, SCARB1, RASSF2, LOX, AHNAK2, COL23A1,
GAS2L3, NETO2, FABP7, CCL18, CAV1, LINC00462, CXCL13, TGFBI, PLK2,
ANGPTL4, DDIT4, INHBB, QRFPR, LAPTM5, BHLHE41, CYP2J2, SPAG4,
C5orf46, LPCAT1, PNMA2, CP, ADM, HILPDA, LINC00887, LOXL2, PLA2G7,
NNMT, CA9, C1QB, APOC1, ADAMDEC1, ENPP3, EGLN3, ENO2, TLR3, FCGR1B,
TMEM45A, PCSK6, CD70, KISS1R, CENPK, CAV2, SLC6A3, RGS1, VWF, FN1,
ANGPT2, ST8SIA4, C3, ESM1 |
| Downregulated | CYP17A1, SMIM24,
NPHS2, ERBB4, ESRP1, PSAT1, RALYL, SLC4A9, TFCP2L1, XPNPEP2,
SPINK1, SCNN1B, ALB, PLG, SLC4A1, SLC12A1, ALDOB, CNTN3, ERP27,
ALDH8A1, TSPAN8, UPP2, FCAMR, LOC284578, SLC22A8, KL, KCNJ10, EHF,
SLC13A3, CYP8B1, AZGP1, ALDH6A1, HPD, SLC7A13, SLC22A6, EFHD1,
SUCNR1, TMEM213, AFM, ACPP, LOC100505985, RAB25, HPGD, CRHBP,
FXYD4, HRG, ASS1, AQP2, DAO, SLC16A9, DNER, C16orf89, DCXR, EGF,
PVALB, RHCG, UMOD, FOXI1, CYP4A11, FAM3B, ABAT, HOGA1, ATP6V0D2,
LINC00645, TMEM52B, NRK, PTH1R, TMEM207, TMEM174, GGT6, CALB1,
DIO1, KCNJ1, MIOX, TUBB2B, SLC12A3, ATP6V1G3, CRYAA, RNF212B,
SCNN1A, HSD11B2, TMEM178A, OGDHL, TUBAL3, SOSTDC1, TYRP1, S100A2,
ENPP6, MAL, PCP4, DEFB1, FGF1, ATP6V1B1, SERPINA5, DUSP9, SFRP1,
VTCN1, TFAP2B, GLDC, GPC5, FBP1, CLDN8, CLCNKB, SLC7A8, PPP1R1A,
SLC22A12, PIPOX, CLDN16, PLPPR1, MAL2, CYP2B6, NPHS1, CYP27B1, DDC,
TMPRSS2, PRODH2, FABP1, CYP4F3, CDH16, PCK1, MTTP, SLC5A2, SLC22A7,
ESRRG, SLC26A4, SLC47A2, FAM151A, ADH1C, EPCAM, KNG1, CYP4F2, ADH6,
PCSK1N, MT1H, ATP6V0A4, SLC34A1, MUC15, HEPACAM2, RP11-999E24.3,
FGF9, DPEP1, AGPAT9, SOST, LRRC19, ACSF2 |
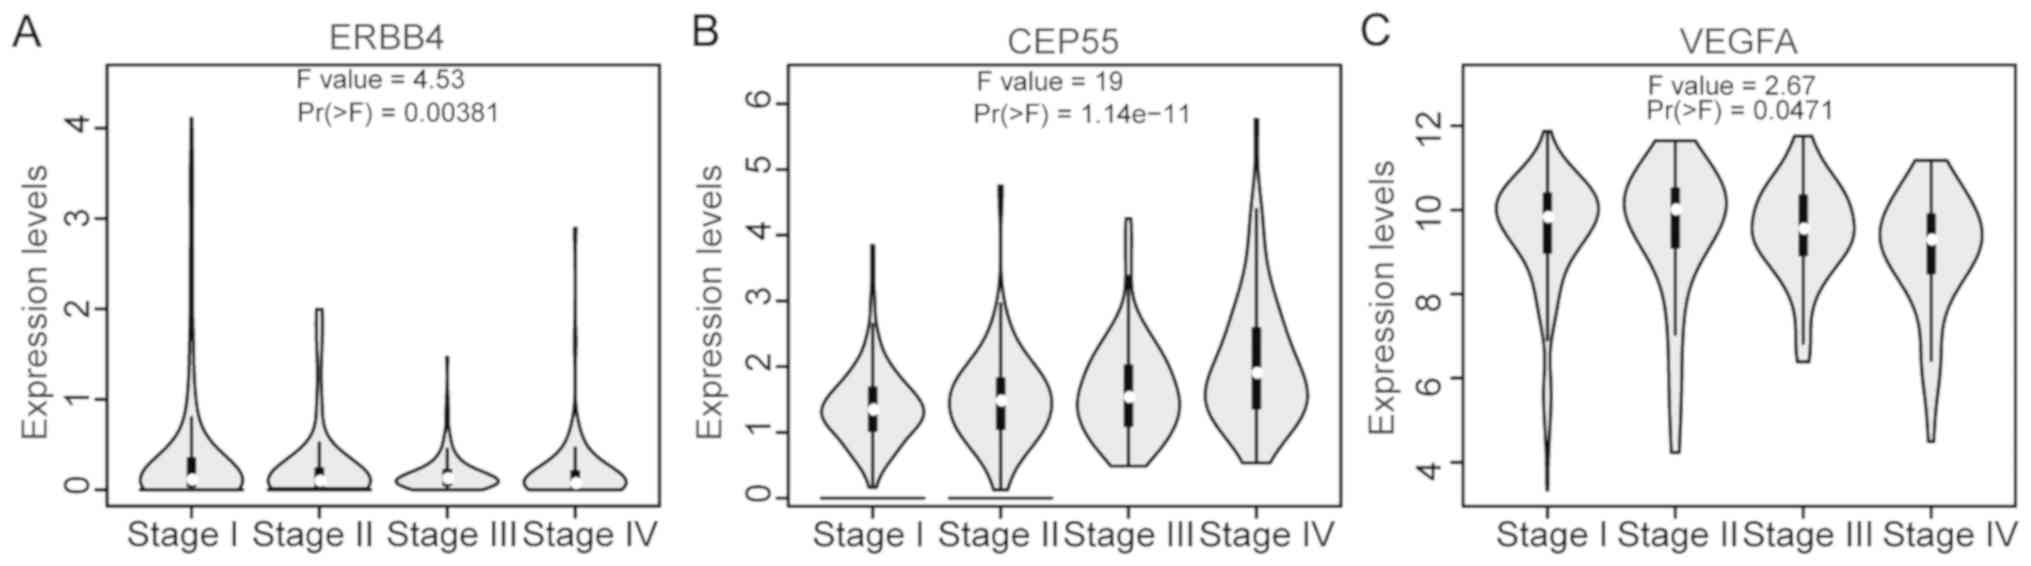
Functional annotation of DEGs
To determine whether the DEGs screened by RRA were
associated with cancer, the present study searched the TAG
database. The results revealed that 12 genes were TAGs; of which,
three were oncogenes, including ERBB4, CEP55 and VEGFA; six were
tumor suppressor genes, including ETS homologous factor (EHF),
caveolin 1 (CAV1), S100 calcium binding protein A2 (S100A2), lysyl
oxidase (LOX), caveolin 2 (CAV2) and transforming growth factor β
induced (TGFBI); and three were uncertain, including solute carrier
family 6 member 3 (SLC6A3), angiopoietin-like 4 (ANGPTL4) and
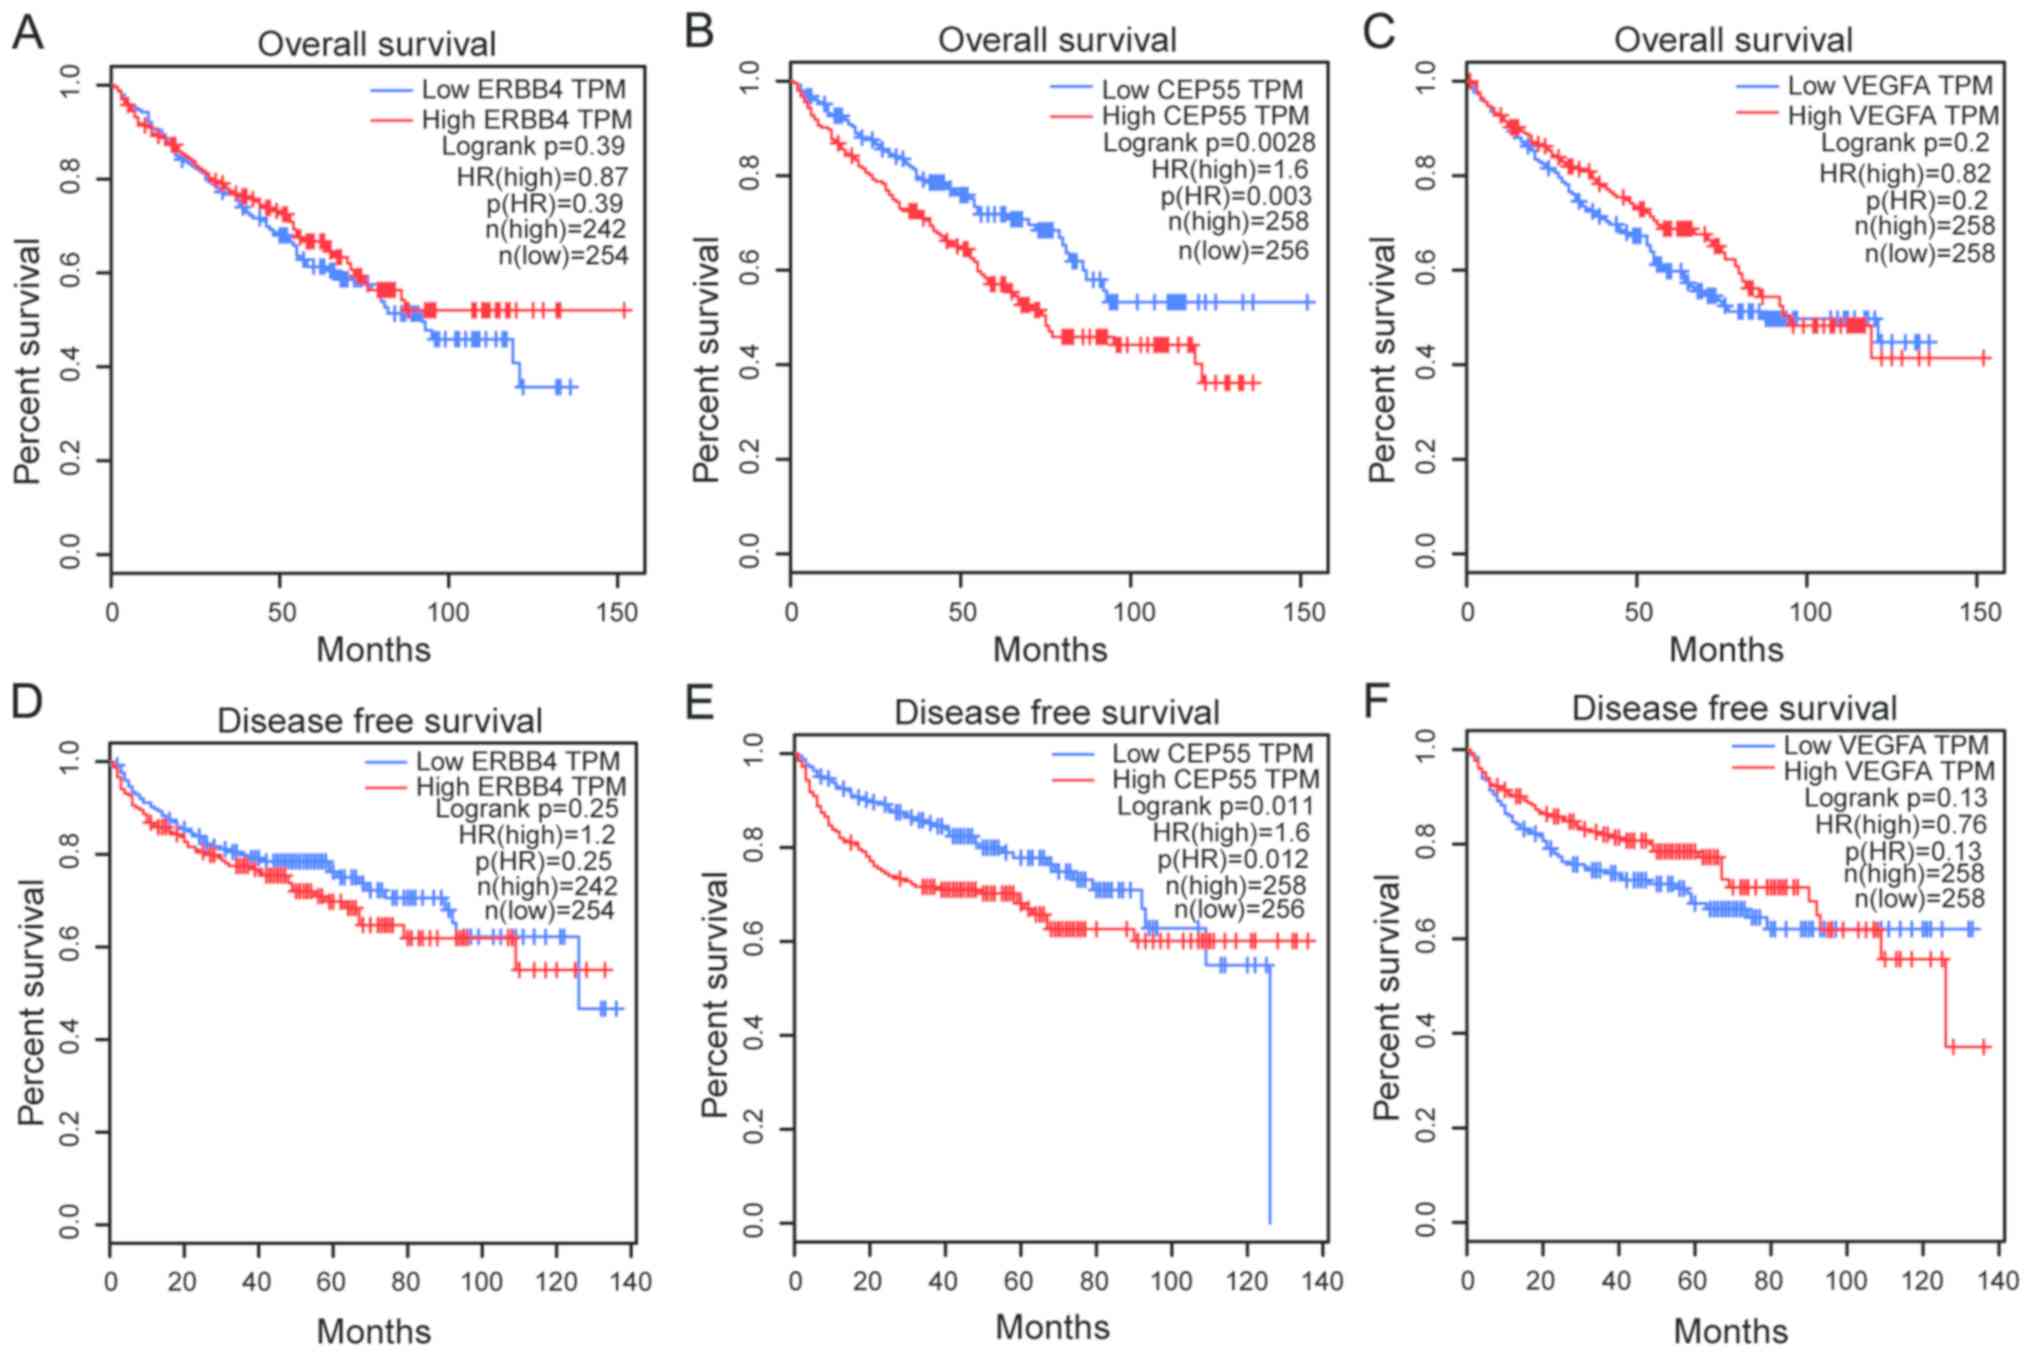
fibroblast growth factor 9 (FGF9). Furthermore, all of the three
oncogenes were associated with ccRCC stage (Fig. 3), whereas, of the three oncogenes,
only CEP55 was associated with OS and disease-free survival
according to GEPIA (Fig. 4).
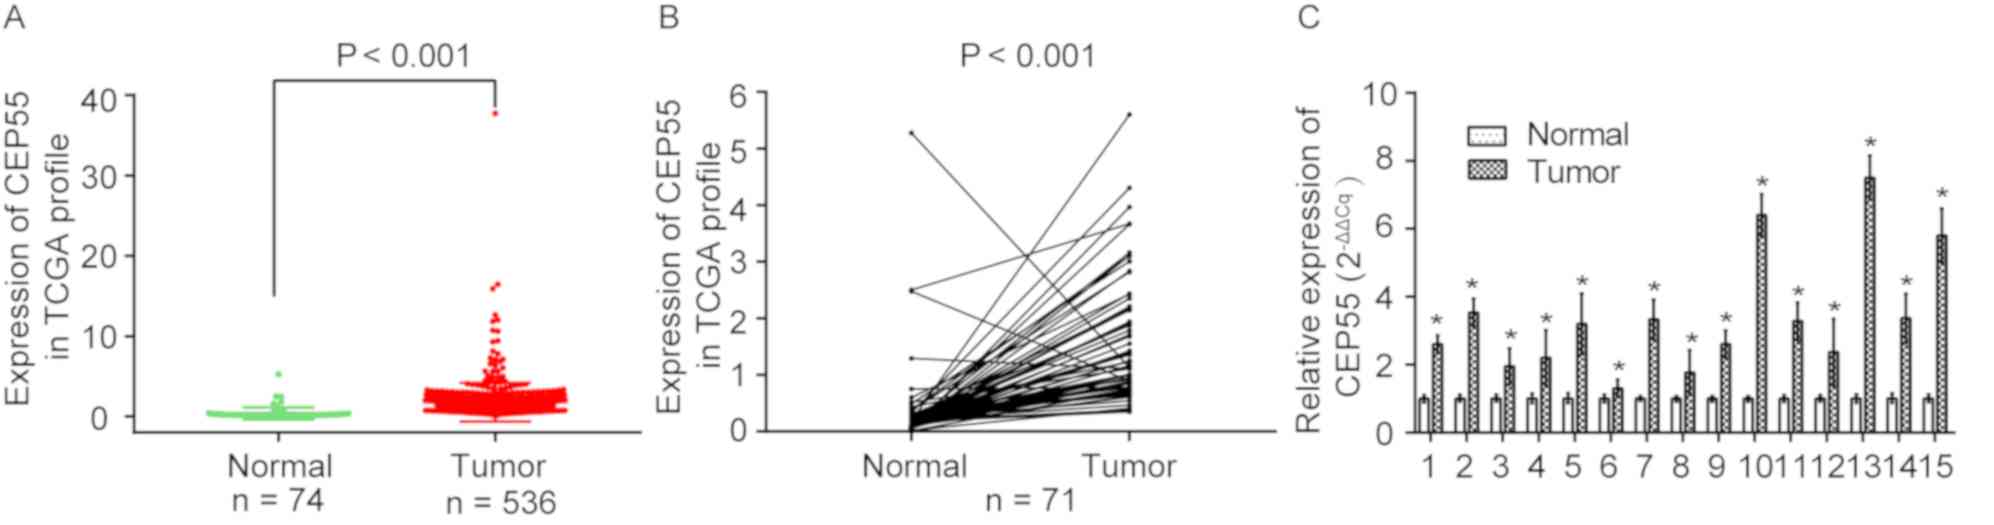
High expression of CEP55 in ccRCC
The molecular mechanisms, and the diagnostic and
prognostic value of CEP55 in ccRCC, remain unclear. Therefore, the
present study focused on the CEP55 gene for further study. As shown
in Fig. 5A, CEP55 was upregulated
in ccRCC tissues (n=536) but downregulated in adjacent normal
kidney tissues (n=74) (P<0.0001) based on the publicly available
TCGA data. The present study further validated the overexpression
of CEP55 in ccRCC tissues based on 71 paired ccRCC tissues
(P<0.001) (Fig. 5B).
Furthermore, the mRNA expression levels of CEP55 were significantly
upregulated in 15 paired clinical ccRCC tissues, as determined by
RT-PCR analysis (P<0.05; Fig.
5C). These results indicated that CEP55 was upregulated and may
serve essential roles in the occurrence of ccRCC.
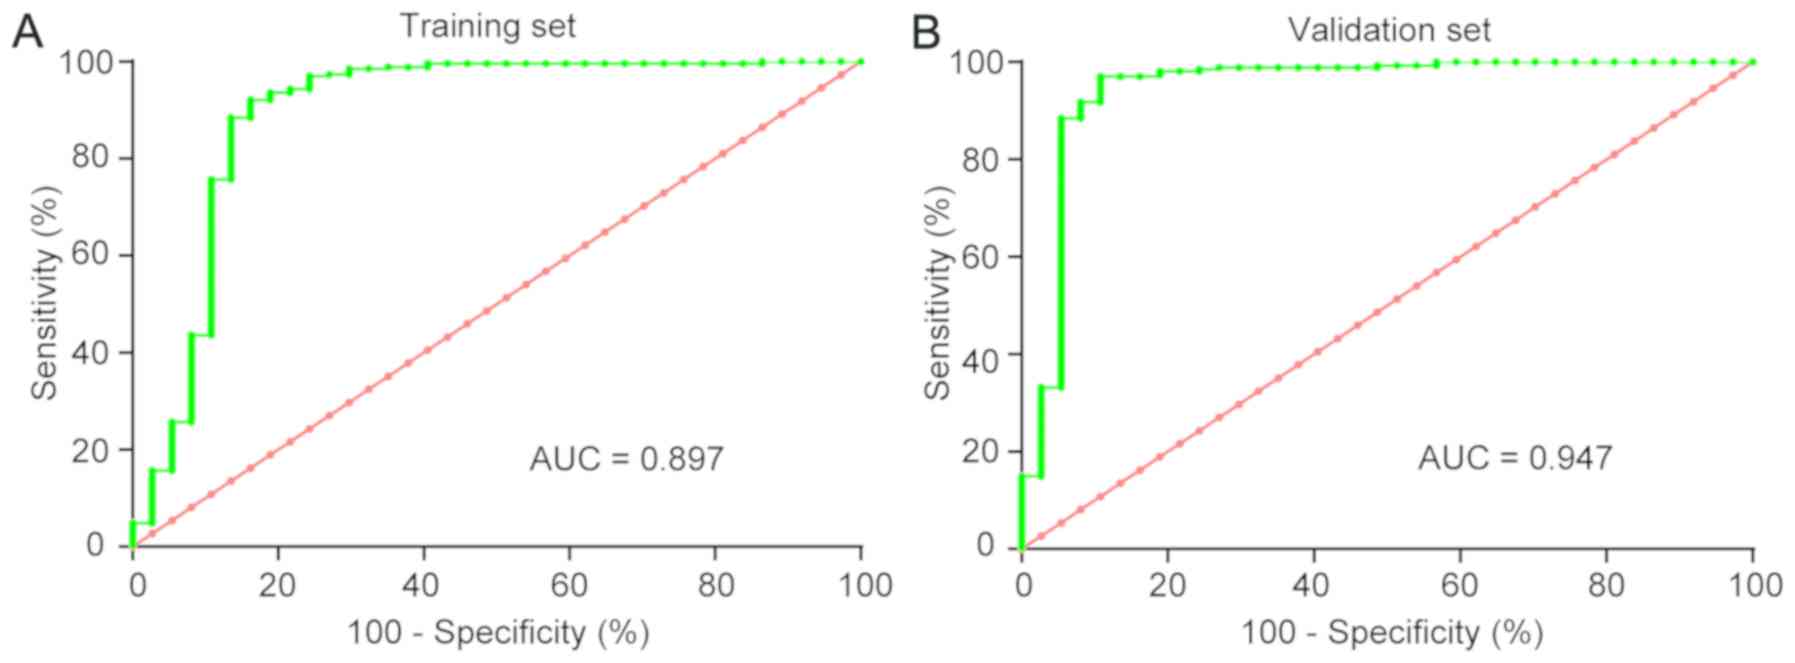
Diagnostic value of CEP55 in
ccRCC
To validate the potential diagnostic value of CEP55
mRNA, the training set was initially studied, and then the
validation set was utilized for verification. ROC curves revealed
that the AUC was 0.897 [confidence interval (CI): 0.817–0.975] in
the training set and 0.947 (CI: 0.891–1.003) in the validation set
for CEP55 (Fig. 6). Applying the
cut-off value of 0.437, the specificity and sensitivity of CEP55
for the diagnosis of ccRCC patients vs. healthy controls was 92.7%
(95% CI: 90.2–94.8%) and 86.5% (95% CI: 76.6–93.3%), respectively.
These results confirmed that CEP55 could act as a diagnostic
biomarker for ccRCC tissues.
Association between CEP55 and clinical
factors in ccRCC
To verify the association between CEP55 and clinical
factors in ccRCC, the 416 ccRCC patients with full clinical
information in TCGA dataset were further analyzed. The mRNA
expression levels of CEP55 were strongly associated with sex
(P=0.001), histological grade (P<0.001), stage (P<0.001), T
classification (P<0.001), N classification (P=0.007), M
classification (P=0.002) and vital status (P<0.001), but not
with age (P=0.922; Table III).
As determined by Spearman's analysis, CEP55 was correlated with sex
(P=0.002), histological grade (P<0.001), stage (P<0.001), T
classification (P<0.001), N classification (P<0.001), M
classification (P<0.001) and vital status (P<0.001; Table IV). These results revealed a
potential association between high CEP55 expression levels and the
aggressive clinical characteristics of ccRCC, and also with
sex.
| Table III.Association between CEP55 expression
and clinical characteristics of patients with clear cell renal cell
carcinoma in The Cancer Genome Atlas dataset. |
Table III.
Association between CEP55 expression
and clinical characteristics of patients with clear cell renal cell
carcinoma in The Cancer Genome Atlas dataset.
|
|
| CEP55 |
|
|---|
|
|
|
|
|
|---|
|
Characteristics | Number of cases
(%) | Low | High | P-value |
|---|
| Age (years) |
|
|
| 0.922 |
|
≥60 | 215 (51.7) | 107 | 108 |
|
|
<60 | 201 (48.3) | 101 | 100 |
|
| Sex |
|
|
| 0.001 |
|
Male | 264 (63.5) | 116 | 148 |
|
|
Female | 152 (36.5) | 92 | 60 |
|
| Histological
grade |
|
|
|
|
| G1 | 10 (2.4) | 9 | 1 | <0.001 |
| G2 | 201 (48.3) | 116 | 85 |
|
| G3 | 160 (38.5) | 70 | 90 |
|
| G4 | 45 (10.8) | 13 | 32 |
|
| Stage |
|
|
| <0.001 |
| I | 252 (60.6) | 151 | 101 |
|
| II | 53 (12.7) | 25 | 28 |
|
|
III | 69 (16.6) | 21 | 48 |
|
| VI | 42 (10.1) | 11 | 31 |
|
| T
classification |
|
|
| <0.001 |
| T1 | 256 (61.5) | 152 | 104 |
|
| T2 | 61 (14.7) | 28 | 33 |
|
| T3 | 92 (22.1) | 28 | 64 |
|
| T4 | 7 (1.7) | 0 | 7 |
|
| N
classification |
|
|
| 0.007 |
| N0 | 402 (96.6) | 206 | 196 |
|
|
N1-2 | 14 (3.4) | 2 | 12 |
|
| M
classification |
|
|
| 0.002 |
| M0 | 375 (90.1) | 197 | 178 |
|
| M1 | 41 (9.9) | 11 | 30 |
|
| Vital status |
|
|
|
|
|
Alive | 308 (74) | 170 | 138 | <0.001 |
|
Deceased | 108 (26) | 38 | 70 |
|
| Table IV.Correlation of CEP55 mRNA expression
with clinical characteristics, as determined by Spearman
analysis. |
Table IV.
Correlation of CEP55 mRNA expression
with clinical characteristics, as determined by Spearman
analysis.
|
| CEP55 expression
level |
|---|
|
|
|
|---|
|
Characteristics | Spearman
correlation | P-value |
|---|
| Age | −0.077 | 0.119 |
| Sex | 0.152 | 0.002 |
| Histological
grade | 0.271 | <0.001 |
| Stage | 0.326 | <0.001 |
| T
classification | 0.311 | <0.001 |
| N
classification | 0.224 | <0.001 |
| M
classification | 0.228 | <0.001 |
| Vital status | 0.217 | <0.001 |
Association between high expression of
CEP55 and poor prognosis
In order to further investigate the upregulation of
CEP55 as a prognostic factor, 416 patients with ccRCC from TCGA
were analyzed. Cox regression analysis was performed to determine
whether CEP55 could be a potential predictive and prognostic
factor. As shown in Table V, high
CEP55 expression was associated with a significantly increased risk
of mortality in patients with ccRCC (P=0.006) when compared to
those with low CEP55 expression, as determined by univariate Cox
regression analysis. Multivariate Cox regression analysis also
revealed that CEP55 expression (P=0.011) and M classification
(P<0.001) could be factors for predicting poor prognosis in
ccRCC (Table V). These results
indicated that CEP55 expression may serve as a prognostic biomarker
in ccRCC.
| Table V.Univariate and multivariate Cox
regression analyses of various prognostic factors in patients with
clear cell renal cell carcinoma. |
Table V.
Univariate and multivariate Cox
regression analyses of various prognostic factors in patients with
clear cell renal cell carcinoma.
|
| Univariate
analysis | Multivariate
analysis |
|---|
|
|
|
|
|---|
|
Characteristics | P-value | HR | 95% CI | P-value | HR | 95% CI |
|---|
| CEP55
expression | 0.006 | 1.755 | 1.179–2.612 | 0.011 | 1.683 | 1.127–2.513 |
| Age | 0.002 | 1.919 | 1.276–2.884 | – | – | – |
| Sex | 0.450 | 0.861 | 0.583–1.270 | – | – | – |
| Histological
grade | <0.001 | 2.429 | 1.847–3.195 | – | – | – |
| Stage | <0.001 | 2.000 | 1.700–2.353 | – | – | – |
| T
classification | <0.001 | 2.133 | 1.744–2.610 | – | – | – |
| N
classification | <0.001 | 4.184 | 2.104–8.320 | – | – | – |
| M
classification | <0.001 | 6.005 | 3.912–9.216 | <0.001 | 5.880 | 3.823–9.043 |
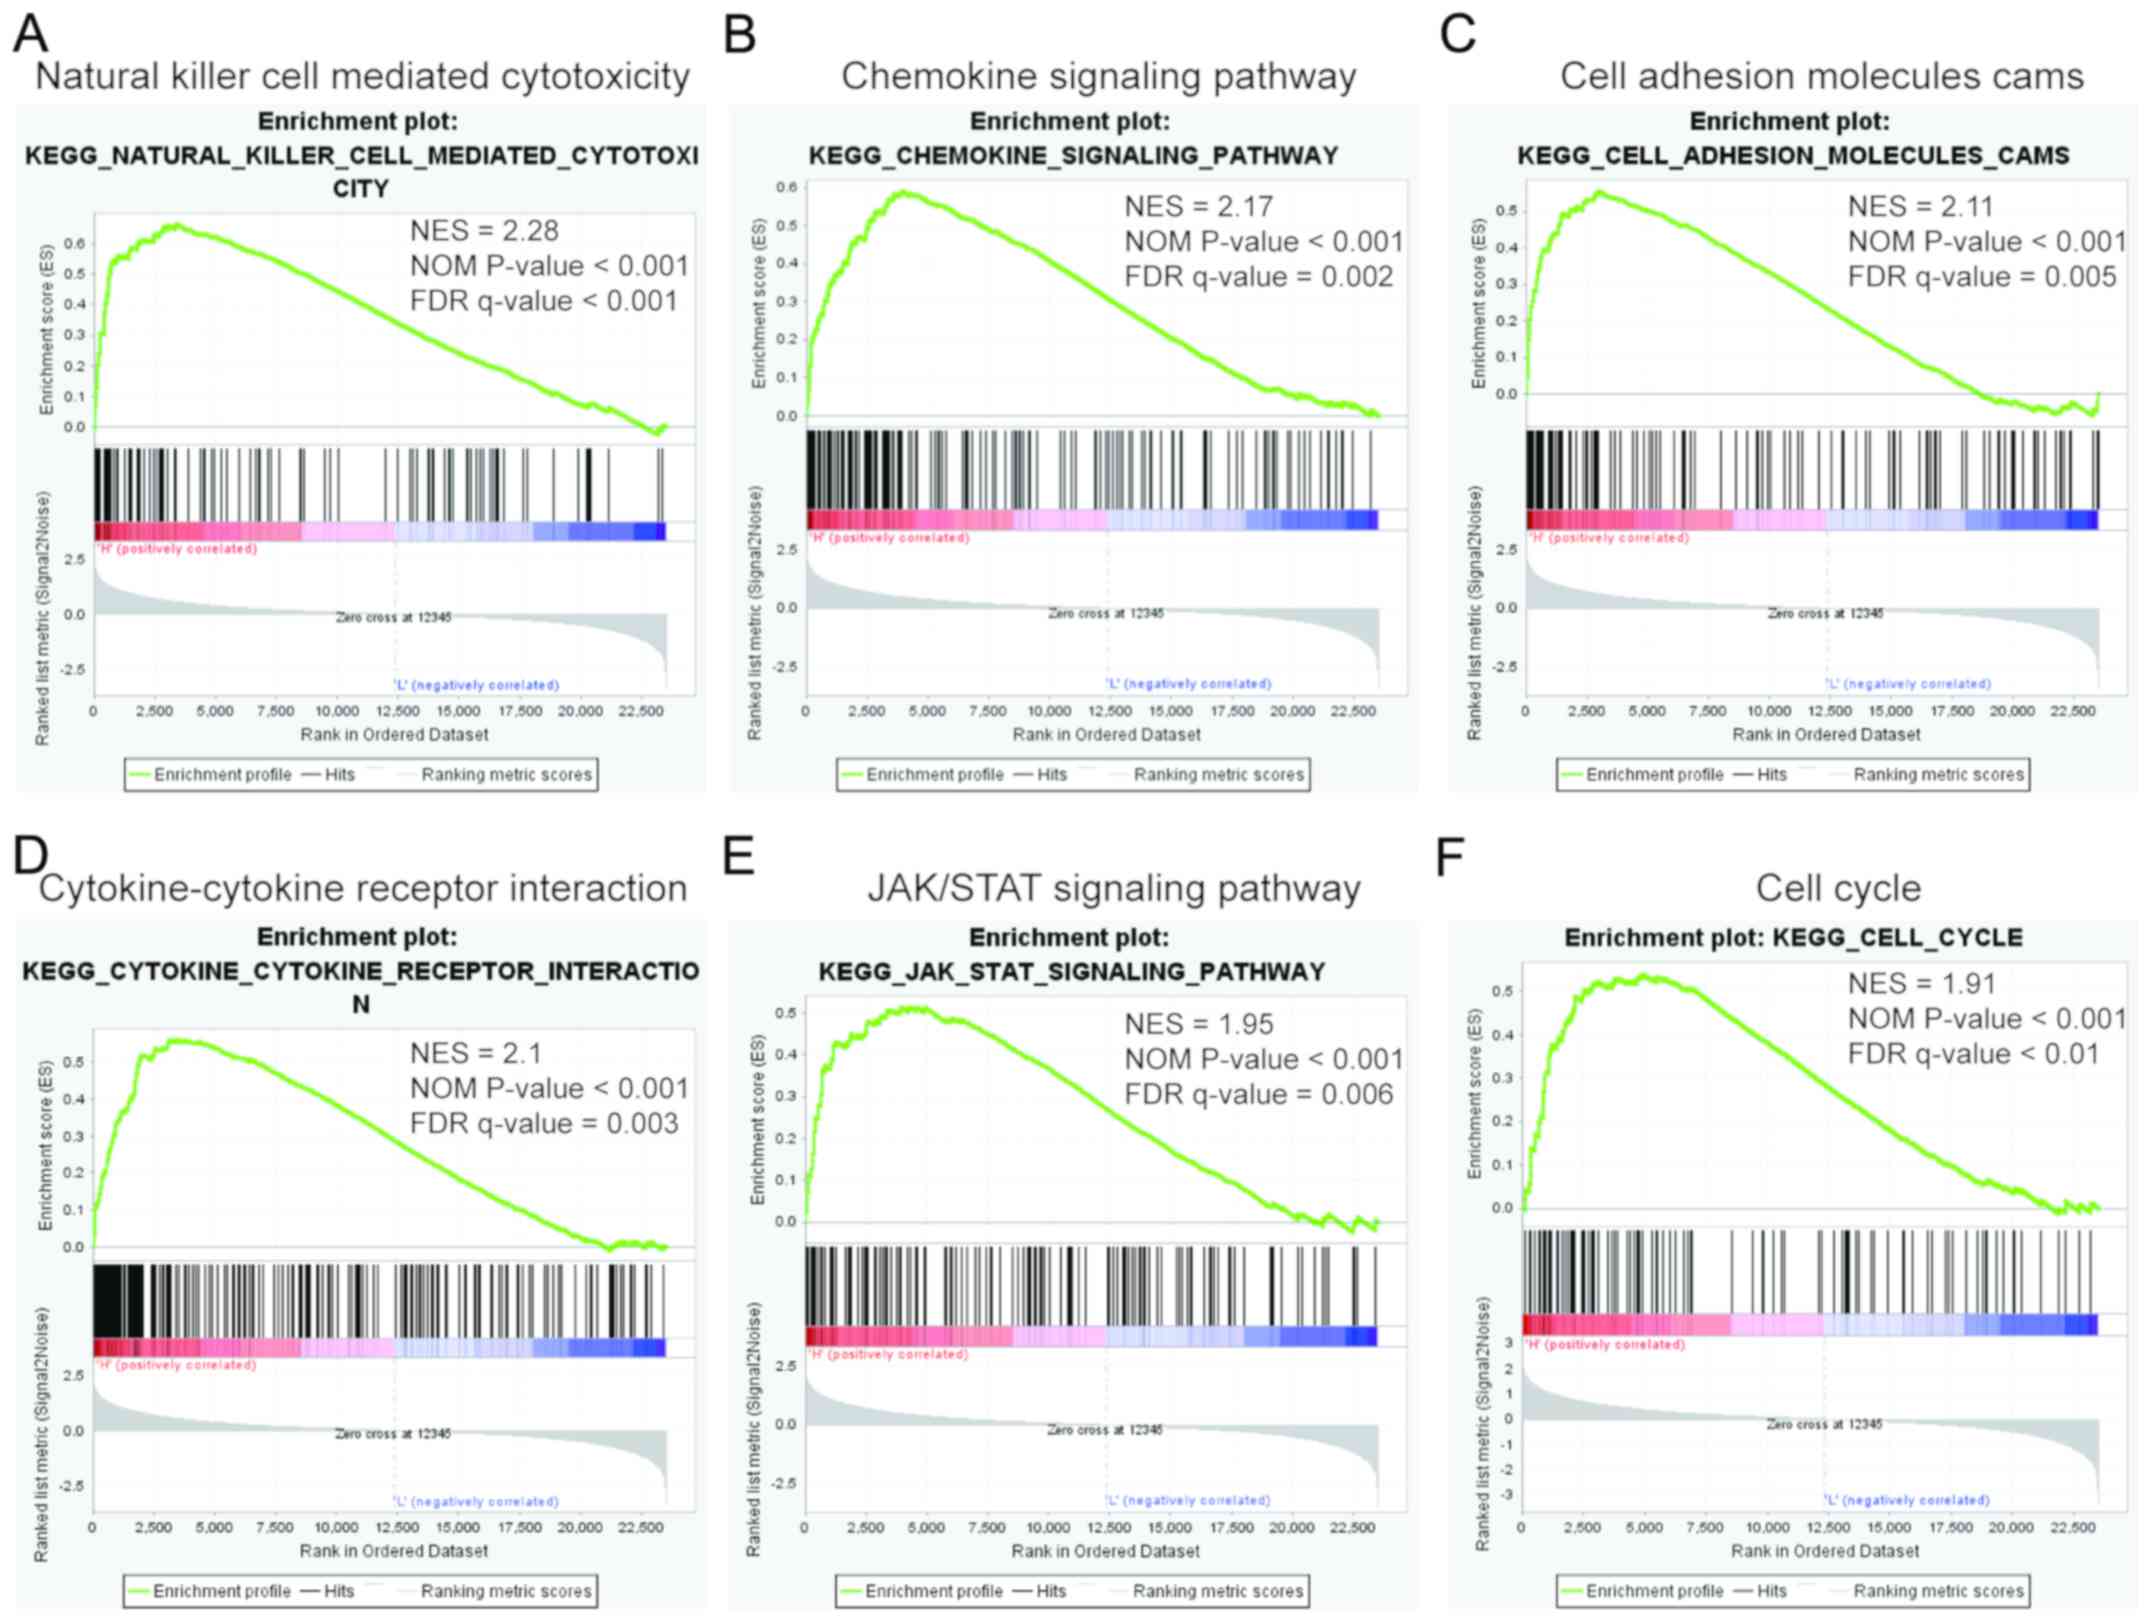
GSEA
To evaluate KEGG pathway enrichment of CEP55
expression, GSEA was conducted based on the median expression of
CEP55 in GSE53757. The top 10 relevant pathways in the CEP55
high-expression group are shown in Table VI. Taken together, the present
GSEA results suggested that CEP55 may have multifaceted functions
in immunization, cell adhesion, inflammation, the Janus
kinase/signal transducer and activator of transcription (JAK/STAT)
signaling pathway and cell proliferation in kidney carcinogenesis
and progression (Fig. 7).
| Table VI.KEGG pathways associated with high
CEP55 expression, as determined by gene set enrichment
analysis. |
Table VI.
KEGG pathways associated with high
CEP55 expression, as determined by gene set enrichment
analysis.
| KEGG pathway | Size | ES | NES | NOM P-value | FDR q-value |
|---|
| Natural killer
cell-mediated cytotoxicity | 127 | 0.66 | 2.28 | <0.001 | <0.001 |
| Chemokine signaling
pathway | 180 | 0.59 | 2.17 | <0.001 | 0.002 |
| Cell adhesion
molecules CAMs | 128 | 0.56 | 2.11 | <0.001 | 0.005 |
| Cytokine-cytokine
receptor interaction | 246 | 0.56 | 2.1 | <0.001 | 0.003 |
| Antigen processing
and presentation | 73 | 0.64 | 2.06 | <0.001 | 0.004 |
| Toll-like receptor
signaling pathway | 96 | 0.6 | 2.03 | <0.001 | 0.004 |
| T cell receptor
signaling pathway | 107 | 0.57 | 2.02 | 0.004 | 0.004 |
| B cell receptor
signaling pathway | 74 | 0.57 | 1.97 | 0.004 | 0.006 |
| JAK/STAT signaling
pathway | 149 | 0.51 | 1.95 | <0.001 | 0.006 |
| Cell cycle | 122 | 0.54 | 1.91 | <0.001 | 0.010 |
Discussion
ccRCC is the most common subtype of RCC, which is
associated with an increasing incidence, high metastatic potential
and high mortality rates (28).
Over recent decades, the 5-year survival rate of ccRCC remains
poor, despite in-depth study of the underlying mechanisms of
occurrence, progression and metastasis (29,30).
Although numerous targeted and immunosuppressive drugs have
emerged, drug resistance is still an urgent problem to be solved in
the treatment of ccRCC. Therefore, highly specific and sensitive
biomarkers, and elucidation of the underlying mechanism, are
urgently required to reduce the mortality risk for patients with
ccRCC.
Bioinformatics is a multidisciplinary field of
research, and bioinformatics analysis is specifically utilized to
identify candidate genes that aid the understanding of the genetic
basis of diseases. In the present study, four gene expression
profiles from the GEO were integrated and further analyzed via
bioinformatics analysis. A total of 223 DEGs were screened,
including 78 upregulated and 145 downregulated genes, by the RRA
method. In addition, 12 genes that were associated with cancer were
identified from DEGs according to the TAG database, including
ERBB4, CEP55, VEGFA, EHF, CAV1, S100A2, LOX, CAV2, TGFBI, SLC6A3,
ANGPTL4 and FGF9. Furthermore, only CEP55 was closely associated
with ccRCC progression and prognosis as determined by GEPIA, an
online method based on TCGA. Therefore, CEP55 has the potential to
be a novel and valuable oncotarget protein in ccRCC.
CEP55, also known as FLJ10540, C10orf3 or URCC6, is
located on chromosome 10q23.33 and serves an important role in
cytokinesis (31,32). As described previously, the protein
localizes to the centrosome during interphase, dissociates from the
centrosome in the M phase, and condenses to the midbody during
cytokinesis (33). However,
centrosome amplification may participate in the origin of
chromosomal instability during tumor development. High CEP55
expression results in disordered cytokinesis and an increased
number of unstable binucleated cells; these are oncogenic
characteristics in tumorigenesis (34,35).
Numerous studies have demonstrated that overexpression of CEP55 is
associated with the pathological processes of several human
malignances, including hepatocellular carcinoma (36–38),
colon carcinoma (39), breast
cancer (40–42), lung cancer (43,44),
glioma (45–47), nasopharyngeal carcinoma (48), oral cavity squamous cell carcinoma
(49), osteosarcoma (50), head and neck cancer (51), anaplastic thyroid carcinoma
(52), cervical cancer (53), esophageal squamous cell carcinoma
(54,55), pancreatic cancer (56) and prostate cancer (57,58).
In addition, high CEP55 expression in colorectal cancer
downregulates the tumor susceptibility 101 gene in a
post-transcriptional manner, and knockdown of CEP55 inhibits cell
growth and increases apoptosis (39). CEP55 is significantly upregulated
in metastatic and recurrent prostate cancer when compared with
localized and non-recurrent prostate cancer, and is associated with
a poor biochemical recurrence-free survival time following radical
prostatectomy (58). High CEP55
and osteopontin expression levels in nasopharyngeal carcinoma
tissues are markedly associated with advanced tumor stages and poor
5-year survival time, and result in the acceleration of cell growth
and motility (48). In addition,
patients with hepatocellular carcinoma (HCC) and higher CEP55
expression have poorer survival (37). CEP55 is associated with several
oncogenic functions, including anchorage-independent growth,
increased cell growth during starvation and induction of
tumorigenesis in nude mice (36).
A previous mechanistic study of CEP55-mediated oncogenesis
indicated that it functions though interactions with
phosphoinositide-3 kinase (7).
Jones et al (59) revealed
that CEP55 is one of 18 genes that is positively correlated with
renal cancer progression and is highly expressed in patients with
RCC and metastasis. In addition, Luo et al (60) analyzed three datasets, including
GSE36895 and GSE46699; however, CEP55 was not revealed to be a DEG,
this may be due to the different methods of analysis used compared
with those used in the present study. The increased expression and
carcinogenic properties of CEP55, and its association with clinical
outcome in patients with ccRCC, remains unclear. Therefore, the
present study used GEO and TCGA datasets to determine the
expression and clinical significance of CEP55 in ccRCC.
In the present study, the results revealed that
CEP55 was highly expressed in ccRCC tissues based on the GEO and
TCGA datasets. In addition, the RT-PCR analysis demonstrated that
the mRNA expression levels of CEP55 in 15 paired clinical ccRCC
samples were consistent with the results obtained from open
databases. This indicated that using open databases could support
novel research design. The ROC curve analysis indicated that CEP55
may be a diagnostic biomarker for ccRCC with an AUC of 0.897 in the
training set and 0.947 in the validation set. The specificity and
sensitivity of CEP55 for the diagnosis of patients with ccRCC was
92.7 and 86.5%, respectively. In addition, CEP55 mRNA expression
was markedly associated with clinical characteristics, including
sex, histological grade, stage, T classification, N classification,
M classification and OS time. The univariate and multivariate
analyses also demonstrated that CEP55 may be an independent
prognostic factor in patients with ccRCC. From these results, it
was suggested that CEP55 may be considered a novel marker to
predict the diagnosis and prognosis of ccRCC. To understand the
mechanism underlying the effects of CEP55 on tumorigenesis, the
present study performed KEGG analysis using GSEA. CEP55 was
significantly enriched in pathways associated with immunization,
cell adhesion, inflammation, JAK/STAT signaling and cell
proliferation. A recent study demonstrated that CEP55 promotes HCC
cell migration and invasion via physiological interactions with
JAK2 and by regulating the JAK2/STAT3/matrix metalloproteinase
signaling pathway (37). Combined
with the GSEA analysis, it was hypothesized that CEP55 may regulate
cell proliferation and metastasis via the JAK/STAT signaling
pathway.
In conclusion, the present study demonstrated that
CEP55 may act as an oncogene that is highly expressed in ccRCC
samples and associated with poor clinical outcomes; it may also be
considered a diagnostic and prognostic biomarker for ccRCC. In
addition, the results revealed that CEP55 may be associated with
JAK2/STAT3 signaling pathway in tumor growth and metastasis. The
present study has some limitations, as it was mainly based on
public databases, and lacks in vivo and in vitro
experiments. Tissue expression levels of CEP55, which can
distinguish ccRCC patients from normal patients, only provides the
potential diagnostic value of CEP55 in ccRCC and cannot be put into
clinical application. Therefore, further study for the early
detection of CEP55 in blood samples from patients with ccRCC should
be implemented, and the function and mechanism of CEP55 in ccRCC
should be verified in cell and animal experiments.
Acknowledgements
The authors would like to thank Dr Yichen Chen
(Ningbo Institution of Medicine and Science, Ningbo, China) for his
technical support.
Funding
The present study was supported by The Natural
Science Foundation of Ningbo (grant no. 2017A610186) and Medicine
and Health Project of Zhejiang Province (grant no. 2019KY603).
Availability of data and materials
The datasets used and/or analyzed during the current
study are available from the corresponding author on reasonable
request.
Authors' contributions
LZ, ShiL and HL participated in the study design. XL
and SheL collected the ccRCC samples and performed the RT-PCR
analysis. LZ performed the experiments. LZ, ShiL, XL, MY, SheL and
HL analyzed the data. LZ wrote the paper and submitted the
manuscript, and ShiL, XL, MY and HL revised the manuscript. All
authors read and approved the final manuscript.
Ethics approval and consent to
participate
Ethics approval was obtained from the Ethics
Committee of Ningbo Medical Centre Lihuili Hospital and written
informed consent was obtained from all of the patients
recruited.
Patient consent for publication
Informed consent from all participants was obtained
for the publication of the present study.
Competing interests
The authors declare that they have no competing
interests.
Glossary
Abbreviations
Abbreviations:
|
CEP55
|
centrosomal protein 55
|
|
ccRCC
|
clear cell renal cell carcinoma
|
|
GEO
|
Gene Expression Omnibus
|
|
DEGs
|
differentially expressed genes
|
|
ERBB4
|
Erb-B2 receptor tyrosine kinase 4
|
|
VEGFA
|
vascular endothelial growth factor
A
|
|
GEPIA
|
Gene Expression Profiling Interactive
Analysis
|
|
TCGA
|
The Cancer Genome Atlas
|
|
ROC
|
receiver operating characteristic
|
|
AUC
|
area under the curve
|
|
RRA
|
Robust Rank Aggregation
|
|
TAG
|
tumor-associated gene
|
|
CI
|
confidence interval
|
|
KEGG
|
Kyoto Encyclopedia of Genes and
Genomes
|
|
GSEA
|
gene set enrichment analysis
|
References
|
1
|
Ljungberg B, Campbell SC, Choi HY, Jacqmin
D, Lee JE, Weikert S and Kiemeney LA: The epidemiology of renal
cell carcinoma. Eur Urol. 60:615–621. 2011. View Article : Google Scholar : PubMed/NCBI
|
|
2
|
Znaor A, Lortet-Tieulent J, Laversanne M,
Jemal A and Bray F: International variations and trends in renal
cell carcinoma incidence and mortality. Eur Urol. 67:519–530. 2015.
View Article : Google Scholar : PubMed/NCBI
|
|
3
|
Eikrem OS, Strauss P, Beisland C, Scherer
A, Landolt L, Flatberg A, Leh S, Beisvag V, Skogstrand T, Hjelle K,
et al: Development and confirmation of potential gene classifiers
of human clear cell renal cell carcinoma using next-generation RNA
sequencing. Scand J Urol. 50:452–462. 2016. View Article : Google Scholar : PubMed/NCBI
|
|
4
|
Jonasch E, Gao J and Rathmell WK: Renal
cell carcinoma. BMJ. 349:g47972014. View Article : Google Scholar : PubMed/NCBI
|
|
5
|
Zhou L, Yin B, Liu Y, Hong Y, Zhang C and
Fan J: Mechanism and function of decreased FOXO1 in renal cell
carcinoma. J Surg Oncol. 105:841–847. 2012. View Article : Google Scholar : PubMed/NCBI
|
|
6
|
Ficarra V and Novara G: Kidney cancer:
Characterizing late recurrence of renal cell carcinoma. Nat Rev
Urol. 10:687–689. 2013. View Article : Google Scholar : PubMed/NCBI
|
|
7
|
Cancer Genome Atlas Research Network, .
Comprehensive molecular characterization of clear cell renal cell
carcinoma. Nature. 499:43–49. 2013. View Article : Google Scholar : PubMed/NCBI
|
|
8
|
Ricketts CJ, De Cubas AA, Fan H, Smith CC,
Lang M, Reznik E, Bowlby R, Gibb EA, Akbani R, Beroukhim R, et al:
The cancer genome atlas comprehensive molecular characterization of
renal cell carcinoma. Cell Rep. 23:36982018. View Article : Google Scholar : PubMed/NCBI
|
|
9
|
Barrett T, Troup DB, Wilhite SE, Ledoux P,
Evangelista C, Kim IF, Tomashevsky M, Marshall KA, Phillippy KH,
Sherman PM, et al: NCBI GEO: Archive for functional genomics data
sets-10 years on. Nucleic Acids Res. 39:Database Issue.
D1005–D1010. 2011. View Article : Google Scholar : PubMed/NCBI
|
|
10
|
Cerami E, Gao J, Dogrusoz U, Gross BE,
Sumer SO, Aksoy BA, Jacobsen A, Byrne CJ, Heuer ML, Larsson E, et
al: The cBio cancer genomics portal: An open platform for exploring
multidimensional cancer genomics data. Cancer Discov. 2:401–404.
2012. View Article : Google Scholar : PubMed/NCBI
|
|
11
|
Gao J, Aksoy BA, Dogrusoz U, Dresdner G,
Gross B, Sumer SO, Sun Y, Jacobsen A, Sinha R, Larsson E, et al:
Integrative analysis of complex cancer genomics and clinical
profiles using the cBioPortal. Sci Signal. 6:pl12013. View Article : Google Scholar : PubMed/NCBI
|
|
12
|
Hanahan D and Weinberg RA: Hallmarks of
cancer: The next generation. Cell. 144:646–674. 2011. View Article : Google Scholar : PubMed/NCBI
|
|
13
|
Edge SB, Byrd DR and Compton CC: AJCC
cancer staging manual. 7th. Springer-Verlag; New York: pp. 547–560.
2009
|
|
14
|
Eckel-Passow JE, Serie DJ, Bot BM, Joseph
RW, Cheville JC and Parker AS: ANKS1B is a smoking-related
molecular alteration in clear cell renal cell carcinoma. BMC Urol.
14:142014. View Article : Google Scholar : PubMed/NCBI
|
|
15
|
Peña-Llopis S, Vega-Rubin-de-Celis S, Liao
A, Leng N, Pavía-Jiménez A, Wang S, Yamasaki T, Zhrebker L,
Sivanand S, Spence P, et al: BAP1 loss defines a new class of renal
cell carcinoma. Nat Genet. 44:751–759. 2012. View Article : Google Scholar : PubMed/NCBI
|
|
16
|
Gerlinger M, Horswell S, Larkin J, Rowan
AJ, Salm MP, Varela I, Fisher R, McGranahan N, Matthews N, Santos
CR, et al: Genomic architecture and evolution of clear cell renal
cell carcinomas defined by multiregion sequencing. Nat Genet.
46:225–233. 2014. View
Article : Google Scholar : PubMed/NCBI
|
|
17
|
von Roemeling CA, Radisky DC, Marlow LA,
Cooper SJ, Grebe SK, Anastasiadis PZ, Tun HW and Copland JA:
Neuronal pentraxin 2 supports clear cell renal cell carcinoma by
activating the AMPA-selective glutamate receptor-4. Cancer Res.
74:4796–4810. 2014. View Article : Google Scholar : PubMed/NCBI
|
|
18
|
Ritchie ME, Phipson B, Wu D, Hu Y, Law CW,
Shi W and Smyth GK: Limma powers differential expression analyses
for RNA-sequencing and microarray studies. Nucleic Acids Res.
43:e472015. View Article : Google Scholar : PubMed/NCBI
|
|
19
|
Kolde R, Laur S, Adler P and Vilo J:
Robust rank aggregation for gene list integration and
meta-analysis. Bioinformatics. 28:573–580. 2012. View Article : Google Scholar : PubMed/NCBI
|
|
20
|
Vosa U, Kolde R, Vilo J, Metspalu A and
Annilo T: Comprehensive meta-analysis of microRNA expression using
a robust rank aggregation approach. Methods Mol Biol. 1182:361–373.
2014. View Article : Google Scholar : PubMed/NCBI
|
|
21
|
Yang X, Zhu S, Li L, Zhang L, Xian S, Wang
Y and Cheng Y: Identification of differentially expressed genes and
signaling pathways in ovarian cancer by integrated bioinformatics
analysis. Onco Targets Ther. 11:1457–1474. 2018. View Article : Google Scholar : PubMed/NCBI
|
|
22
|
Chen JS, Hung WS, Chan HH, Tsai SJ and Sun
HS: In silico identification of oncogenic potential of fyn-related
kinase in hepatocellular carcinoma. Bioinformatics. 29:420–427.
2013. View Article : Google Scholar : PubMed/NCBI
|
|
23
|
Livak KJ and Schmittgen TD: Analysis of
relative gene expression data using real-time quantitative PCR and
the 2(-Delta Delta C(T)) method. Methods. 25:402–408. 2001.
View Article : Google Scholar : PubMed/NCBI
|
|
24
|
Metz CE: Basic principles of ROC analysis.
Semin Nucl Med. 8:283–298. 1978. View Article : Google Scholar : PubMed/NCBI
|
|
25
|
Mootha VK, Lindgren CM, Eriksson KF,
Subramanian A, Sihag S, Lehar J, Puigserver P, Carlsson E,
Ridderstråle M, Laurila E, et al: PGC-1alpha-responsive genes
involved in oxidative phosphorylation are coordinately
downregulated in human diabetes. Nat Genet. 34:267–273. 2003.
View Article : Google Scholar : PubMed/NCBI
|
|
26
|
Subramanian A, Tamayo P, Mootha VK,
Mukherjee S, Ebert BL, Gillette MA, Paulovich A, Pomeroy SL, Golub
TR, Lander ES and Mesirov JP: Gene set enrichment analysis: A
knowledge-based approach for interpreting genome-wide expression
profiles. Proc Natl Acad Sci USA. 102:15545–15550. 2005. View Article : Google Scholar : PubMed/NCBI
|
|
27
|
Takata M, Yamanaka N, Tanaka T, Yamanaka
J, Maeda S, Okamoto E, Yasojima H, Uematsu K, Watanabe H and
Uragari Y: What patients can survive disease free after complete
resection for hepatocellular carcinoma? A multivariate analysis.
Jpn J Clin Oncol. 30:75–81. 2000. View Article : Google Scholar : PubMed/NCBI
|
|
28
|
Girgis H, Masui O, White NM, Scorilas A,
Rotondo F, Seivwright A, Gabril M, Filter ER, Girgis AH, Bjarnason
GA, et al: Lactate dehydrogenase A is a potential prognostic marker
in clear cell renal cell carcinoma. Mol Cancer. 13:1012014.
View Article : Google Scholar : PubMed/NCBI
|
|
29
|
King SC, Pollack LA, Li J, King JB and
Master VA: Continued increase in incidence of renal cell carcinoma,
especially in young patients and high grade disease: United States
2001 to 2010. J Urol. 191:1665–1670. 2014. View Article : Google Scholar : PubMed/NCBI
|
|
30
|
Levi F, Ferlay J, Galeone C, Lucchini F,
Negri E, Boyle P and La Vecchia C: The changing pattern of kidney
cancer incidence and mortality in Europe. BJU Int. 101:949–958.
2008. View Article : Google Scholar : PubMed/NCBI
|
|
31
|
Jeffery J, Sinha D, Srihari S, Kalimutho M
and Khanna KK: Beyond cytokinesis: The emerging roles of CEP55 in
tumorigenesis. Oncogene. 35:683–690. 2016. View Article : Google Scholar : PubMed/NCBI
|
|
32
|
Zhao WM, Seki A and Fang G: Cep55, a
microtubule-bundling protein, associates with centralspindlin to
control the midbody integrity and cell abscission during
cytokinesis. Mol Biol Cell. 17:3881–3896. 2006. View Article : Google Scholar : PubMed/NCBI
|
|
33
|
Fabbro M, Zhou BB, Takahashi M, Sarcevic
B, Lal P, Graham ME, Gabrielli BG, Robinson PJ, Nigg EA, Ono Y and
Khanna KK: Cdk1/Erk2- and Plk1-dependent phosphorylation of a
centrosome protein, Cep55, is required for its recruitment to
midbody and cytokinesis. Dev Cell. 9:477–488. 2005. View Article : Google Scholar : PubMed/NCBI
|
|
34
|
Jeffery J, Neyt C, Moore W, Paterson S,
Bower NI, Chenevix-Trench G, Verkade H, Hogan BM and Khanna KK:
Cep55 regulates embryonic growth and development by promoting Akt
stability in zebrafish. FASEB J. 29:1999–2009. 2015. View Article : Google Scholar : PubMed/NCBI
|
|
35
|
Xu ZY, Ma XS, Qi ST, Wang ZB, Guo L,
Schatten H, Sun QY and Sun YP: Cep55 regulates spindle organization
and cell cycle progression in meiotic oocyte. Sci Rep. 5:169782015.
View Article : Google Scholar : PubMed/NCBI
|
|
36
|
Chen CH, Lu PJ, Chen YC, Fu SL, Wu KJ,
Tsou AP, Lee YC, Lin TC, Hsu SL, Lin WJ, et al: FLJ10540-elicited
cell transformation is through the activation of PI3-kinase/AKT
pathway. Oncogene. 26:4272–4283. 2007. View Article : Google Scholar : PubMed/NCBI
|
|
37
|
Li M, Gao J, Li D and Yin Y: CEP55
promotes cell motility via JAK2-STAT3-MMPs cascade in
hepatocellular carcinoma. Cells. 7(pii): E992018. View Article : Google Scholar : PubMed/NCBI
|
|
38
|
Yang YF, Zhang MF, Tian QH, Fu J, Yang X,
Zhang CZ and Yang H: SPAG5 interacts with CEP55 and exerts
oncogenic activities via PI3K/AKT pathway in hepatocellular
carcinoma. Mol Cancer. 17:1172018. View Article : Google Scholar : PubMed/NCBI
|
|
39
|
Sakai M, Shimokawa T, Kobayashi T,
Matsushima S, Yamada Y, Nakamura Y and Furukawa Y: Elevated
expression of C10orf3 (chromosome 10 open reading frame 3) is
involved in the growth of human colon tumor. Oncogene. 25:480–486.
2006. View Article : Google Scholar : PubMed/NCBI
|
|
40
|
Inoda S, Hirohashi Y, Torigoe T,
Nakatsugawa M, Kiriyama K, Nakazawa E, Harada K, Takasu H, Tamura
Y, Kamiguchi K, et al: Cep55/c10orf3, a tumor antigen derived from
a centrosome residing protein in breast carcinoma. J Immunother.
32:474–485. 2009. View Article : Google Scholar : PubMed/NCBI
|
|
41
|
Wang Y, Jin T, Dai X and Xu J:
Lentivirus-mediated knockdown of CEP55 suppresses cell
proliferation of breast cancer cells. Biosci Trends. 10:67–73.
2016. View Article : Google Scholar : PubMed/NCBI
|
|
42
|
Kalimutho M, Sinha D, Jeffery J, Nones K,
Srihari S, Fernando WC, Duijf PH, Vennin C, Raninga P, Nanayakkara
D, et al: CEP55 is a determinant of cell fate during perturbed
mitosis in breast cancer. EMBO Mol Med. 10(pii): e85662018.
View Article : Google Scholar : PubMed/NCBI
|
|
43
|
Chen CH, Lai JM, Chou TY, Chen CY, Su LJ,
Lee YC, Cheng TS, Hong YR, Chou CK, Whang-Peng J, et al: VEGFA
upregulates FLJ10540 and modulates migration and invasion of lung
cancer via PI3K/AKT pathway. PLoS One. 4:e50522009. View Article : Google Scholar : PubMed/NCBI
|
|
44
|
Liu L, Mei Q, Zhao J, Dai Y and Fu Q:
Suppression of CEP55 reduces cell viability and induces apoptosis
in human lung cancer. Oncol Rep. 36:1939–1945. 2016. View Article : Google Scholar : PubMed/NCBI
|
|
45
|
Wang G, Liu M, Wang H, Yu S, Jiang Z, Sun
J, Han K, Shen J, Zhu M, Lin Z, et al: Centrosomal protein of 55
regulates glucose metabolism, proliferation and apoptosis of glioma
cells via the Akt/mTOR signaling pathway. J Cancer. 7:1431–1440.
2016. View Article : Google Scholar : PubMed/NCBI
|
|
46
|
Zhu H, Chen D, Tang J, Huang C, Lv S, Wang
D and Li G: Overexpression of centrosomal protein 55 regulates the
proliferation of glioma cell and mediates proliferation promoted by
EGFRvIII in glioblastoma U251 cells. Oncol Lett. 15:2700–2706.
2018.PubMed/NCBI
|
|
47
|
Li F, Jin D, Tang C and Gao D: CEP55
promotes cell proliferation and inhibits apoptosis via the
PI3K/Akt/p21 signaling pathway in human glioma U251 cells. Oncol
Lett. 15:4789–4796. 2018.PubMed/NCBI
|
|
48
|
Chen CH, Shiu LY, Su LJ, Huang CY, Huang
SC, Huang CC, Yin YF, Wang WS, Tsai HT, Fang FM, et al: FLJ10540 is
associated with tumor progression in nasopharyngeal carcinomas and
contributes to nasopharyngeal cell proliferation, and metastasis
via osteopontin/CD44 pathway. J Transl Med. 10:932012. View Article : Google Scholar : PubMed/NCBI
|
|
49
|
Chen CH, Chien CY, Huang CC, Hwang CF,
Chuang HC, Fang FM, Huang HY, Chen CM, Liu HL and Huang CY:
Expression of FLJ10540 is correlated with aggressiveness of oral
cavity squamous cell carcinoma by stimulating cell migration and
invasion through increased FOXM1 and MMP-2 activity. Oncogene.
28:2723–2737. 2009. View Article : Google Scholar : PubMed/NCBI
|
|
50
|
Xu L, Xia C, Sheng F, Sun Q, Xiong J and
Wang S: CEP55 promotes the proliferation and invasion of tumour
cells via the AKT signalling pathway in osteosarcoma.
Carcinogenesis. 39:623–631. 2018. View Article : Google Scholar : PubMed/NCBI
|
|
51
|
Chen CH, Chang AY, Li SH, Tsai HT, Shiu
LY, Su LJ, Wang WL, Chiu TJ, Luo SD, Huang TL and Chien CY:
Suppression of Aurora-A-FLJ10540 signaling axis prohibits the
malignant state of head and neck cancer. Mol Cancer. 14:832015.
View Article : Google Scholar : PubMed/NCBI
|
|
52
|
Weinberger P, Ponny SR, Xu H, Bai S,
Smallridge R, Copland J and Sharma A: Cell cycle M-phase genes are
highly upregulated in anaplastic thyroid carcinoma. Thyroid.
27:236–252. 2017. View Article : Google Scholar : PubMed/NCBI
|
|
53
|
Qi J, Liu G and Wang F: High levels of
centrosomal protein 55 expression is associated with poor clinical
prognosis in patients with cervical cancer. Oncol Lett.
15:9347–9352. 2018.PubMed/NCBI
|
|
54
|
Jia Y, Xiao Z, Gongsun X, Xin Z, Shang B,
Chen G, Wang Z and Jiang W: CEP55 promotes the proliferation,
migration and invasion of esophageal squamous cell carcinoma via
the PI3K/Akt pathway. Onco Targets Ther. 11:4221–4232. 2018.
View Article : Google Scholar : PubMed/NCBI
|
|
55
|
Jiang W, Wang Z and Jia Y: CEP55
overexpression predicts poor prognosis in patients with locally
advanced esophageal squamous cell carcinoma. Oncol Lett.
13:236–242. 2017. View Article : Google Scholar : PubMed/NCBI
|
|
56
|
Peng T, Zhou W, Guo F, Wu HS, Wang CY,
Wang L and Yang ZY: Centrosomal protein 55 activates NF-κB
signalling and promotes pancreatic cancer cells aggressiveness. Sci
Rep. 7:59252017. View Article : Google Scholar : PubMed/NCBI
|
|
57
|
Zheng H, Guo Z, Zheng X, Cheng W and Huang
X: MicroRNA-144-3p inhibits cell proliferation and induces cell
apoptosis in prostate cancer by targeting CEP55. Am J Transl Res.
10:2457–2468. 2018.PubMed/NCBI
|
|
58
|
Kulkarni P and Uversky VN: Cancer/testis
antigens: ‘Smart’ Biomarkers for diagnosis and prognosis of
prostate and other cancers. Int J Mol Sci. 18(pii): E7402017.
View Article : Google Scholar : PubMed/NCBI
|
|
59
|
Jones J, Otu H, Spentzos D, Kolia S, Inan
M, Beecken WD, Fellbaum C, Gu X, Joseph M, Pantuck AJ, et al: Gene
signatures of progression and metastasis in renal cell cancer. Clin
Cancer Res. 11:5730–5739. 2005. View Article : Google Scholar : PubMed/NCBI
|
|
60
|
Luo T, Chen X, Zeng S, Guan B, Hu B, Meng
Y, Liu F, Wong T, Lu Y, Yun C, et al: Bioinformatic identification
of key genes and analysis of prognostic values in clear cell renal
cell carcinoma. Oncol Lett. 16:1747–1757. 2018.PubMed/NCBI
|