Introduction
Gestational diabetes mellitus (GDM) incidence is
increasing worldwide, and represents a severe medical problem. In
total, ~18% of pregnant women are diagnosed with GDM according to
the guidelines of The International Association of Diabetes and
Pregnancy Study Groups (1). GDM
may cause adverse outcomes in the mother and newborn during
pregnancy and following birth (2–4). The
risk of women with GDM to develop type 2 diabetes mellitus (T2DM)
following delivery has been reported to increase by 7 times when
compared with healthy women (5).
The mechanism of GDM involves the presence of dysfunctional
pancreatic β-cells that are not able to secrete high levels of
insulin and to compensate for insulin resistance in late pregnancy.
In GDM, the function of β-cells declines and glucose intolerance
may be detected in the mother in the first year following delivery
(6,7). Therefore, the symptoms of GDM may be
used as predictive factors for the development of prediabetes and
T2DM, and these two conditions share similar pathophysiological and
genetic characteristics (8).
Patients with T2DM present a 40% risk of developing
diabetic nephropathy (DN), which has been the leading cause of
end-stage renal failure worldwide (9). DN was identified by previous studies
to be associated with mitogen-activated protein kinases (MAPKs)
(10) and with the signaling
pathways involved in the pro-inflammatory response (11). The pro-inflammatory response may
cause the release of inflammatory cytokines, including tumor
necrosis factor-α (TNF-α) and interleukin-6 (IL-6), leading to
kidney damage in patients with diabetes (11). A number of previous studies
demonstrated that GDM exhibits a long-term effect on renal function
following delivery (12,13). Beharier et al (12) observed that GDM represents a
significant risk factor for long-term renal morbidity, and
identified a linear correlation between the number of GDM episodes
and the risk of developing renal morbidity. Metformin is a standard
clinical drug used to treat T2DM and GDM, and its safety and
efficacy were demonstrated in a number of previous studies
(14–16). However, the mechanism underlying
metformin function in GDM-induced renal dysfunction remains
unclear. Since T2DM and GDM share similar pathophysiological and
genetic characteristics (8), the
present study aimed to investigate whether the protective effect of
metformin on renal dysfunction in GDM mice is associated with the
pro-inflammatory response via the MAPK signaling pathway. In the
present study, it was hypothesized that metformin exposure during
pregnancy may decrease GDM-induced renal dysfunction.
Materials and methods
Reagents
Metformin and D-glucose were purchased from
Sigma-Aldrich (Merck KGaA, Darmstadt, Germany). The primary
antibodies anti-MAPK1/3 (cat. no. 9102; 1:1,000),
phosphorylated-MAPK1/3 (p-MAPK1/3; cat. no; 4370, 1:1,000), MAPK8
(cat. no. 9252; 1:1,000), p-MAPK8 (cat. no. 9255; 1:1,000), MAPK14
(cat. no. 9212; 1:1,000), p-MAPK14 (cat. no. 4511; 1:1,000) and
GAPDH (cat. no. 8884; 1:1,000) were purchased from Cell Signaling
Technology, Inc. (Danvers, MA, USA). The primary antibody
anti-β-actin (cat. no. sc-47778, 1:1,000) was purchased from Santa
Cruz Biotechnology, Inc. (Dallas, TX, USA). Horseradish
peroxidase-labeled secondary antibodies (cat. no. TA130003,
1:1,000) were purchased from OriGene Technologies, Inc. (Beijing,
China). Enhanced chemiluminescence (ECL) reagent was purchased from
EMD Millipore (Billerica, MA, USA).
Animals
All procedures involving animal experiments were in
accordance with the ethical standards of The Chongqing Medical
University Animal Policy and Welfare committee, and ethical
approval was obtained from The Ethics Committee of The First
Affiliated Hospital of Chongqing Medical University (approval no.
2017-030-2). All efforts were made to minimize animal suffering. A
total of 36 female C57BL/6 mice (18–22 g, 7 weeks old) were
purchased from The Animal Centre of Chongqing Medical University
(Chongqing, China), and acclimatized for 1 week. The mice were
housed at 22–24°C and 40–60% humidity, under a 12-h light/dark
cycle, with free access to food and water.
In total, 24 8-weeks-old mice were randomly divided
into 4 groups (n=6 per group), including the control group, the GDM
group and two GDM groups treated with two different doses of
metformin (300 and 600 mg/kg/day). These working concentrations
were determined by a series of preliminary experiments (data not
shown). The control group was fed a low-fat diet (LFD; Research
Diets, Inc., New Brunswick, NJ, USA; cat. no. AIN-93G), which
contained 15.8% fat, 20.3% proteins and 63.9% carbohydrates. The
mice in the other three groups were fed a high-fat diet (HFD;
Research Diets, Inc.; cat. no. D12451), which contained 45% fat,
20% proteins and 35% carbohydrates. Following 1 week of the LFD or
HFD, all mice (age, 9 weeks) were mated with male mice (female to
male ratio, 2:1) and fed the special diet described above until
embryonic day 18.5 (E18.5). GDM mice were treated with the two
doses of metformin between E11.5 and E17.5 via gavage, whereas the
untreated GDM and control groups were administered PBS via gavage.
The oral glucose tolerance test (OGTT) was performed on female mice
at E0.5 and E16.5. Urine was collected from each mouse in a
metabolic cage at E17.5 to measure the level of albumin in the
urine. Mice were sacrificed following 6 h of fasting at E18.5 by
intraperitoneal injection of 1% pentobarbital sodium (50 mg/kg)
combined with CO2 asphyxiation in a sealed chamber. The
chamber was filled at a rate of 20% CO2 chamber
volume/min. Mice that did not exhibit spontaneous breathing or
blink reflex for >3 min were considered to be deceased. Serum
was collected to measure the circulating levels of certain factors
including insulin, β2-microglobulin, IL-6 and TNF-α. The kidneys
were removed following sacrifice. Half of the left kidney from each
mouse was fixed with 4% paraformaldehyde and then dehydrated in 25%
sucrose solution at 4°C for 24 h, respectively, for pathological
analysis. The remaining half of each kidney was snap-frozen in
liquid nitrogen for western blot analysis.
Evaluation of glucose tolerance and
homeostatic model assessment for insulin resistance (HOMA-IR)
In order to investigate glucose intolerance, OGTT
was performed at E0.5 (the morning that vaginal plug was observed)
and E16.5. D-glucose (2 mg/g) was administered to 6-h fasted mice
via gavage, and glucose levels were determined following 0, 30, 60,
90 and 120 min at the tail tip with a glucometer (Johnson &
Johnson, New Brunswick, NJ, USA). Glucose tolerance was analyzed by
the area under the curve (AUC). HOMA-IR was measured at E18.5.
Fasting blood glucose levels were determined in 6-h fasted mice at
the tail tip with a glucometer. Serum insulin levels were
determined by ELISA. HOMA-IR was calculated using the following
formula: HOMA-IR=[fasting blood glucose level (mmol/l) × fasting
serum insulin level (mIU/l)]/22.5 (17).
Determination of albumin levels in the
urine and serum biochemical parameters by ELISA
Urine was collected from mice at E17.5 in metabolic
cages for 12 h and stored at −80°C. At E18.5, the mice were
sacrificed following 6 h of fasting. Blood was collected by cardiac
puncture and immediately centrifuged at 1,000 × g and 4°C for 15
min to collect serum. Serum samples were stored at −80°C. Mouse
ELISA kits (Westang BioTech, Inc., Ltd., Shanghai, China) were used
to determined the urine albumin (cat. no. N04323) and serum insulin
(cat. no. N04572) levels in addition to the circulating levels of
β2-microglobulin (cat. no. N03915), IL-6 (cat. no. N03981) and
TNF-α (cat. no. A05224). Absorbance was measured at 450 nm.
Histology and morphometry
The mice were sacrificed at E18.5 and the kidneys
were immediately removed. Half of the left kidney in each mouse was
fixed in 4% paraformaldehyde as aforementioned, embedded in
paraffin and 5-µm sections were prepared. Hematoxylin and eosin
(H&E) and periodic acid-Schiff (PAS) staining were performed
using commercial kits (cat. no. G1120 and G1281, Beijing Solarbio
Science & Technology Co., Ltd, Beijing, China). Briefly,
H&E staining was using hematoxylin for 5 min followed by eosin
for 2 min at room temperature; PAS was stained with Schiff Reagent
for 15 min and hematoxylin for 1 min at room temperature. H&E
and PAS stained slides were observed using a light microscope
(OLYMPUS X81; Olympus Corporation, magnification, ×400).
Western blot analysis
Protein expression levels of MAPK1/3, −8 and −14,
and p-MAPK1/3, −8 and −14 were determined by western blotting.
Kidney tissue samples (n=3 per group) were homogenized in
radioimmunoprecipitation assay solution containing 1:100
phosphatase inhibitor cocktail (phenylmethylsulfonyl fluoride, cat.
no. ST506, Beyotime Beyotime Institute of Biotechnology, Inc.,
Shanghai, China). Protein concentration was determined using the
bicinchoninic acid assay kit (Beyotime Institute of Biotechnology,
Inc.). Protein lysates (50 µg) were loaded in each lane, separated
by 10% SDS-PAGE and transferred onto polyvinylidene fluoride
membranes (Bio-Rad Laboratories, Inc., Hercules, CA, USA) at 100 V
for 2 h. Membranes were blocked with 5% non-fat milk in TBST
(0.075% Tween) for 1 h at room temperature, and sequentially
incubated with primary antibodies (dilution, 1:1,000) at 4°C
overnight and horseradish peroxidase-conjugated secondary
antibodies (dilution, 1:5,000) at room temperature for 1 h. Bands
were visualized with an ECL reagent and quantitated using ImageJ
v1.8.0 (National Institutes of Health, Bethesda, MD, USA). Data
were normalized to β-actin or GAPDH levels.
Statistical analysis
Data are presented as the mean ± standard error.
Comparisons among four or three groups were performed by one-way
analysis of variance, followed by the least significant difference
multiple-comparison post hoc test. Bivariate correlation analysis
was used to analyze the correlation between the levels of
inflammatory cytokines and symptoms of renal dysfunction. P<0.05
was considered to indicate a statistically significant difference.
Data were analyzed using the SPSS statistical package (version
17.0; SPSS, Inc., Chicago, IL, USA).
Results
Establishment of a HFD-induced GDM
model
At E0.5, body weight was measured, and blood glucose
levels and glucose tolerance were determined via OGTT, and no
significant differences between the two groups were observed (data
not shown). The OGTT was subsequently performed at E16.5. Blood
glucose levels in the GDM group at 0, 30, 60, 90 and 120 min and
the AUC value representing glucose tolerance were significantly
increased compared with the control group (Table I). The present data suggested that
glucose tolerance in the GDM group was impaired. Additionally,
pregnant mice at E18.5 were weighed and HOMA-IR was calculated.
Body weight in the GDM group was significantly increased compared
with the control group (Table I).
The levels of glucose, insulin and HOMA-IR were significantly
increased in the GDM group compared with the control group
(Table I), suggesting that insulin
sensitivity was impaired in GDM mice. The present results suggested
that the established mouse model exhibited reliable symptoms of
GDM. In addition, to investigate the effects of GDM in middle- to
old-aged animals, OGTT and the AUC of OGTT were performed at 3
weeks following delivery, and no significant differences between
the two groups were observed (Table
II), which suggested a GDM model was induced rather than
T2DM.
 | Table I.Characteristics of the control and
GDM groups. |
Table I.
Characteristics of the control and
GDM groups.
| Measurements | Control | GDM model |
|---|
| Blood glucose at 0
min, mmol/l | 4.92±0.46 |
5.62±0.38a |
| Blood glucose at 30
min, mmol/l | 13.87±0.82 |
17.00±0.68c |
| Blood glucose at 60
min, mmol/l | 11.15±0.83 |
12.87±0.43b |
| Blood glucose at 90
min, mmol/l | 7.18±0.44 |
9.55±0.39c |
| Blood glucose at
120 min, mmol/l | 5.15±0.24 |
5.51±0.27a |
| Area under the
curve | 1,117.17±48.59 |
1,356.33±22.33c |
| E0.5 body weight,
g | 22.17±0.30 | 22.29±0.54 |
| E18.5 body weight,
g | 33.28±0.66 |
38.45±0.57c |
| E18.5 fasting
glucose, mmol/l | 5.12±0.19 |
5.68±0.42b |
| E18.5 fasting
insulin, mmol/l | 18.32±0.90 |
21.97±0.31c |
| E18.5 HOMA-IR | 4.17 ±0.16 |
5.55±0.21c |
| Table II.OGTT results and the AUC of OGTT at 3
weeks following delivery in the control and GDM groups. |
Table II.
OGTT results and the AUC of OGTT at 3
weeks following delivery in the control and GDM groups.
| Measurements | Control | GDM model |
|---|
| Blood glucose at 0
min, mmol/l | 5.73±0.22 | 5.20±0.30 |
| Blood glucose at 30
min, mmol/l | 10.33±0.79 | 11.84±0.77 |
| Blood glucose at 60
min, mmol/l | 7.15±0.73 | 7.20±0.35 |
| Blood glucose at 90
min, mmol/l | 6.13±0.14 | 6.16±0.15 |
| Blood glucose at
120 min, mmol/l | 5.78±0.17 | 5.42±0.22 |
| AUC | 880.5±30.77 | 915.4±36.38 |
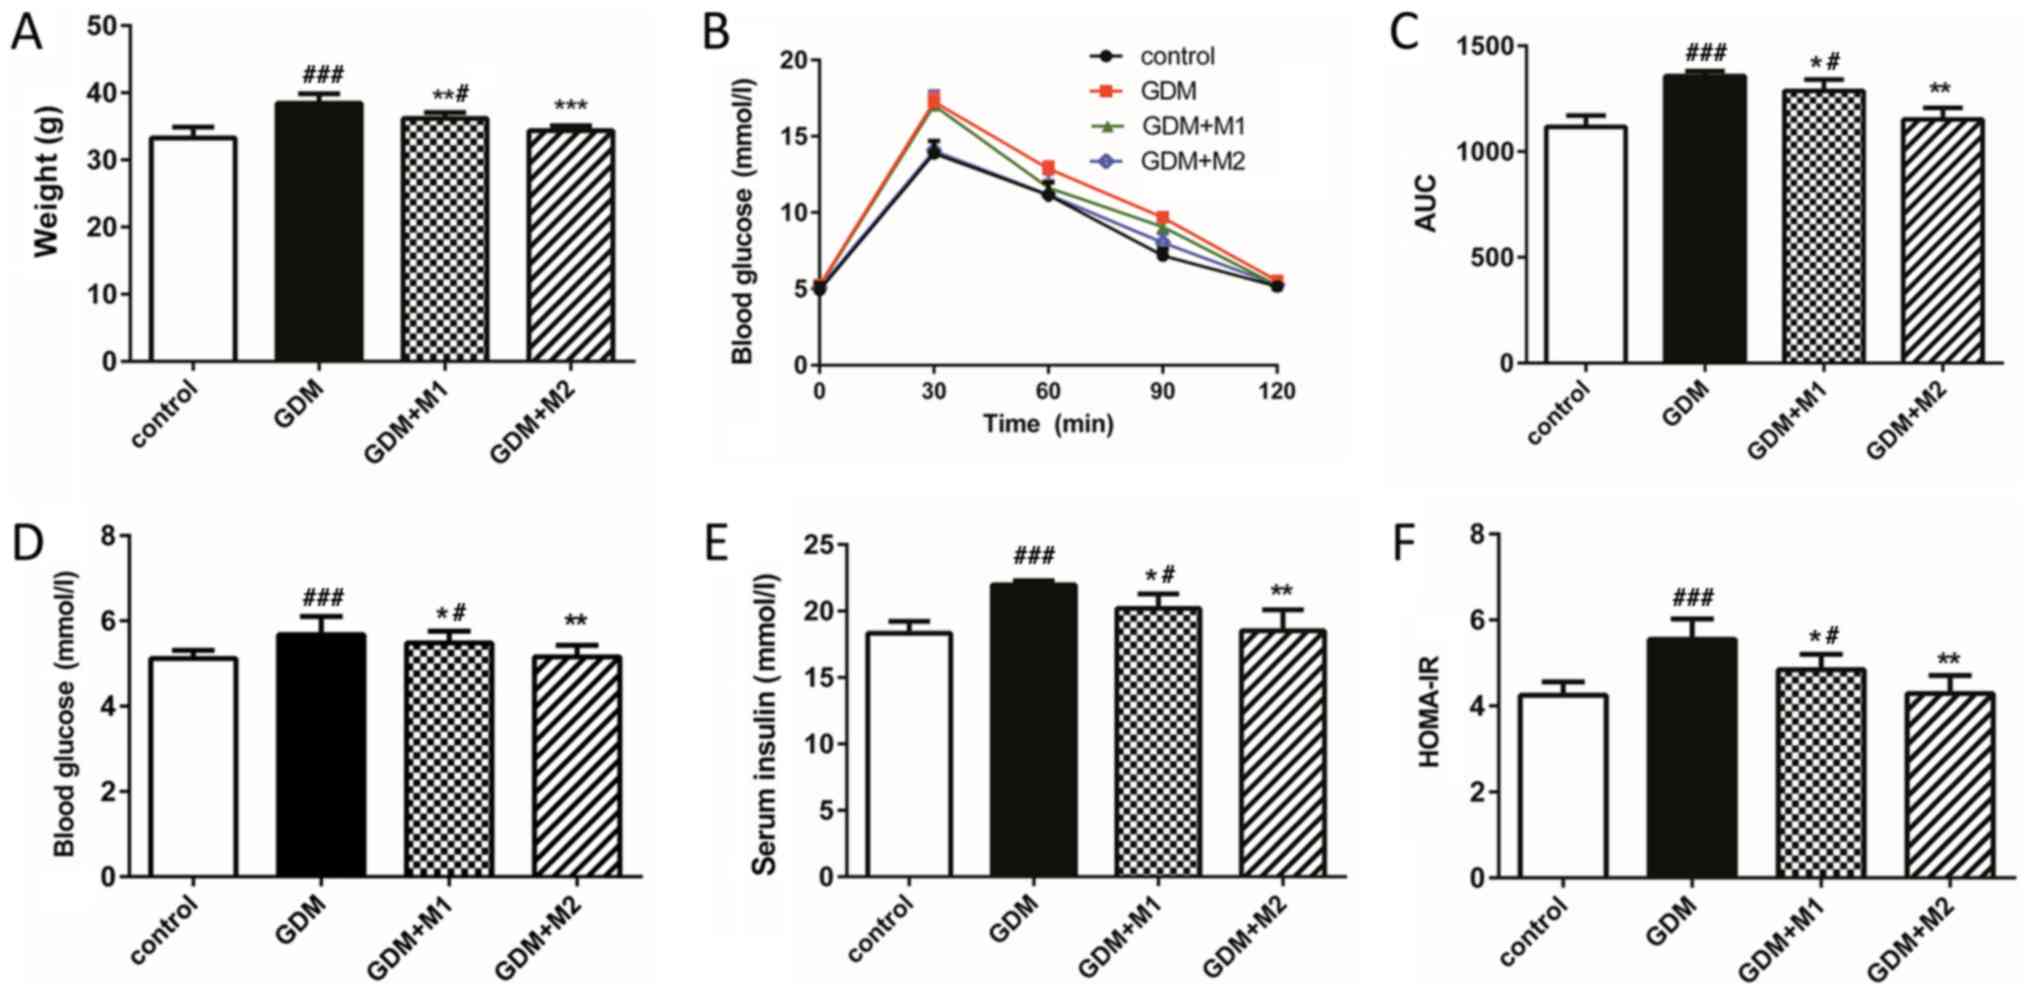
Metformin attenuates glucose tolerance
and insulin resistance in GDM mice during pregnancy
Body weight (Fig.
1A), blood glucose levels at all time points (Fig. 1B) and glucose tolerance (Fig. 1C) in the GDM group at E18.5 were
increased compared with the control group. Treatment with metformin
at two concentrations (300 and 600 mg/kg/day) significantly
reversed these effects. The levels of blood glucose, serum insulin
and HOMA-IR (Fig. 1D-F) were
significantly increased in the fasting mice of the GDM group
compared with the control group (Table
I). Treatment with metformin at the two concentrations tested
significantly decreased the levels of blood glucose, insulin
secretion and HOMA-IR compared to untreated GDM mice, in a
dose-dependent manner (Fig.
1D-F).
Metformin attenuates GDM-induced renal
dysfunction during pregnancy
The mice were sacrificed at E18.5 and the kidneys
were harvested. The kidney-to-body weight ratios were measured and
no significant differences among the four groups were observed
(data not shown). Subsequently, the markers of early renal
dysfunction were investigated by ELISA. The levels of urine albumin
(Fig. 2A) and serum
β2-microglobulin (Fig. 2B) in the
GDM group were significantly increased compared with control mice.
However, treatment with metformin (300 and 600 mg/kg/day)
significantly reversed these effects. Additionally, H&E
(Fig. 2C) and PAS (Fig. 2D) staining were performed to assess
kidney histomorphology. The glomerular diameters following H&E
staining and the basement membrane thicknesses following PAS
staining of the four groups of mice were measured. The glomerular
volume in the GDM group was increased compared with the control
group. Basement membrane thickening and mesangial matrix
proliferation was observed in the GDM group. The present
alterations observed by H&E and PAS staining were markedly
reversed by treatments with metformin (300 and 600 mg/kg/day).
These results suggested that the markers of early renal dysfunction
were significantly increased in the GDM group and dose-dependently
reduced by metformin treatment, which confirmed the protective
effect of metformin.
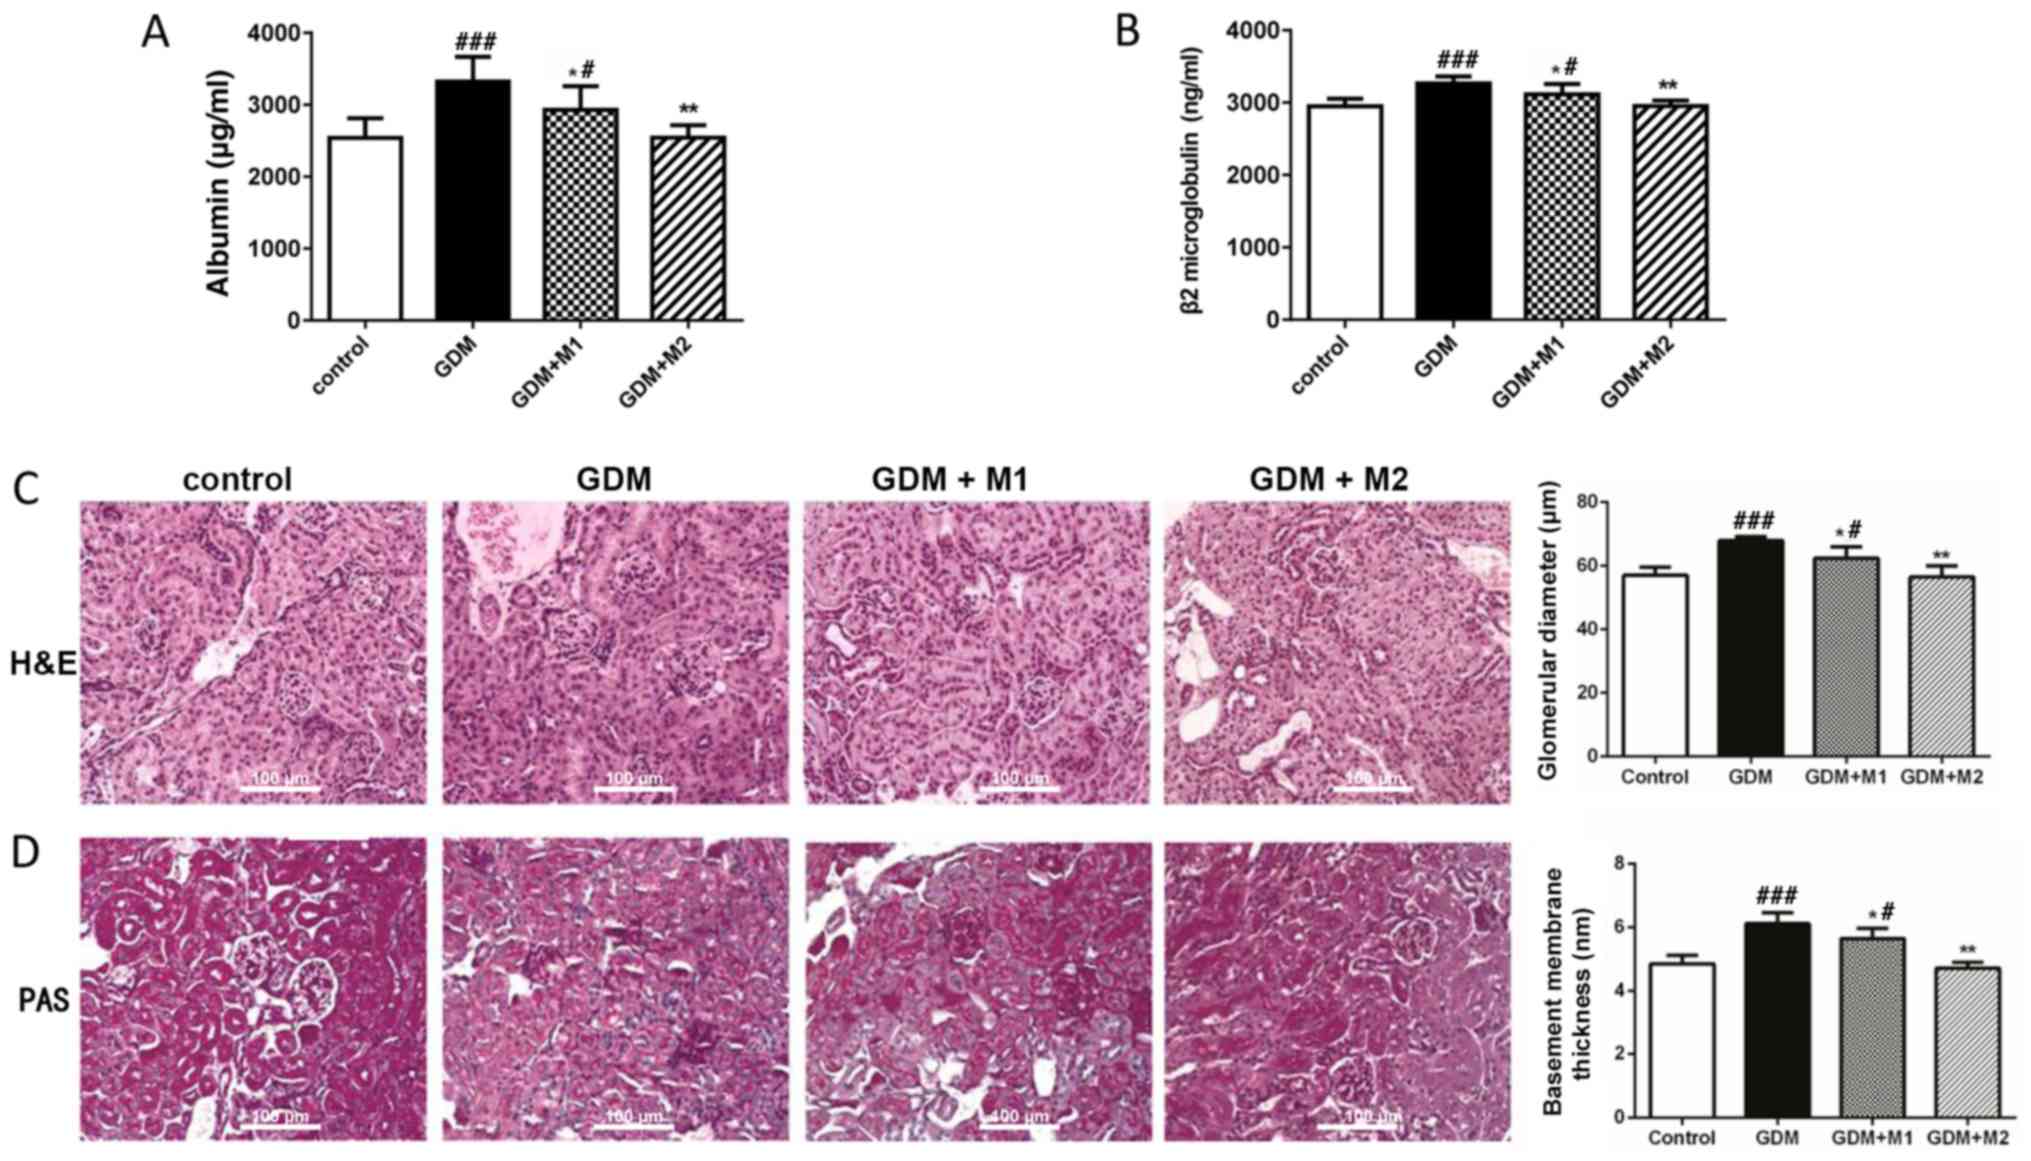 | Figure 2.Metformin attenuates renal
dysfunction in the GDM groups during pregnancy. (A) Level of urine
albumin at E17.5 determined by ELISA. (B) Serum β2-microglobulin
levels at E18.5 determined by ELISA. (C) H&E and (D) PAS
staining of the kidney tissue at E18.5. Magnification, ×400; scale
bar, 100 µm. The GDM group exhibited increased glomerulus volume,
as assessed by H&E staining, and glomerular basement membrane
thickening and mesangial matrix expansion, as determined by PAS
staining. Treatment with metformin reversed these effects. n=6 per
group; *P<0.05 and **P<0.01 vs. GDM group;
#P<0.05 and ###P<0.001 vs. control
group. M1, metformin at 300 mg/kg/day; M2, metformin at 600
mg/kg/day; GDM, gestational diabetes mellitus; H&E, hematoxylin
and eosin; PAS, periodic acid-Schiff. |
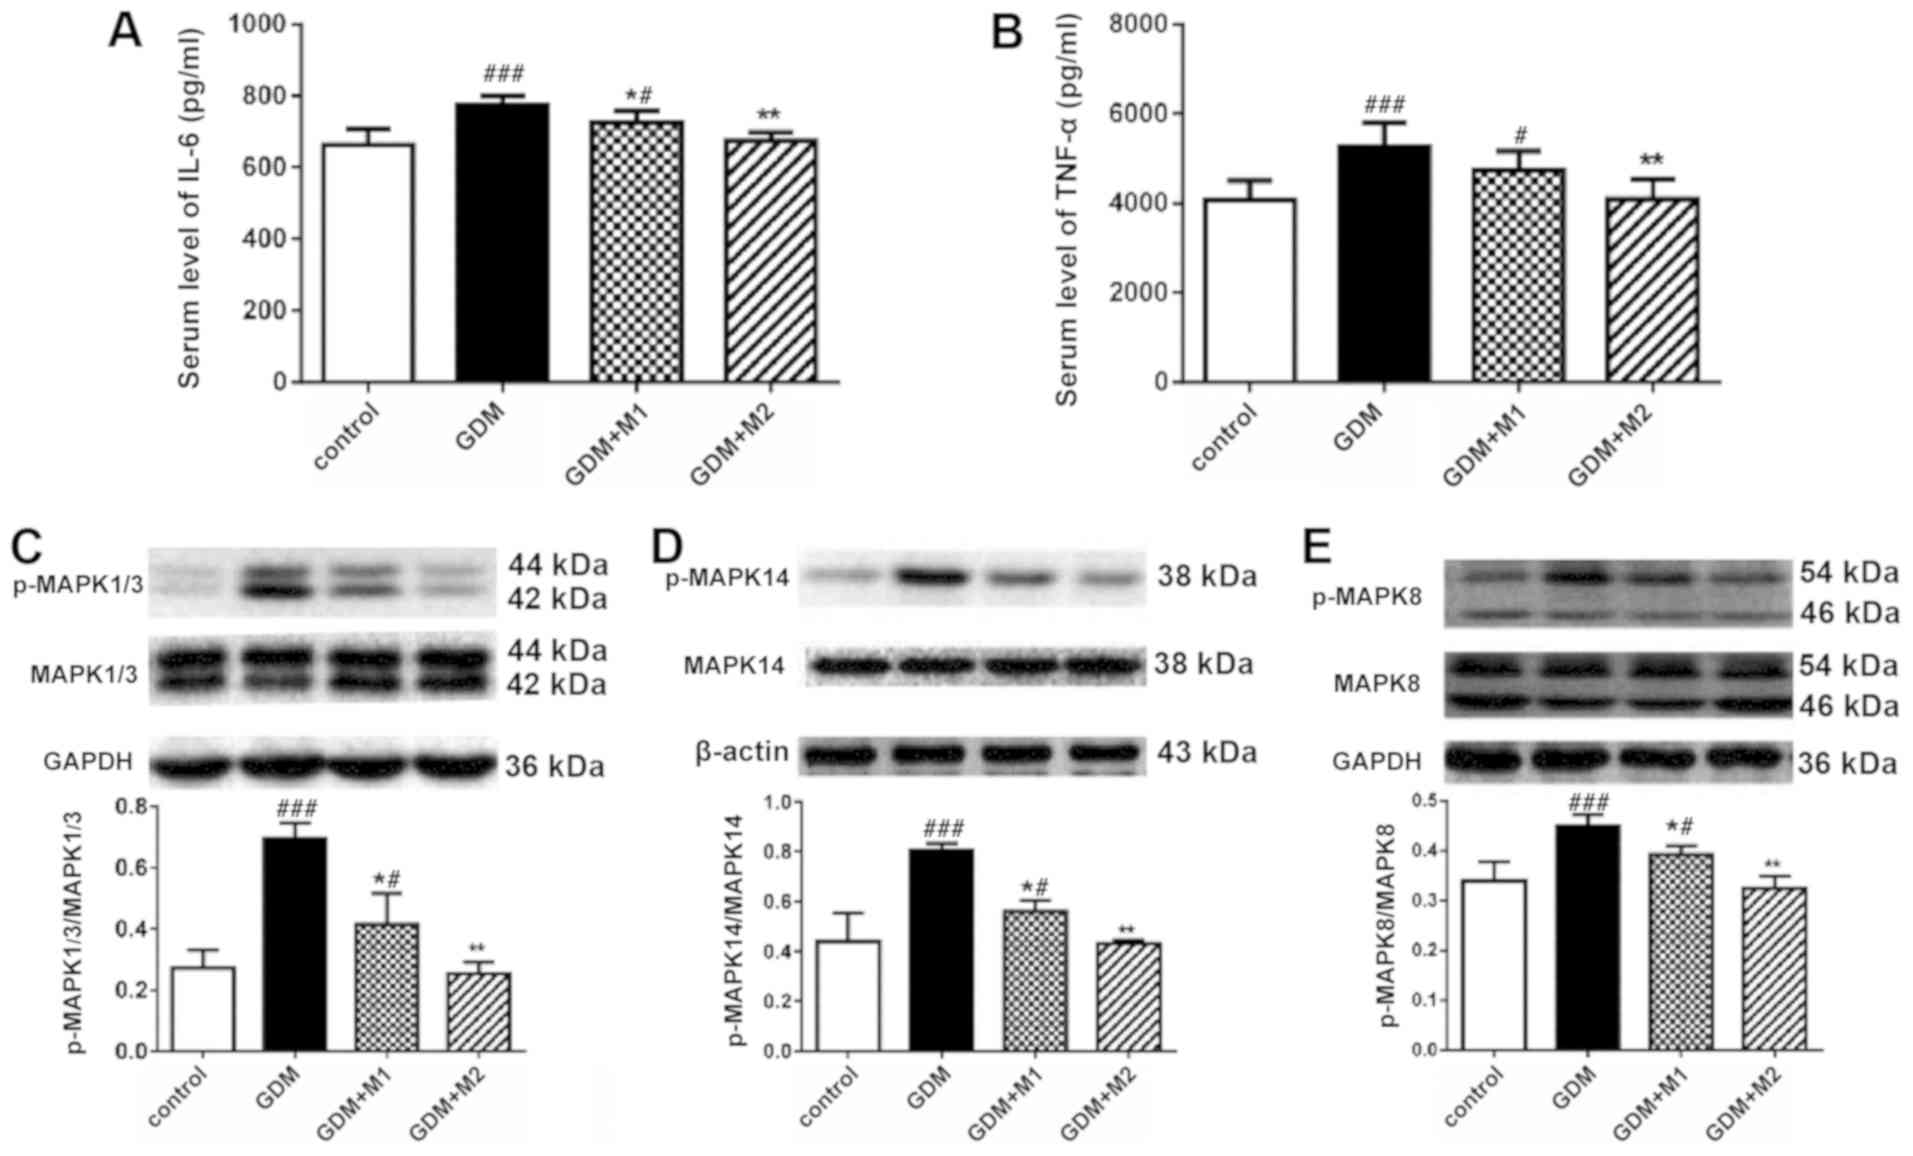
Inflammation and the MAPK pathway are
associated with the protective effect of metformin on renal
dysfunction in GDM during pregnancy
The concentrations of IL-6 and TNF-α in the serum of
pregnant mice at E18.5 were determined by ELISA. Serum levels of
IL-6 (Fig. 3A) and TNF-α (Fig. 3B) in the GDM group were
significantly increased compared with the control group, and
metformin at 600 mg/kg/day reversed these effects. The two
metformin doses significantly decreased the serum levels of IL-6
(Fig. 3A). However, treatment with
metformin at 300 mg/kg/day was not sufficient to significantly
decrease the levels of TNF-α; this effect may be due to the small
sample size (Fig. 3B).
The activity of the MAPK signaling pathway in renal
tissue at E18.5 was assessed by western blotting. No differences
were observed in the total protein levels of MAPK14, −1/3 and −8
among the four groups (data not shown). The phosphorylation levels
of MAPK1/3 (Fig. 3C), 14 (Fig. 3D), and 8 (Fig. 3E) were increased in the GDM group,
and both doses of metformin (300 and 600 mg/kg/day) significantly
reversed these effects. Metformin at a concentration of 600
mg/kg/day was sufficient to decrease the phosphorylation levels of
MAPKs in GDM mice to a similar level as the control.
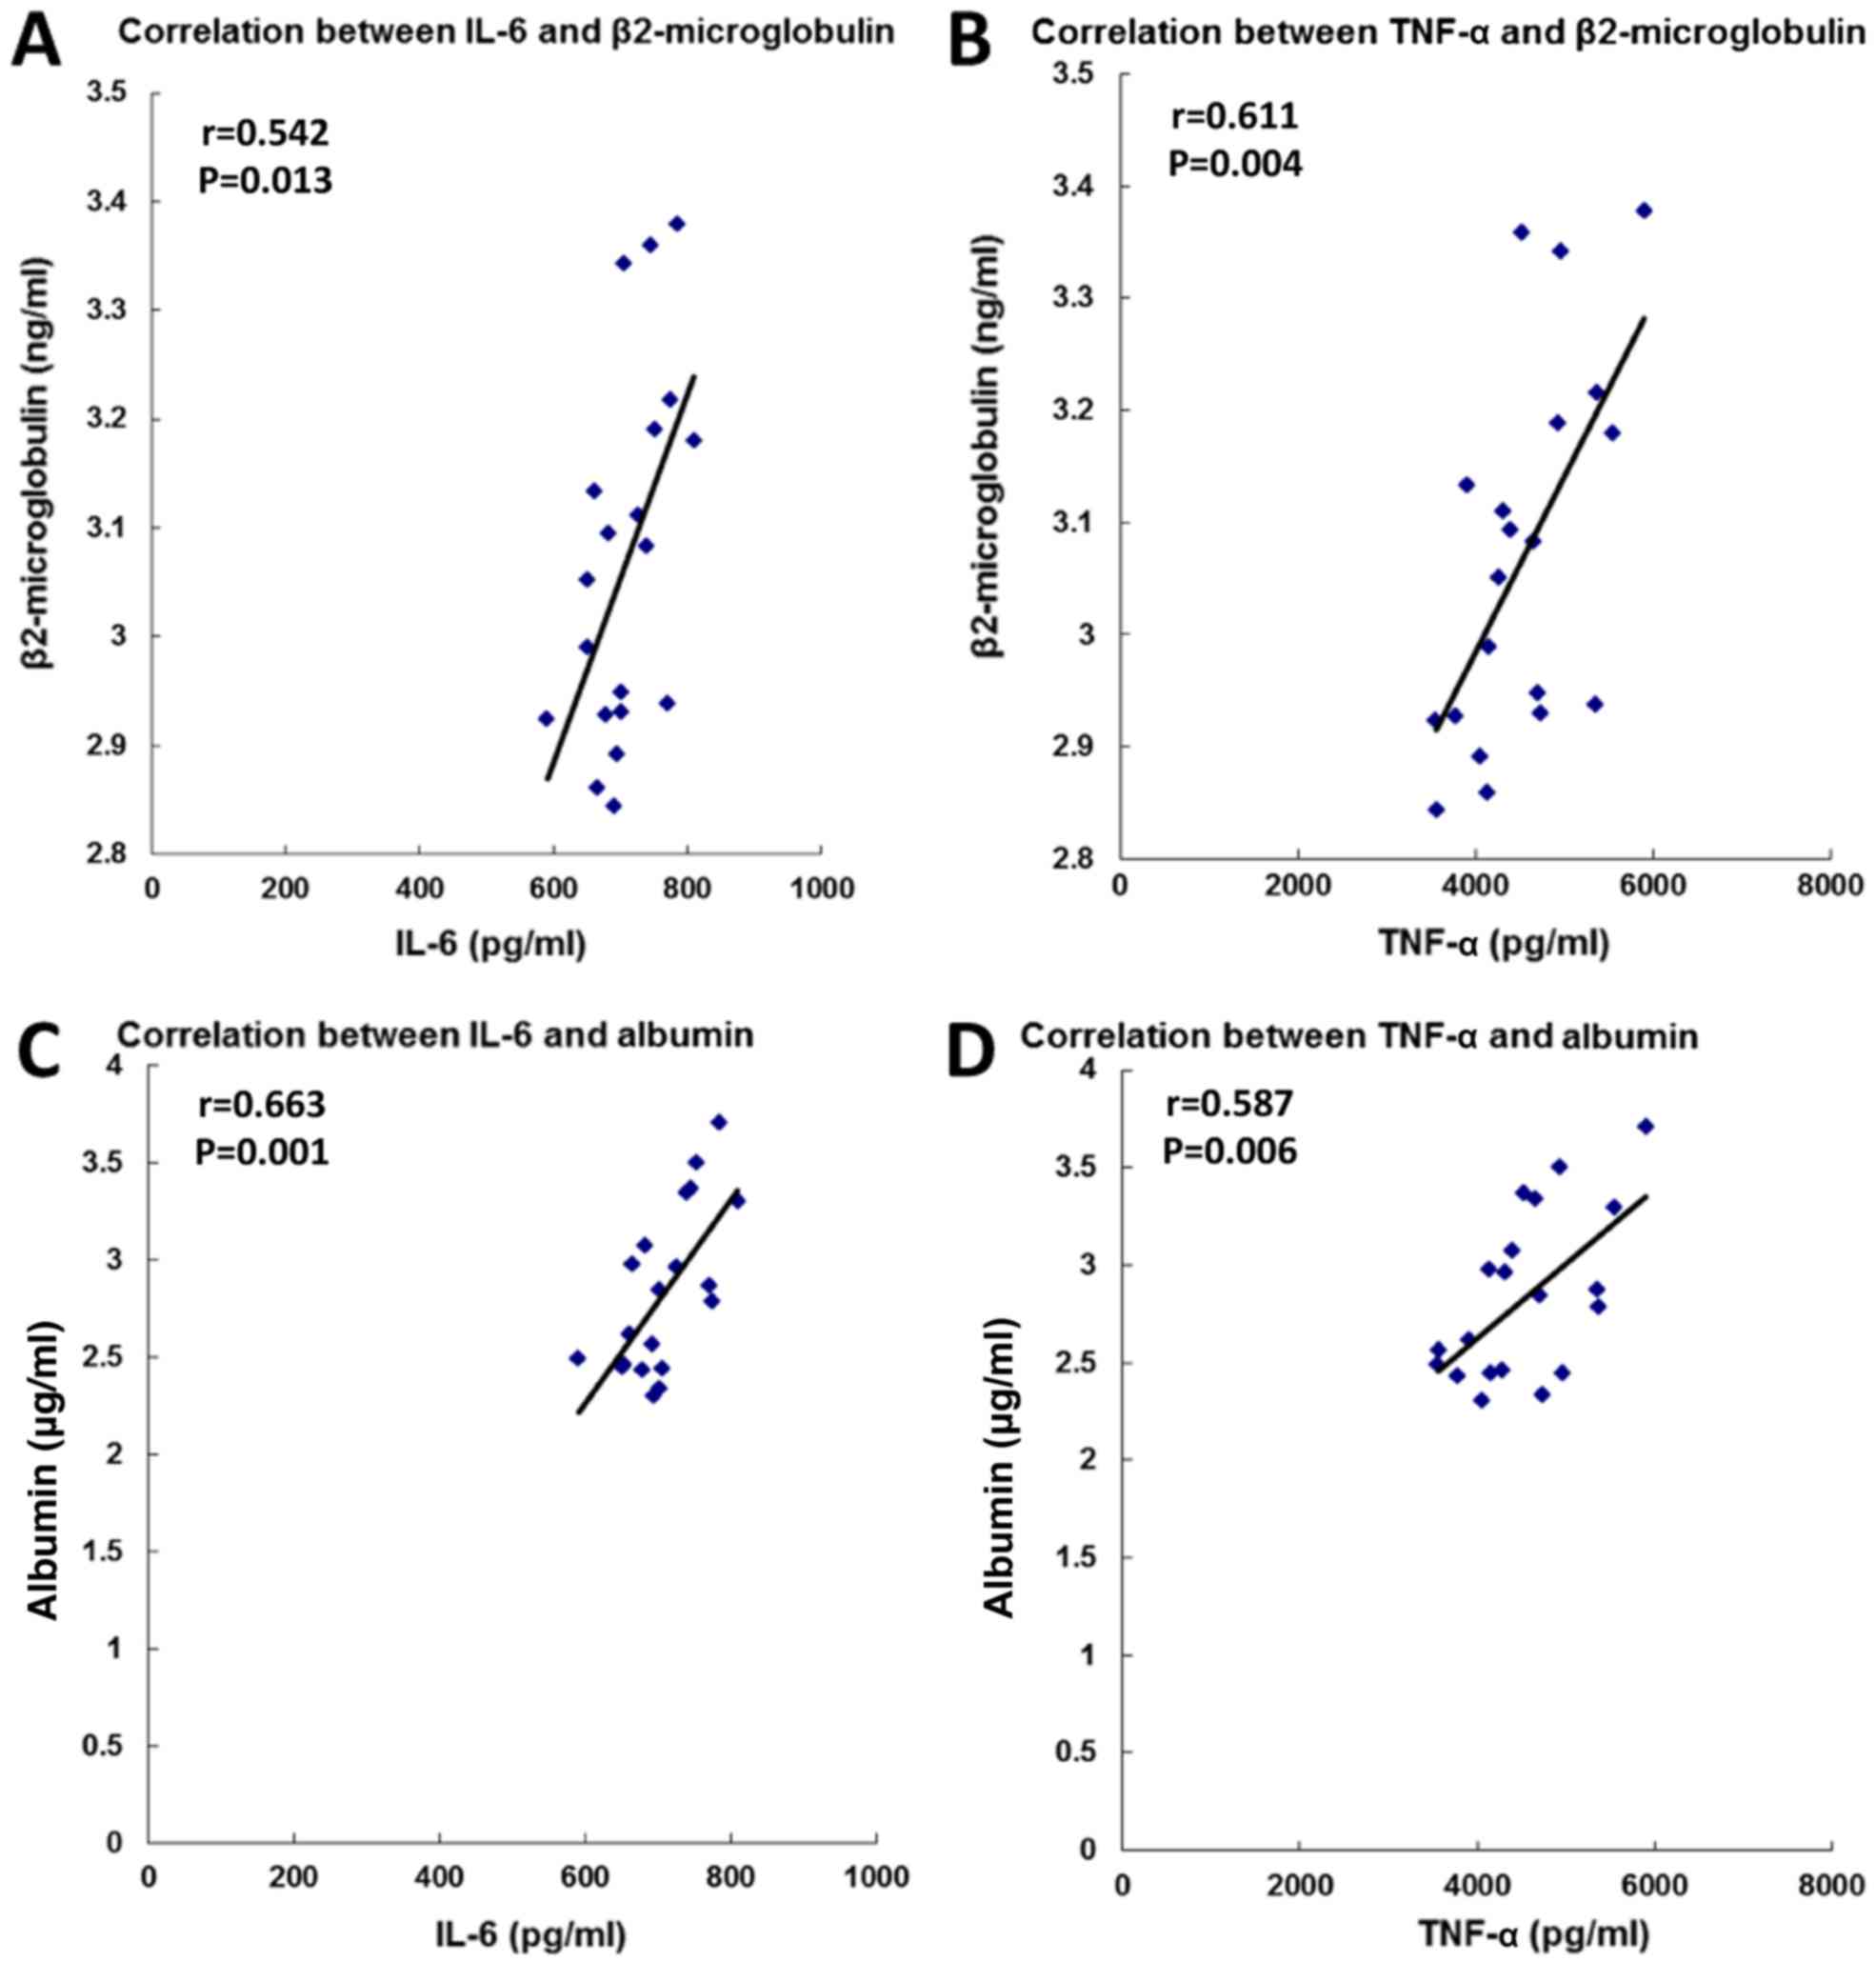
High levels of serum β2-microglobulin (18) and urine albumin (19) are symptoms of renal dysfunction.
Therefore, the association between the serum levels of cytokines
and the symptoms of renal dysfunction was assessed. The present
results suggested that the serum levels of IL-6 and TNF-a were
positively correlated with the levels of β2-microglobulin and
albumin (Fig. 4). The present
results indicated that the protective effect of metformin on renal
dysfunction in the GDM group may be associated with the MAPK
signaling pathway and the pro-inflammatory response.
Discussion
GDM, defined as diabetes diagnosed during pregnancy,
is associated with various adverse outcomes affecting the mother
and the newborn, including perinatal mortality, congenital
malformations, macrosomia, shoulder dystocia, birth injuries and
neonatal complications (2). The
majority of women who develop GDM are normoglycemic following
delivery (20); however, they are
more susceptible to developing cardiovascular diseases (21) and T2DM (5) postpartum. Although a number of
studies demonstrated the complications associated with GDM
(2–4), the effects of GDM on the function of
the kidneys during pregnancy and following delivery remain unclear.
The present findings suggested that treatment with metformin during
pregnancy exhibited a protective effect on renal dysfunction during
pregnancy. Inflammation may be associated with renal dysfunction in
GDM mice, and the MAPK signaling pathway may be involved in the
protective effect of metformin on renal dysfunction in GDM
mice.
A novel model of GDM was developed in the present
study. C57BL/6J female mice were fed a HFD and the control group
was fed a LFD between 1 week prior to mating and E18.5. The GDM
mouse model exhibited increased body weight, glucose intolerance
and insulin resistance; all symptoms observed in human GDM. The
majority of the GDM models are induced by treatment with
streptozotocin (STZ) (22) or by a
diet high in fat and glucose. The GDM model induced by STZ exhibits
irreversible necrosis of pancreatic β cells, a phenotype observed
in type 1 diabetes, and so it may not be a reliable model to study
T2DB (23). The GDM model induced
by a diet high in fat and glucose may result in diabetes mellitus
prior to pregnancy (24). The
increased glucose levels in these models may not decrease following
delivery (25), suggesting that
these models may not be suitable for investigating the impact of
GDM on kidney function. By contrast, the novel GDM model generated
in the present study is characterized by a controlled diet at early
pregnancy (E0.5). At E0.5, the body weight, blood glucose and
glucose tolerance, assessed by OGTT, exhibited no significant
differences between the GDM and control groups. The present model
may represent a suitable and reliable model for the study of GDM in
middle- to old-aged animals and in the investigation of the impact
of GDM on the offspring. To the best of the authors' knowledge, the
present study is the first one using this model of GDM.
Antidiabetic drugs are frequently used when altering the diet and
increasing exercise fails to decrease the levels of blood glucose
in women with GDM. The short-term safety of these compounds in the
mother and in the fetus were confirmed in various previous studies
(14–16). Metformin is able to cross the
placental barrier and may potentially pose a threat to the fetus;
however, metformin in a gestational diabetes trial (26) demonstrated that there were no
adverse outcomes in a 2-year follow-up study of infants whose
mother was administered metformin to treat GDM. The American
College of Obstetrics and Gynecology (27) in 2013 and the International
Federation of Gynecology and Obstetrics (28) in 2015 recommended metformin as the
first-line anti-diabetic agent in women with GDM. Furthermore,
metformin may have a potential protective effect on insulin
resistance in the newborn (26).
An additional advantage of metformin in the treatment of GDM is the
low risk of inducing hypoglycemia and weight loss, whereas insulin,
an alternative treatment for GDM, promotes weight gain, which may
be a risk factor for the development of T2DM (20). In the present study, the two doses
of metformin tested (300 and 600 mg/kg/day) reversed the increased
weight gain, and impaired glucose tolerance and insulin resistance
in GDM mice, in a dose-dependent manner.
A number of previous studies demonstrated that GDM
may exhibit adverse effects on renal function. Friedman et
al (13) observed a higher
risk of microalbuminuria in women with a history of GDM. Bomback
et al (29) demonstrated
that GDM, without subsequent T2DM, is a risk factor for the
development of microalbuminuria. These previous studies suggested
that GDM may pose a risk for kidney function. In the present study,
renal dysfunction was examined in GDM mice at E18.5 by determining
the levels of urine albumin and serum β2-microglobulin, and H&E
and PAS staining were performed to investigate the morphology of
kidney tissues. Urine albumin, a marker of impaired glomerular
filtration rate, is considered a marker of early DN (30). The American Diabetes Association
has recommended annual testing for the levels of urine albumin in
patients with T2DM to identify chronic renal disease (31). Additionally, serum β2-microglobulin
is considered a marker of renal dysfunction (32). The present study identified that
the levels of urine albumin and serum β2-microglobulin were
significantly increased in the GDM group during pregnancy,
indicating that high levels of urine albumin and serum
β2-microglobulin may be reliable markers for early renal
dysfunction. An increase in glomerular size, glomerular basement
membrane thickening and mesangial matrix expansion was detected in
the GDM group, as assessed by H&E and PAS staining. The present
results suggested that treatment with metformin during pregnancy
exhibited a protective effect on renal function during
pregnancy.
DN, a severe complication of T2DM, is associated
with MAPKs (10) and
pro-inflammatory signaling pathways (11); however, a limited number of
previous studies investigated the mechanism underlying GDM-induced
renal dysfunction. A previous study demonstrated that GDM is
characterized by a state of chronic, low-grade inflammation, which
is induced by various metabolites and nutrients, and is associated
with increased insulin resistance (33). IL-6 is an important
pro-inflammatory cytokine associated with impaired glucose
tolerance (34). Additionally,
TNF-α was identified in a previous study to be associated with
inflammation and insulin resistance in GDM (35). In the present study, the
association between the protective effect of metformin on renal
dysfunction in GDM mice and these inflammatory cytokines was
investigated. The MAPK signaling pathway consists of MAPK1/3, −14
and −8, and it is essential for the regulation of inflammation
(36). Since GDM may be a
predictor of T2DM (5), and MAPKs
serve important roles in the development of DN by regulating
inflammatory cytokines (10), the
involvement of the MAPK pathway in the protective effects of
metformin on renal dysfunction in GDM mice was examined in the
present study. Serum levels of IL-6 and TNF-α in the GDM group were
increased at E18.5, suggesting that these cytokines may be
associated with renal dysfunction. Furthermore, in the present
study, the phosphorylation levels of MAPK1/3, −14 and −8 were
identified to be increased in the GDM group at E18.5, and metformin
was able to decrease the protein expression level of phosphorylated
MAPKs in a dose-dependent manner.
A previous study demonstrated that high glucose
treatment of monocytic cells caused the upregulation of 41 genes
and the downregulation of 15 genes, including chemokines,
cytokines, chemokines receptors, adhesion molecules and integrins
(37). In addition, compared with
the normal glucose group (<5.5 mmol/l), HUVECs treated with 50
mmol/l glucose exhibited an increase in the protein expression
levels of TNF-α and IL-6 (38). In
line with these in vitro data, an impaired balance between
circulating pro- and anti-inflammatory cytokines was observed in
patients with gestational diabetes (39). Collectively, the present results
and those of previous studies suggested that the MAPK pathway may
be involved in the protective effect of metformin on renal
dysfunction in GDM mice. Metformin is able to decrease
microglia-mediated inflammation via the nuclear factor (NF)-κB and
MAPK signaling pathways to improve neurobehavioral function
following traumatic brain injury (40). In cancer, metformin was identified
to affect various signaling pathways, including adenosine
monophosphate-activated protein kinase, mammalian target of
rapamycin, insulin-like growth factor, MAPK, human epidermal growth
factor receptor-2, and NF-κB pathways (41). Previous studies demonstrated that
metformin mediated the activation of an insulin-dependent pathway
via the upregulation of protein kinase B serine/threonine kinase 1
in the treatment of T2DM in human endometrial cells (42,43).
The present study presented various limitations.
Although the symptoms of GDM in the generated model are similar to
those in human patients with GDM, and certain parameters associated
with early renal dysfunction were detected in the experimental
group, renal dysfunction may occur only in a subset of GDM mice.
Polymerase chain reaction and in situ immunostaining
analyses were not performed in the present study and may represent
useful methods to validate the GDM model. Furthermore, the systemic
effects of GDM may involve multiple pathways and molecular
mechanisms, and the present study focused on the effects of GDM on
kidney function and the MAPK signaling pathway. Further studies are
required to validate the GDM model, and additional studies may
identify multiple mechanisms and signaling pathways associated with
the novel mouse model. Furthermore, although GDM was induced in
C57BL/6 mice, the translational potential of these findings remains
to be confirmed.
In conclusion, the present study suggested that
GDM-induced renal dysfunction during late pregnancy was reversed by
treatment with metformin. The effect of metformin was
dose-dependent, and 600 mg/kg/day administered between E11.5 and
E17.5 may be the optimal dose to treat GDM mice. In addition, the
inflammatory cytokines IL-6 and TNF-α were identified to be
associated with renal dysfunction in GDM mice, and the MAPK
signaling pathway may be involved in the protective effect of
metformin on renal dysfunction in GDM mice.
Acknowledgements
Not applicable.
Funding
The present study was funded by The Overseas
Expertise Introduction Project for Discipline Innovation [111
Project; grant no. (2017) 175].
Availability of data and materials
The datasets used and/or analyzed during the current
study are available from the corresponding author on reasonable
request.
Authors' contributions
ZL performed the experiments and wrote the
manuscript. CT and XY supervised the present study. XY developed
the novel mouse model of gestational diabetes mellitus. CT, XY and
HQ developed the protocols and designed the study. All authors
reviewed the results and approved the final version of the
manuscript.
Ethics approval and consent to
participate
All procedures performed in studies involving
animals were in accordance with the ethical standards of The
Chongqing Medical University Animal Policy and Welfare Committee.
Ethical approval was obtained from The Ethics Committee of The
First Affiliated Hospital of Chongqing Medical University prior to
the commencement of the present study (approval no.
2017-030-2).
Patient consent for publication
Not applicable.
Competing interests
The authors declare that they have no competing
interests.
Glossary
Abbreviations
Abbreviations:
|
GDM
|
gestational diabetes mellitus
|
|
T2DM
|
type 2 diabetes mellitus
|
|
DN
|
diabetic nephropathy
|
|
TNF-α
|
tumor necrosis factor-α
|
|
IL-6
|
interleukin-6
|
|
MAPK
|
mitogen-activated protein kinase
|
|
p-MAPK
|
phosphorylated-MAPK
|
|
ECL
|
enhanced chemiluminescence
|
|
OGTT
|
oral glucose tolerance test
|
|
HFD
|
high-fat diet
|
|
LFD
|
low-fat diet
|
|
STZ
|
streptozotocin
|
References
|
1
|
Weinert LS: International association of
diabetes and pregnancy study groups recommendations on the
diagnosis and classification of hyperglycemia in pregnancy: Comment
to the International Association of Diabetes and Pregnancy Study
Groups Consensus Panel. Diabetes Care. 33:676–682. 2010. View Article : Google Scholar : PubMed/NCBI
|
|
2
|
Mitanchez D: Foetal and neonatal
complications in gestational diabetes: Perinatal mortality,
congenital malformations, macrosomia, shoulder dystocia, birth
injuries, neonatal complications. Diabetes Metab. 36:617–627. 2010.
View Article : Google Scholar : PubMed/NCBI
|
|
3
|
Mitanchez D, Burguet A and Simeoni U:
Infants born to mothers with gestational diabetes mellitus: Mild
neonatal effects, a long-term threat to global health. J Pediatr.
164:445–450. 2014. View Article : Google Scholar : PubMed/NCBI
|
|
4
|
Wright CS, Rifas-Shiman SL, Rich-Edwards
JW, Taveras EM, Gillman MW and Oken E: Intrauterine exposure to
gestational diabetes, child adiposity, and blood pressure. Am J
Hypertens. 22:215–220. 2009. View Article : Google Scholar : PubMed/NCBI
|
|
5
|
Bellamy L, Casas JP, Hingorani AD and
Williams D: Type 2 diabetes mellitus after gestational diabetes: A
systematic review and meta-analysis. Lancet. 373:1773–1779. 2009.
View Article : Google Scholar : PubMed/NCBI
|
|
6
|
Retnakaran R, Qi Y, Sermer M, Connelly PW,
Hanley AJ and Zinman B: Beta-cell function declines within the
first year postpartum in women with recent glucose intolerance in
pregnancy. Diabetes Care. 33:1798–1804. 2010. View Article : Google Scholar : PubMed/NCBI
|
|
7
|
Kramer CK, Swaminathan B, Hanley AJ,
Connelly PW, Sermer M, Zinman B and Retnakaran R: Each degree of
glucose intolerance in pregnancy predicts distinct trajectories of
beta-cell function, insulin sensitivity, and glycemia in the first
3 years postpartum. Diabetes Care. 37:3262–3269. 2014. View Article : Google Scholar : PubMed/NCBI
|
|
8
|
Buchanan TA and Xiang AH: Gestational
diabetes mellitus. J Clin Invest. 115:485–491. 2005. View Article : Google Scholar : PubMed/NCBI
|
|
9
|
Bergrem H and Leivestad T: Diabetic
nephropathy and end-stage renal failure: The Norwegian story. Adv
Ren Replace Ther. 8:4–12. 2001. View Article : Google Scholar : PubMed/NCBI
|
|
10
|
Wong CK, Ho AW, Tong PC, Yeung CY, Kong
AP, Lun SW, Chan JC and Lam CW: Aberrant activation profile of
cytokines and mitogen-activated protein kinases in type 2 diabetic
patients with nephropathy. Clin Exp Immunol. 149:123–131. 2007.
View Article : Google Scholar : PubMed/NCBI
|
|
11
|
Tuttle KR: Linking metabolism and
immunology: Diabetic nephropathy is an inflammatory disease. J Am
Soc Nephrol. 16:1537–1538. 2005. View Article : Google Scholar : PubMed/NCBI
|
|
12
|
Beharier O, Shoham-Vardi I, Pariente G,
Sergienko R, Kessous R, Baumfeld Y, Szaingurten-Solodkin I and
Sheiner E: Gestational diabetes mellitus is a significant risk
factor for long-term maternal renal disease. J Clin Endocrinol
Metab. 100:1412–1416. 2015. View Article : Google Scholar : PubMed/NCBI
|
|
13
|
Friedman S, Rabinerson D, Bar J, Erman A,
Hod M, Kaplan B, Boner G and Ovadia J: Microalbuminuria following
gestational diabetes. Acta Obstet Gynecol Scand. 74:356–360. 1995.
View Article : Google Scholar : PubMed/NCBI
|
|
14
|
Ainuddin J, Karim N, Hasan AA and Naqvi
SA: Metformin versus insulin treatment in gestational diabetes in
pregnancy in a developing country: A randomized control trial.
Diabetes Res Clin Pract. 107:290–299. 2015. View Article : Google Scholar : PubMed/NCBI
|
|
15
|
Barrett HL, Gatford KL, Houda CM, De
Blasio MJ, McIntyre HD, Callaway LK, Dekker Nitert M, Coat S, Owens
JA, Hague WM and Rowan JA: Maternal and neonatal circulating
markers of metabolic and cardiovascular risk in the metformin in
gestational diabetes (MiG) trial: Responses to maternal metformin
versus insulin treatment. Diabetes Care. 36:529–536. 2013.
View Article : Google Scholar : PubMed/NCBI
|
|
16
|
Rowan JA, Hague WM, Gao W, Battin MR and
Moore MP; MiG Trial Investigators, : Metformin versus insulin for
the treatment of gestational diabetes. N Engl J Med. 358:2003–2015.
2008. View Article : Google Scholar : PubMed/NCBI
|
|
17
|
Matthews DR, Hosker JP, Rudenski AS,
Naylor BA, Treacher DF and Turner RC: Homeostasis model assessment:
Insulin resistance and beta-cell function from fasting plasma
glucose and insulin concentrations in man. Diabetologia.
28:412–419. 1985. View Article : Google Scholar : PubMed/NCBI
|
|
18
|
Lapsley M, Flynn FV and Sansom PA: Beta
2-glycoprotein-1 (apolipoprotein H) excretion and renal tubular
malfunction in diabetic patients without clinical proteinuria. J
Clin Pathol. 46:4651993. View Article : Google Scholar : PubMed/NCBI
|
|
19
|
Berrut G, Bouhanick B, Fabbri P,
Guilloteau G, Bled F, Le Jeune JJ, Fressinaud P and Marre M:
Microalbuminuria as a predictor of a drop in glomerular filtration
rate in subjects with non-insulin-dependent diabetes mellitus and
hypertension. Clin Nephrol. 48:92–97. 1997.PubMed/NCBI
|
|
20
|
Lobner K, Knopff A, Baumgarten A,
Mollenhauer U, Marienfeld S, Garrido-Franco M, Bonifacio E and
Ziegler AG: Predictors of postpartum diabetes in women with
gestational diabetes mellitus. Diabetes. 55:792–797. 2006.
View Article : Google Scholar : PubMed/NCBI
|
|
21
|
Kessous R, Shoham-Vardi I, Pariente G,
Sherf M and Sheiner E: An association between gestational diabetes
mellitus and long-term maternal cardiovascular morbidity. Heart.
99:1118–1121. 2013. View Article : Google Scholar : PubMed/NCBI
|
|
22
|
Jawerbaum A and White V: Animal models in
diabetes and pregnancy. Endocr Rev. 31:680–701. 2010. View Article : Google Scholar : PubMed/NCBI
|
|
23
|
Caluwaerts S, Holemans K, van Bree R,
Verhaeghe J and Van Assche FA: Is low-dose streptozotocin in rats
an adequate model for gestational diabetes mellitus? J Soc Gynecol
Investig. 10:216–221. 2003. View Article : Google Scholar : PubMed/NCBI
|
|
24
|
Holemans K, Caluwaerts S, Poston L and Van
Assche FA: Diet-induced obesity in the rat: A model for gestational
diabetes mellitus. Am J Obstet Gynecol. 190:858–865. 2004.
View Article : Google Scholar : PubMed/NCBI
|
|
25
|
Chengya L, Kristi DC and Prater MR:
High-saturated-fat diet induces gestational diabetes and placental
vasculopathy in C57BL/6 mice. Metabolism. 59:943–950. 2010.
View Article : Google Scholar : PubMed/NCBI
|
|
26
|
Rowan JA, Rush EC, Obolonkin V, Battin M,
Wouldes T and Hague WM: Metformin in gestational diabetes: the
offspring follow-up (MiG TOFU): Body composition at 2 years of age.
Diabetes Care. 34:2279–2284. 2011. View Article : Google Scholar : PubMed/NCBI
|
|
27
|
Committee on Practice
Bulletins-Obstetrics: Practice Bulletin No. 137: Gestational
diabetes mellitus. Obstet Gynecol. 122:406–416. 2013. View Article : Google Scholar : PubMed/NCBI
|
|
28
|
Hod M, Kapur A, Sacks DA, Hadar E, Agarwal
M, Di Renzo GC, Cabero Roura L, McIntyre HD, Morris JL and Divakar
H: The International Federation of Gynecology and Obstetrics (FIGO)
Initiative on gestational diabetes mellitus: A pragmatic guide for
diagnosis, management, and care. Int J Gynaecol Obstet. 131 (Suppl
3):S173–S211. 2015. View Article : Google Scholar
|
|
29
|
Bomback AS, Rekhtman Y, Whaley-Connell AT,
Kshirsagar AV, Sowers JR, Chen SC, Li S, Chinnaiyan KM, Bakris GL
and McCullough PA: Gestational diabetes mellitus alone in the
absence of subsequent diabetes is associated with microalbuminuria:
Results from the Kidney Early Evaluation Program (KEEP). Diabetes
Care. 33:2586–2591. 2010. View Article : Google Scholar : PubMed/NCBI
|
|
30
|
Moriya T, Matsubara M, Kishihara E,
Yoshida Y and Ouchi M: Type 2 diabetic patients with diabetic
retinopathy and concomitant microalbuminuria showed typical
diabetic glomerulosclerosis and progressive renal dysfunction. J
Diabetes Complications. 30:1111–1116. 2016. View Article : Google Scholar : PubMed/NCBI
|
|
31
|
American Diabetes Association: Standards
of medical care in diabetes-2012. Diabetes Care. 35 (Suppl
1):S11–S63. 2012. View Article : Google Scholar : PubMed/NCBI
|
|
32
|
Stanga Z, Nock S, Medina-Escobar P,
Nydegger UE, Risch M and Risch L: Factors other than the glomerular
filtration rate that determine the serum beta-2-microglobulin
level. PLoS One. 8:e720732013. View Article : Google Scholar : PubMed/NCBI
|
|
33
|
Gregor MF and Hotamisligil GS:
Inflammatory mechanisms in obesity. Ann Rev Immunol. 29:415–445.
2011. View Article : Google Scholar
|
|
34
|
Muller S, Martin S, Koenig W,
Hanifi-Moghaddam P, Rathmann W, Haastert B, Giani G, Illig T,
Thorand B and Kolb H: Impaired glucose tolerance is associated with
increased serum concentrations of interleukin 6 and co-regulated
acute-phase proteins but not TNF-alpha or its receptors.
Diabetologia. 45:805–812. 2002. View Article : Google Scholar : PubMed/NCBI
|
|
35
|
Kirwan JP, Hauguel-De Mouzon S, Lepercq J,
Challier JC, Huston-Presley L, Friedman JE, Kalhan SC and Catalano
PM: TNF-alpha is a predictor of insulin resistance in human
pregnancy. Diabetes. 51:2207–2213. 2002. View Article : Google Scholar : PubMed/NCBI
|
|
36
|
Cargnello M and Roux PP: Activation and
function of the MAPKs and their substrates, the MAPK-activated
protein kinases. Microbiol Mol Biol Rev. 75:50–83. 2011. View Article : Google Scholar : PubMed/NCBI
|
|
37
|
Shanmugam N, Reddy MA, Guha M and
Natarajan R: High glucose-induced expression of proinflammatory
cytokine and chemokine genes in monocytic cells. Diabetes.
52:1256–1264. 2003. View Article : Google Scholar : PubMed/NCBI
|
|
38
|
Chen YY, Chen J, Hu JW, Yang ZL and Shen
YL: Enhancement of lipopolysaccharide-induced toll-like receptor 2
expression and inflammatory cytokine secretion in HUVECs under high
glucose conditions. Life Sci. 92:582–588. 2013. View Article : Google Scholar : PubMed/NCBI
|
|
39
|
Kuzmicki M, Telejko B, Zonenberg A,
Szamatowicz J, Kretowski A, Nikolajuk A, Laudanski P and Gorska M:
Circulating pro- and anti-inflammatory cytokines in Polish women
with gestational diabetes. Horm Metab Res. 40:556–560. 2008.
View Article : Google Scholar : PubMed/NCBI
|
|
40
|
Tao L, Li D, Liu H, Jiang F, Xu Y, Cao Y,
Gao R and Chen G: Neuroprotective effects of metformin on traumatic
brain injury in rats associated with NF-κB and MAPK signaling
pathway. Brain Res Bull. 140:154–161. 2018. View Article : Google Scholar : PubMed/NCBI
|
|
41
|
Lei Y, Yi Y, Liu Y, Liu X, Keller ET, Qian
CN, Zhang J and Lu Y: Metformin targets multiple signaling pathways
in cancer. Chin J Cancer. 36:172017. View Article : Google Scholar : PubMed/NCBI
|
|
42
|
Mackenzie RW and Elliott BT: Akt/PKB
activation and insulin signaling: A novel insulin signaling pathway
in the treatment of type 2 diabetes. Diabetes Metab Syndr Obes.
7:55–64. 2014. View Article : Google Scholar : PubMed/NCBI
|
|
43
|
Ferreira GD, Germeyer A, de Barros Machado
A, do Nascimento TL, Strowitzki T, Brum IS, von Eye Corleta H and
Capp E: Metformin modulates PI3K and GLUT4 expression and Akt/PKB
phosphorylation in human endometrial stromal cells after
stimulation with androgen and insulin. Eur J Obstet Gynecol Reprod
Biol. 175:157–162. 2014. View Article : Google Scholar : PubMed/NCBI
|