Introduction
Non-alcoholic fatty liver disease (NAFLD) is the
most common cause of chronic liver disease, with high rates of
morbidity and mortality worldwide (1). NAFLD is characterized by excessive
lipid accumulation in hepatocytes, and is considered as the origin
of cirrhosis (2). The pathogenesis
of NAFLD remains unclear and the ‘two hit theory’ was proposed for
the pathogenic mechanism. Briefly, lipid accumulation in the liver
associated with obesity and insulin resistance (IR) was reported as
the ‘first hit theory’ in patients with NAFLD. This results in
hepatic steatosis and can provides sufficient reaction conditions
for oxidative stress, increasing the susceptibility of hepatocytes
to endogenous and exogenous damage. The ‘second hit theory’
involves hepatic oxidative stress and lipid peroxidation, and the
secretion of inflammatory cytokines, which mediates the
pathological progression of steatosis to inflammation, fibrosis and
necrosis in liver cells (3,4).
Notably, 20–30% of adults suffer from NAFLD and it has been
suggested that it may become the leading cause of liver
transplantation within the next few decades (5). NAFLD is closely associated with the
growing epidemic of obesity and cardiovascular mortality, and
NAFLD-associated complications are a major cause of death (6,7). At
present, there is no effective drug for treating NAFLD in clinical
practice. Some antioxidants, insulin sensitizers and lipid-lowering
drugs have been applied in clinical trials for the treatment of
NAFLD/non-non-alcoholic steatosis (NASH) (8,9).
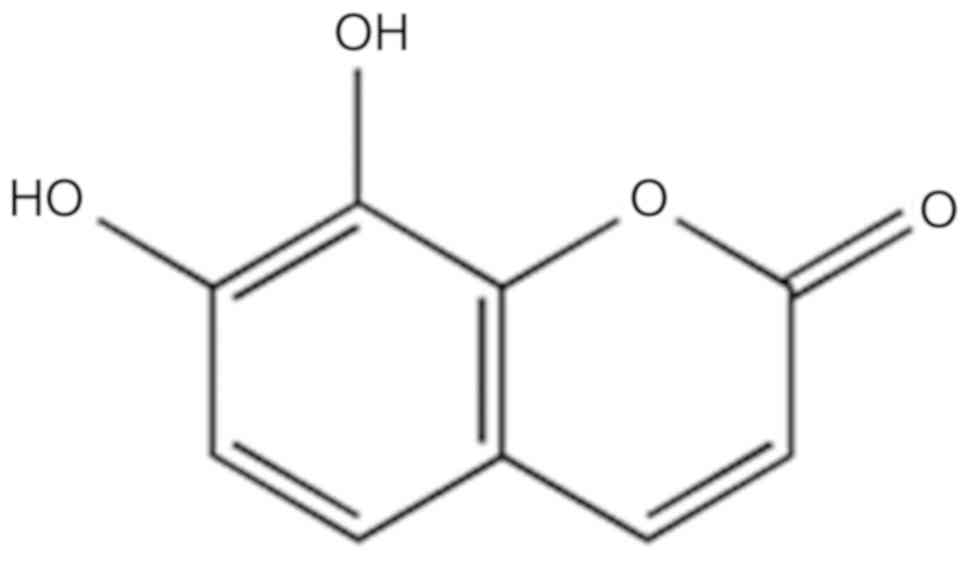
As an active ingredient of Daphne Koreana
Nakai (10), daphnetin (DAP;
Fig. 1) has notable antioxidative,
anti-inflammatory and anticoagulant activities (10–12).
Generally, coumarin compounds markedly lower blood glucose and
lipid levels, and protect the liver against oxidative stress and
inflammation. (13,14). Recently, Lv et al (12) reported that DAP could ameliorate
mitochondrial dysfunction and cell death by upregulating nuclear
factor-like 2 (Nrf2)-associated antioxidant signaling pathways and
reducing the expression of kelch-like epichlorohydrin related
protein-1, thus enhancing the expression of antioxidant reaction
elements and alleviating oxidative damage-associated toxicity
(12). Yu et al reported
that proinflammatory mediators induced by lipopolysaccharides or
β-amyloid, including interleukin-1 and tumor necrosis factor-α,
could be inhibited by DAP. DAP may also regulate a series of
intracellular signaling pathways, including IκB kinase,
mitogen-activated protein kinases (MAPKs) and phosphoinositide
3-kinase (PI3K)/protein kinase B (AKT) to reduce the microglial
activation and proinflammatory response (15). Therefore, we proposed that DAP may
possess lipid-reducing activities similar to other coumarin
compounds. At present, the effect of DAP on NAFLD has not been
reported. The present study aimed to investigate the effects of
simultaneous and non-simultaneous treatment, and the underlying
mechanism of DAP on NAFLD-related symptoms in oleic acid
(OA)-treated HepG2 cells.
Materials and methods
Materials
DAP (cat. no. R-0070161216, high-pressure liquid
chromatography-determined grade >98%, Chengdu Herbpurify, Co.,
Ltd.) and OA (cat. no. S104196, Aladdin) were employed in the
present study. In addition, rabbit anti-human polyclonal
antibodies, including peroxisome proliferator-activated receptor α
(PPARα; cat. no. WL00978), sterol regulatory element-binding
protein-1C (SREBP-1C; cat. no. WL01314), AKT (cat. no. WL0003b),
phosphorylated (p)AKT (cat. no. WLP001), PI3K (cat. no. WL02240),
Nrf2 (cat. no. WL02135), 5′AMP-activated protein kinase (AMPK; cat.
no. WL03366) antibodies were obtained from Wanlei Biotechnology.
Rabbit anti-human polyclonal antibodies, including anti-cytochrome
P450 4A11 (CYP4A; cat. no. ab140635), anti-patatin-like
phospholipase domain-containing protein 3 (PNPLA3; cat. no.
ab81874) and anti-p 5′AMP-activated protein kinase (pAMPK; cat. no.
ab23875) were purchased from Abcam. Additionally, rabbit anti-human
polyclonal antibody CYP 2E1 (cat. no. BA1774-2, Wuhan Boster
Biological Technology, Ltd.); mouse anti-human monoclonal β-actin
antibody (cat. no. sc-47778, Santa Cruz Biotechnology, Inc.);
Dulbecco Minimal Eagle's medium (DMEM; cat. no. 12800-017, Gibco;
Thermo Fisher Scientific, Inc.);
2-[N-(7-nitrobenz-2-oxa-1,3-diazol-4-yl) amino]-2-deoxyglucose
(2-NBDG; cat. no. 1922861, Invitrogen; Thermo Fisher Scientific,
Inc.); Reverse transcription kit (cat. no. FSQ-101, Toyobo Life
Science); SYBR Green I real-time PCR kit (172–5124, Bio-Rad
Laboratories, Inc.); BCA protein assay kit (cat. no. 23225, Thermo
Fisher Scientific, Inc.) were employed. Furthermore,
radioimmunoprecipitation assay (RIPA; cat no. P0013B), BeyoECL Plus
(cat. no. P0018), Reactive oxygen species (ROS) detection kit (cat.
no. S0033), PMSF (cat. no. ST506) were obtained from Beyotime
Institute of Biotechnology. Triglyceride (TG) detection kit (cat.
no. E1013, Applygen Technologies, Inc.);
3-(4,5-dimethylthiazol-2-yl)-2,5-diphenyltetrazolium bromide (MTT;
cat. no. M2128); dimethyl sulfoxide (DMSO; cat. no. D5879 were
purchased from Sigma-Aldrich (Merck KGaA). Protease cocktail (cat.
no. 04693132001) and phosphatase inhibitors (cat. no. 04906837001)
were obtained from Roche Diagnostics. The human hepatoblastoma cell
line HepG2 was acquired from the Culture Collection Center of Wuhan
University.
Cell culture and drug treatment
HepG2 cells were cultured in DMEM and logarithmic
phase cells were inoculated into 6-well plates (2×10⁵
cells/well) at the condition of 37°C and 5% CO2. After
the cells adhered, HepG2 cells were treated with OA (dissolved in
methanol) and DAP (dissolved in DMSO) simultaneously and
non-simultaneously. In the simultaneous treatment condition, cells
were co-treated with 0.5 mM OA and DAP (5, 20 or 50 µM) for 24 h at
37°C. The control group was treated with 0.3% methanol and 0.1%
DMSO for 24 h at 37°C; the OA group was treated with 0.5 mM OA and
0.1% DMSO for 24 h at 37°C. In the non-simultaneous treatment
condition, cells were pretreated with 0.5 mM OA for 24 h at 37°C,
and then treated with DAP (5, 20 or 50 µM) for 24 h at 37°C. The
control group was treated with 0.3% methanol for 24 h at 37°C and
then treated with 0.1% DMSO for 24 h at 37°C; the OA group was
treated with 0.5 mM OA for 24 h at 37°C and then treated with 0.1%
DMSO for 24 h at 37°C. Each group of cells was analyzed in
triplicate and the experiments were repeated three times.
Cell viability assay
When cells attained 85–90% confluence, cells were
seeded into a 96-well plate at a density of 5×10³
cells/well. After the cells are pretreated with OA for 24 h at 37°C
and then treated with 200 µl culture medium containing DAP (5, 20,
50 and 100 µM) for 24 h at 37°C (five replicate wells per group),
the supernatant was discarded, and the mixture of 20 µl MTT and 180
µl PBS were added into each well at 37°C for 4 h. Then, 150 µl DMSO
was added to each well to dissolve the purple formazan crystals,
and the absorbance of each well was detected at 570 nm using a
microplate reader. Each group of cells was analyzed in triplicate
and the experiments were repeated three times.
Measurement of triglyceride (TG)
levels
Following treatment, the cells were collected, lysed
using the lysis buffer in the TG detection kit at 37°C for 10 min
and were then centrifuged at 12,000 × g for 5 min at 4°C. The
contents of TG and protein in each well were measured with TG and
BCA detection kits according to the manufacturer's instructions,
respectively. The ratio of TG to protein was calculated to express
the relative TG level. Each group of cells was analyzed in
triplicate and the experiments were repeated three times.
Measurement of 2-NBDG levels
Following treatment, 1×10⁶ cells in each
well were cultured in glucose-free DMEM for 3 h at 37°C and then
with 50 µM 2-NBDG for 30 min at 37°C. The cells in each well were
collected, the fluorescence intensity was measured at
excitation/emission wavelengths of 485/535 nm, respectively. The
protein concentration was detected as aforementioned. The ratio of
fluorescence intensity to protein content of each well indicated
the relative glucose uptake rate. Each group of cells was analyzed
in triplicate and the experiments were repeated three times.
Measurement of ROS levels
Following treatment, 1×10⁶ cells in each
well were incubated with 10 µM dichlorodihydro-fluorescein
diacetate for 30 min at 37°C, and then collected. The fluorescence
value was measured at excitation/emission wavelengths of 485/535 nm
and the protein concentration of cells were detected as
aforementioned. The ratio of the fluorescence value to the protein
concentration indicated the relative ROS content in each well. Each
group of cells was analyzed in triplicate and the experiments were
repeated three times.
Reverse transcription-quantitative
polymerase chain reaction (RT-qPCR)
Following treatment, cells in each well were
collected and the total RNA was extracted with TRIzol reagent
(Invitrogen; Thermo Fisher Scientific, Inc.). The bands of 28S, 18S
and 5S were separated by 1% agarose gel electrophoresis for the
analysis of RNA integrity. The absorbance at 260 and 280 nm was
detected by spectrophotometry for the analysis of RNA purity. Then
2 µg of total RNA was reverse transcribed into 20 µl cDNA using a
reverse transcription kit at the following conditions: 37°C for 5
min, 95°C for 30 min. qPCR was performed using the SYBR Green I
real-time PCR kit for 39 cycles at the following conditions:
Pre-denaturation at 95°C for 5 min, denaturation at 95°C for 30
sec, annealing at 58.4°C for 30 sec and extension at 72°C for 30
sec. The primer sequences of SREBP-1C, PNPLA3, PPARα and β-actin
were presented in Table I. Each
group of cells was analyzed in triplicate and the experiments were
repeated three times. β-actin was used as a reference gene. The
relative quantification of mRNA expression levels was determined
using the 2−ΔΔCq method (16).
 | Table I.Primers for reverse
transcription-quantitative polymerase chain reaction. |
Table I.
Primers for reverse
transcription-quantitative polymerase chain reaction.
| Primer | Sequence
(5′-3′) |
|---|
| PNPLA3 | F:
CTGTACCCTGCCTGTGGAAT |
|
| R:
TCGAGTGAACACCTGTGAGG |
| SREBP-1C | F:
CGACATCGAAGACATGCTTCAG |
|
| R:
CGACATCGAAGACATGCTTCAG |
| PPARα | F:
GGGGACATTCCTGTGTTCCAG |
|
| R:
CAAGTAGAGTGCCAGGCAAG |
| β-actin | F:
TCACCCACACTGTGCCCATCT |
|
| R:
CAGCGGAACCGCTCATTGCC |
Western blotting
Following treatment, cells were lysed with RIPA
lysis buffer [containing 50 mM Tris (pH 7.4), 150 mM NaCl, 1%
Triton X-100, 1% sodium deoxycholate, 0.1% SDS, sodium
orthovanadate, sodium fluoride, EDTA and leupeptin], protease and
phosphatase inhibitors on ice for 40 min. The lysate was
centrifuged at 12,000 × g at 4°C for 10 min, and the protein
content in the supernatant was determined using a BCA kit. A total
of 20–70 µg of total protein was separated by SDS-PAGE (10%
separation gel; 5% concentration gel) and transferred onto
polyvinylidene difluoride membranes. The membranes were blocked
with 5% non-fat dry milk at 37°C for 2 h, and then incubated at 4°C
with the different primary antibodies (β-actin, 1:1,000; PNPLA3,
1:1,000; SREBP-1C, 1:500; PPARα, 1:500; PI3K, 1:500; pAKT, 1:500;
AKT, 1:500; CYP2E1, 1:500; CYP4A, 1:1,000; Nrf2, 1:500 and pAMPK,
1:1,000) overnight. After washing the membrane with 500 µl
Tween-20/1 l Tris-buffered saline (10 min for four times), the
membranes were incubated at room temperature with secondary
antibodies [horseradish-peroxidase (HRP)-goat-anti-mouse lgG
(1:8,000) and HRP-goat-anti-rabbit lgG (1:8,000)] for 1 h. The
immunoblots were examined using an enhanced chemiluminescence
system and ChemiDoc™ MP Imaging System (Bio-Rad
Laboratories, Inc.). Finally, ImageJ software (64-bit Java
1.8.0_112; National Institutes of Health) was used for the
quantitative gray scale analysis of the bands in the X-ray film.
Each group of cells was analyzed in triplicate and the experiments
were repeated three times.
Statistical analysis
Data were obtained from at least three experimental
repeats and presented as the mean ± standard deviation. The grouped
data were analyzed with SPSS 17.0 (SPSS, Inc., Chicago, IL, USA).
Statistical significance was analyzed by analysis of variance and a
Tukey's post hoc test for multiple comparisons. P<0.05
considered to indicate a statistically significant difference.
Results
Cytotoxicity of DAP on HepG2
cells
The results of the MTT assay (Fig. 2) revealed that DAP had no
significant effects on the viability of OA-pretreated HepG2 cells
in the range of 5–100 µM DAP.
Effects of DAP on lipid metabolism in
OA-treated HepG2 cells
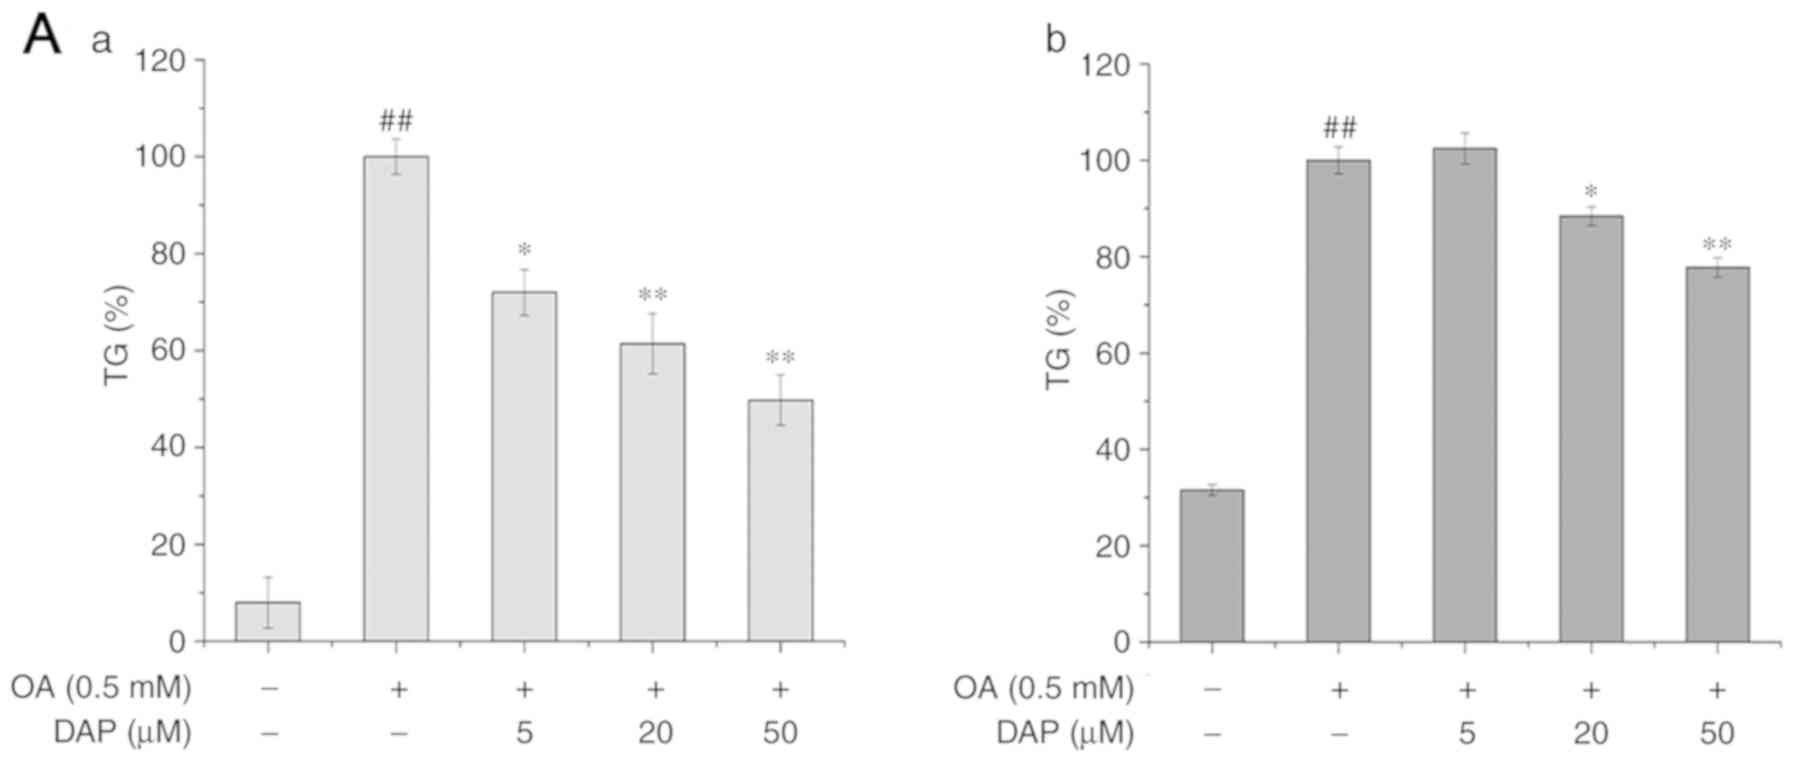
The effects of OA and DAP co-treatment on the lipid
metabolism of HepG2 cells were analyzed. Compared with the control
group, the content of TG, as well as the levels of the mRNA and
protein expression of SREBP-1C and PNPLA3 were significantly
increased (Fig. 3). In addition,
the mRNA and protein expression of PPARα along with the
phosphorylation of AMPK were significantly downregulated in the
OA-treated group compared with the control (Figs. 3 and 4) compared with the control under both
treatment conditions. Compared with the OA-treated group,
co-treatment with 20 or 50 µM DAP and OA significantly decreased
the content of TG and the expression of PNPLA3 under simultaneous
treatment conditions (Fig. 3A and
B). In addition, increased the mRNA and protein expression of
PPARα, and the phosphorylation of AMPK in a dose-dependent manner
simultaneous treatment conditions (Figs. 3 and 4). Additionally, the mRNA expression
levels of SREBP-1C were also downregulated in a dose-dependent
manner (Fig. 3A), while the
protein expression of SREBP-1C was significantly decreased
following treatment with 50 µM DAP, or 20 and 50 µM DAP in the
simultaneous and non-simultaneous treatment condition respectively
(Fig. 4A).
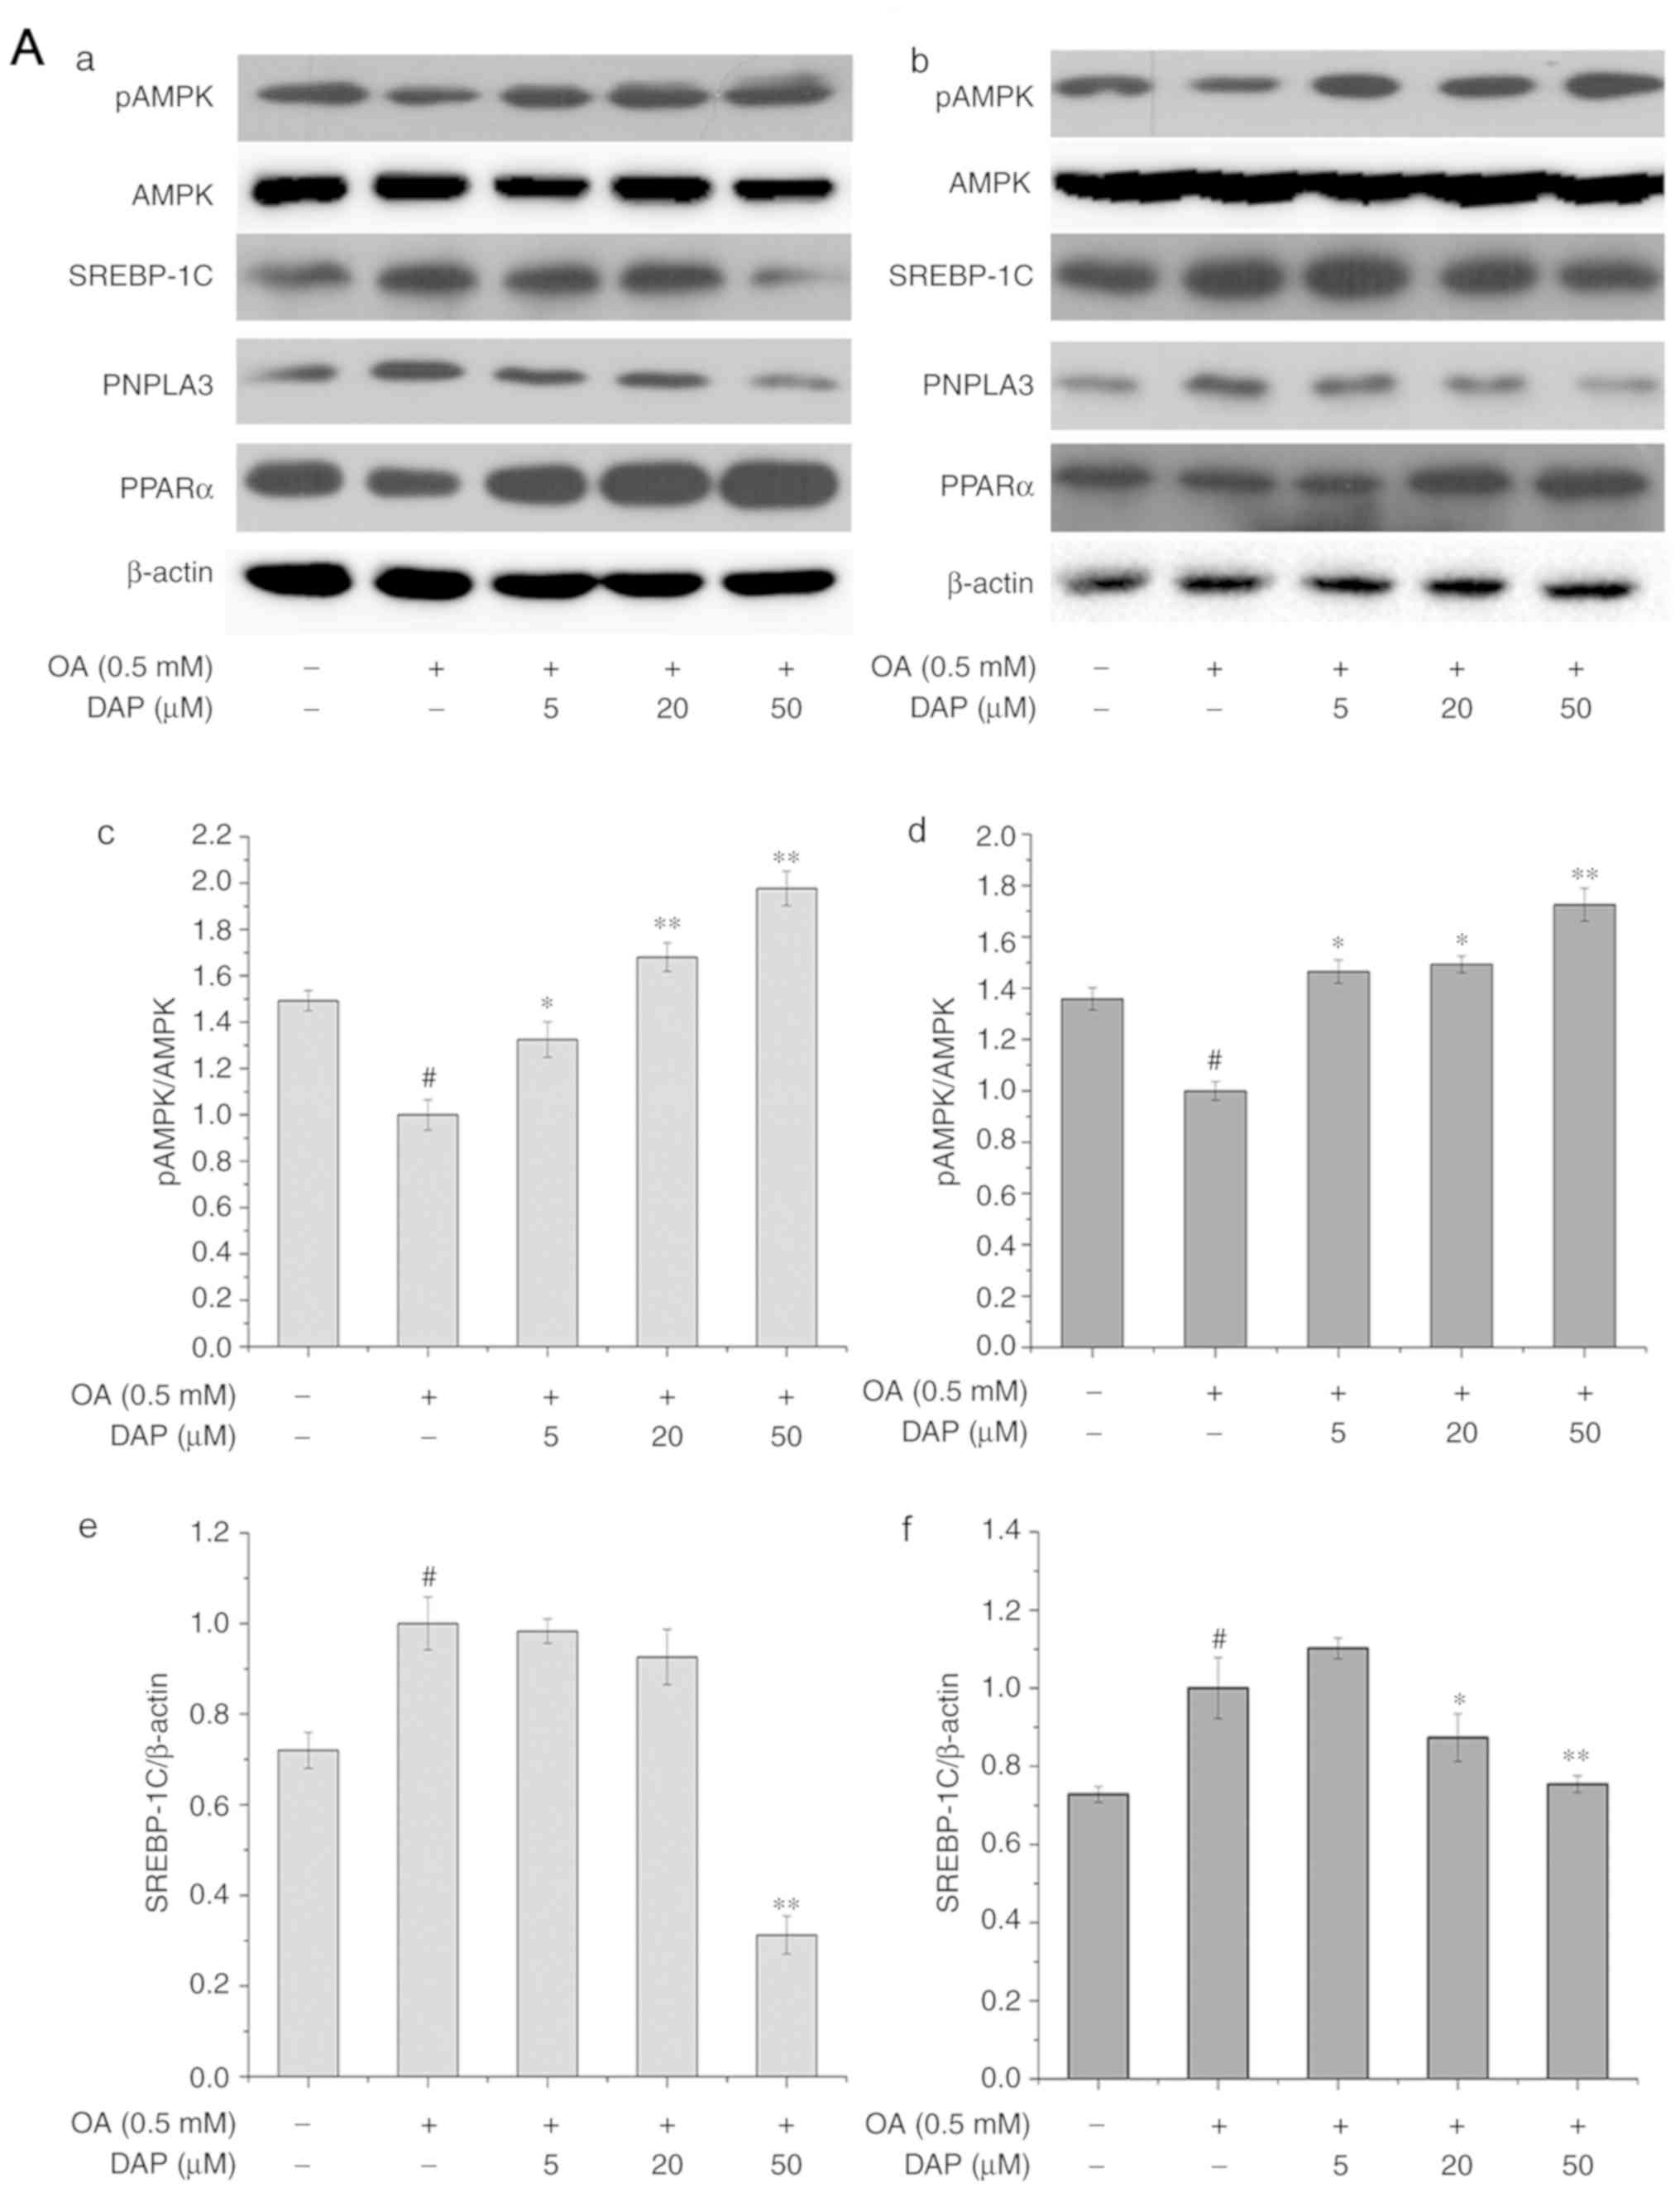 | Figure 4.Effect of increasing concentrations
of DAP for 24 h on the protein expression of pAMPK, PPARα, PNPLA3
and SREBP-1C in HepG2 cells. Western blot analysis following (A-a)
simultaneous and (A-b) non-simultaneous treatment with OA and DAP.
Densitometry analysis of (A-c and -d) pAMPK/AMPK, (A-e and -f)
SREBP-1c. The control group under simultaneous treatment conditions
was treated with 0.3% methanol and 0.1% DMSO for 24 h; the OA group
was treated with 0.5 mM OA and 0.1% DMSO for 24 h. The control
group under non-simultaneous treatment conditions was treated with
0.3% methanol for 24 h and then with 0.1% DMSO for 24 h; the OA
group was treated with 0.5 mM OA for 24 h and then with 0.1% DMSO
for 24 h. The bands of the western blots generated in our study
were obtained from the same protein samples, but were not all run
in the same experiment on the same gel. #P<0.05 vs.
control group; *P<0.05, **P<0.01 vs. OA group. Effect of
increasing concentrations of DAP for 24 h on the protein expression
of pAMPK, PPARα, PNPLA3 and SREBP-1C in HepG2 cells. Densitometry
analysis of (B-a and -b) PNPLA3 and (B-c and -d) PPARα. The control
group under simultaneous treatment conditions was treated with 0.3%
methanol and 0.1% DMSO for 24 h; the OA group was treated with 0.5
mM OA and 0.1% DMSO for 24 h. The control group under
non-simultaneous treatment conditions was treated with 0.3%
methanol for 24 h and then with 0.1% DMSO for 24 h; the OA group
was treated with 0.5 mM OA for 24 h and then with 0.1% DMSO for 24
h. The bands of the western blots generated in our study were
obtained from the same protein samples, but were not all run in the
same experiment on the same gel. #P<0.05 vs. control
group; *P<0.05, **P<0.01 vs. OA group. AMPK, 5′AMP-activated
protein kinase; DAP, daphnetin; DMSO, dimethyl sulfoxide; OA, oleic
acid; p, phosphorylated; PNPLA3, patatin-like phospholipase
domain-containing protein 3; PPARα, peroxisome
proliferator-activated receptor α; SREBP-1C, sterol regulatory
element-binding protein-1C. |
Furthermore, the effects on the lipid metabolism
under non-simultaneous treatment conditions revealed a notably
similar trend with that of the co-treatment conditions (Fig. 3). DAP markedly affected the mRNA
expression levels of PNPLA3 in the non-simultaneous treatment
(Figs. 3 and 4). The differing results under the two
treatment conditions may be associated with the culturing of cells
for >24 h prior to non-simultaneous treatment. In the extra 24
h, cells may undergo self-repair and division, in which the newly
formed cells were not incubated with OA.
Effects of DAP on IR in OA-treated
HepG2 cells
Compared with the OA-treated group, 50 µM DAP
significantly increased the glucose uptake ability, while the
protein expression levels of PI3K and pAKT/AKT in the case of the
co-treatment conditions (Fig. 5).
In addition, compared with the OA-treated group under
non-simultaneous treatment conditions, DAP promoted the glucose
uptake ability and the expression of pAKT/AKT in a dose-dependent
manner; that of PI3K increased following treatment with 20 and 50
µM DAP (Fig. 5).
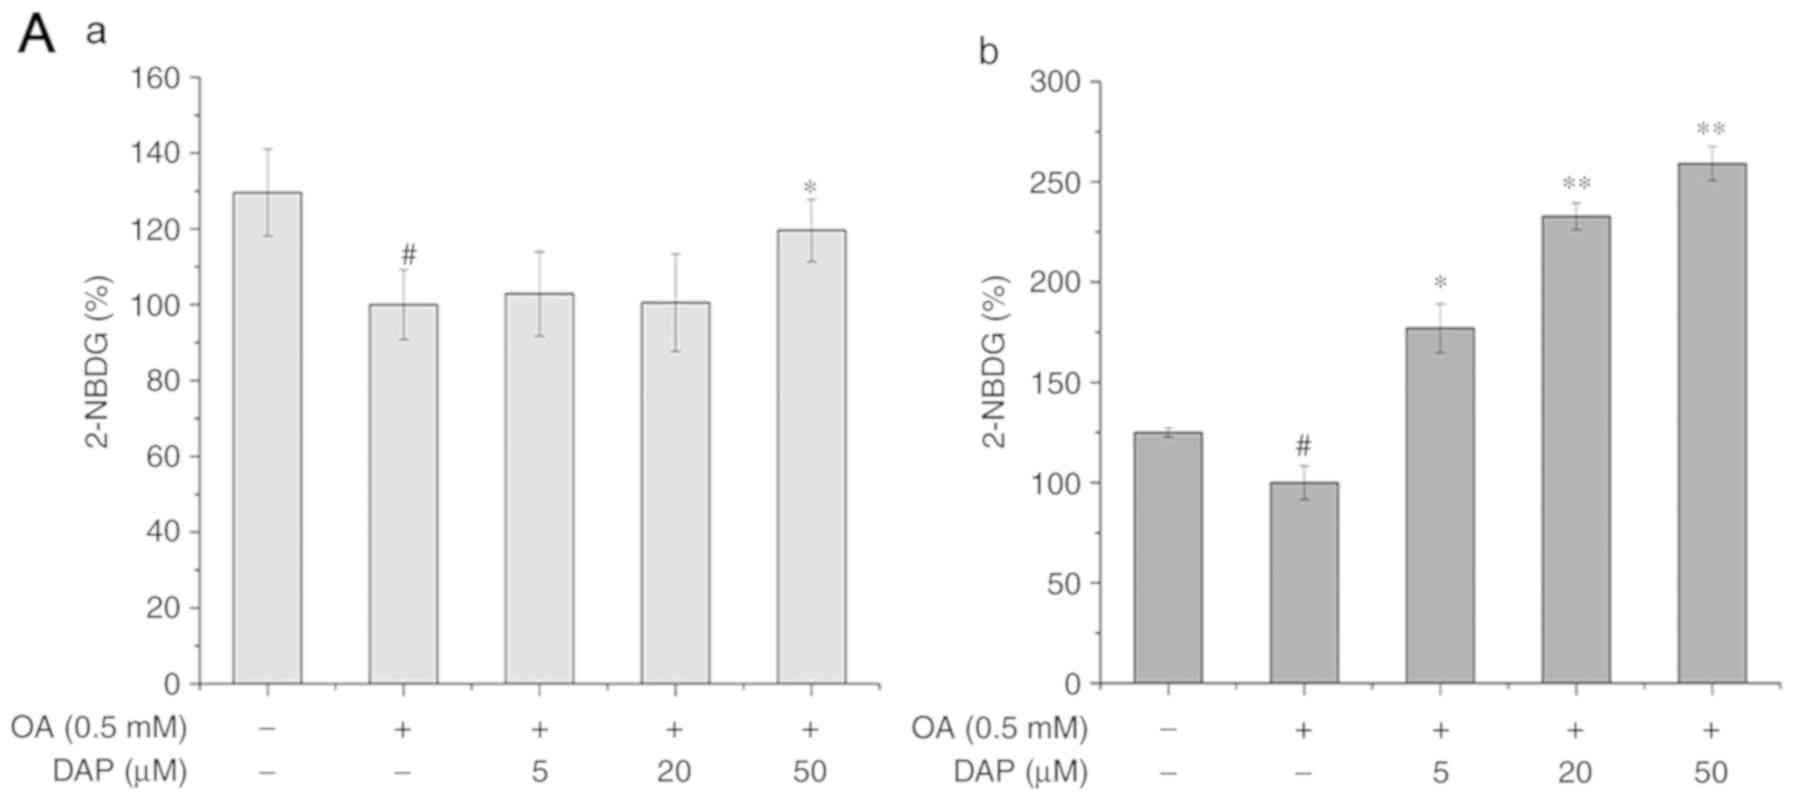 | Figure 5.Effects of increasing DAP
concentrations for 24 h on the cellular 2-NBDG, and the protein
levels of PI3K and pAKT. (A-a) Glucose release following OA
simultaneous treatment and (A-b) non-simultaneous treatment of
HepG2 cells with OA and DAP. Protein expression of PI3K, AKT and
pAKT following (B-a) simultaneous and (B-b) non-simultaneous
treatment with OA and DAP. The control group in the simultaneous
treatment condition was treated with 0.3% methanol and 0.1% DMSO
for 24 h; the OA group was treated with 0.5 mM OA and 0.1% DMSO for
24 h. The control group in the non-simultaneous treatment condition
was treated with 0.3% methanol for 24 h and then with 0.1% DMSO for
24 h; the OA group was treated with 0.5 mM OA for 24 h and then
with 0.1% DMSO for 24 h. The bands of the western blots generated
in our study were obtained from the same protein samples, but were
not all run in the same experiment on the same gel.
#P<0.05, ##P<0.01 vs. control group;
*P<0.05, **P<0.01 vs. OA group. AKT, protein kinase B; p,
phosphorylated; PI3K, phosphoinositide 3-kinase; DAP, daphnetin;
DMSO, dimethyl sulfoxide; OA, oleic acid. |
Effects of DAP on oxidative stress in
OA-treated HepG2 cells
Under the simultaneous and non-simultaneous
treatment conditions, the content of ROS and the protein expression
of CYP2E1 and CYP4A in OA-treated group were significantly
increased than in the control group, while the protein expression
of Nrf2 in OA-treated group were significantly reduced than in the
control group (Fig. 6A). Following
DAP treatment for 24 h under both treatment conditions, the content
of ROS, and the protein expression of CYP2E1 and CYP4A decreased,
while Nrf2 expression was significantly increased compared with the
OA-treated group (Fig. 6A and
B).
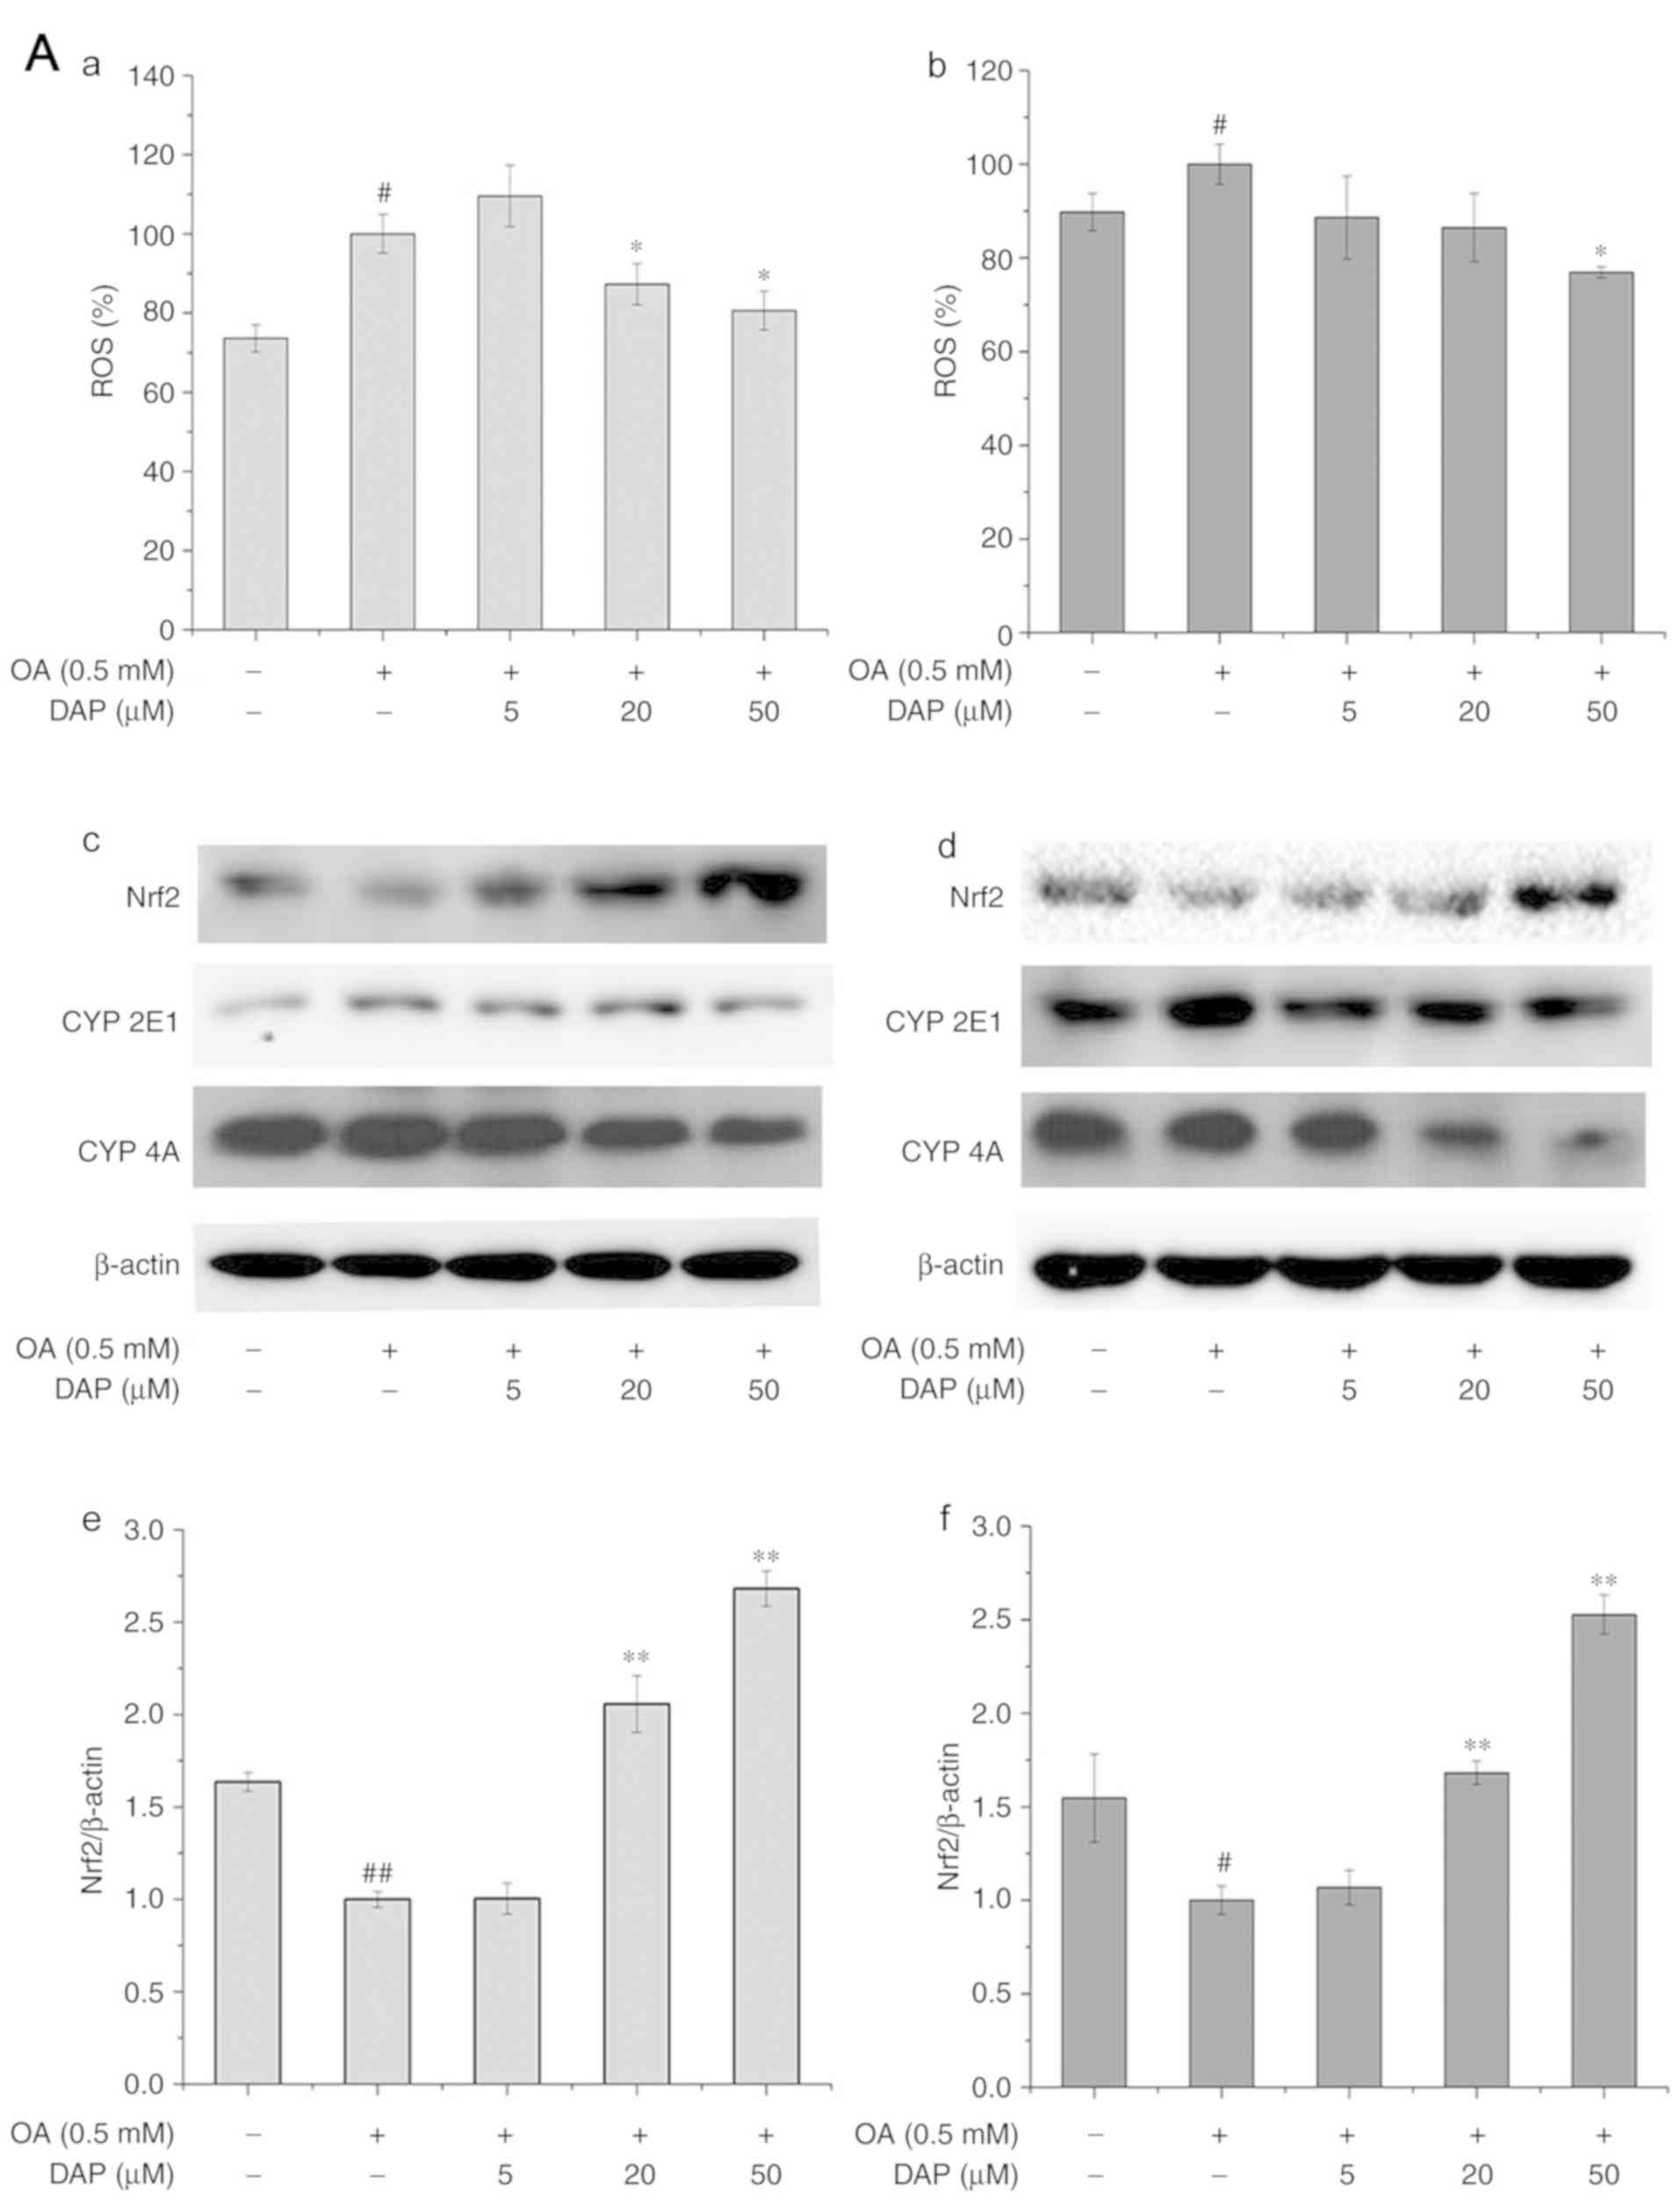 | Figure 6.Effects of increasing DAP
concentrations for 24 h on the cellular ROS and the protein levels
of Nrf2, CYP2E1 and CYP4A. ROS levels were analyzed under (A-a)
simultaneous treatment and (A-b) non-simultaneous treatment
conditions. Western blot analysis following (A-c) simultaneous
treatment and (A-d) non-simultaneous treatment. Densitometry
analysis of (A-e and f) Nrf2. The control group in simultaneous
treatment condition was treated with 0.3% methanol and 0.1% DMSO
for 24 h; the OA group was treated with 0.5 mM OA and 0.1% DMSO for
24 h. The control group in the non-simultaneous treatment condition
were treated with 0.3% methanol for 24 h and with 0.1% DMSO for 24
h; the OA group was treated with 0.5 mM OA for 24 h and with 0.1%
DMSO for 24 h. The bands of the western blots generated in our
study were obtained from the same protein samples, but were not all
run in the same experiment on the same gel. #P<0.05,
##P<0.01 vs. control group; *P<0.05, **P<0.01
vs. OA group. Effects of increasing DAP concentrations for 24 h on
the cellular ROS and the protein levels of Nrf2, CYP2E1 and CYP4A.
Densitometry analysis of (B-a and b) CYP2E1 and (B-c and d) CYP4A.
The control group in simultaneous treatment condition was treated
with 0.3% methanol and 0.1% DMSO for 24 h; the OA group was treated
with 0.5 mM OA and 0.1% DMSO for 24 h. The control group in the
non-simultaneous treatment condition were treated with 0.3%
methanol for 24 h and with 0.1% DMSO for 24 h; the OA group was
treated with 0.5 mM OA for 24 h and with 0.1% DMSO for 24 h. The
bands of the western blots generated in our study were obtained
from the same protein samples, but were not all run in the same
experiment on the same gel. #P<0.05,
##P<0.01 vs. control group; *P<0.05, **P<0.01
vs. OA group. CYP, cytochrome P450; DAP, daphnetin; DMSO, dimethyl
sulfoxide; Nrf2, nuclear factor-like 2; OA, oleic acid; ROS,
reactive oxygen species. |
Discussion
NAFLD comprises three forms, including steatosis,
nonalcoholic steatohepatitis and cirrhosis (17). Fatty degeneration is characterized
by the accumulation of >95% TG in hepatocytes (18,19).
OA-treated HepG2 cells serves as a classic in vitro model
for the study of NAFLD (20–22).
In the present study, by using this particular in vitro
model, we investigated the simultaneous and non-simultaneous
effects of DAP on the lipid metabolism, IR and oxidative stress of
OA-treated HepG2 cells.
To determine the optimal concentration of DAP for
HepG2 cells, we evaluated the toxicity of DAP to HepG2 cells with
OA. The indicators analyzed in the present study were investigated
in the presence of OA; treatment with OA has been reported not to
exhibit cytotoxic effects on the viability of HepG2 and L02 cells;
OA has been used in numerous investigations (20–22).
The liver is a key organ that regulates energy
homeostasis of the body, and liver dysfunction is often associated
with an imbalance in systemic metabolism (23). AMPK is a key factor in the
development of NAFLD (24), and
can negatively regulate SREBP-1C to reduce the formation of free
fatty acids (FFAs) (25); SREBP-1C
can regulate the IR pathway (26).
In addition, SREBP-1C is an important transcription factor that
regulates cholesterol homeostasis in hepatocytes and serves a
crucial role in the regulation of NAFLD-related lipid metabolism
(27). PNPLA3 is a determinant of
TG accumulation in the liver and is regulated by SREBP-1C (28). PPARα is a transcription factor that
participates in the β-oxidation of FFA (29). Our results revealed that DAP
inhibited the upregulated expression of SREBP-1C and PNPLA3, as
well as the downregulation of PPARα and pAMPK induced by
OA-treatment. This suggested that DAP could alleviate lipid
accumulation by promoting the phosphorylation of AMPK, and
regulating the expression of SREBP-1C, PNPLA3 and PPARα in
OA-treated HepG2 cells.
Energy metabolism is mainly regulated by insulin, in
which insulin binds to its receptors located at the cell surface,
activating β-tyrosine kinase to induce insulin signaling (30). Patients with NAFLD usually suffer
from IR and exhibit decreased insulin sensitivity in the liver and
adipose tissues (31–33). IR causes the hydrolysis of TGs in
adipocytes, and produces large quantities of FFAs, which increases
plasma FFA levels and exacerbates lipid accumulation in hepatocytes
(34). Furthermore, IR leads to
increased blood glucose levels by lowering the glucose absorption
of muscle cells and reducing the glucose reserve of liver cells
(35,36). There are two main signaling
pathways that utilize insulin receptors, one is the PI3K/AKT
signaling pathway, the other is the MAPK pathway (37). The upregulation of PI3K/AKT
expression is conducive to increased cellular insulin sensitivity,
and enhances the absorption and transport of glucose (38). The present study revealed that DAP
increased the glucose uptake and the protein expression of pAKT/AKT
in OA-treated HepG2 cells, suggesting that DAP could increase the
hepatocellular insulin sensitivity by upregulating the protein
expression of PI3K and the phosphorylation of AKT.
Excessive fat accumulation in the liver can induce
hepatic lipid peroxidation and inflammation, which further
aggravates hepatocellular IR, and can lead to irreversible fibrosis
or cirrhosis of liver cells (3,4).
Therefore, oxidative stress may serve a determinant role in the
development of NAFLD. The intracellular content of ROS reflects the
oxidative stress levels of cells. ROS in the liver can be generated
by mitochondria, peroxisomes and CYP enzymes (39). It has been reported that CYP2E1 and
CYP4A can increase the production of hydrogen peroxide by the
oxidation of long-chain fatty acids, and promote hepatocyte damage
and steatohepatitis (40,41). The ROS-signaling pathway involves
Nrf2, Kelch-like epichlorohydrin-related protein-1 and antioxidant
response elements; this pathway serves a key regulatory role in
oxidative stress (12). Shen et
al (42) and Li et al
(43) demonstrated that DAP
possesses antioxidative and anti-inflammatory activities in
vivo and in vitro. Our results indicated that DAP could
alleviate oxidative stress damage by upregulating expression of
Nrf2, and downregulating that of CYP2E1 and 4A in OA-treated HepG2
cells.
Of note, the bands of the western blots generated in
our study were obtained from the same protein samples, but were not
all run in the same experiment on the same gel; the experiment was
conducted in triplicate. This may pose as a limitation of the
present study; western blot bands presented together should all be
obtained from the same membrane of the loading control for accurate
analysis of protein expression.
DAP is an inhibitor of numerous pathways, including
the epidermal growth factor receptor, protein kinase A and protein
kinase C signaling pathways, Therefore, the association between
AMPK, SREBP-1C, PNPLA3, PI3K, AKT, NRF2 and NASH suggested in the
present study requires further investigation to determine the
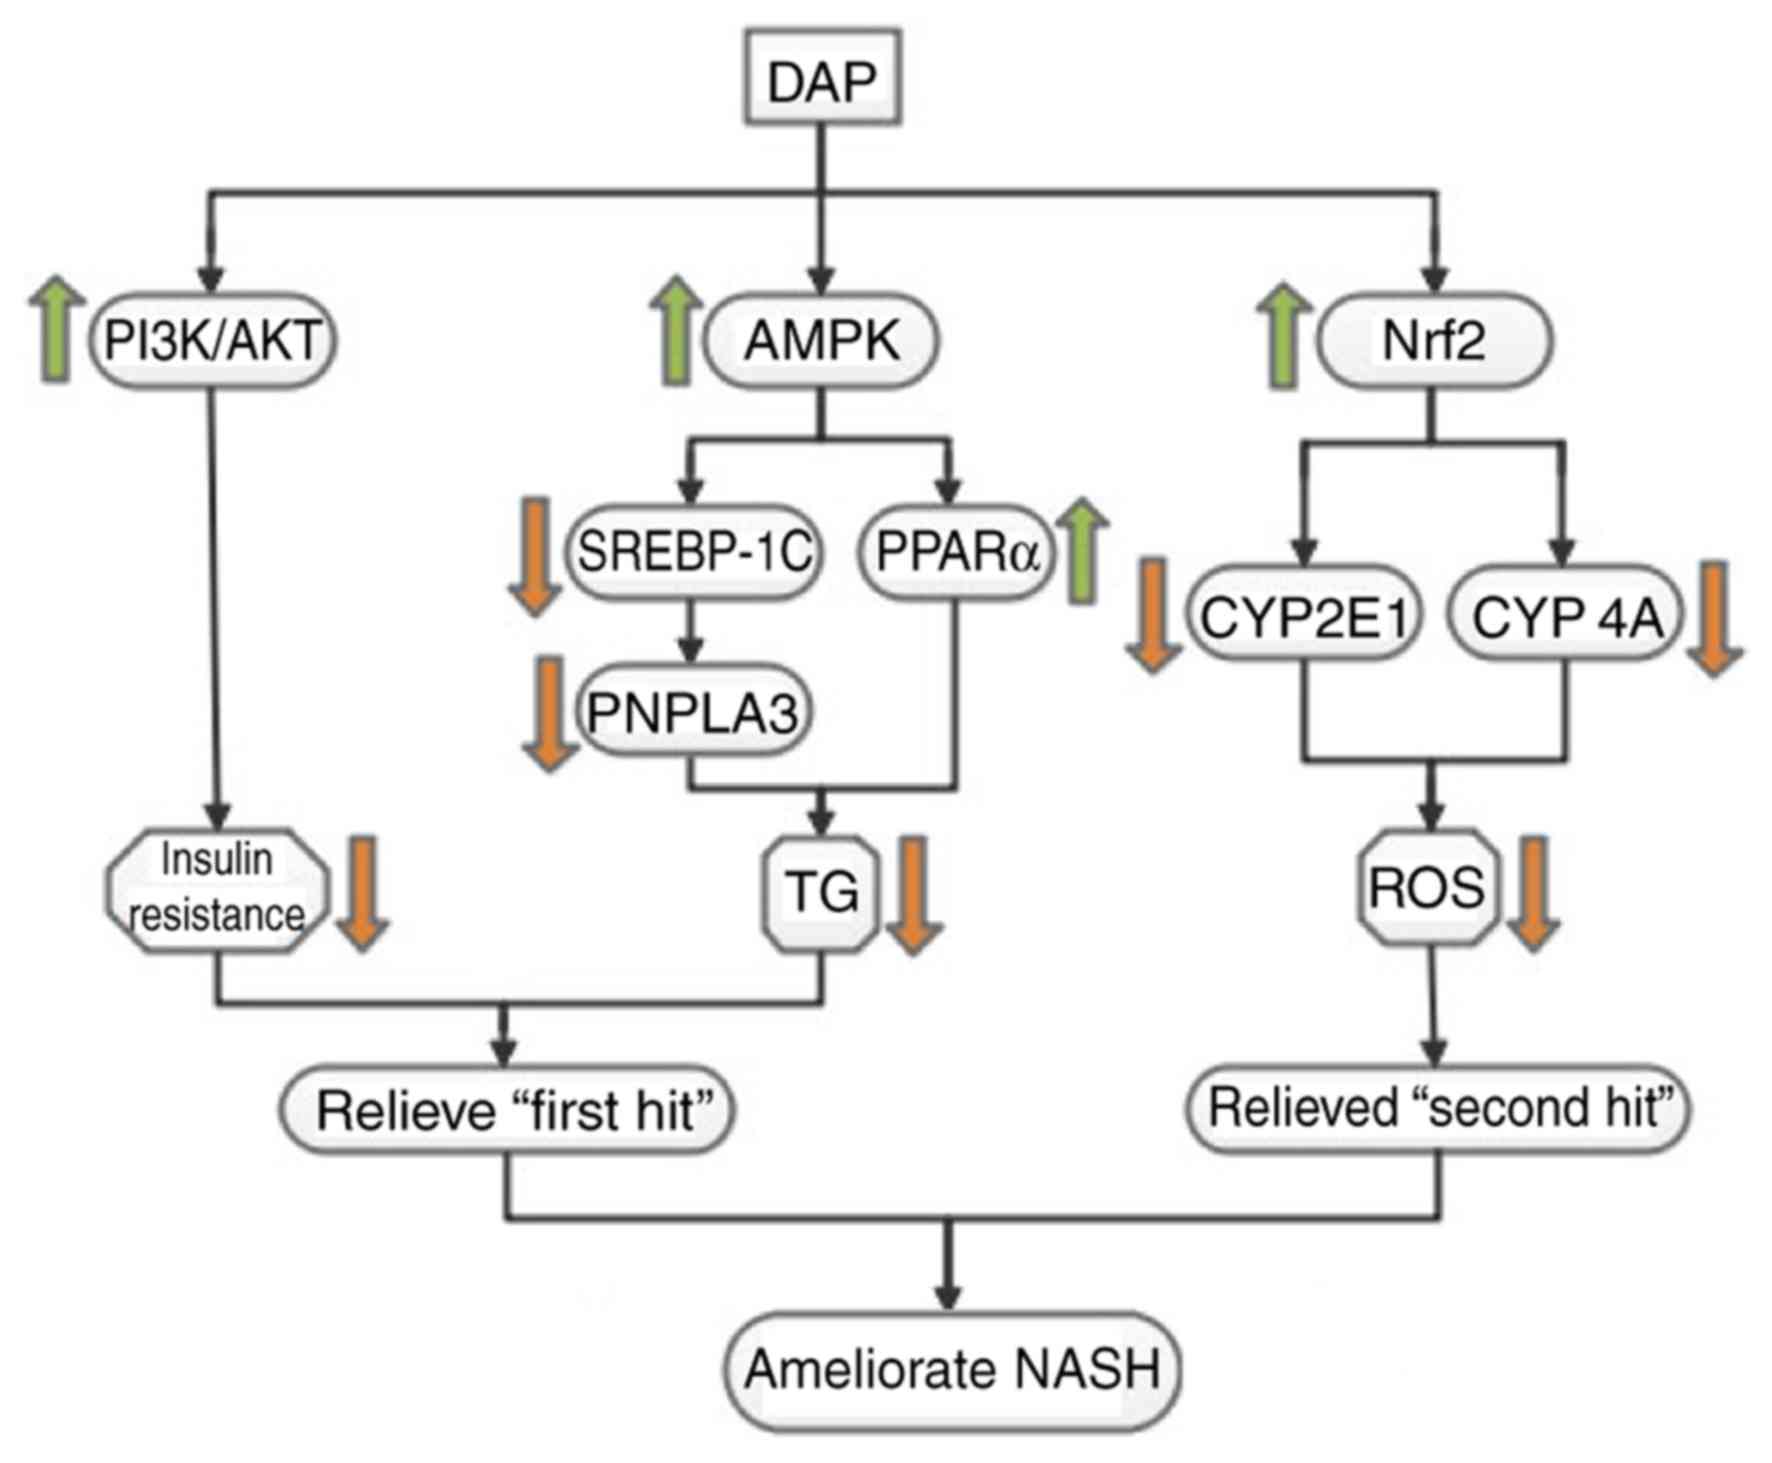
underlying mechanisms. The present study revealed that DAP could
ameliorate lipid accumulation, IR and oxidative stress in
OA-induced HepG2 cells (Fig. 7),
demonstrating its possible application in ameliorating the various
symptoms of NAFLD. Our results suggested the potential mechanism
underlying the effects of DAP against metabolic alterations in
OA-treated HepG2 cells may involve the regulation of key factors
involved in lipid metabolism (pAMPK, PPARα, SREBP-1C and PNPLA3),
the insulin signaling pathway (PI3K-AKT) and oxidative stress
(NRF2, CYP2E1, CYP4A).
Acknowledgements
Not applicable.
Funding
This research was supported by major technological
innovation project of Hubei Province (grant no. 2016ACA140) and
innovation and entrepreneurship training project for College
Students of the Ministry of Education (grant no. 201610512001).
Availability of data and materials
The datasets used and/or analyzed during the current
study are available from the corresponding author on reasonable
request.
Authors' contributions
YL conducted the experiments under the
non-simultaneous treatment conditions; LL performed the experiments
under the simultaneous treatment conditions; FH and YC made
substantial contributions to the design of the present study and
revised the manuscript.
Ethics approval and consent to
participate
Not applicable.
Patient consent for publication
Not applicable.
Competing interests
The authors declare that they have no competing
interests.
References
|
1
|
Issa D, Patel V and Sanyal AJ: Future
therapy for non-alcoholic fatty liver disease. Liver Int. 38 (Suppl
1):S56–S63. 2018. View Article : Google Scholar
|
|
2
|
Suzuki A, Angulo P, Lymp J, St Sauver J,
Muto A, Okada T and Lindor K: Chronological development of elevated
aminotransferases in a nonalcoholic population. Hepatology.
41:64–71. 2005. View Article : Google Scholar : PubMed/NCBI
|
|
3
|
Tilg H and Moschen AR: Evolution of
inflammation in nonalcoholic fatty liver disease: The multiple
parallel hits hypothesis. Hepatology. 52:1836–1846. 2010.
View Article : Google Scholar : PubMed/NCBI
|
|
4
|
Anstee QM and Goldin RD: Mouse models in
non-alcoholic fatty liver disease and steatohepatitis research. Int
J Exp Pathol. 87:1–16. 2006. View Article : Google Scholar : PubMed/NCBI
|
|
5
|
Review Team, LaBrecque DR, Abbas Z, Anania
F, Ferenci P, Khan AG, Goh KL, Hamid SS, Isakov V, Lizarzabal M, et
al: World gastroenterology organisation global guidelines:
Nonalcoholic fatty liver disease and nonalcoholic steatohepatitis.
J Clin Gastroenterol. 48:467–473. 2014.PubMed/NCBI
|
|
6
|
Lee YH, Kim KJ, Yoo ME, Kim G, Yoon HJ, Jo
K, Youn JC, Yun M, Park JY, Shim CY, et al: Association of
nonalcoholicsteatohepatitis with subclinical myocardial dysfunction
in non-cirrhotic patients. J Hepatol. 68:764–772. 2018. View Article : Google Scholar : PubMed/NCBI
|
|
7
|
Marra F, Gastaldelli A, Svegliati Baroni
G, Tell G and Tiribelli C: Molecular basis and mechanisms of
progression of non-alcoholic steatohepatitis. Trends Mol Med.
14:72–81. 2008. View Article : Google Scholar : PubMed/NCBI
|
|
8
|
Sumida Y and Yoneda M: Current and future
pharmacological therapies for NAFLD/NASH. J Gastroenterol.
53:362–376. 2018. View Article : Google Scholar : PubMed/NCBI
|
|
9
|
Takahashi Y, Suqimoto K, Inui H and
Fukusato T: Current pharmacological therapies for nonalcoholic
fatty liver disease/nonalcoholic steatohepatitis. World J
Gastroenterol. 21:3777–3785. 2015. View Article : Google Scholar : PubMed/NCBI
|
|
10
|
Liu J, Tian J, He W, Xie J, Hu Z and Chen
X: Spectrofluorimetric study of the binding of daphnetin to bovine
serum albumin. J Pharm Biomed Anal. 35:671–677. 2004. View Article : Google Scholar : PubMed/NCBI
|
|
11
|
Finn GJ, Creaven BS and Egan DA: Daphnetin
induced differentiation of human renal carcinoma cells and its
mediation by p38 mitogen-activated protein kinase. Biochem
Pharmacol. 67:1779–1788. 2004. View Article : Google Scholar : PubMed/NCBI
|
|
12
|
Lv H, Liu Q, Zhou J, Tan G, Deng X and Ci
X: Daphnetin-mediated Nrf2 antioxidant signaling pathways
ameliorate tert-butyl hydroperoxide (t-BHP)-induced mitochondrial
dysfunction and cell death. Free Radic Biol Med. 106:38–52. 2017.
View Article : Google Scholar : PubMed/NCBI
|
|
13
|
Venugopala KN, Rashmi V and Odhav B:
Review on natural coumarin lead compounds for their pharmacological
activity. Biomed Res Int. 2013:9632482013. View Article : Google Scholar : PubMed/NCBI
|
|
14
|
Um MY, Moon MK, Ahn J and Youl Ha T:
Coumarin attenuates hepatic steatosis by down-regulating lipogenic
gene expression in mice fed a high-fat diet. Br J Nut.
109:1590–1597. 2013. View Article : Google Scholar
|
|
15
|
Yu W, Wang H, Ying H, Yu Y, Chen D, Ge W
and Shi L: Daphnetin attenuates microglial activation and
proinflammatory factor production via multiple signaling pathways.
Int Immunopharmacol. 21:1–9. 2014. View Article : Google Scholar : PubMed/NCBI
|
|
16
|
Livak KJ and Schmittgen TD: Analysis of
relative gene expression data using real-time quantitative PCR and
the 2(-Delta Delta C(T)) method. Methods. 25:402–408. 2001.
View Article : Google Scholar : PubMed/NCBI
|
|
17
|
Harrison SA, Oliver D, Arnold HL, Gogia S
and Neuschwander-Tetri BA: Development and validation of a simple
NAFLD clinical scoring system for identifying patients without
advanced disease. Gut. 57:1441–1447. 2008. View Article : Google Scholar : PubMed/NCBI
|
|
18
|
Vacca M, Allison M, Griffin JL and
Vidal-Puig A: Fatty acid and glucose sensors in hepatic lipid
metabolism: Implications in NAFLD. Semin Liver Dis. 35:250–261.
2015. View Article : Google Scholar : PubMed/NCBI
|
|
19
|
Szczepaniak LS, Nurenberg P, Leonard D,
Browning JD, Reingold JS, Grundy S, Hobbs HH and Dobbins RL:
Magnetic resonance spectroscopy to measure hepatic triglyceride
content: Prevalence of hepatic steatosis in the general population.
Am J Physiol Endocrinol Metab. 288:E462–E468. 2005. View Article : Google Scholar : PubMed/NCBI
|
|
20
|
Kanuri G and Bergheim I: In vitro and in
vivo models of non-alcoholic fatty liver disease (NAFLD). Int J Mol
Sci. 14:11963–11980. 2013. View Article : Google Scholar : PubMed/NCBI
|
|
21
|
Rafiei H, Omidian K and Bandy B:
Comparison of dietary polyphenols for protection against molecular
mechanisms underlying nonalcoholic fatty liver disease in a cell
model of steatosis. Mol Nutr Food Res. 61:2017. View Article : Google Scholar : PubMed/NCBI
|
|
22
|
Xie C, Chen Z, Zhang C, Xu X, Jin J, Zhan
W, Han T and Wang J: Dihydromyricetin ameliorates oleic
acid-induced lipid accumulation in L02 and HepG2 cells by
inhibiting lipogenesis and oxidative stress. Life Sci. 157:131–139.
2016. View Article : Google Scholar : PubMed/NCBI
|
|
23
|
Fan JG, Wei L and Zhuang H: National
Workshop on Fatty Liver and Alcoholic Liver Disease, Chinese
Society of Hepatology, Chinese Medical Association; Fatty Liver
Disease Expert Committee, Chinese Medical Doctor Association:
Guideline of prevention and treatment of nonalcoholic fatty liver
disease (2018, China). J Dig Dis. Nov 16–2018.(Epub ahead of
print).
|
|
24
|
Smith BK, Marcinko K, Desjardins EM, Lally
JS, Ford RJ and Steinberg GR: Treatment of nonalcoholic fatty liver
disease: Role of AMPK. Am J Physiol Endocrinol Metab.
311:E730–E740. 2016. View Article : Google Scholar : PubMed/NCBI
|
|
25
|
Kohjima M, Higuchi N, Kato M, Kotoh K,
Yoshimoto T, Fujino T, Yada M, Yada R, Harada N, Enjoji M, et al:
SREBP-1c, regulated by the insulin and AMPK signaling pathways,
plays a role in nonalcoholic fatty liver disease. Int J Mol Med.
21:507–511. 2008.PubMed/NCBI
|
|
26
|
Ruderman NB, Carling D, Prentki M and
Cacicedo JM: AMPK, insulin resistance, and the metabolic syndrome.
J Clin Invest. 123:2764–2772. 2013. View
Article : Google Scholar : PubMed/NCBI
|
|
27
|
Ahmed MH and Byrne CD: Modulation of
sterol regulatory element binding proteins (SREBPs) as potential
treatments for non-alcoholic fatty liver disease (NAFLD). Drug
Discov Today. 12:740–747. 2007. View Article : Google Scholar : PubMed/NCBI
|
|
28
|
Dubuquoy C, Robichon C, Lasnier F,
Langlois C, Dugail I, Foufelle F, Girard J, Burnol AF, Postic C and
Moldes M: Distinct regulation of adiponutrin/PNPLA3 gene expression
by the transcription factors ChREBP and SREBP1c in mouse and human
hepatocytes. J Hepatolv. 55:145–153. 2011. View Article : Google Scholar
|
|
29
|
Seo YS, Ji HK, Jo NY, Choi KM, Baik SH,
Park JJ, Kim JS, Byun KS, Bak YT, Lee CH, et al: PPAR agonists
treatment is effective in a nonalcoholic fatty liver disease animal
model by modulating fatty-acid metabolic enzymes. J Gastroenterol
Hepatol. 23:102–109. 2008.PubMed/NCBI
|
|
30
|
Zheng T, Yang X, Wu D, Xing S, Bian F, Li
W, Chi J, Bai X, Wu G, Chen X, et al: Salidroside ameliorates
insulin resistance through activation of a mitochondria-associated
AMPK/PI3K/Akt/GSK3β pathway. Br J Pharmacol. 172:3284–3301. 2015.
View Article : Google Scholar : PubMed/NCBI
|
|
31
|
Sanyal AJ, Campbellsargent C, Mirshahi F,
Rizzo WB, Contos MJ, Sterling RK, Luketic VA, Shiffman ML and Clore
JN: Nonalcoholic steatohepatitis: Association of insulin resistance
and mitochondrial abnormalities. Gastroenterology. 120:1183–1192.
2001. View Article : Google Scholar : PubMed/NCBI
|
|
32
|
Gastaldelli A, Cusi K, Pettiti M, Hardies
J, Miyazaki Y, Berria R, Buzzigoli E, Sironi AM, Cersosimo E,
Ferrannini E and Defronzo RA: Relationship between hepatic/visceral
fat and hepatic insulin resistance in nondiabetic and type 2
diabetic subjects. Gastroenterology. 133:496–506. 2007. View Article : Google Scholar : PubMed/NCBI
|
|
33
|
Bugianesi E, Gastaldelli A, Vanni E,
Gambino R, Cassader M, Baldi S, Ponti V, Pagano G, Ferrannini E and
Rizzetto M: Insulin resistance in non-diabetic patients with
non-alcoholic fatty liver disease: Sites and mechanisms.
Diabetologia. 48:634–642. 2005. View Article : Google Scholar : PubMed/NCBI
|
|
34
|
Dunaif A: Insulin resistance and the
polycystic ovary syndrome: Mechanism and implications for
pathogenesis. Endocr Rev. 18:774–800. 1997. View Article : Google Scholar : PubMed/NCBI
|
|
35
|
Hotamisligil GS, Shargill NS and
Spiegelman BM: Adipose expression of tumor necrosis factor-alpha:
Direct role in obesity-linked insulin resistance. Science.
259:87–91. 1993. View Article : Google Scholar : PubMed/NCBI
|
|
36
|
Yamauchi T, Kamon J, Waki H, Terauchi Y,
Kubota N, Hara K, Mori Y, Ide T, Murakami K, Tsuboyama-Kasaoka N,
et al: The fat-derived hormone adiponectin reverses insulin
resistance associated with both lipoatrophy and obesity. Nat Med.
7:941–946. 2001. View
Article : Google Scholar : PubMed/NCBI
|
|
37
|
Shoelson SE, Lee J and Goldfine AB:
Inflammation and insulin resistance. J Clin Invest. 116:1793–1807.
2006. View Article : Google Scholar : PubMed/NCBI
|
|
38
|
Sharma BR, Kim HJ and Rhyu DY: Caulerpa
lentillifera extract ameliorates insulin resistance and regulates
glucose metabolism in C57BL/KsJ-db/db mice via PI3K/AKT signaling
pathway in myocytes. J Transl Med. 13:622015. View Article : Google Scholar : PubMed/NCBI
|
|
39
|
Sanyal AJ, Campbellsargent C, Mirshahi F,
Rizzo WB, Contos MJ, Sterling RK, Luketic VA, Shiffman ML and Clore
JN: Nonalcoholic steatohepatitis: Association of insulin resistance
and mitochondrial abnormalities. Gastroenterology. 120:1183–1192.
2001. View Article : Google Scholar : PubMed/NCBI
|
|
40
|
Rao MS and Reddy JK: Peroxisomal
beta-oxidation and steatohepatitis. Semin Liver Dis. 21:43–55.
2001. View Article : Google Scholar : PubMed/NCBI
|
|
41
|
Schattenberg JM and Czaja MJ: Regulation
of the effects of CYP2E1-induced oxidative stress by JNK signaling.
Redox Biol. 3:7–15. 2014. View Article : Google Scholar : PubMed/NCBI
|
|
42
|
Shen L, Zhou T, Wang J, Sang X, Lan L, Luo
L and Yin Z: Daphnetin reduces endotoxin lethality in mice and
decreases LPS-induced inflammation in Raw264.7 cells via
suppressing JAK/STATs activation and ROS production. Inflamm Res.
66:579–589. 2017. View Article : Google Scholar : PubMed/NCBI
|
|
43
|
Li M, Shi X, Chen F and Hao F: Daphnetin
inhibits inflammation in the NZB/W F1 systemic lupus erythematosus
murine model via inhibition of NF-κB activity. Exp Ther Med.
13:455–460. 2017. View Article : Google Scholar : PubMed/NCBI
|