Introduction
Primary lung cancer (PLC) has an increasing
incidence and is a leading cause of cancer-associated mortality
worldwide. Non-small cell lung cancer (NSCLC) accounts for ~80% of
PLC cases and the prognosis of which is one of the worst among all
malignant tumors (1). The 5-year
overall survival (OS) rate of patients with NSCLC is <15% in the
United States, and lower in other countries (2). A good prognosis for NSCLC requires a
timely diagnosis and appropriate treatment. Furthermore, a positive
prognosis is associated with various pathological characteristics,
including Tumor, Node and Metastasis staging (3) and pathological grading (4,5), and
genetic backgrounds. For example, the CRP 1846T/T genotype has been
identified to be associated with the prognosis of patients with
NSCLC (6). Various
tumor-associated molecules, signaling pathways, and proteases and
their inhibitors are involved in the development of NSCLC. The
genetic and molecular analysis of these factors may be important
for the development of novel therapeutic agents and predicting the
prognosis of patients with NSCLC (7,8).
Deleted in liver cancer (DLC) proteins are members
of the RhoGTPase-activating protein (RhoGAP) family, and consist of
DLC1-3. DLC2 and DLC3 are also known as StAR related lipid transfer
domain containing 13 and 8, respectively (9). The RhoGAP family proteins are
negative regulators of the Rho family of small GTPases, and promote
the inactivation of RhoA by catalyzing the conversion of RhoA-GTP
to RhoA-GDP (9,10). DLC1 and DLC2 are tumor suppressor
genes in liver cancer and a number of other tumors, including
breast cancer, gastric cancer and renal cell carcinoma, and the
expression levels of DLC1 and 2 are downregulated in these tumors
(11,12). DLC2 is similar to DLC1 in
structure, and DLC3 is essential for maintaining the integrity of
adherens junctions. The function and prognostic value of the DLC
family in NSCLC remains largely unknown. Thus, the present study
investigated whether there is abnormal DLC1–3 expression in
patients with NSCLC, and whether the expression of DLC1-3 is
associated with the prognosis of patients NSCLC. In addition, the
online Kaplan-Meier (KM) plotter database (kmplot.com/analysis) was used to determine the
prognostic roles of DLC mRNA expression in patients with NSCLC. A
number of genes associated with gastric, breast, ovarian and lung
cancer have been identified and validated by the KM plotter using
patient samples measured by gene chips or RNA-sequencing (13–16).
In the present study study, the KM plotter provided prognostic
information and mRNA mapping of 1,926 patients with lung cancer
patients. Additionally, the role of DLC2 and DLC3 overexpression in
lung cancer cells was investigated in vitro.
Materials and methods
Analysis of the datasets
The expression level of the DLC family was analyzed
using Gene Expression Profiling Interactive Analysis (GEPIA;
http://gepia.cancer-pku.cn/). GEPIA an
interactive web server for analyzing the RNA sequencing expression
data of 9,736 tumors and 8,587 normal samples from The Cancer
Genome Atlas (TCGA; http://www.cancer.gov/about-nci/organization/ccg/research/structural-genomics/tcga)
and Genotype-Tissue Expression project (GTEx; http://commonfund.nih.gov/GTEx/) (17).
The KM plotter database was used to analyze the
prognostic values of the DLC family in NSCLC. In the KM plotter
database, the data corresponding to four types of cancer (gastric,
breast, ovarian and lung cancers) were downloaded from Gene
Expression Omnibus (Affymetrix microarrays only), European
Genome-Phenome Archive and TCGA. The data included gene expression
data, and information on relapse, and OS information for patients.
Clinical data from 1,926 patients with NSCLC including gender,
histology, clinical stage, smoking history, pathological grades and
chemotherapy agents used were collected from KM plotter database.
The Affymetrix IDs of DLC1, DLC2 and DLC3 were entered into the KM
plotter and data were compared using the KM survival plots.
According to the median expression levels of DLC1, DLC2 and DLC3,
the samples were divided into two groups: i) High expression group;
and ii) low expression group. Subsequently, the 95% CI, the
log-rank P-value and the hazard ratio were calculated. The
Affymetrix ID corresponding to DLC1 used in the Kaplan Meier
plotter was 210762_s_at, the Affymetrix ID corresponding to DLC2
was 213103_at and the Affymetrix ID corresponding to DLC3 was
206868_at.
Immunohistochemistry
Cancer and adjacent normal tissues were collected
from 40 patients with NSCLC (male to female ratio, 27:13; age,
54.82±14.39) at the Zaozhuang Municipal Hospital (Zaozhuang, China)
between June 2016 and June 2018. Patients who received preoperative
radiotherapy, chemotherapy or hormone therapy were excluded from
the present study. The current study was approved by The Ethics
Committee of Zaozhuang Municipal Hospital (approval no.
2016ZMHE011) and all patients signed informed consent. These
tissues were fixed in 4% paraformaldehyde solution overnight at
room temperature, dehydrated and embedded in paraffin, and cut into
5-µm-thick paraffin slices. Following dewaxing with xylene (2×5
min, at room temperature) and rehydration in descending ethanol
series at room temperature, the sections were boiled in citrate
buffer (pH=6.0) at 95°C for 15 min for antigen retrieval. The
sections were blocked with 5% goat serum (cat. no. ab7481; Abcam)
at room temperature for 60 min. Tissue sections were incubated with
primary antibodies against DCL1 (cat. no. ab126257; 1:100; Abcam),
DCL2 (cat. no. ab126489; 1:100; Abcam) and DCL3 (cat. no.
13899-1-AP; 1:100; ProteinTech Group, Inc.). Primary antibodies
were incubated with the membranes overnight at 4°C and horseradish
peroxidase-labeled secondary antibodies (cat. no. A00001-2; 1:500;
ProteinTech Group, Inc.) were incubated at 37°C for 1 h. The slides
were developed in diaminobenzidine at room temperature for 3 min
and counterstained with hematoxylin at room temperature for 1 min.
Images were taken and processed by MetaMorph software (version 2.2;
Molecular Devices, LLC).
The expression levels of DLC1, DLC2 and DLC3 were
evaluated by the staining intensity and the percentage of positive
stained cells, as previously described (18). Subsequently, the staining intensity
was scored as follows: 0, no staining; 1, weak staining; 2,
moderate staining; and 3, strong staining. The percentage of
positive stained cells was scored as follows: 0, 0–10%; 1, 1–25%;
2, 26–50%; 3, 51–75%; and 4, >75%. A final score was assigned to
each sample by multiplying these two scores, and samples presenting
a score >6 were included in the high expression group, whereas
samples presenting a score ≤6 were included in the low expression
group.
Cell culture and transfection
The human lung cancer cell line A-549 was purchased
from the Cell Bank of the Chinese Academy of Sciences (Shanghai,
China). DMEM (HyClone; GE Healthcare Life Sciences) supplemented
with 10% FBS (Thermo Fisher Scientific, Inc.), 100 U/ml penicillin
and 0.1 mg/ml streptomycin, was used for cell culture at 37°C with
5% CO2. DLC1, DLC2 or DLC3 cDNAs cloned into pcDNA3.1
vectors were purchased from Oligobio Biotechnology Co., Ltd.
(Beijing, China) and pcDNA3.1-DLC1, pcDNA3.1-DLC2 and pcDNA3.1-DLC3
vectors were used for subsequent experiments. Empty pcDNA3.1 vector
was used as the control group. Cells were harvested 24 h after
transfection prior to further experimentation.
Reverse transcription-quantitative
polymerase chain reaction (RT-qPCR)
The mRNA expression levels of DLC2 and DLC3 in A-549
cells were measured by RT-qPCR. Total RNA was extracted from A-549
cells using TRIzol® reagent (Invitrogen; Thermo Fisher
Scientific, Inc.) followed by RT reaction to synthesize the cDNA
using the HiFiScript cDNA Synthesis Kit (CWBIO) at 37°C for 15 min
followed by an incubation at 85°C for 5 sec). qPCR was subsequently
performed using SYBR® Premix Ex Taq™ II (Thermo Fisher
Scientific, Inc.). The thermocycling conditions were as follows:
Initial denaturation at 95°C 30 sec, followed by 40 cycles of 95°C
for 5 sec, 56°C for 20 sec and 72°C for 30 sec. The following
primer pairs were used for the qPCR: DLC1, forward
5′-TGCGCCAGATGAATGAAGGT-3′ and reverse 5′-GCATGATGGCAGCCTTGATG-3′;
DLC2, forward 5′-GAACACGACCAGCAGTGAGA-3′ and reverse
5′-CGGGTTGTCTGTACAGCACT-3′; DLC3, forward
5′-CCTCCAGCGAACTTGACAGT-3′ and reverse 5′-CCTGCAGGGTCTGGTAAGTG-3′;
GAPDH, forward 5′-AAGGTGAAGGTCGGAGTCAA-3′ and reverse
5′-AATGAAGGGGTCATTGATGG-3′. mRNA levels were quantified using the
2−∆∆Cq method (19) and
normalized to the internal reference gene GAPDH.
Western blotting
A-549 cells transfected with the empty vector
pcDNA3.1, pcDNA3.1-DLC1, pcDNA3.1-DLC2 or pcDNA3.1-DLC3 were lysed
using radioimmunoprecipitation assay buffer (CWBiotech) for protein
extraction. Total protein was quantified using a bicinchoninic acid
assay and 20 µg protein/lane was separated by a 10% SDS-PAGE. The
separated proteins were subsequently transferred onto a PVDF
membrane and blocked in 5% non-fat milk at 25°C for 1 h. The
membranes were incubated with primary antibodies against DLC1 (cat.
no. ab126257; 1:500; Abcam), DLC2 (cat. no. ab126489; 1:500;
Abcam), DLC3 (cat. no. 13899-1-AP; 1:400; ProteinTech Group, Inc.)
and GAPDH (cat. no. 10494-1-AP; 1:5,000; ProteinTech Group, Inc.)
overnight at 4°C. Following the primary incubation, membranes were
incubated with horseradish peroxidase-labeled secondary antibodies
(cat. no. A00001-2; 1:5,000; ProteinTech Group, Inc.) for 1 h at
room temperature. Protein bands were visualized using the enhanced
chemiluminescence system. Protein expression was density-quantified
using ImageJ software (version 1.49; National Institutes of Health)
with GAPDH as the loading control.
Cell Counting Kit-8 (CCK-8) assay
A-549 cells transfected with pcDNA3.1-DLC1,
pcDNA3.1-DLC2 or pcDNA3.1-DLC3 were seeded into a 96-well plate at
a density of 2×10³ cells/well and cultured at 37°C.
Fresh DMEM containing 10 µl CCK-8 solution was added to the cells
at 0, 24, 48 and 72 h post-transfection, and incubated for 2 h at
37°C. Cell proliferation was determined by measuring the optical
density value at a wavelength of 450 nm. The CCK-8 assay was
performed in triplicate.
Flow cytometry
Flow cytometry was used to investigate cell
apoptosis and was performed using the Annexin V-FITC Apoptosis
Detection Kit I (Beyotime Institute of Biotechnology) according to
the manufacturer's protocol. After transfection, cells were
incubated for 48 h, and A-549 cells (2×10⁵ cells) were
stained with the Annexin V/FITC mix. A total of 10 ml propidium
iodide and 400 µl PBS were added prior to detecting cell apoptosis.
Apoptotic cells were subsequently analyzed using a flow cytometer
and FlowJo software (version 10; Tree Star, Inc.) was used for the
data analysis.
Statistical analysis
Data are expressed as the mean ± SD. Data were
analyzed using GraphPad Prism software (version 7.0; GraphPad
Software, Inc.). Analysis of the differential expression of DLCs
between normal and tumor samples from The Cancer Genome Atlas and
Genotype-Tissue Expression databases was performed by unpaired
t-test. The KM method and the Log-rank test were performed to
compare the survival rates among different groups, whose data were
downloaded from the KM plotter database. The Cox proportional
hazard model was used for the survival analysis. χ2 test
was used to compare the expression levels of DLCs in tumor tissues
and normal lung tissues in the immunohistochemistry assays. One-way
analysis of variance (ANOVA) was used for the analysis of multiple
groups, followed by Newman-Keuls post-hoc test. P<0.05 was
considered to indicate a statistically significant difference.
Results
Differential expression of DLC between
normal and tumor tissues in NSCLC
The expression level of the DLC family in NSCLC was
analyzed by GEPIA database. GEPIA analyzed the mRNA expression
levels of DLC in 483 lung adenocarcinoma (LUAD) and 347 normal lung
tissues which were obtained from TCGA and GTEx databases, as well
as 486 lung squamous cell carcinoma (LUSC) samples and 338 normal
lung tissues. Analytical results of DLC expression are presented in
Fig. 1A. Decreased expression
levels of DLC1, DLC2 and DLC3 were observed in LUAD and LUSC tumors
compared with normal lung tissue (P<0.01). To further
investigate DLC expression, cancer and adjacent normal tissues were
collected from 40 patients with NSCLC. As shown in Fig. 1B, immunohistochemical staining
revealed higher expression of DLCs in normal lung tissues compared
with lung cancer tissues. The percentage of low expression in lung
cancer tissues reached to 87.5% (35/40), whereas in normal lung
tissues was only 20% (8/40). However, no further clinical
correlation analysis was performed due to the lack of pathological
grade and metastasis data of these patients.
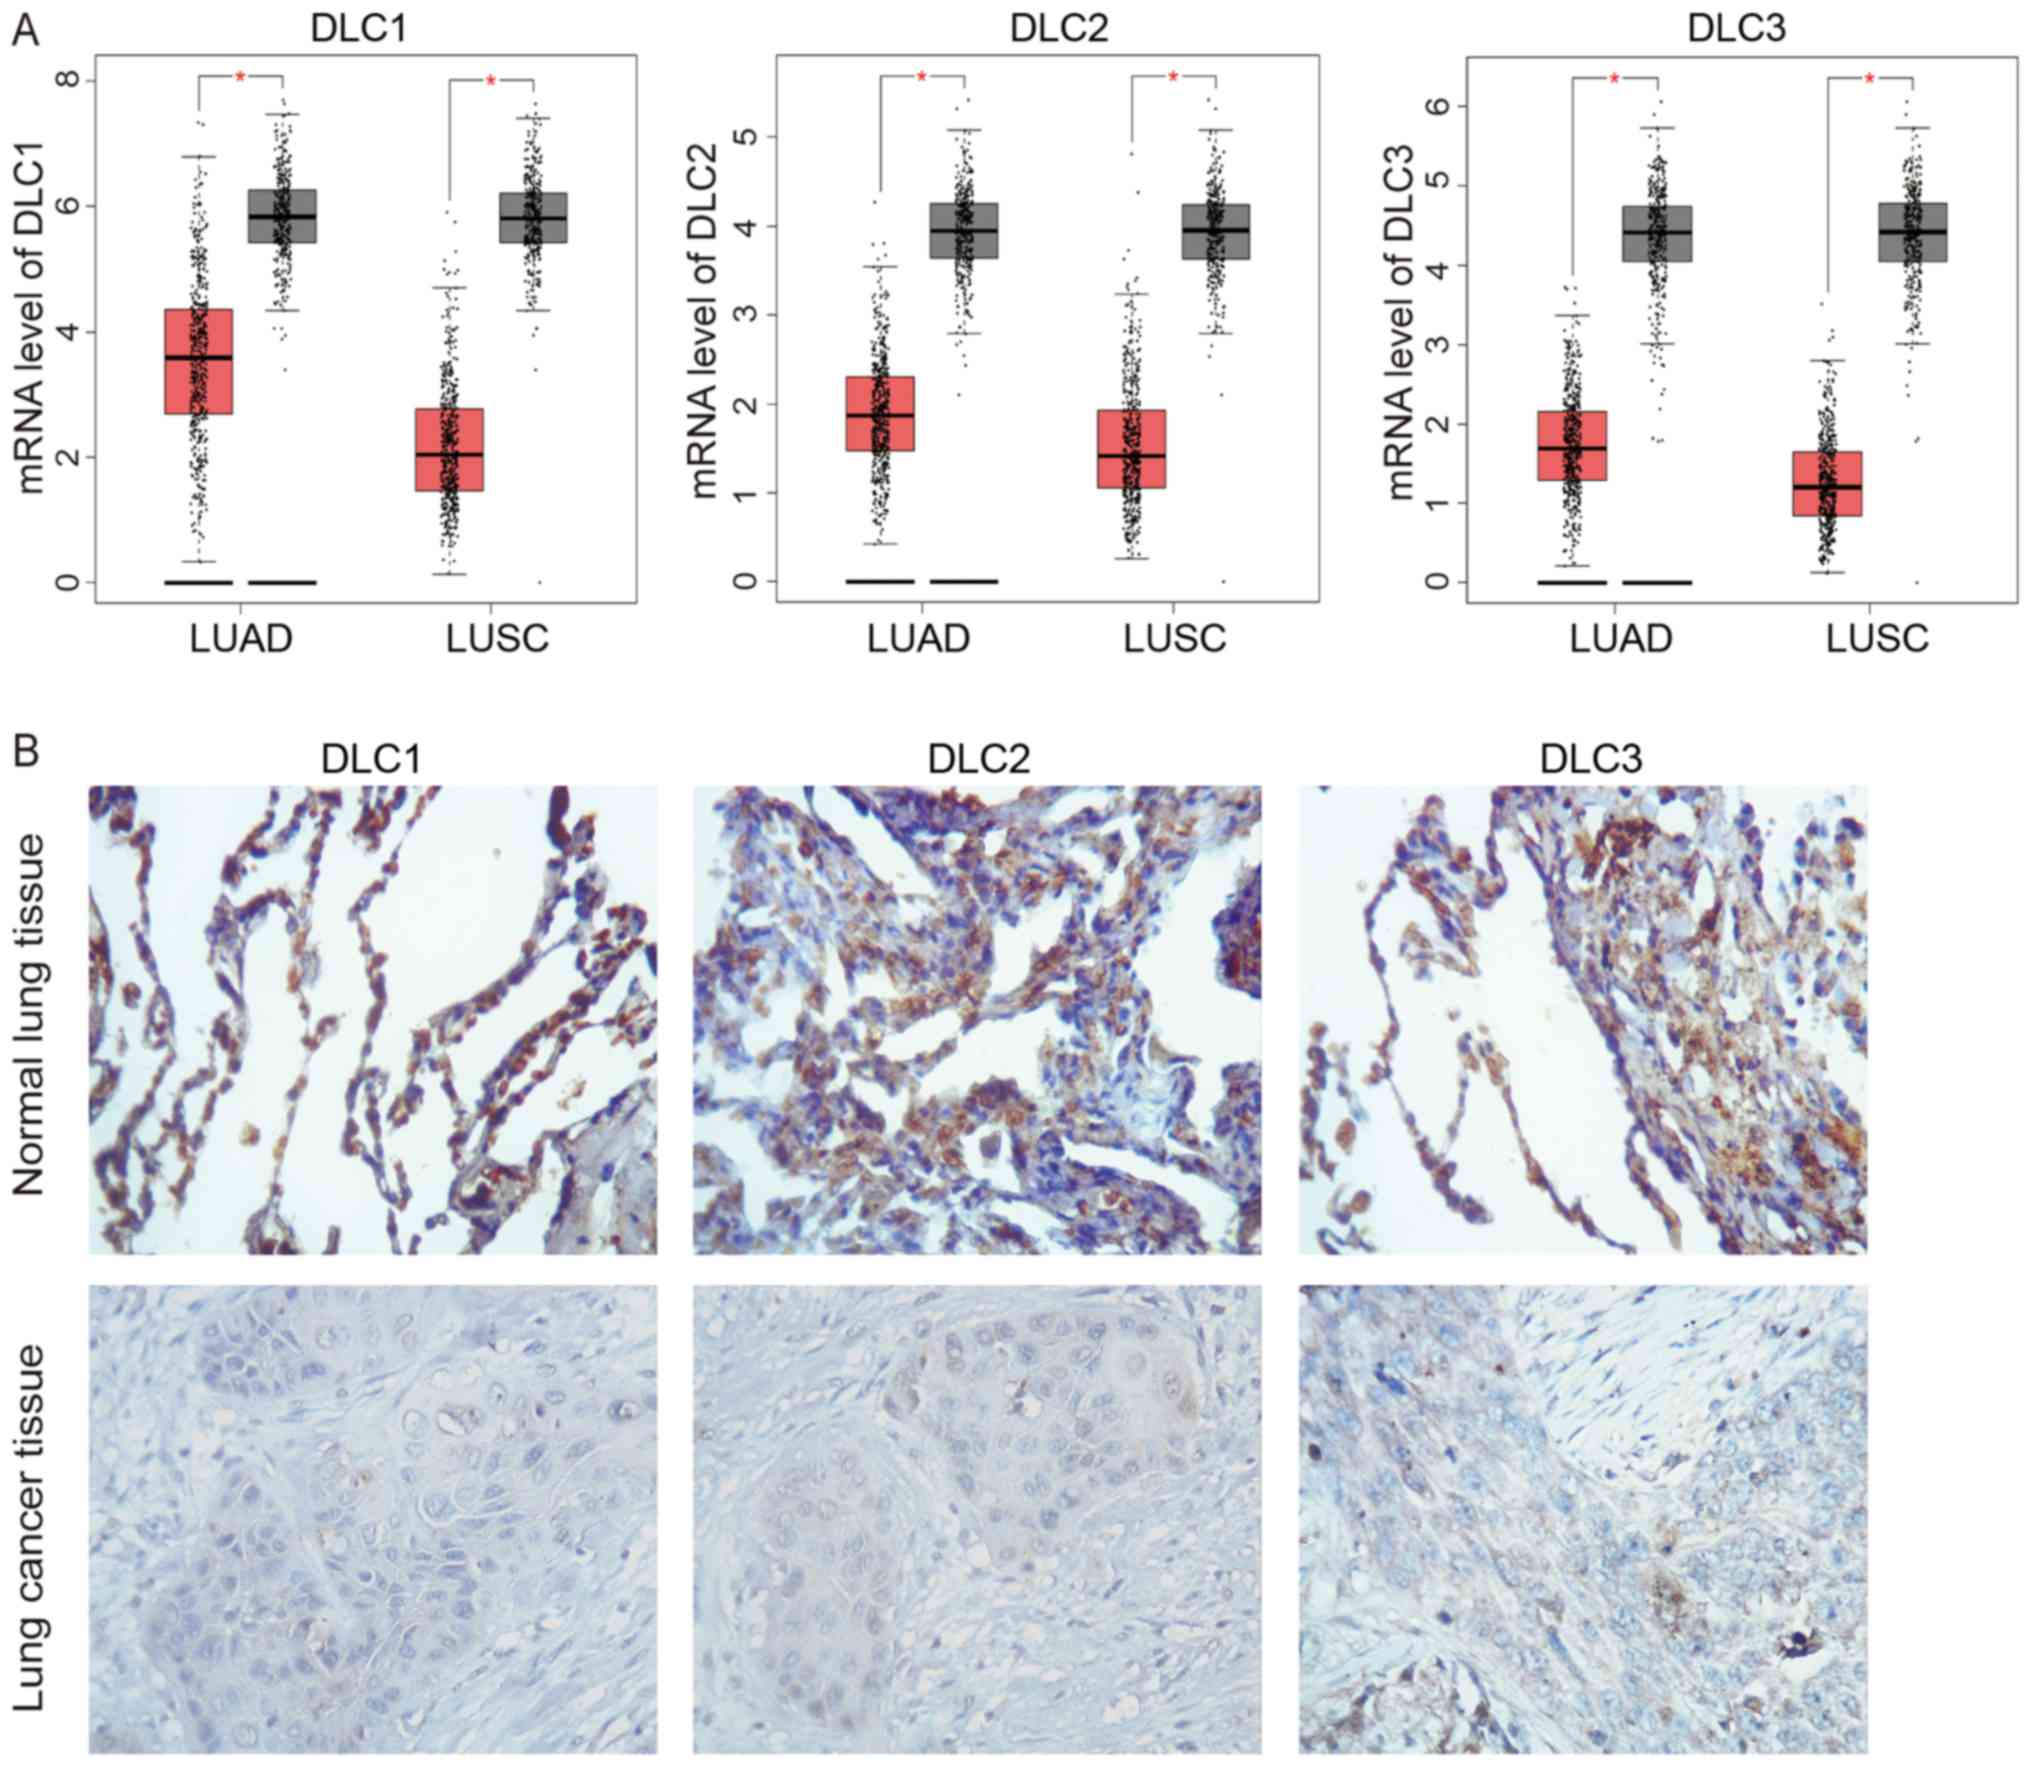 | Figure 1.Analysis of DLC expression in NSCLC
tissues. (A) Analysis of DLC expression in samples from The Cancer
Genome Atlas and Genotype-Tissue Expression databases analyzed by
GEPIA. The red and gray boxes represent tumor and normal tissues,
respectively. DLC1, DLC2, and DLC3 expression was lower in LUAD and
LUSC compared with normal tissues. LUAD, tumor n=483, normal n=347;
LUSC, tumor n=486, normal n=338. *P<0.01, as indicated. (B)
Immunohistochemical staining of DLC1, DLC2 and DLC3 in normal and
lung cancer tissues (magnification, ×100). DLC, deleted in liver
cancer; LUAD, lung adenocarcinoma; LUSC, lung squamous cell
carcinoma. |
Prognostic value of DLC in NSCLC
The prognostic value of DLC1, DLC2 and DLC3 in NSCLC
was assessed using the KM plotter database. Additionally, their
potential association with clinicopathological parameters was
investigated. The valid Affymetrix IDs in the KM plotter dataset of
DLC1, DLC2 and DLC3 are 210762_s_at, 213103_at and 206868_at,
respectively. Survival curves for the 20-year OS time were plotted
for the patients with NSCLC (n=1,926), with LUAD (n=720) and with
LUSC (n=524).
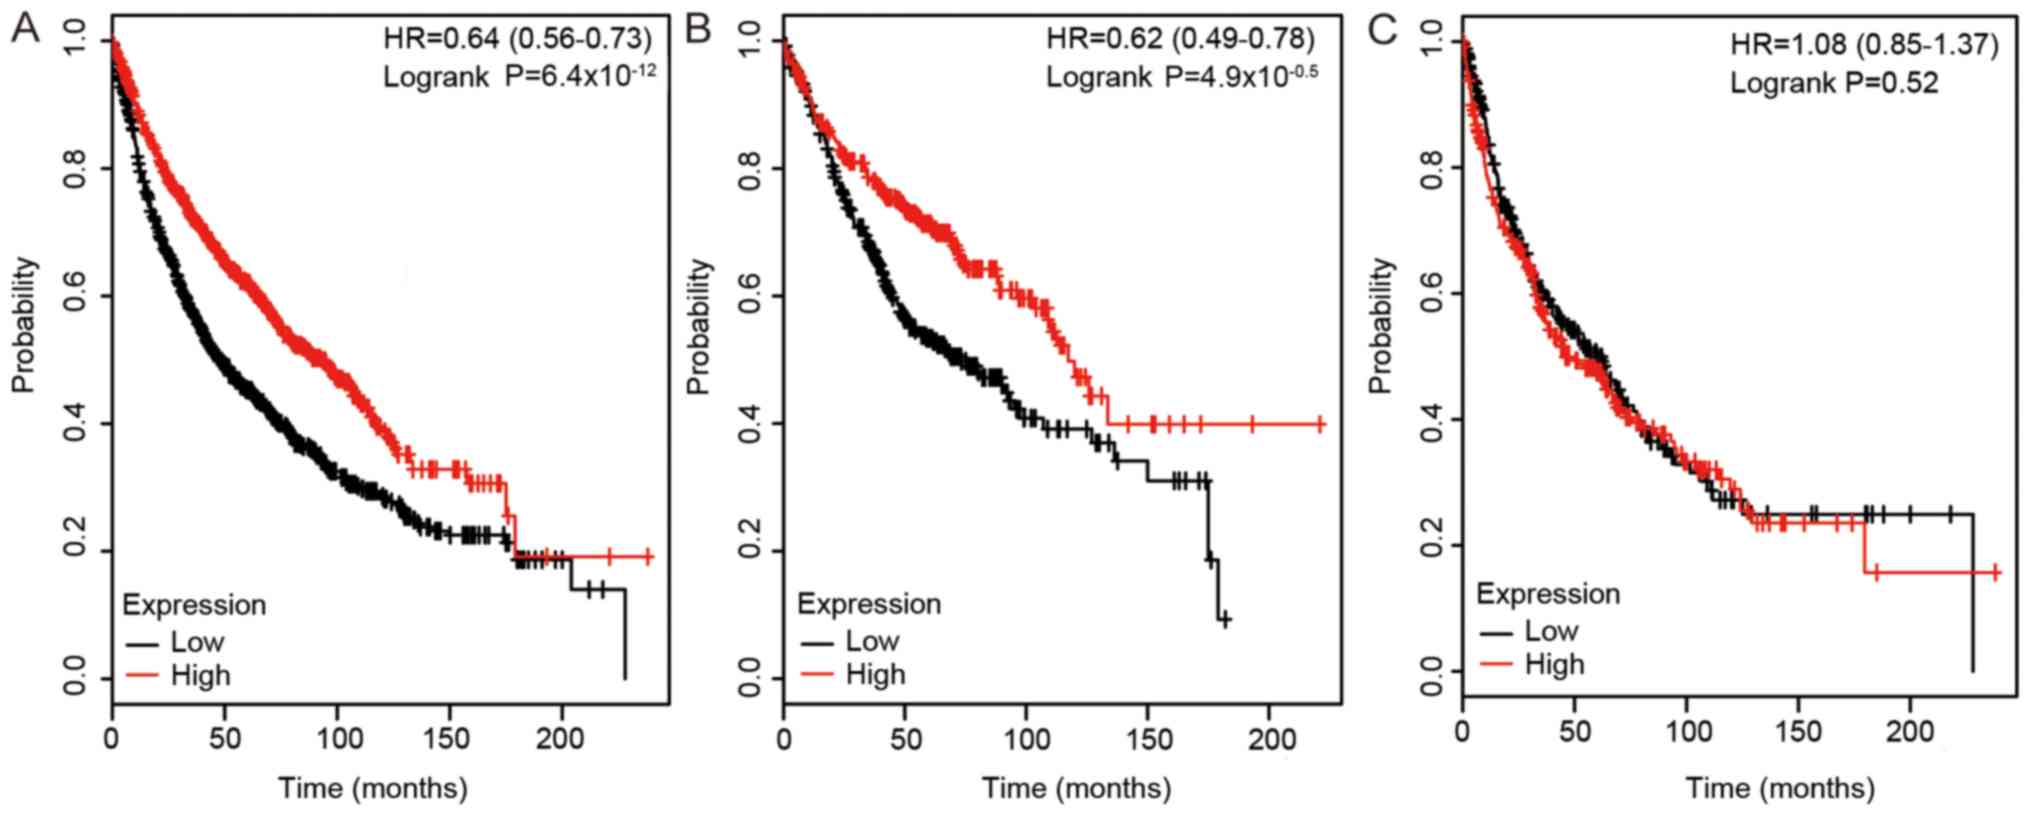
Effect of DLC1 expression on survival was assessed
using the KM plotter. As shown in Fig.
2, a high expression level of DLC1 was positively associated
with survival duration in all NSCLCs (HR, 0.64; 95% CI, 0.56–0.73;
P<0.0001). High expression level of DLC1 was also associated
with prolonged survival in patients with LUAD (HR, 0.62; 95% CI,
0.49–0.78; P<0.0001), but not in patients with LUSC. The
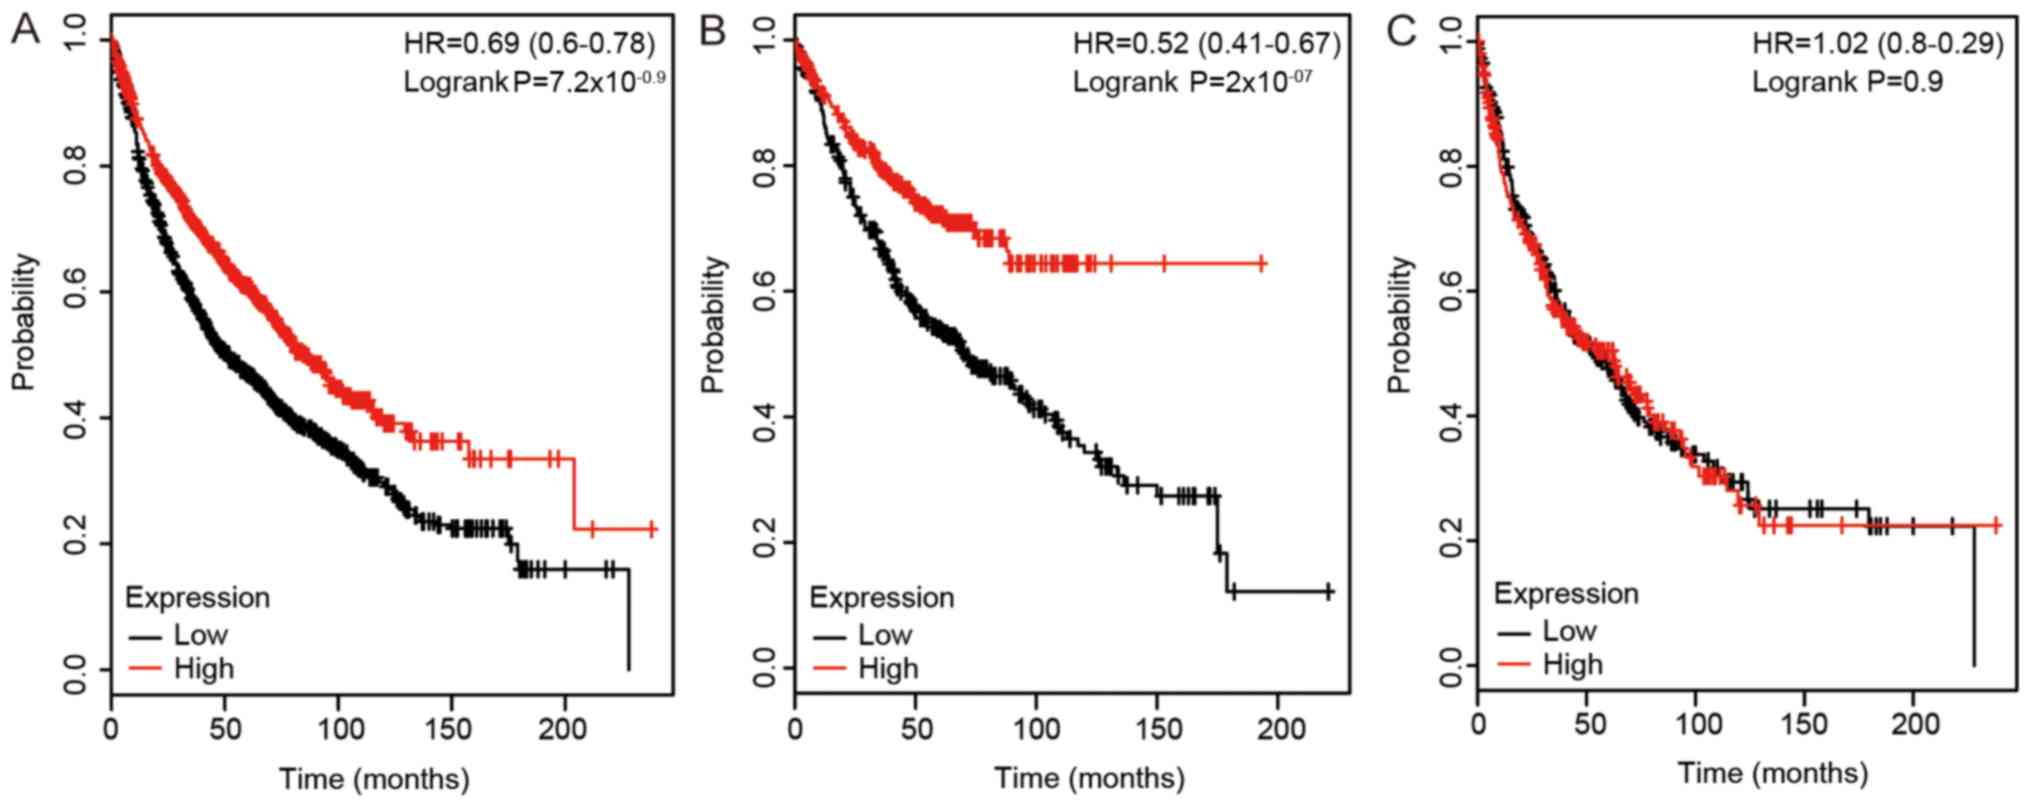
prognostic value of the expression level of DLC2 expression in lung
cancer was also investigated (Fig.
3). High mRNA expression of DLC2 was associated with improved
survival time in all lung cancers (HR, 0.69; 95% CI, 0.6–0.78;
P<0.0001). High mRNA expression of DLC2 was also associated with
improved OS in patients with LUAD (HR, 0.52; 95% CI, 0.41–0.67;
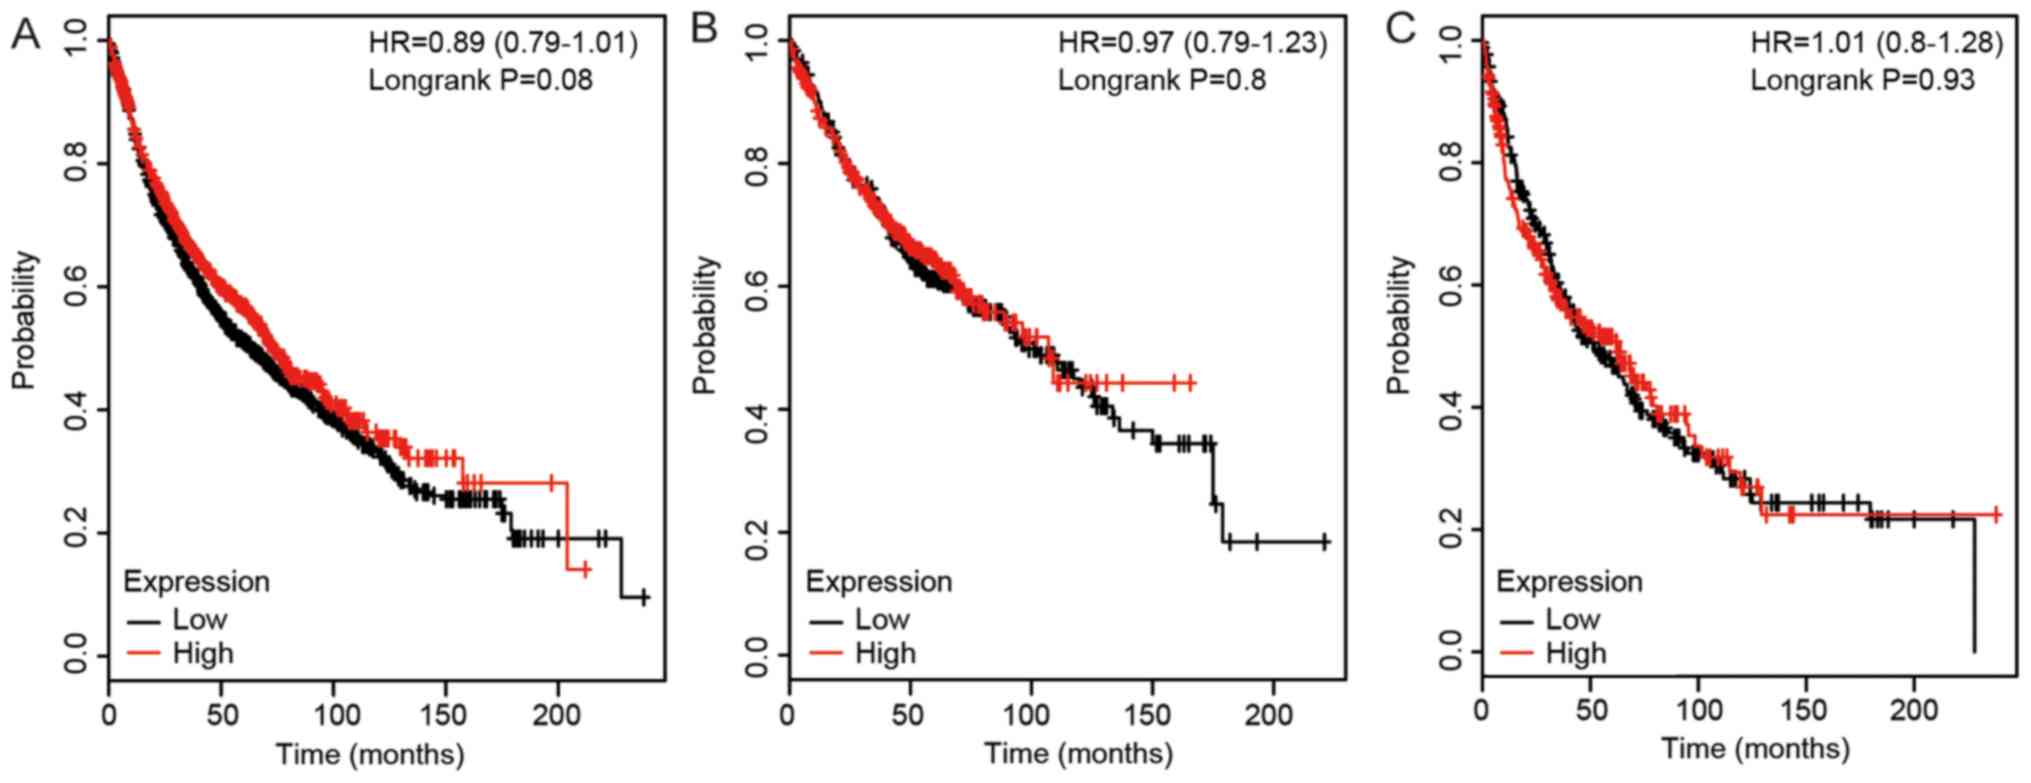
P<0.0001), but not in patients with LUSC. As shown in Fig. 4, a high expression level of DLC3
did not have a significant association with the survival rates in
patients with any of the lung cancer types analyzed (all
P>0.05).
The KM plotter was used to further investigate the
association of the expression levels of DLCs and several variables,
including smoking habits (Table
I), clinical stages (Table
II) and pathological grades (Table III). As shown in Table I, the mRNA expression level of DLC1
was significantly association with OS in patients with NSCLC who
smoked and those who never smoked (smoked, HR, 0.74; 95% CI,
0.6–0.91; P=0.0041; never smoked, HR, 0.23, 95% CI, 0.12–0.43,
P<0.0001). A high mRNA expression level of DLC2 was associated
with improved survival in patients with NSCLC who never smoked (HR,
0.49; 95% CI, 0.27–0.89; P=0.016). However, the mRNA expression
level of DLC3 was not associated with improved survival in patients
with NSCLC with different smoking habits. As seen in Table II, a high mRNA expression level of
DLC1 was associated with improved prognosis in patients with stage
1 NSCLC (HR, 0.44, 95% CI, 0.33–0.58; P<0.0001). A similar
result was observed for DLC2 (HR, 0.44; 95% CI, 0.33–0.59;
P<0.0001) and DLC3 (HR, 0.73; 95% CI, 0.55–0.97; P=0.028).
However, the mRNA expression levels of DLC1, DLC2 and DLC3 were not
associated with the OS in patients with stage 2 and NSCLC. As seen
in Table III, only DLC1 was
associated with an improved prognosis in patients with higher grade
NSCLC (grade II, HR=0.63; 95% CI, 0.46–0.87; P=0.0043; grade III,
HR, 0.44; 95% CI, 0.22–0.87; P=0.016).
 | Table I.Association of DLC with different
smoking history of patients with non-small cell lung cancer. |
Table I.
Association of DLC with different
smoking history of patients with non-small cell lung cancer.
| Gene | Smoking
history | No. of cases | Hazard ratio | 95% confidence
interval | P-value |
|---|
| DLC1 | Smoked | 820 | 0.74 | 0.60–0.91 | 0.0041a |
|
| Never smoked | 205 | 0.23 | 0.12–0.43 |
1.0000×10⁻⁶a |
| DLC2 | Smoked | 820 | 0.98 | 0.80–1.20 | 0.8300 |
|
| Never smoked | 205 | 0.49 | 0.27–0.89 | 0.0160a |
| DLC3 | Smoked | 820 | 1.12 | 0.91–1.37 | 0.2900 |
|
| Never smoked | 205 | 1.07 | 0.61–1.86 | 0.8100 |
| Table II.Association of DLC with different
clinical stages of patients with non-small cell lung cancer. |
Table II.
Association of DLC with different
clinical stages of patients with non-small cell lung cancer.
| Gene | Clinical stage | No. of cases | Hazard ratio | 95% confidence
interval | P-value |
|---|
| DLC1 | 1 | 577 | 0.44 | 0.33–0.58 |
5.200×10⁻⁹a |
|
| 2 | 244 | 1.03 | 0.71–1.48 | 0.880 |
|
| 3 | 70 | 1.04 | 0.60–1.79 | 0.890 |
| DLC2 | 1 | 577 | 0.44 | 0.33–0.59 |
2.200×10⁻⁸a |
|
| 2 | 244 | 0.73 | 0.50–1.06 | 0.100 |
|
| 3 | 70 | 1.02 | 0.60–1.75 | 0.940 |
| DLC3 | 1 | 577 | 0.73 | 0.55–0.97 | 0.028a |
|
| 2 | 244 | 1.28 | 0.89–1.85 | 0.180 |
|
| 3 | 70 | 1.09 | 0.63–1.88 | 0.760 |
| Table III.Association of DLC with different
pathological grades of patients with non-small cell lung
cancer. |
Table III.
Association of DLC with different
pathological grades of patients with non-small cell lung
cancer.
| Gene | Pathological
grade | No. of cases | Hazard ratio | 95% confidence
interval | P-value |
|---|
| DLC1 | I | 201 | 0.86 | 0.60–1.23 | 0.4000 |
|
| II | 310 | 0.63 | 0.46–0.87 | 0.0043a |
|
| III | 77 | 0.44 | 0.22–0.87 | 0.0160a |
| DLC2 | I | 201 | 0.89 | 0.62–1.27 | 0.5100 |
|
| II | 310 | 0.94 | 0.69–1.28 | 0.6900 |
|
| III | 77 | 0.89 | 0.46–1.71 | 0.7200 |
| DLC3 | I | 201 | 1.20 | 0.84–1.72 | 0.3200 |
|
| II | 310 | 0.75 | 0.54–1.03 | 0.0760 |
|
| III | 77 | 0.93 | 0.48–1.79 | 0.8200 |
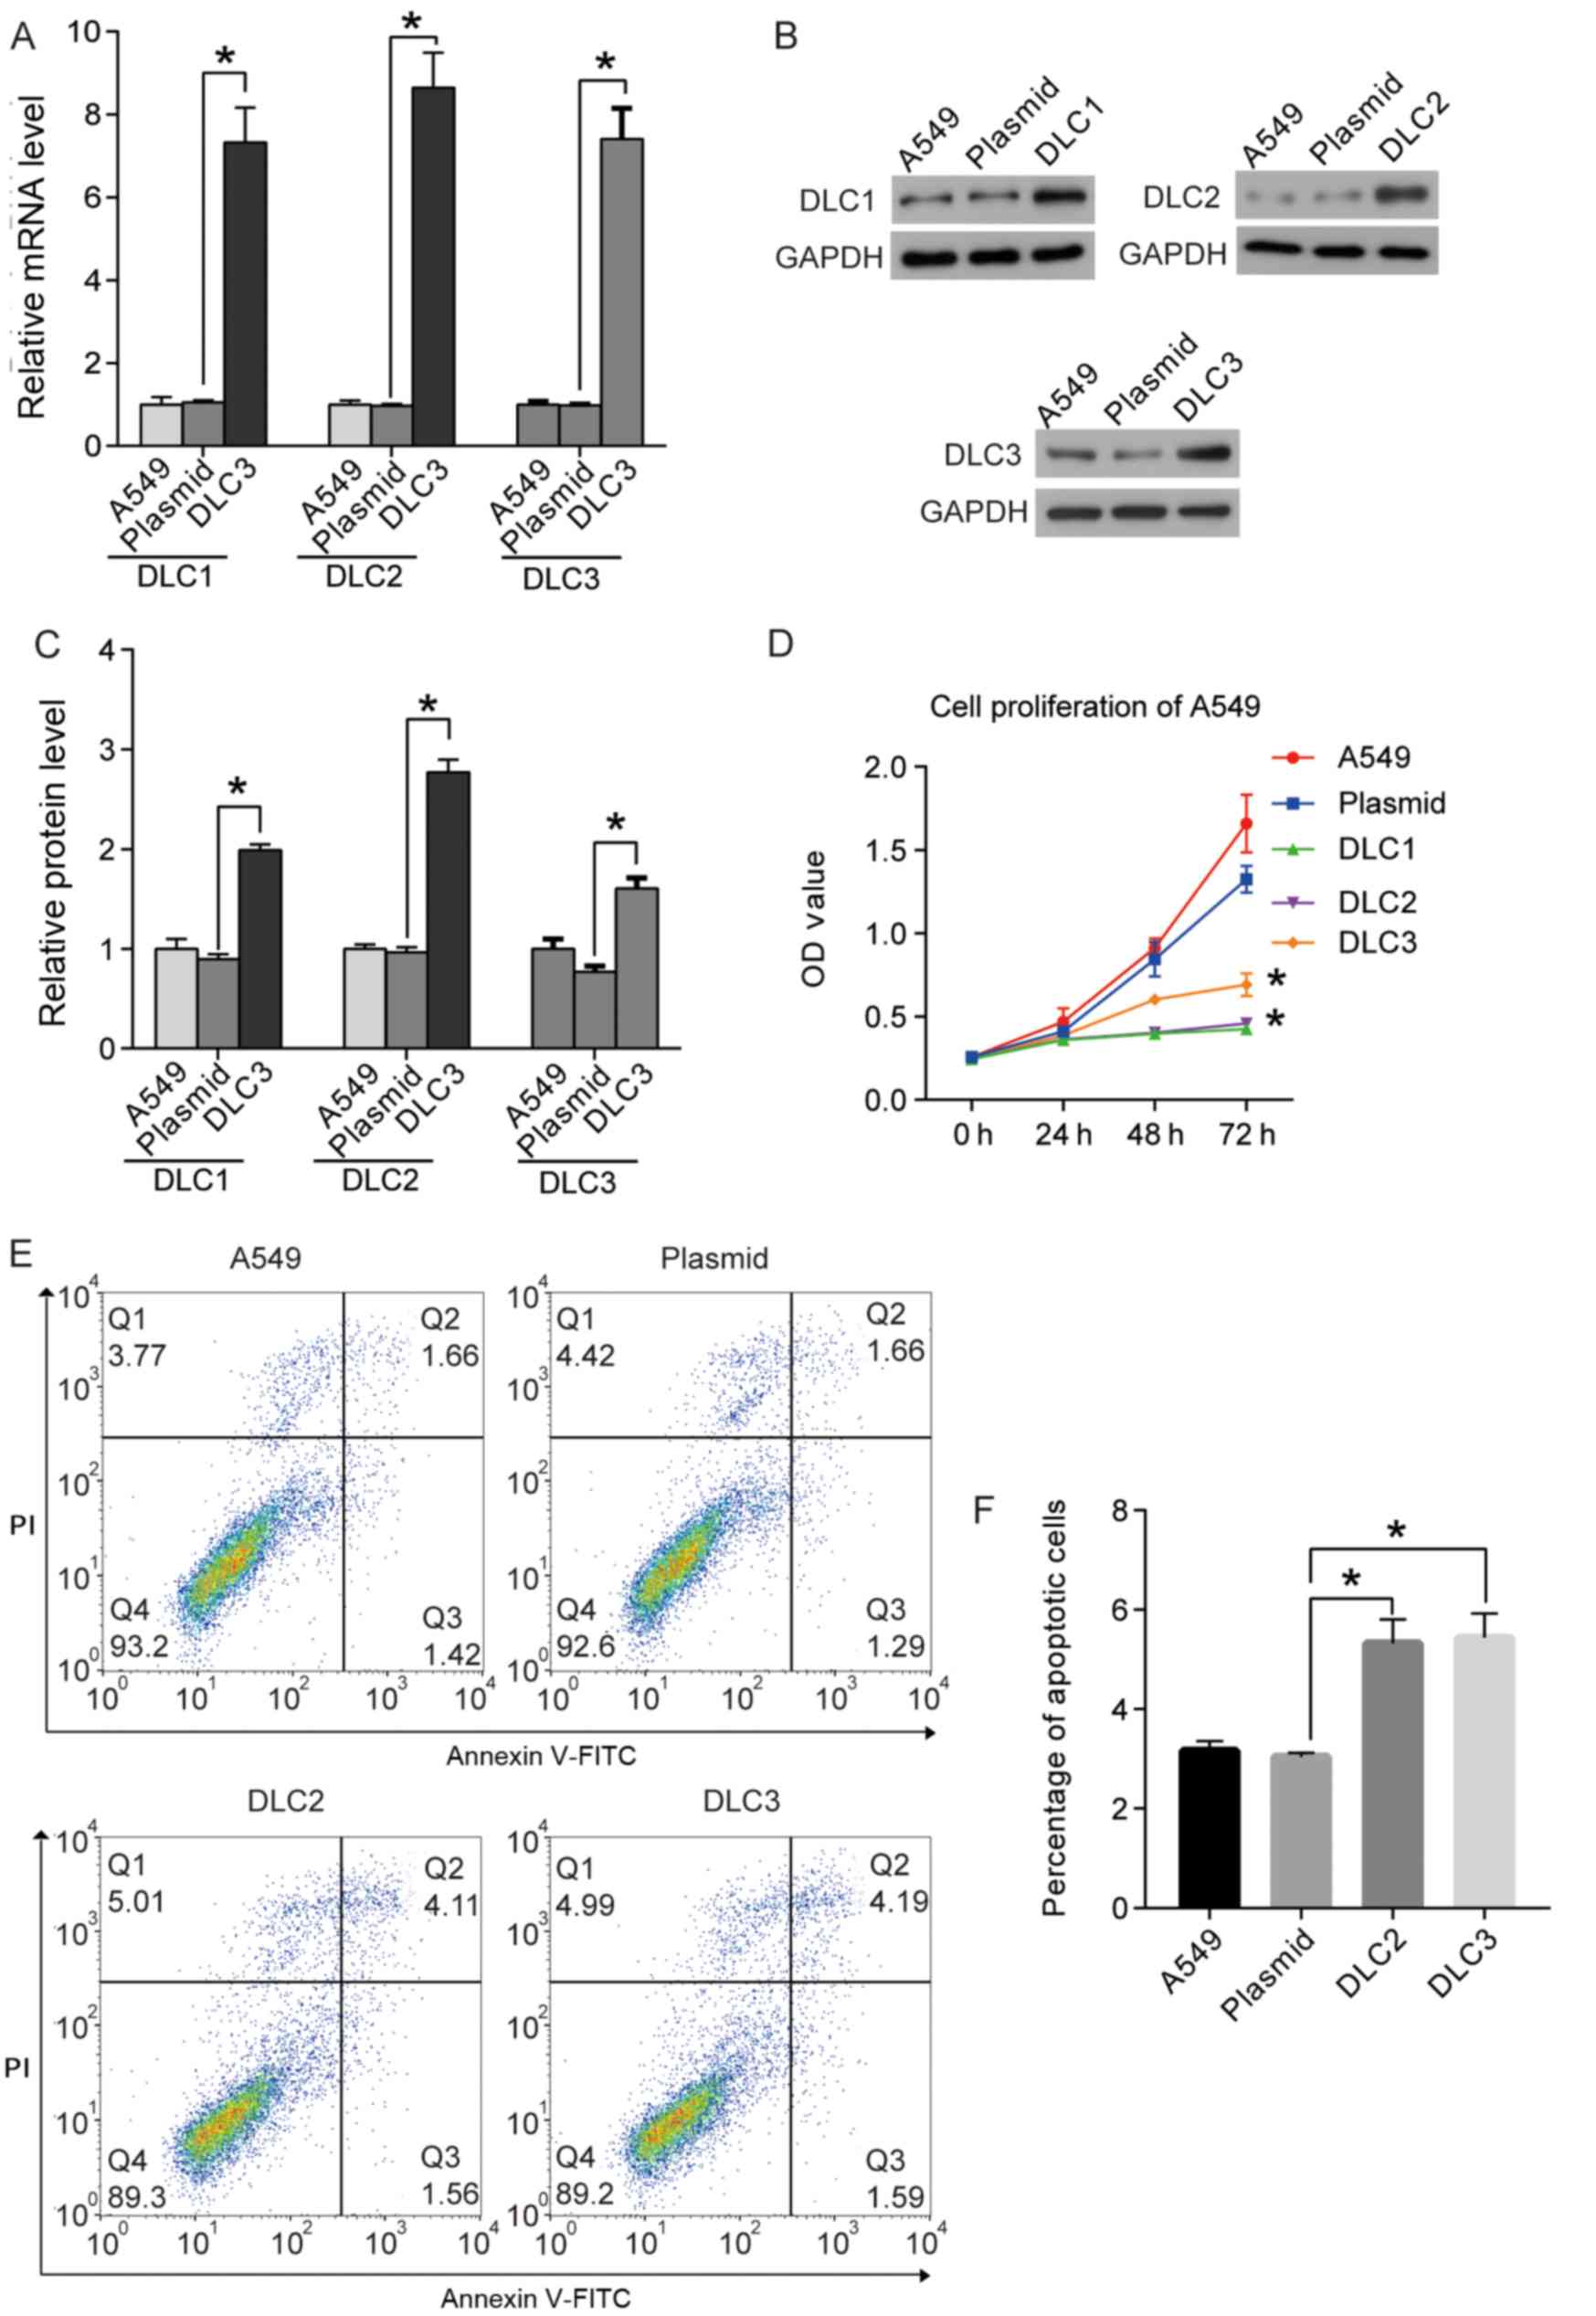
DLC1, DLC2, and DLC3 reduce the
proliferation of A549 cells
As the expression levels of DLC1, DLC2, and DLC3
were lower in NSCLC tissues compared with healthy tissues, and
their roles in NSCLC remained unclear, their effects on the
proliferation of the A549 cell line were investigated. Plasmids
expressing DLC1, DLC2 or DLC3 were used to transfect the cells, and
RT-qPCR and western blotting were used to demonstrate the
overexpression of DLCs in the cells (Fig. 5A-C). Following successful
transfection, the proliferation of the transfected cells was
assessed using the CCK8 assay. Cells transfected with empty
plasmids served as the negative control. As shown in Fig. 5D, overexpression of DLC1, DLC2 and
DLC3 decreased the proliferation of A549 cells compared with cells
transfected with the empty plasmid.
DLC2 and DLC3 promote apoptosis of
A549 cells
The upregulation of DLC1 was previously identified
to induce apoptosis in NSCLC cells (20). To further explore the roles of DLC2
and DLC3 on apoptosis in A549 cells, flow cytometry was performed.
The overexpression of DLC2 and DLC3 increased the percentage of
apoptotic cells compared with cells transfected with the plasmid
control. The results indicated that DLC2 and DLC3 may induce the
apoptosis of A549 cells in vitro (Fig. 5E and F).
Discussion
RhoGTPs are a family of small G-proteins that are
important regulators of the actin cytoskeleton at the cell surface.
Additionally, RhoGTPs regulate the cell cycle, cell migration,
polarization, malignant transformation, invasion and metastasis
(21). The DLC tumor suppressor
proteins are members of the RhoGAP family that promote catalysis of
GTP to GDP to inactivate RhoA (22).
DLC proteins are generally unstable in cells, and
are expressed at low levels or deleted in various types of cancer
(23–25). The DLC subfamily is composed of
three members (DLC1, 2 and 3) with highly conserved amino acid
sequences. The proteins contain three domains: i) RhoGAP domain;
ii) sterile α motif (SAM) domain; and iii) StAR-related lipid
transfer (START) domains (26).
Previous studies have revealed that the RhoGAP domain in DLC
proteins serves an important role in the inhibition of tumors
(27,28). The RhoGAP domain enhances GTP
hydrolysis of the RhoGTP family members, RhoA, cell division cycle
42 (Cdc42), RhoB and RhoC, acting as a negative regulator of
RhoGTPs (which are inactive when GDP-bound). The SAM domain may
also serve as a negative intramolecular regulator in RhoGAPs
(27,29). The START domain binds to lipids,
aiding the localization of DLC1 on cell adhesion plaques, which is
required for DLC1 to exert its tumor suppressor role. However, the
specific role of the START domain requires further investigation
(20,30).
DLC1 is the most well investigated member of the DLC
protein subfamily (31,32). Yuan et al (33) isolated the full-length cDNA of DLC1
by representational difference analysis in human primary
hepatocellular carcinomas (HCCs) and HCC cell lines. DLC1, a
well-known tumor suppressor gene located in the 8p21.3-p22 region
of the human chromosome eight, has been previously reported to be
associated with the occurrence of a number of malignant tumors,
including gastric, colorectal and breast cancer as well as NSCLC
(32,34). Through extensive genome screening,
DLC1 has been suggested to be a significant susceptibility gene for
NSCLC (35); however, clinical
evidence for its application as a prognostic indicator is
limited.
The present study investigated the prognostic value
of DLC1 in NSCLC, and the results obtained demonstrated that a high
expression level of DLC1 indicated improved survival. A previous
study, using pull down analyses with the GTP-binding fragment of
the RhoA effector, Rhotekin, revealed that reduced DLC1 transcript
expression levels in NSCLC resulted in reduced RhoA-GTP levels
in vivo (36). A previous
study revealed that overexpression of DLC1 not only resulted in
morphological alterations that manifested as cytoplasmic extensions
and membrane blebbing, but also inhibited tumor cell proliferation
and migration, increasing the apoptosis of NSCLC cells in
vitro (20). Furthermore, DLC1
suppresses tumor cell growth and invasion by RhoGAP-dependent and
independent mechanisms in NSCLC (27).
Several genes are involved in the regulation of DLC1
anti-tumor activity in the RhoGAP-dependent mechanism (37,38).
Caveolin-1 is one of these genes and it forms a complex with DLC1
by interacting with its START domain (37). The proinflammatory S100 calcium
binding protein A10 also binds to DLC1 and inhibits cell migration,
invasion and anchorage-independent growth in NSCLC (38). The present study demonstrated the
prognostic role of DLC1 at the clinical sample level, suggesting
that DLC1 is not only a tumor suppressor gene, but also a potential
prognostic marker in NSCLC.
DLC2 was successfully cloned in 2003 and has a
similar protein structure to DLC1 (25). Ullmannova and Popescu (39) reported low-expression of DLC2 in
lung, renal, ovarian, breast, gastric, uterine, colon and rectal
tumors for the first time using cancer-profiling arrays. Related
research revealed that DLC2 was downregulated in a variety of
tumors and that it inhibited the growth of tumor cells through its
RhoGAP domain (40). The present
study revealed that low expression of DLC2 was associated with
survival in NSCLC.
In a number of related studies, DLC2 was reported to
be associated with the development and metastasis of tumor cells.
Tang et al (41) revealed
that DLC2 mRNA is a direct target of microRNA (miR)-125b, and that
the activation of DLC2 may be responsible for the metastasis
induced by miR-125b in breast cancer cells. A previous study
revealed that DLC2 is a central component of a signaling network
that guides spindle positioning, cell-cell adhesion and mitotic
fidelity (42). However, studies
on the role of DLC2 in NSCLC remain limited. Thus the present study
investigated the effect of DLC2 through its overexpression in A549
cells and revealed that DLC2 inhibits the proliferation of A549
cells, suggesting its potential role as a tumor suppressor in human
NSCLC.
DLC3 is a tumor suppressor gene similar to DLC1 and
DLC2 (43); however, the molecular
function of DLC3 remains poorly understood. DLC3 is located on
chromosome Xq13 and the protein localizes to focal adhesions. DLC3
acts as a GAP for RhoA and Cdc42 in vitro; its GAP activity
is responsible for the morphological changes observed in Hela
cells, which become round following disruption of the actin fibers
(44). Hendrick and Olayioye
(45) revealed that the
interaction between DLC3 and Scribble planar cell polarity protein
is essential for junctional DLC3 recruitment, and serves as a local
regulator of RhoA-Rho-associated protein kinase signaling, which
regulates adherens junction integrity and Scribble localization.
Another study revealed that DLC3 is a Rho-specific GAP protein
(46).
Braun et al (47), reported that loss of DLC3 inhibited
the degradation of epidermal growth factor receptor (EGFR),
increasing the activity of the EGFR signaling pathway.
Additionally, Braun et al (47), showed that knockdown of DLC3
decreased the expression level of N-cadherin on the cell surface
and decreased cell aggregation. In the current study, DLC3 was
downregulated in patients with NSCLC, and a high expression level
of DLC3 was associated with an improved prognosis in patients with
stage 1 NSCLC. Furthermore, DLC3 overexpression in vitro
inhibited proliferation and promoted apoptosis of A549 cells,
suggesting the role of DLC3 as a tumor suppressor gene in NSCLC. As
DLC1, DLC2 and DLC3 are all downregulated in NSCLC and have similar
domains, they may share the same signaling mechanisms involved in
their tumor suppressor function. However, the specific molecular
mechanism underlying their actions requires further
elucidation.
The present study revealed that DLC1 and DLC2 are
associated with prognosis in patients with NSCLC. Furthermore, the
current study demonstrated the lower expression levels of DLC1,
DLC2 and DLC3 in patients with NSCLC compared with normal controls,
suggesting that DLC1-3 may serve negative roles in the progression
of human NSCLC cells. The present results provided novel insights
on the roles of the DLC members in NSCLC. Furthermore, in addition
to DLC1, DLC2 and DLC3 may represent novel potential therapeutic
targets for the treatment of NSCLC.
Acknowledgements
Not applicable.
Funding
No funding was received.
Availability of data and materials
The data and materials are available from the
corresponding author on reasonable request.
Authors' contributions
LS and JDS designed the study. LS and JS performed
all the experiments and analyzed the data. JDS wrote the
manuscript.
Ethics approval and consent to
participate
The present study was approved by The Ethics
Committee of Zaozhuang Municipal Hospital (approval no.
2016ZMHE011) and all patients signed informed consent.
Patient consent for publication
Not applicable.
Competing interests
The authors declare that they have no competing
interests.
References
|
1
|
Herbst RS, Heymach JV and Lippman SM: Lung
cancer. N Engl J Med. 359:1367–1380. 2008. View Article : Google Scholar : PubMed/NCBI
|
|
2
|
Travis WD, Travis LB and Devesa SS: Lung
cancer. Cancer. 75 (Suppl 1):S191–S202. 1995. View Article : Google Scholar
|
|
3
|
Yu DP, Bai LQ, Xu SF, Han M and Wang ZT:
Impact of TNM staging and treatment mode on the prognosis of
non-small cell lung cancer. Zhonghua Zhong Liu Za Zhi. 31:465–468.
2009.(In Chinese). PubMed/NCBI
|
|
4
|
Quejada MI and Albain KS: Prognostic
factors in non-small cell lung cancer. 2004. View Article : Google Scholar
|
|
5
|
Putila J, Remick SC and Guo NL: Combining
clinical, pathological, and demographic factors refines prognosis
of lung cancer: A population-based study. PLoS One. 6:e174932011.
View Article : Google Scholar : PubMed/NCBI
|
|
6
|
Minamiya Y, Miura M, Hinai Y, Saito H, Ito
M, Imai K, Ono T, Motoyama S and Ogawa J: The CRP 1846T/T genotype
is associated with a poor prognosis in patients with non-small cell
lung cancer. Tumour Biol. 31:673–679. 2010. View Article : Google Scholar : PubMed/NCBI
|
|
7
|
Garon EB, Rizvi NA, Hui R, Leighl N,
Balmanoukian AS, Eder JP, Patnaik A, Aggarwal C, Gubens M, Horn L,
et al: Pembrolizumab for the treatment of non-small-cell lung
cancer. N Engl J Med. 372:2018–2028. 2015. View Article : Google Scholar : PubMed/NCBI
|
|
8
|
Asamura H, Chansky K, Crowley J, Goldstraw
P, Rusch VW, Vansteenkiste JF, Watanabe H, Wu YL, Zielinski M, Ball
D, et al: The International Association for the study of lung
cancer lung cancer staging project: Proposals for the revision of
the N descriptors in the forthcoming 8th edition of the TNM
classification for lung cancer. J Thorac Oncol. 10:1675–1684. 2015.
View Article : Google Scholar : PubMed/NCBI
|
|
9
|
Ko C: Molecular regulation of deleted in
liver cancer (DLC) protein family. The University of Hong Kong;
Pokfulam, Hong Kong: 2009, View Article : Google Scholar
|
|
10
|
Chan L: Protein interaction and the
subcellular localization control of the deleted in liver cancer
(DLC) family protein. Hku Theses Online. 2008.
|
|
11
|
Basak P, Dillon R, Leslie H, Raouf A and
Mowat MR: The deleted in liver Cancer 1 (Dlc1) tumor suppressor is
haploinsufficient for mammary gland development and epithelial cell
polarity. BMC Cancer. 15:6302015. View Article : Google Scholar : PubMed/NCBI
|
|
12
|
Song LJ, Liu Q, Meng XR, Li SL, Wang LX,
Fan QX and Xuan XY: DLC-1 is an independent prognostic marker and
potential therapeutic target in hepatocellular cancer. Diagn
Pathol. 11:192016. View Article : Google Scholar : PubMed/NCBI
|
|
13
|
Ortega CE, Seidner Y and Dominguez I:
Mining CK2 in cancer. PLoS One. 9:e1156092014. View Article : Google Scholar : PubMed/NCBI
|
|
14
|
Dötsch MM, Kloten V, Schlensog M, Heide T,
Braunschweig T, Veeck J, Petersen I, Knüchel R and Dahl E: Low
expression of ITIH5 in adenocarcinoma of the lung is associated
with unfavorable patients' outcome. Epigenetics. 10:903–912. 2015.
View Article : Google Scholar : PubMed/NCBI
|
|
15
|
Tilghman SL, Townley I, Zhong Q, Carriere
PP, Zou J, Llopis SD, Preyan LC, Williams CC, Skripnikova E,
Bratton MR, et al: Proteomic signatures of acquired letrozole
resistance in breast cancer: Suppressed estrogen signaling and
increased cell motility and invasiveness. Mol Cell Proteomics.
12:2440–2455. 2013. View Article : Google Scholar : PubMed/NCBI
|
|
16
|
Zhang S, Wang Z, Liu W, Lei R, Shan J, Li
L and Wang X: Distinct prognostic values of S100 mRNA expression in
breast cancer. Sci Rep. 7:397862017. View Article : Google Scholar : PubMed/NCBI
|
|
17
|
Tang Z, Li C, Kang B, Gao G, Li C and
Zhang Z: GEPIA: A web server for cancer and normal gene expression
profiling and interactive analyses. Nucleic Acids Res. 45:W98–W102.
2017. View Article : Google Scholar : PubMed/NCBI
|
|
18
|
Li M, Li S, Liu B, Gu MM, Zou S, Xiao BB,
Yu L, Ding WQ, Zhou PK, Zhou J and Shang ZF: PIG3 promotes NSCLC
cell mitotic progression and is associated with poor prognosis of
NSCLC patients. J Exp Clin Cancer Res. 36:392017. View Article : Google Scholar : PubMed/NCBI
|
|
19
|
Livak KJ and Schmittgen TD: Analysis of
relative gene expression data using real-time quantitative PCR and
the 2(-Delta Delta C(T)) method. Methods. 25:402–408. 2001.
View Article : Google Scholar : PubMed/NCBI
|
|
20
|
Yuan BZ, Jefferson AM, Millecchia L,
Popescu NC and Reynolds SH: Morphological changes and nuclear
translocation of DLC1 tumor suppressor protein precede apoptosis in
human non-small cell lung carcinoma cells. Exp Cell Res.
313:3868–3880. 2007. View Article : Google Scholar : PubMed/NCBI
|
|
21
|
Bokoch GM, Bohl BP and Chuang TH: Guanine
nucleotide exchange regulates membrane translocation of Rac/Rho
GTP-binding proteins. J Biol Chem. 269:31674–31679. 1994.PubMed/NCBI
|
|
22
|
Goodison S, Yuan J, Sloan D, Kim R, Li C,
Popescu NC and Urquidi V: The RhoGAP protein DLC-1 functions as a
metastasis suppressor in breast cancer cells. Cancer Res.
65:6042–6053. 2005. View Article : Google Scholar : PubMed/NCBI
|
|
23
|
Liao YC and Su HL: Deleted in liver
cancer-1 (DLC-1): A tumor suppressor not just for liver. Int J
Biochem Cell Biol. 40:843–847. 2008. View Article : Google Scholar : PubMed/NCBI
|
|
24
|
Durkin ME, Ullmannova V, Guan M and
Popescu NC: Deleted in liver cancer 3 (DLC-3), a novel Rho
GTPase-activating protein, is downregulated in cancer and inhibits
tumor cell growth. Oncogene. 26:4580–4589. 2007. View Article : Google Scholar : PubMed/NCBI
|
|
25
|
Ching YP, Wong CM, Chan SF, Leung TH, Ng
DC, Jin DY and Ng IO: Deleted in liver cancer (DLC) 2 encodes a
RhoGAP protein with growth suppressor function and is
underexpressed in hepatocellular carcinoma. J Biol Chem.
278:10824–10830. 2003. View Article : Google Scholar : PubMed/NCBI
|
|
26
|
Zhong D, Zhang J, Yang S, Soh UJ,
Buschdorf JP, Zhou YT, Yang D and Low BC: The SAM domain of the
RhoGAP DLC1 binds EF1A1 to regulate cell migration. J Cell Sci.
122:414–424. 2009. View Article : Google Scholar : PubMed/NCBI
|
|
27
|
Healy KD, Hodgson L, Kim TY, Shutes A,
Maddileti S, Juliano RL, Hahn KM, Harden TK, Bang YJ and Der CJ:
DLC-1 suppresses non-small cell lung cancer growth and invasion by
RhoGAP-dependent and independent mechanisms. Mol Carcinog.
47:326–337. 2008. View
Article : Google Scholar : PubMed/NCBI
|
|
28
|
Leung TH, Ching YP, Yam JW, Wong CM, Yau
TO, Jin DY and Ng IO: Deleted in liver cancer 2 (DLC2) suppresses
cell transformation by means of inhibition of RhoA activity. Proc
Natl Acad Sci USA. 102:15207–15212. 2005. View Article : Google Scholar : PubMed/NCBI
|
|
29
|
Kim TY, Lee JW, Kim HP, Jong HS, Kim TY,
Jung M and Bang YJ: DLC-1, a GTPase-activating protein for Rho, is
associated with cell proliferation, morphology, and migration in
human hepatocellular carcinoma. Biochem Biophys Res Commun.
355:72–77. 2007. View Article : Google Scholar : PubMed/NCBI
|
|
30
|
Durkin ME, Avner MR, Huh CG, Yuan BZ,
Thorgeirsson SS and Popescu NC: DLC-1, a Rho GTPase-activating
protein with tumor suppressor function, is essential for embryonic
development. FEBS Lett. 579:1191–1196. 2005. View Article : Google Scholar : PubMed/NCBI
|
|
31
|
Wang D, Qian X, Rajaram M, Durkin ME and
Lowy DR: DLC1 is the principal biologically-relevant down-regulated
DLC family member in several cancers. Oncotarget. 7:45144–45157.
2016.PubMed/NCBI
|
|
32
|
Wu PP, Zhu HY, Sun XF, Chen LX, Zhou Q and
Chen J: MicroRNA-141 regulates the tumour suppressor DLC1 in
colorectal cancer. Neoplasma. 62:705–712. 2015. View Article : Google Scholar : PubMed/NCBI
|
|
33
|
Yuan BZ, Miller MJ, Keck CL, Zimonjic DB,
Thorgeirsson SS and Popescu NC: Cloning, characterization, and
chromosomal localization of a gene frequently deleted in human
liver cancer (DLC-1) homologous to rat RhoGAP. Cancer Res.
58:2196–2199. 1998.PubMed/NCBI
|
|
34
|
Park H, Cho SY, Kim H, Na D, Han JY, Chae
J, Park C, Park OK, Min S, Kang J, et al: Genomic alterations in
BCL2L1 and DLC1 contribute to drug sensitivity in gastric cancer.
Proc Natl Acad Sci USA. 112:12492–12497. 2015. View Article : Google Scholar : PubMed/NCBI
|
|
35
|
Feng H, Zhang Z, Wang X and Liu D:
Identification of DLC-1 expression and methylation status in
patients with non-small-cell lung cancer. Mol Clin Oncol.
4:249–254. 2016. View Article : Google Scholar : PubMed/NCBI
|
|
36
|
Healy KD, Tai YK, Shutes AT, Bang YJ,
Juliano RL and Der CJ: RhoGAP DLC-1 tumor suppression and aberrant
Rho GTPase activation in lung cancer. Cancer Res. 66:2006.
|
|
37
|
Du X, Qian X, Papageorge A, Schetter AJ,
Vass WC, Liu X, Braverman R, Robles AI and Lowy DR: Functional
interaction of tumor suppressor DLC1 and caveolin-1 in cancer
cells. Cancer Res. 72:4405–4416. 2012. View Article : Google Scholar : PubMed/NCBI
|
|
38
|
Yang X, Popescu NC and Zimonjic DB: DLC1
interaction with S100A10 mediates inhibition of in vitro cell
invasion and tumorigenicity of lung cancer cells through a
RhoGAP-independent mechanism. Cancer Res. 71:2916–2925. 2011.
View Article : Google Scholar : PubMed/NCBI
|
|
39
|
Ullmannova V and Popescu NC: Expression
profile of the tumor suppressor genes DLC-1 and DLC-2 in solid
tumors. Int J Oncol. 29:1127–1132. 2006.PubMed/NCBI
|
|
40
|
de Tayrac M, Etcheverry A, Aubry M,
Saïkali S, Hamlat A, Quillien V, Le Treut A, Galibert MD and Mosser
J: Integrative genome-wide analysis reveals a robust genomic
glioblastoma signature associated with copy number driving changes
in gene expression. Genes Chromosomes Cancer. 48:55–68. 2009.
View Article : Google Scholar : PubMed/NCBI
|
|
41
|
Tang F, Zhang R, He Y, Zou M, Guo L and Xi
T: MicroRNA-125b induces metastasis by targeting STARD13 in MCF-7
and MDA-MB-231 breast cancer cells. PLoS One. 7:e354352012.
View Article : Google Scholar : PubMed/NCBI
|
|
42
|
Vitiello E, Ferreira JG, Maiato H, Balda
MS and Matter K: The tumour suppressor DLC2 ensures mitotic
fidelity by coordinating spindle positioning and cell-cell
adhesion. Nat Commun. 5:58262014. View Article : Google Scholar : PubMed/NCBI
|
|
43
|
Wolosz D, Szparecki G, Wolinska E and
Gornicka B: DLC3 expression in hepatocellular carcinoma. J Pre Clin
Clin Res. 9:105–108. 2015. View Article : Google Scholar
|
|
44
|
Kawai K, Kiyota M, Seike J, Deki Y and
Yagisawa H: START-GAP3/DLC3 is a GAP for RhoA and Cdc42 and is
localized in focal adhesions regulating cell morphology. Biochem
Biophys Res Commun. 364:783–789. 2007. View Article : Google Scholar : PubMed/NCBI
|
|
45
|
Hendrick J and Olayioye MA: Spatial Rho
regulation: Molecular mechanisms controlling the GAP protein DLC3.
Small GTPases. 1–7. 2016.PubMed/NCBI
|
|
46
|
Braun AC, Hendrick J, Eisler SA, Schmid S,
Hausser A and Olayioye MA: The Rho-specific GAP protein DLC3
coordinates endocytic membrane trafficking. J Cell Sci.
128:1386–1399. 2015. View Article : Google Scholar : PubMed/NCBI
|
|
47
|
Braun AC: Regulation of endocytic membrane
trafficking by the GTPase-activating protein deleted in liver
cancer 3 (DLC3). Uni Stuttgart. 2015.
|