Introduction
Numerous biochemical factors influence the
extracellular microenvironment, including hormones and small
molecules. Additionally, biophysical factors, including mechanical
pressure, are notable components in the maintenance of the
extracellular microenvironment; in particular, muscles, blood
vessels, bone and dental tissues are under high degrees of
pressure. The mechanical microenvironment serves a prominent
regulatory role in cell proliferation, growth, differentiation and
metabolism, and it has been reported that external factors control
mitotic spindle positioning to regulate cell proliferation
(1). Notably, Lesman et al
(2) demonstrated that contractile
forces regulate cell division in three-dimensional environments.
The effects of biomechanical factors are more profound on motor
system-associated cells, including bone and muscle cells; moderate
mechanical pressure regulates the proliferation and differentiation
of osteoblasts (3). Furthermore,
mechanical loading synergistically increases trabecular bone volume
and improves the mechanical properties of mice (4). Fluid shear stress inhibits osteoblast
apoptosis via the extracellular signal-regulated kinase 5 signaling
pathway (5). It has also been
reported that biophysical factors regulate the pluripotency of stem
cells; specific pressures (300 and 600 Pa) accelerate the induction
of pluripotency in defined three-dimensional microenvironments
(6). Additional studies on the
role of mechanical factors in cell function have focused on
physiology (7,8). However, the number of studies on the
role of mechanical factors in pathological conditions, such as
hepatic portal hypertension, is limited.
Due to the absence of valves in the portal vein,
retrograde blood flow cannot be prevented. When pre-hepatic,
intrahepatic or post-hepatic obstruction occurs, retrograde flow is
possible and may result in portal hypertension (9). Portal hypertension is the primary
cause of complications in patients with chronic liver diseases
(10). Such complications include
esophageal and gastric varices, variceal bleeding, ascites,
spontaneous bacterial peritonitis, splenomegaly and hepatic
encephalopathy. Portal hypertension also has notable effects on
metabolism (11–13); hepatic encephalopathy, a serious
complication of portal hypertension, is a central nervous system
dysfunction resulting from a metabolic disorder (14,15).
Previous studies have revealed that portal hypertension inhibits
the activity of cytochrome c oxidase in the nerve cells of
the dentate gyrus and the basolateral, medial, lateral and central
amygdala, thereby affecting the brain's memory function (14,16,17).
Portal hypertension markedly influences metabolism within the
nervous system; however, its effects on hepatocyte metabolism
remain unclear.
Blood glucose equilibrium is one of the most notable
metabolic balances of the human body, and the liver is the primary
organ for carbohydrate metabolism and blood glucose maintenance.
The liver maintains blood glucose levels by regulating glycogen
synthesis and glycogenolysis (18). These processes are tightly
controlled by various factors. In particular, insulin, a principle
regulator of blood glucose, stimulates glycogen synthesis and
inhibits glycogenolysis (19).
Further studies have revealed that insulin promotes glycogen
synthesis through binding of its receptor and activating the
downstream protein kinase B/glycogen synthase kinase 3β (Akt/GSK3β)
pathway (20). Numerous studies
have been conducted on the regulation of glycogen synthesis in the
liver (21–23). However, in pathological conditions,
the mechanism underlying regulation of glycogen synthesis remains
unidentified. In the present study, it was revealed that mechanical
pressure inhibited hepatocellular glycogen synthesis, and the
regulatory mechanism of glycogen synthesis under pressure was
identified.
Materials and methods
Cell culture
The HL-7702 human hepatocyte cell line and HepG2
hepatoblastoma cell line were purchased from the Cell Bank of the
Type Culture Collection of the Chinese Academy of Sciences,
Shanghai Institute of Cell Biology, Chinese Academy of Sciences.
The cells were cultured in high-glucose Dulbecco's modified Eagle's
medium (Gibco; Thermo Fisher Scientific, Inc) supplemented with 10%
FBS (Gibco; Thermo Fisher Scientific, Inc) and 1%
penicillin/streptomycin (Hyclone; GE Healthcare Life Sciences).
Cells were maintained in a humidified atmosphere containing 5%
CO2 at 37°C in a cell incubator (Thermo Fisher
Scientific, Inc.).
Pressure loading
The pressure-loading apparatus was set up as
described previously, with some modifications (24,25),
namely, the apparatus were composed of an air-tight steel chamber
with inlet and outlet ports. To generate pressure, compressed
helium gas was released into the chamber. The pressure was
confirmed by a sphygmomanometer through a tube connected to the
outlet. Cells used for experiments were placed in the chamber
inside the incubator. After culturing at 37°C for 24 h, the cells
were exposed to pressure between 0 and 15 mmHg for 24 h at 37°C for
further experiments.
Glycogen analysis assay
For the Periodic Acid-Schiff (PAS) assay, the cells
were seeded in 24-well plates at a density of 1×10⁴
cells/well, and were cultured for 24 h. The cells were exposed to
different pressures and were stained using the Glycogen PAS
Staining kit (cat. no. G1360; Beijing Solarbio Science &
Technology Co., Ltd.) according to the manufacturer's protocol. The
staining data were analyzed with Image-Pro Plus 6.0 software (Media
Cybernetics, Inc.). The cell images were captured using a
fluorescence microscope (Nikon ECLIPSE Ti; Nikon Corporation).
To further analyze glycogen concentration, cells
were seeded into 24-well plates at a density of 1×10⁴
cells/well, cultured for 24 h and exposed to 0–15 mmHg pressure.
The cells were washed with PBS and the glycogen content was
determined using the Glycogen Content Detection kit (cat. no.
BC0345; Beijing Solarbio Science & Technology Co., Ltd.)
according to the manufacturer's protocol. Absorbance was determined
at 620 nm using a SpectraMax M5 spectrophotometer (Thermo Fisher
Scientific, Inc.).
Cell Counting kit (CCK)-8 assay
The cells were seeded in 96-well plates at a density
of 1×10³ cells/well. Subsequently, the cells were
exposed to different pressures for various durations and 10 µl
CCK-8 reagent (Dojindo Molecular Technologies, Inc.) was added to
each well at 37°C for 1 h. Finally, absorbance was determined at
450 nm using a SpectraMax M5 spectrophotometer.
Apoptosis analysis
Cell apoptosis was detected using an Annexin
V-FITC/propidium iodide (PI) cell apoptosis kit (cat. no. KGA108-1;
KeyGen Biotech Co., Ltd.) according to the manufacturer's protocol.
Briefly, cells reseeded at a density of 1×10⁵ cells/well
in a 6-well plate were exposed to different pressures.
Subsequently, the cells were washed with ice-cold PBS, collected in
a 1.5 ml Eppendorf tube, and treated with Annexin V-FITC/PI for 10
min at room temperature according to the manufacturer's protocol.
The cells were then analyzed using a flow cytometer (BD FACSVerse;
BD Biosciences). Data were analyzed using FlowJo V10 Analysis
software (FlowJo LLC).
Reverse transcription-quantitative PCR
(RT-qPCR) and RNA-seq
Total RNA was isolated using TRIzol®
reagent (Invitrogen; Thermo Fisher Scientific, Inc.) according to
the manufacturer's protocol. For each sample, 500 ng RNA was
reverse transcribed to cDNA using a Prime-Script RT reagent kit
(cat. no. RR037A; Takara Biotechnology Co., Ltd.) according to the
manufacturer's protocol. The obtained cDNA was amplified using the
Takara Ex Taq PCR kit (Takara Biotechnology Co., Ltd.) and qPCR
amplification was conducted using the Stratagene Mx3000 QPCR system
(Stratagene; Agilent Technologies, Inc.) and analyzed via the
2−ΔΔCq method (26).
The thermocycling conditions were as follows: 95°C for 1 min, and
40 cycles of 95°C for 10 sec and 60°C for 30 sec. A melting curve
was subsequently generated. The primer sequences used in these
assays are shown in Table I.
 | Table I.Primer sequences used in reverse
transcription-quantitative PCR. |
Table I.
Primer sequences used in reverse
transcription-quantitative PCR.
| Gene | Sequence
(5′-3′) |
|---|
| Gys1-F |
ACAACCTGGAGAACTTCAAC |
| Gys1-R |
ATCTGGGACACAGTAGTGAA |
| Gsk3β-F |
CTCCTCATGCTCGGATTCA |
| Gsk3β-R |
TGCAGAAGCAGCATTATTGG |
| Agl-F |
CATTTAATAGAGAAAAATTC |
| Agl-R |
CATGATTATCAGCACCAACACGT |
| G6pc3-F |
GATGCCTAGCCTGGCTTATT |
| G6pc3-R |
CAGGACAGCGCCAGTTATTA |
| p53-F |
CAAACCCCTGGTTTAGCACTTC |
| p53-R |
TGTCCTTCCTGGAGCGATCT |
| Pten-F |
CCGAAAGGTTTTGCTACCATTCT |
| Pten-R |
AAAATTATTTCCTTTCTGAGCATTCC |
| Akt-F |
GCAGCACGTGTACGAGAAGA |
| Akt-R |
GGTGTCAGTCTCCGACGTG |
| Pygl-F |
TGCCCGGCTACATGAATAACA |
| Pygl -R |
TGTCATTGGGATAGAGGACCC |
| Gapdh-F |
CCCATCACCATCTTCCAGGAGC |
| Gapdh-R |
CAGTGAGCTTCCCGTTCAGC |
For RNA-seq, 500 ng extracted total RNA from each
sample was used for library construction. Libraries were
constructed using Truseq RNA Sample Preparation kit V2 (Illumina,
Inc; San Diego, USA) according to the manufacturer's protocol.
Adapters with index sequences were attached to the libraries. After
the average length of the libraries was confirmed, the
concentration of each library was adjusted to 10 nM. Sequencing was
performed for 100 bp using HiSeq2500 (Illumina, Inc.), with the
single-read method. Mapping, data normalization and statistical
analyses were performed using CLC Genomics Workbench (v. 8.5.1;
Qiagen, Inc.). For volcano plotting, gene expression levels were
averaged over the replicates for each cell line post-normalization
and the cell lines were compared by calculating the fold change
(FC). FC was defined as the ratio between the averages and P-values
were determined for each gene expressed. In volcano plots, FC was
plotted along the x-axis and P-value along the y-axis.
Significantly altered genes were defined as those with thresholds
of FC>2 and P<0.01.Gene set enrichment analysis (GSEA) was
performed at www.broadinstitute.org/gsea.
Western blot analysis
Cultured cells were lysed in strong RIPA buffer
(cat. no. R0010; Beijing Solarbio Science & Technology Co.,
Ltd.) containing Halt Protease Inhibitor Cocktails (cat. no. 78430;
Thermo Fisher Scientific, Inc.). Protein concentrations were
measured using a BCA protein assay kit (cat. no. 23235; Pierce;
Thermo Fisher Scientific, Inc.). Subsequently, 50 µg/lane of
protein was separated via 10% SDS-PAGE and then transferred into a
polyvinylidene difluoride membrane (cat. no. 03010040001;
Sigma-Aldrich; Merck KGaA). The membranes were immersed in TBS-0.1%
Tween 20 (cat. no. T8220-100ml; Beijing Solarbio Science &
Technology Co., Ltd.) solution and blocked with 5% skimmed milk at
room temperature for 1 h. Primary antibodies targeting glycogen
synthase 1 (GYS1; 1:1,000; cat. no. ab40810; Abcam), phosphorylated
(p)-GYS1 (S641; 1:1,000; cat. no. ab81230; Abcam), p53 (1:1,000;
cat. no. ab26; Abcam), phosphatase and tensin homolog (Pten;
1:1,000; cat. no. ab32199; Abcam), caspase-3 (1:1,000; cat. no.
ab13847; Abcam), Akt (1:1,000; cat. no. ab8805; Abcam), p-Akt
(S473; 1:1,000; cat. no. ab81283; Abcam) and GAPDH (1:2,000; cat.
no. sc-47724; Santa Cruz Biotechnology, Inc.) were incubated with
the membranes overnight at 4°C, followed by incubation with the
horseradish peroxidase-conjugated goat anti-rabbit immunoglobulin G
(IgG; 1:3,000; cat. no. ab97051; Abcam) and goat anti-mouse IgG
(1:3,000; cat. no. ab6789; Abcam) for 1 h at room temperature.
Detection and analysis of HRP was performed using the Super Signal
West Pico Chemiluminescent Substrate (cat. no. 34580; Pierce;
Thermo Fisher Scientific, Inc.). Quantitiative analysis was
performed using Alpha View Analysis Tools (AlphaViewSA v.3.2.2
software; ProteinSimple).
Statistical analysis
Experimental results were analyzed using GraphPad
Prism 5 software (GraphPad Software, Inc.). The data obtained from
each group were compared with the control group. Independent
samples t-tests were performed to compare the difference between
two groups. The average of multiple groups was analyzed by one way
analysis of variance followed by Dunnett's post hoc test. Data are
presented as the mean ± standard error of the mean of three
independent experiments. P<0.05 was considered to indicate a
statistically significant difference.
Results
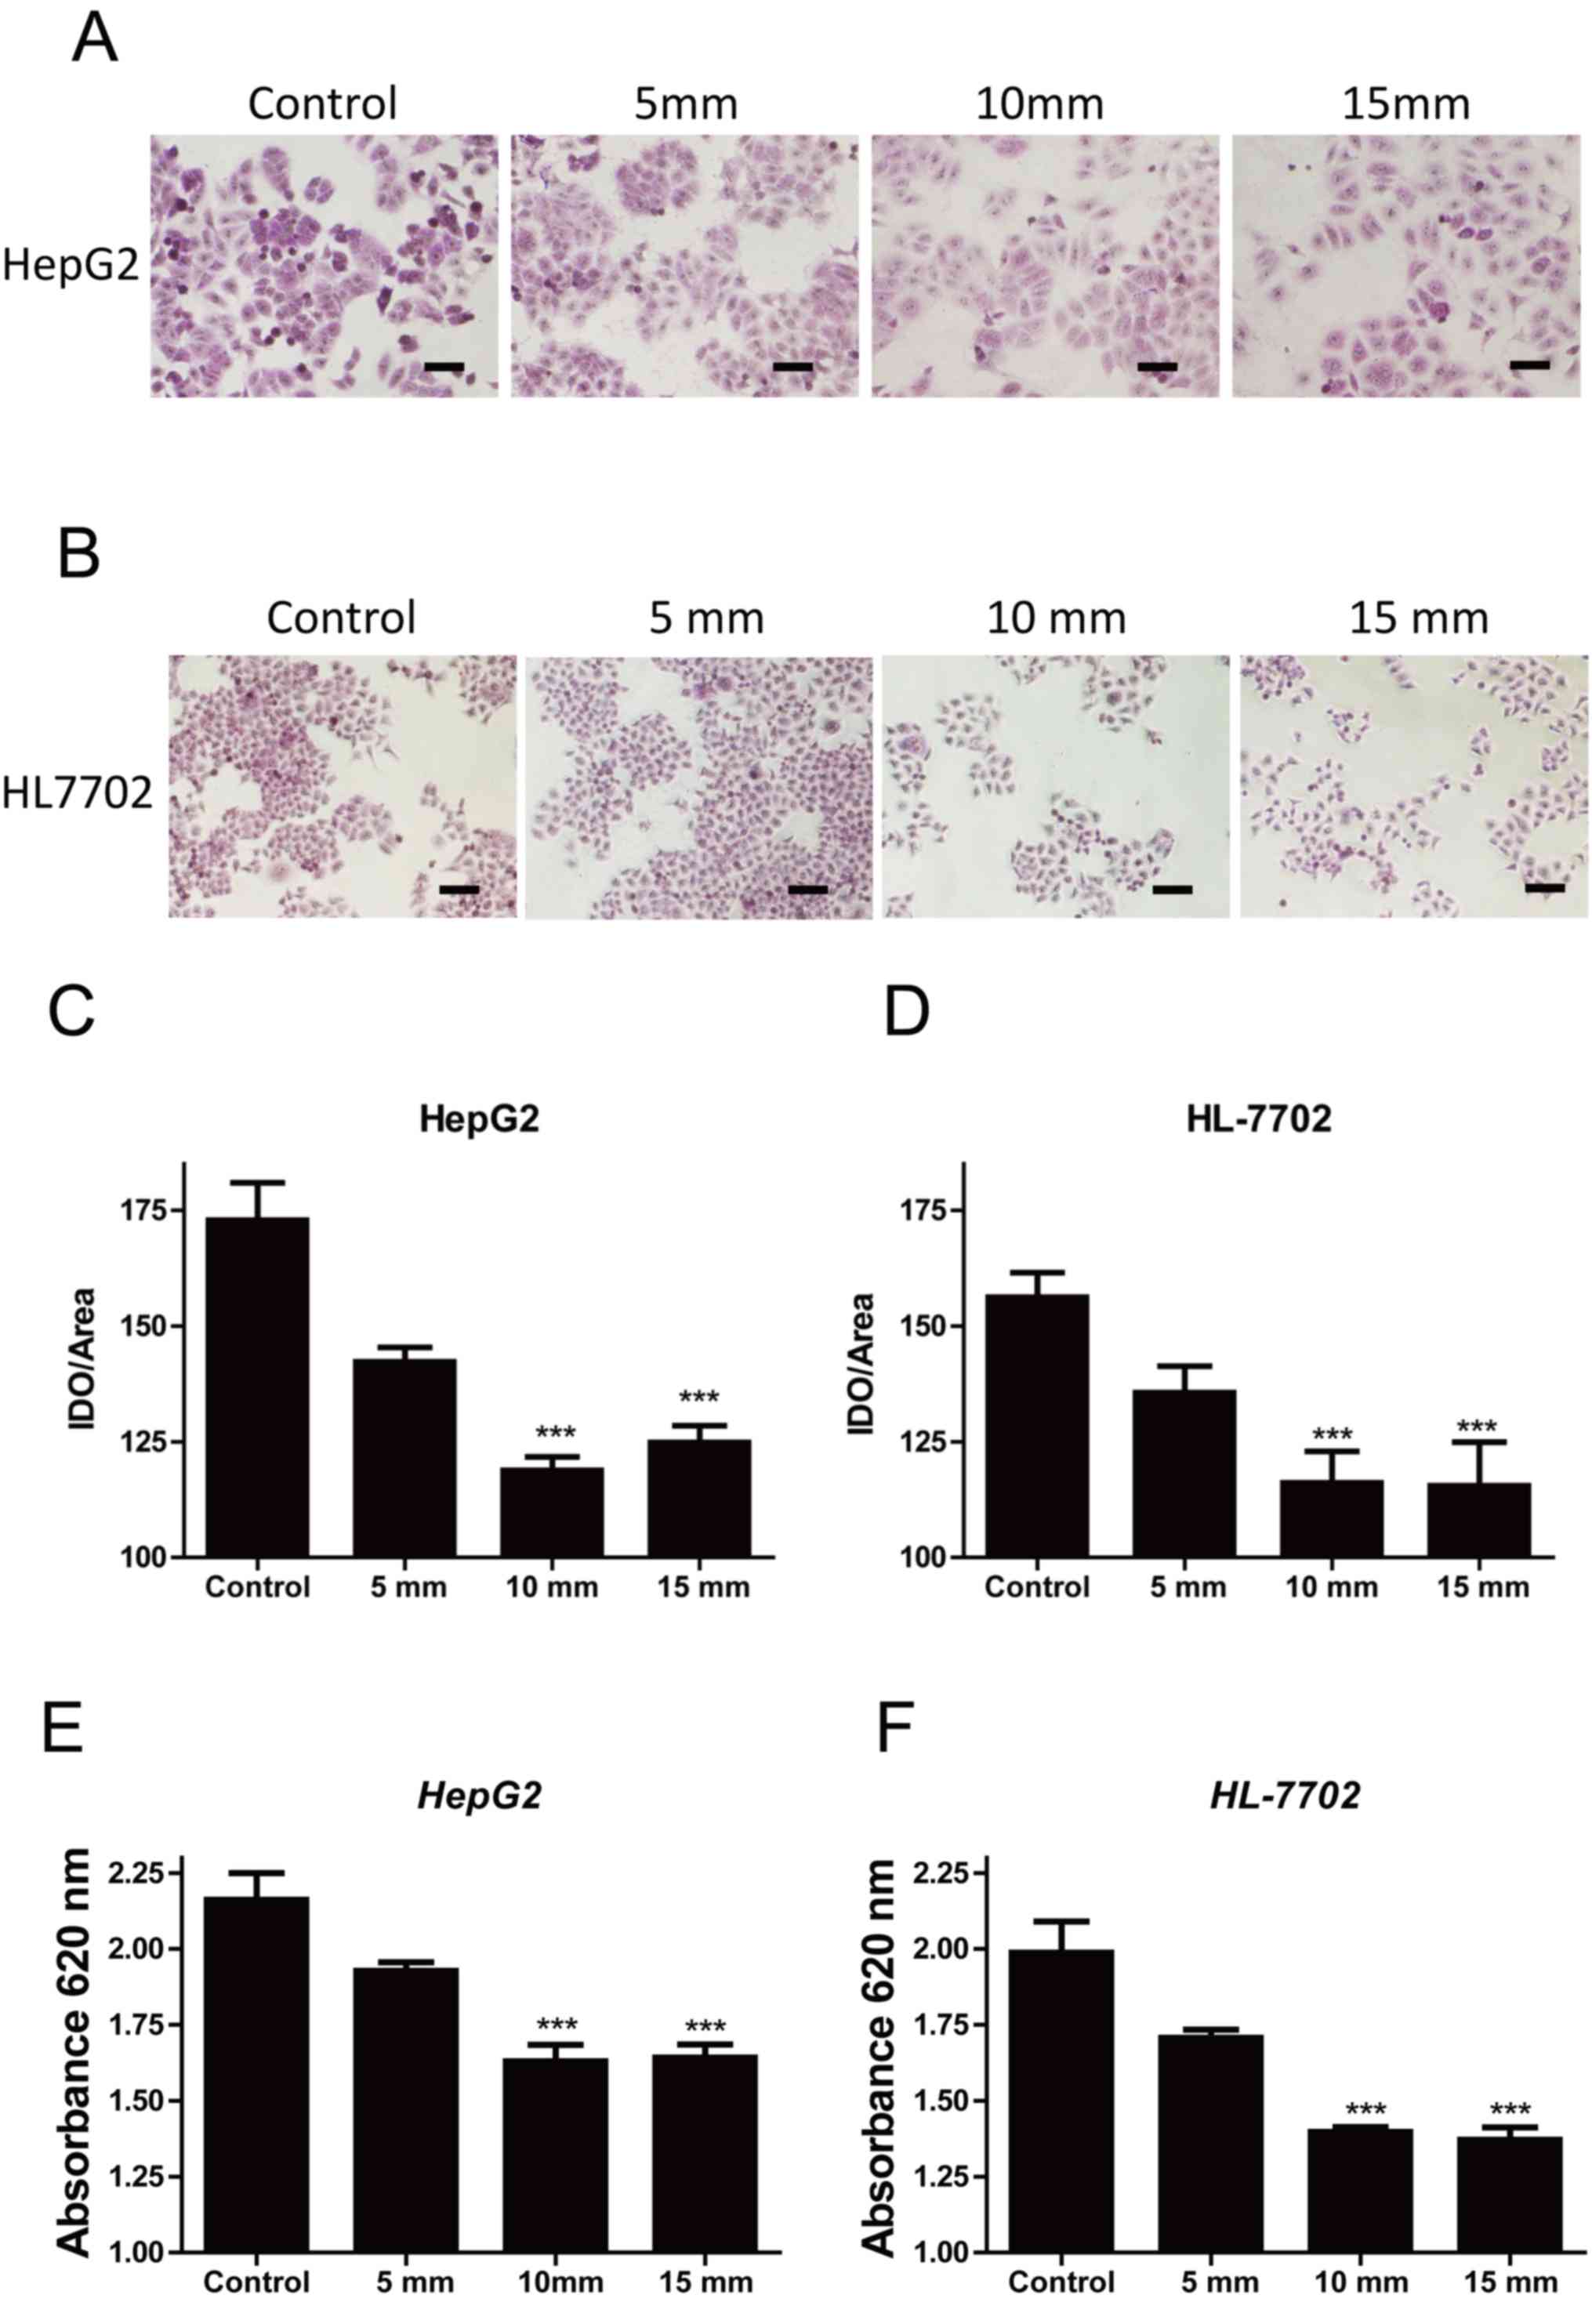
An increase in pressure decreases
hepatocellular glycogen concentration
To evaluate the effects of extracellular pressure on
hepatocellular glycogen metabolism, PAS staining was used to
analyze the intracellular glycogen concentration of HepG2 cells
treated with 0, 5, 10 and 15 mmHg pressure for 24 h. A pressure of
10 mmHg significantly decreased the intracellular glycogen
concentration of HepG2 cells compared with the control group (0
mmHg; Fig. 1A and C); however, the
decrease in glycogen concentration between 10 and 15 mmHg was not
substantial, indicating that the effect of pressure had reached
saturation at 15 mmHg. A similar result was observed in the normal
hepatic cell line HL-7702 (Fig. 1B and
D), suggesting that an increase in extracellular pressure
inhibited intracellular glycogen synthesis. To support this result,
glycogen concentration was detected using the Glycogen Content
Detection kit; when the pressure was increased, glycogen
concentration gradually decreased in HepG2 and HL-7702 cells
(Fig. 1E and F). The results
indicated that specific pressure values decreased hepatocellular
glycogen concentration, which may be associated with a decrease in
glycogen synthase activity.
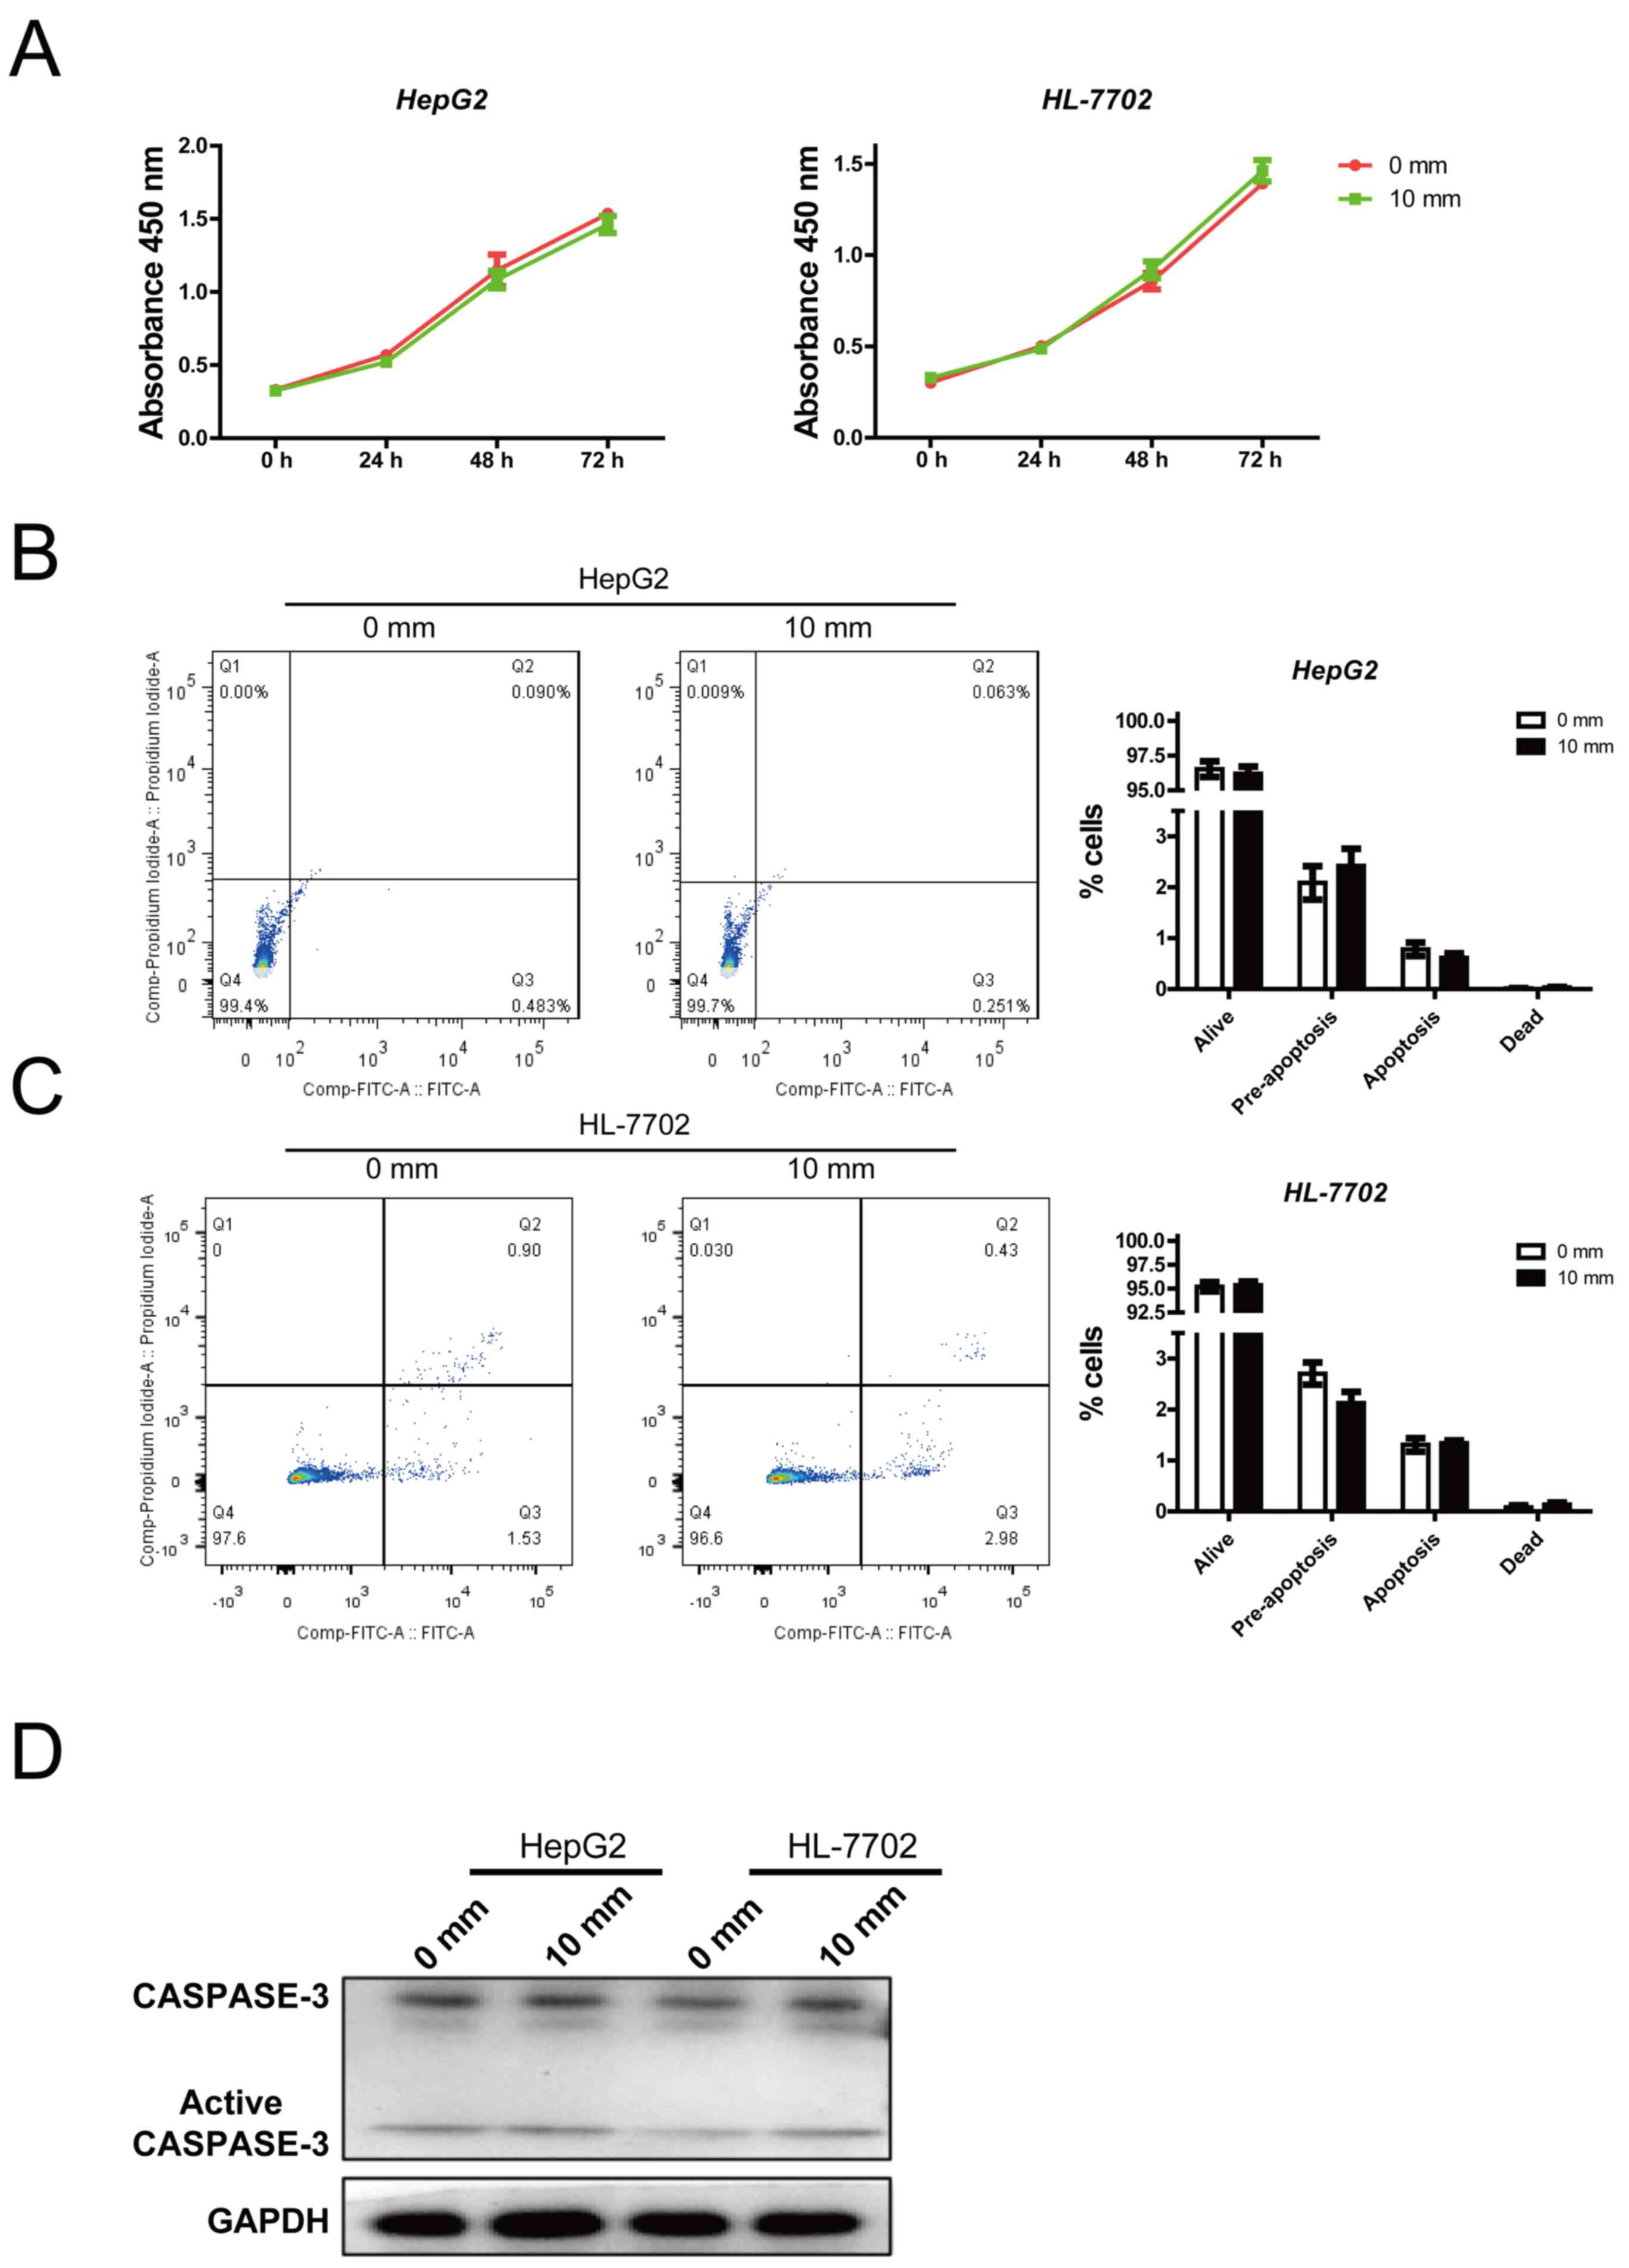
An increase in pressure does not
affect cell viability and apoptosis
The present study detected the effects of pressure
on cell viability and apoptosis. Previous data revealed that the
glycogen content of hepatocytes was significantly reduced when
pressure reached 10 mmHg, with no considerable difference compared
with that at 15 mmHg. Therefore, 0 and 10 mmHg pressures were
employed for further study. There was no significant alteration in
HepG2 or HL-7702 cell viability between the 0 and 10 mmHg groups
(Fig. 2A). Similarly, cell
apoptosis was not affected by 10 mmHg pressure (Fig. 2B and C). In addition, the protein
expression levels of active caspase-3, an apoptosis marker, were
not affected by pressure (Fig.
2D). These results indicated that mechanical pressure did not
affect cell viability and apoptosis.
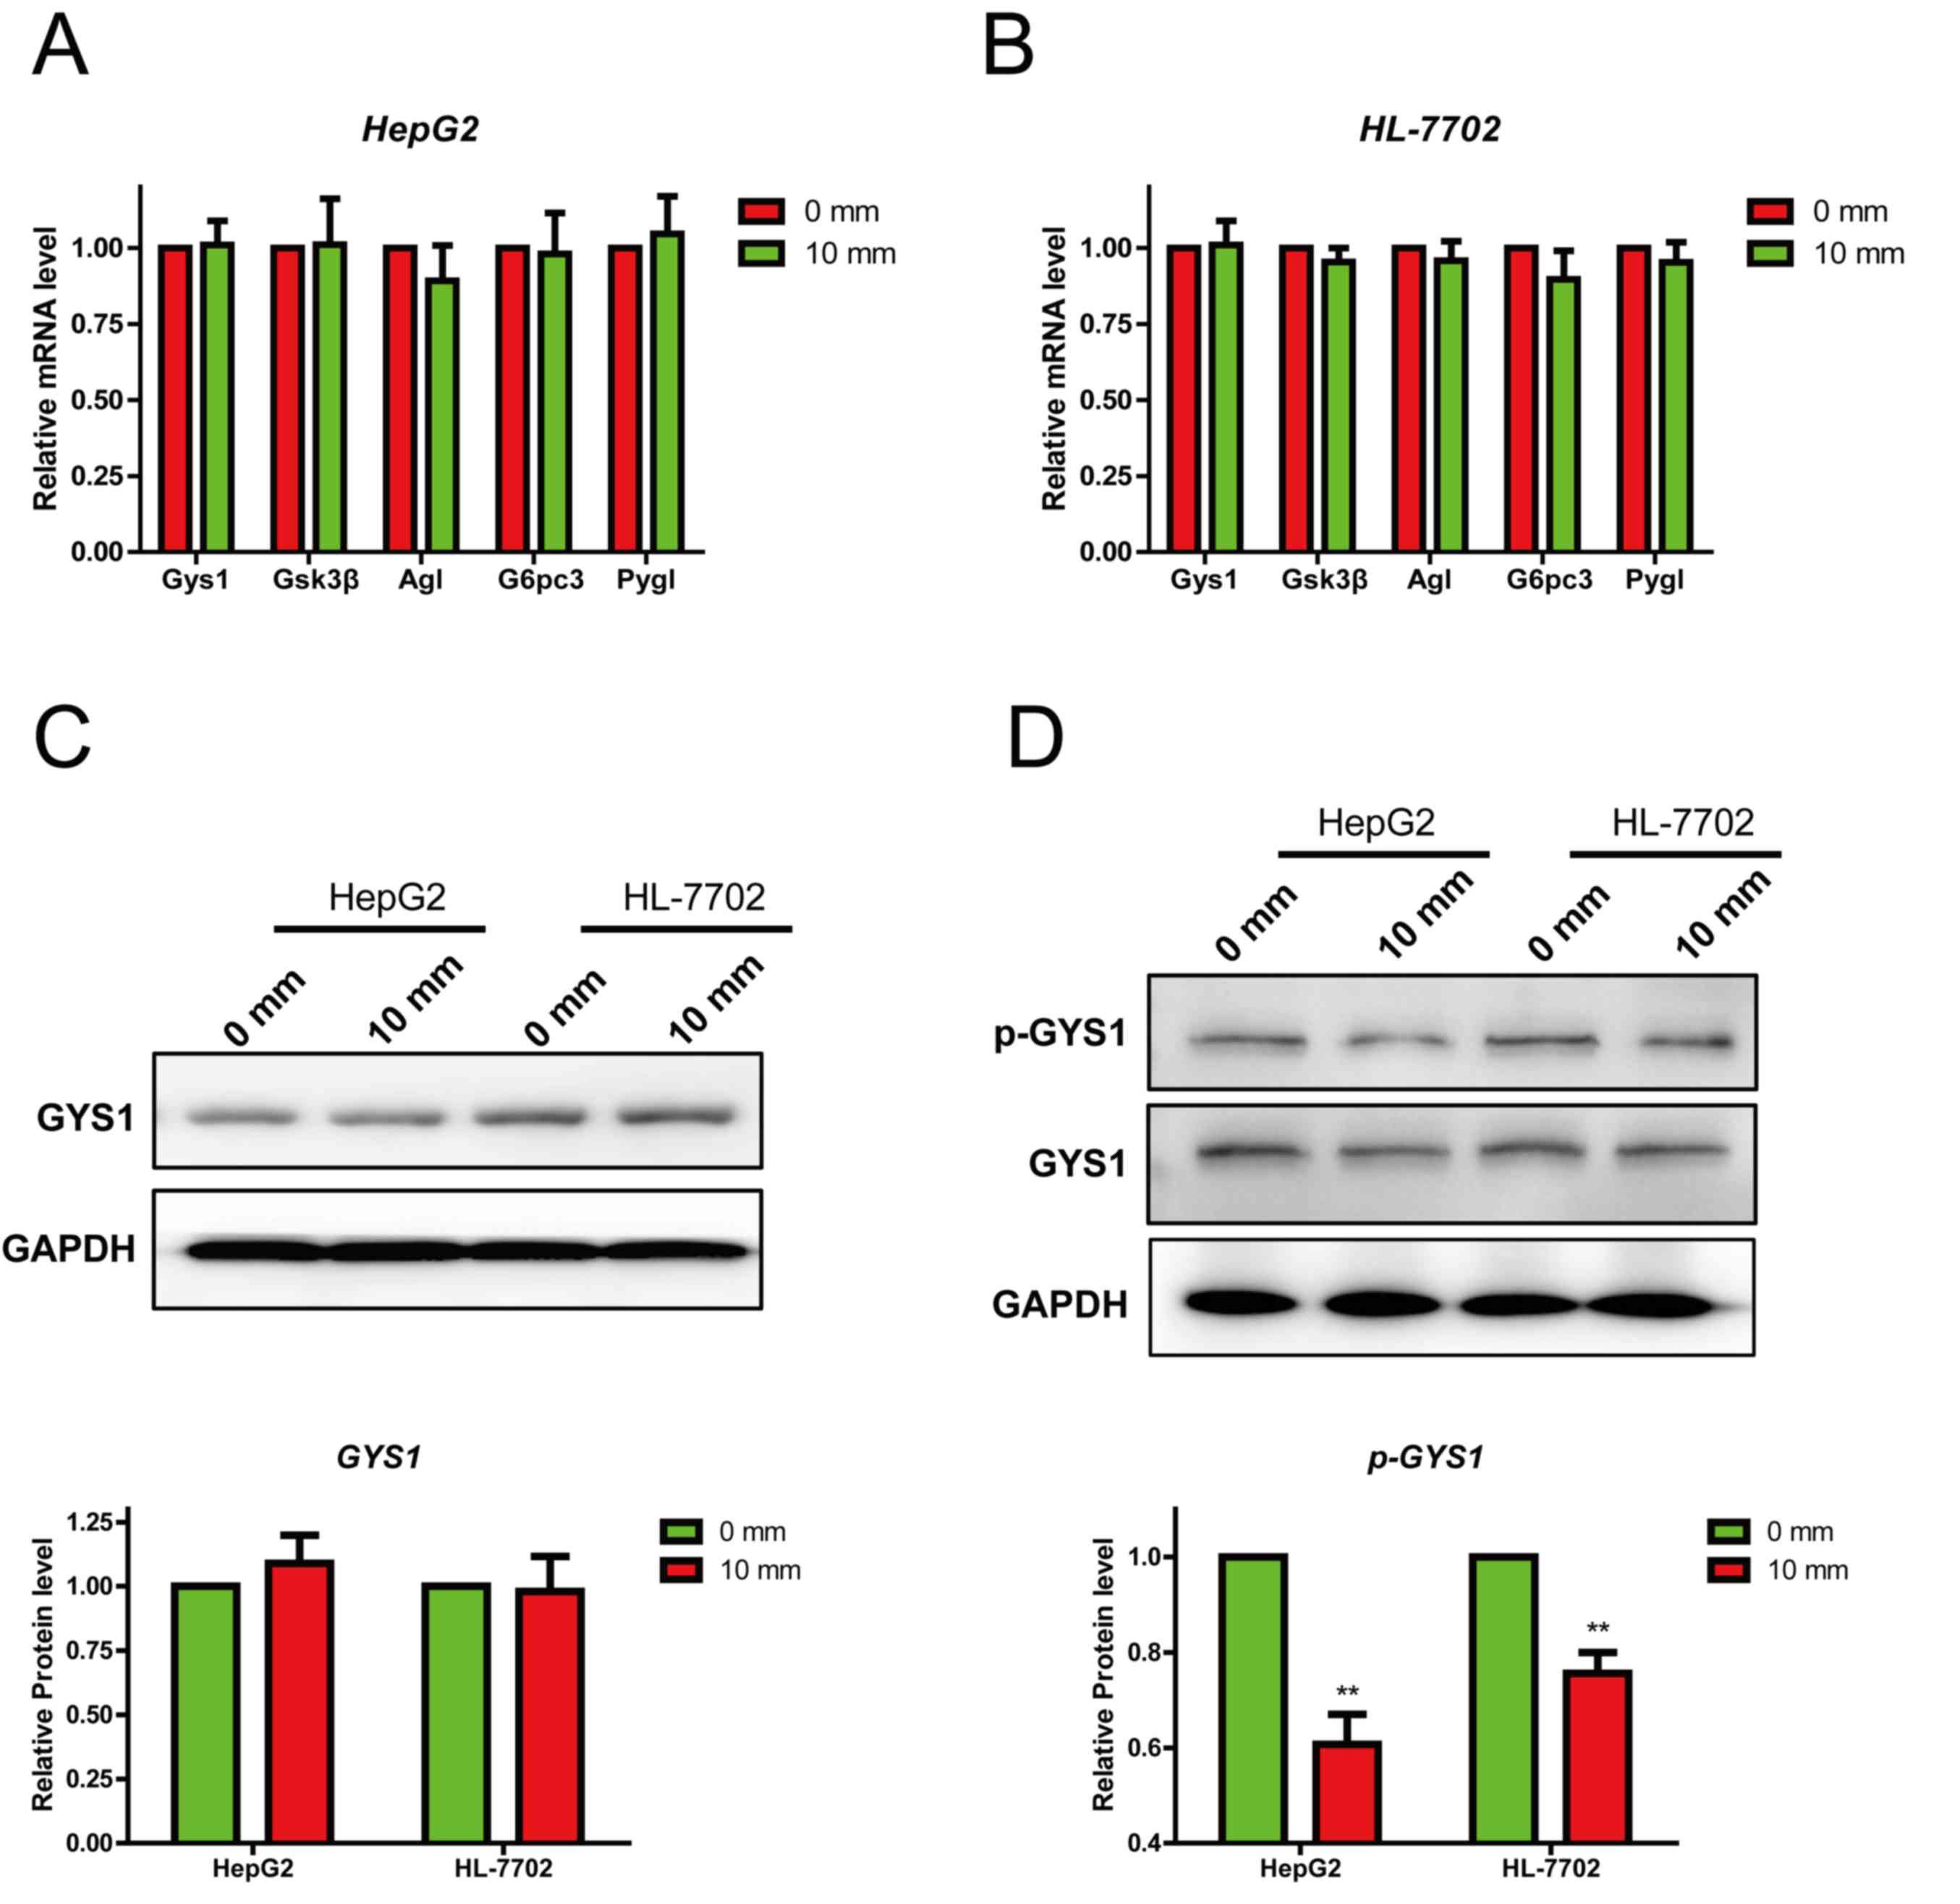
An increase in pressure suppresses
glycogen synthesis by inhibiting GYS1 phosphorylation
Numerous studies have indicated that glycogen
synthesis is regulated by various genes, including Gys1, GSK3b,
glucose-6-phosphatase catalytic subunit 3, amylo-α-1,
6-glucosidase, 4-alpha-glucanotransferase and glycogen
phosphorylase. Therefore the expression of these genes was detected
in HepG2 and HL-7702 cells following treatment with different
pressures. The expression levels of genes of interest were
evaluated using RT-qPCR. Following treatment with 0 and 10 mmHg
pressure for 24 h, the mRNA expression levels remained unchanged
(Fig. 3A and B). It has been
reported that p-GYS1 (S641) is the activated isoform of the enzyme
and is closely associated with glycogen synthesis. Therefore, the
protein expression levels of GYS1 and p-GYS1 (S641) were detected
using western blotting. The protein expression levels of total GYS1
remained unchanged (Fig. 3C and
D); however, p-GYS1 (S641) expression was significantly
decreased under 10 mmHg pressure. These results suggested that
mechanical pressure suppressed glycogen synthesis by inhibiting the
phosphorylation of GYS1.
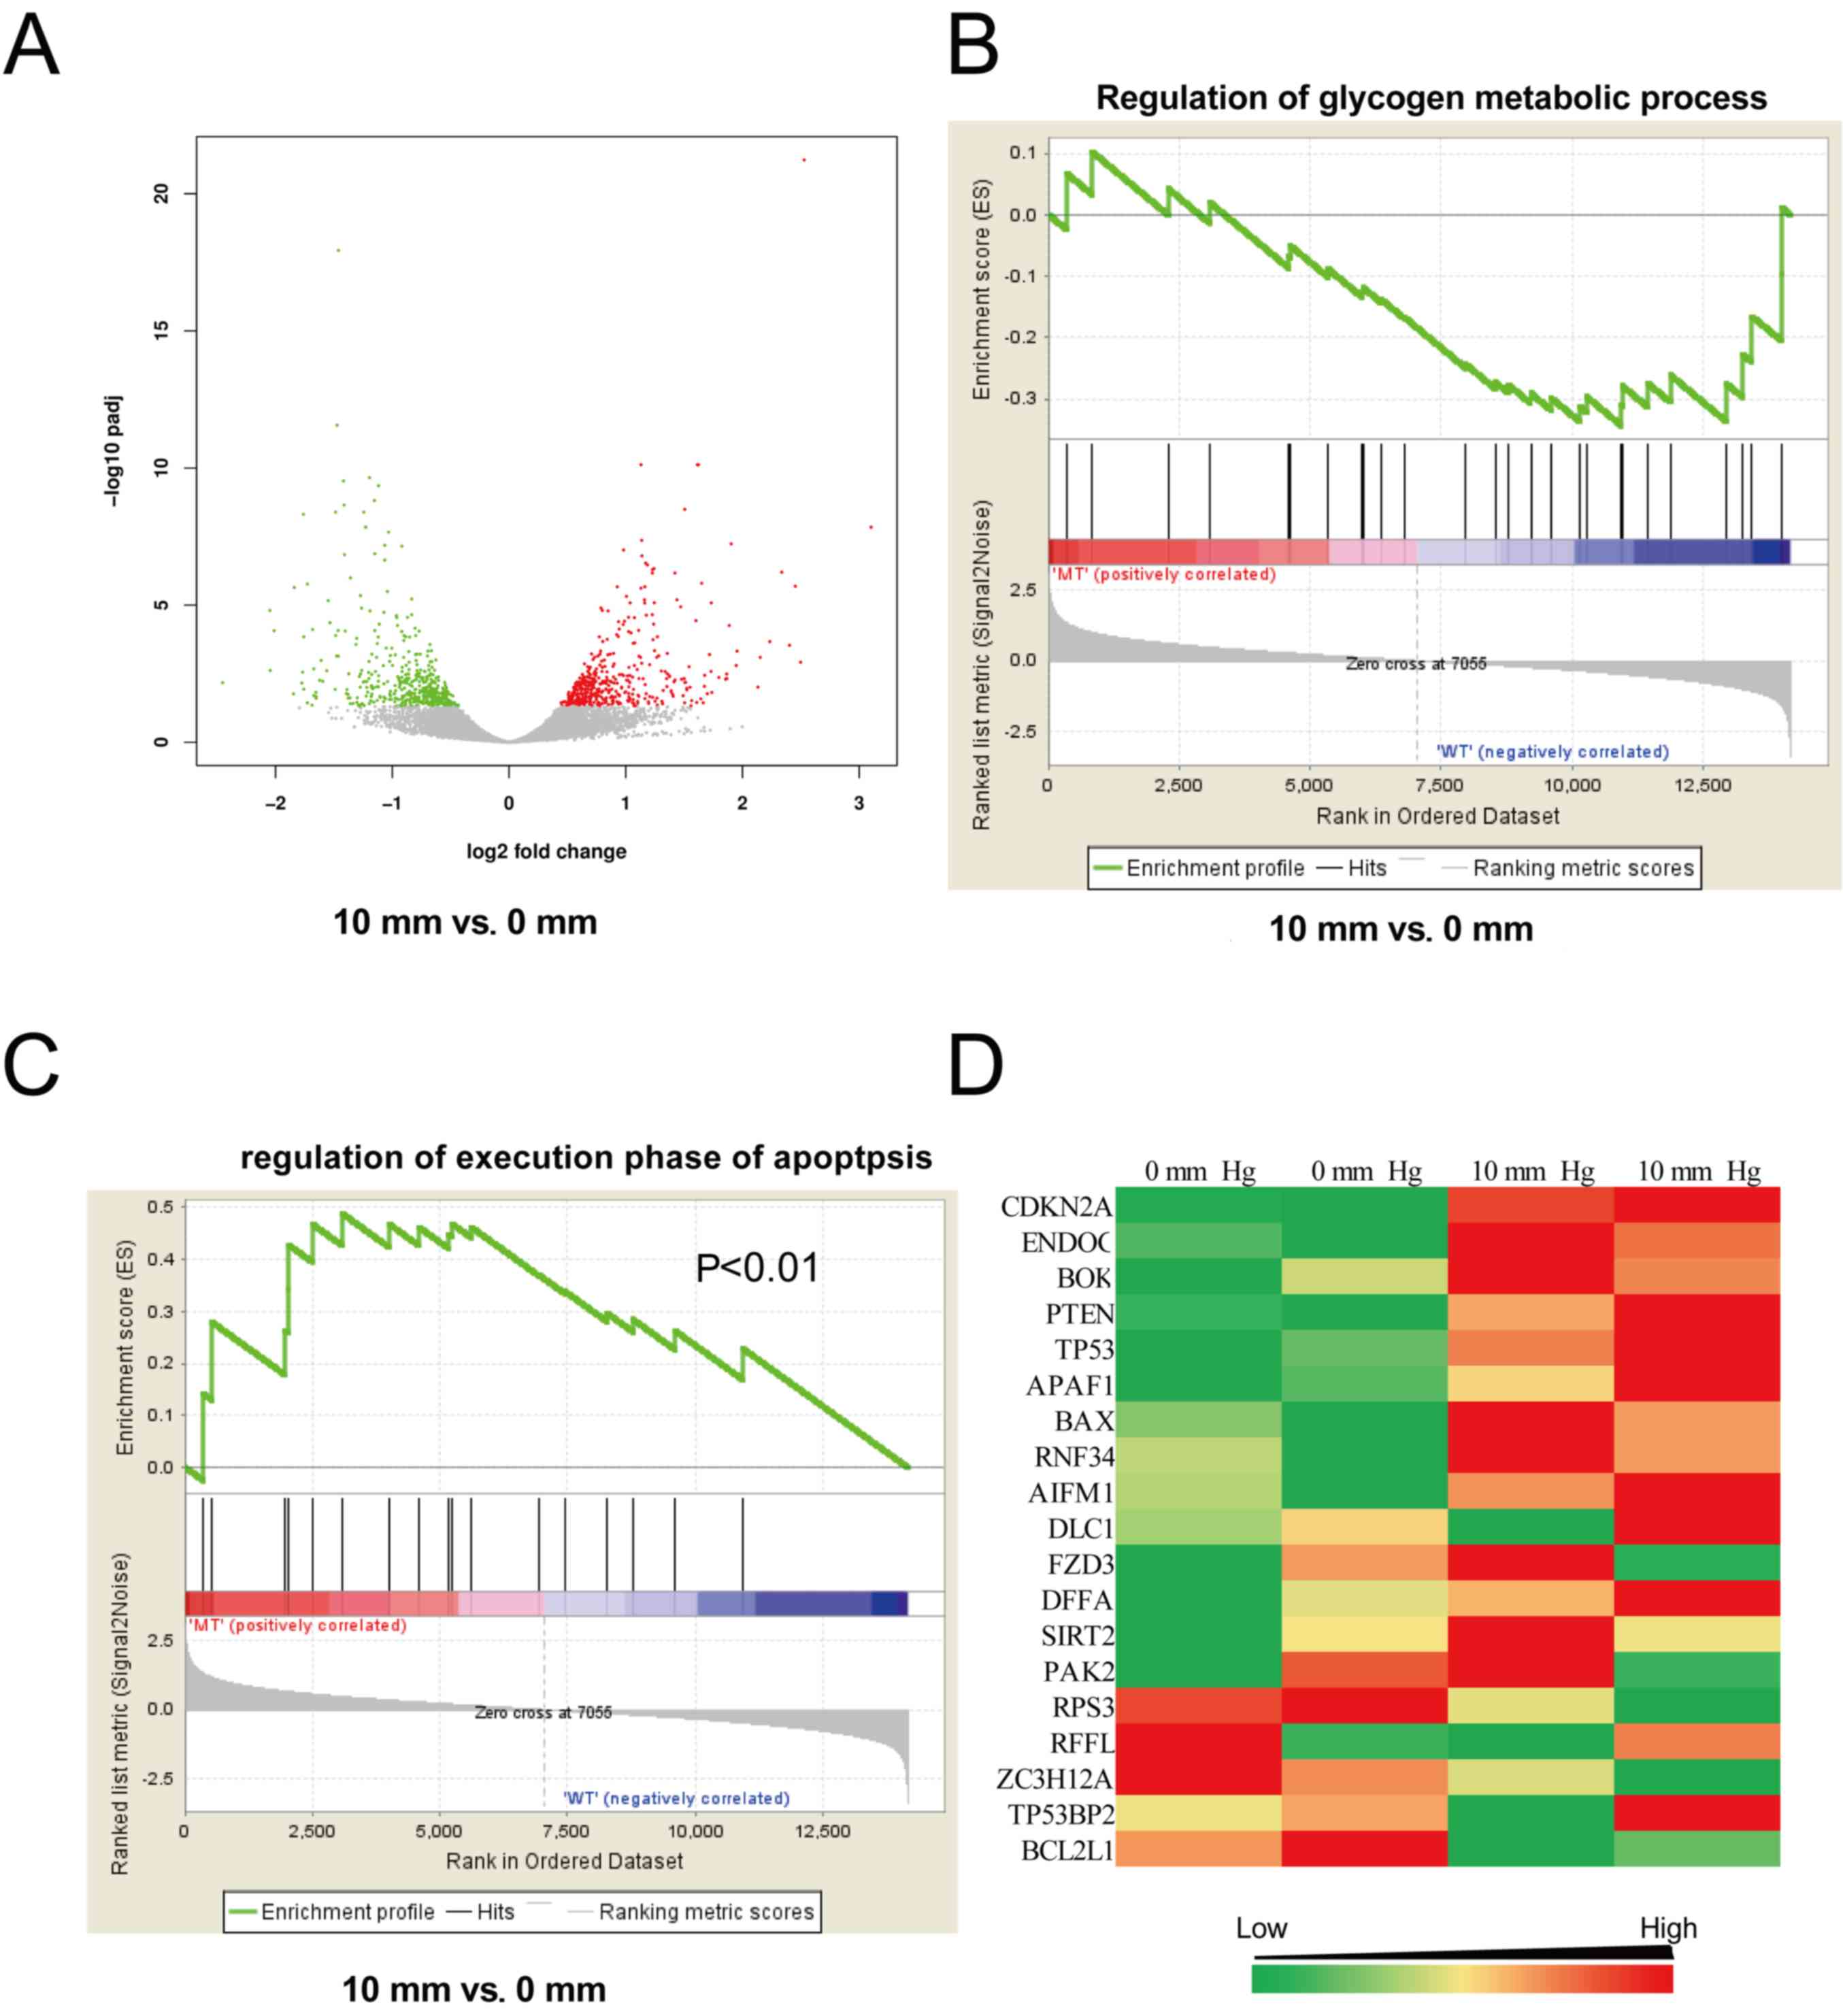
An increase in pressure activates the
p53/Pten pathway
To further investigate the mechanisms underlying the
effects of pressure exertion on glycogen synthesis, genome-wide
gene expression alterations in HepG2 cells treated with different
pressures for 24 h were analyzed using an RNA-seq assay. The gene
expression at 10 mmHg was different from that at 0 mmHg; of the
13,456 mapped genes in HepG2 cells, 2,253 were differentially
expressed, including 949 downregulated and 1,304 upregulated genes
(Fig. 4A). To identify the effects
on cell signaling, the data were further analyzed with GSEA. The
expression levels of genes associated with the regulation of
glycogen metabolism were not significantly altered (Fig. 4B), consistent with the
aforementioned results (Fig. 3A and
B). Notably, genes associated with the regulation of apoptosis
were significantly upregulated (Fig.
4C). The expression of p53 and Pten were also markedly
increased (Fig. 4D). These data
indicated that increased pressure inhibited hepatocellular glycogen
synthesis by activating the p53/Pten pathway.
An increase in pressure suppresses
glycogen synthesis through activation of the p53/Pten pathway
It has been reported that Pten and p53 regulate
glycogen synthesis by interacting with the Akt/GSK3β signaling
pathway (27). Therefore, the
expression levels of p53, Pten and their downstream gene Akt were
detected in HepG2 and HL-7702 cells, which were previously
incubated under 0 and 10 mmHg pressure for 24 h. When pressure was
increased, the mRNA expression levels of p53 and Pten were also
increased; however, Akt expression was not significantly altered
(Fig. 5A and B). A similar effect
was observed in in the resultant protein expression levels
(Fig. 5C and D). Notably, p53
regulates Akt activity by inhibiting its phosphorylation at Ser473;
in this study, p-Akt was significantly reduced in response to 10
mmHg pressure (Fig. 5D). These
data confirmed that pressure may influence glycogen synthesis by
regulating the p53/Pten pathway.
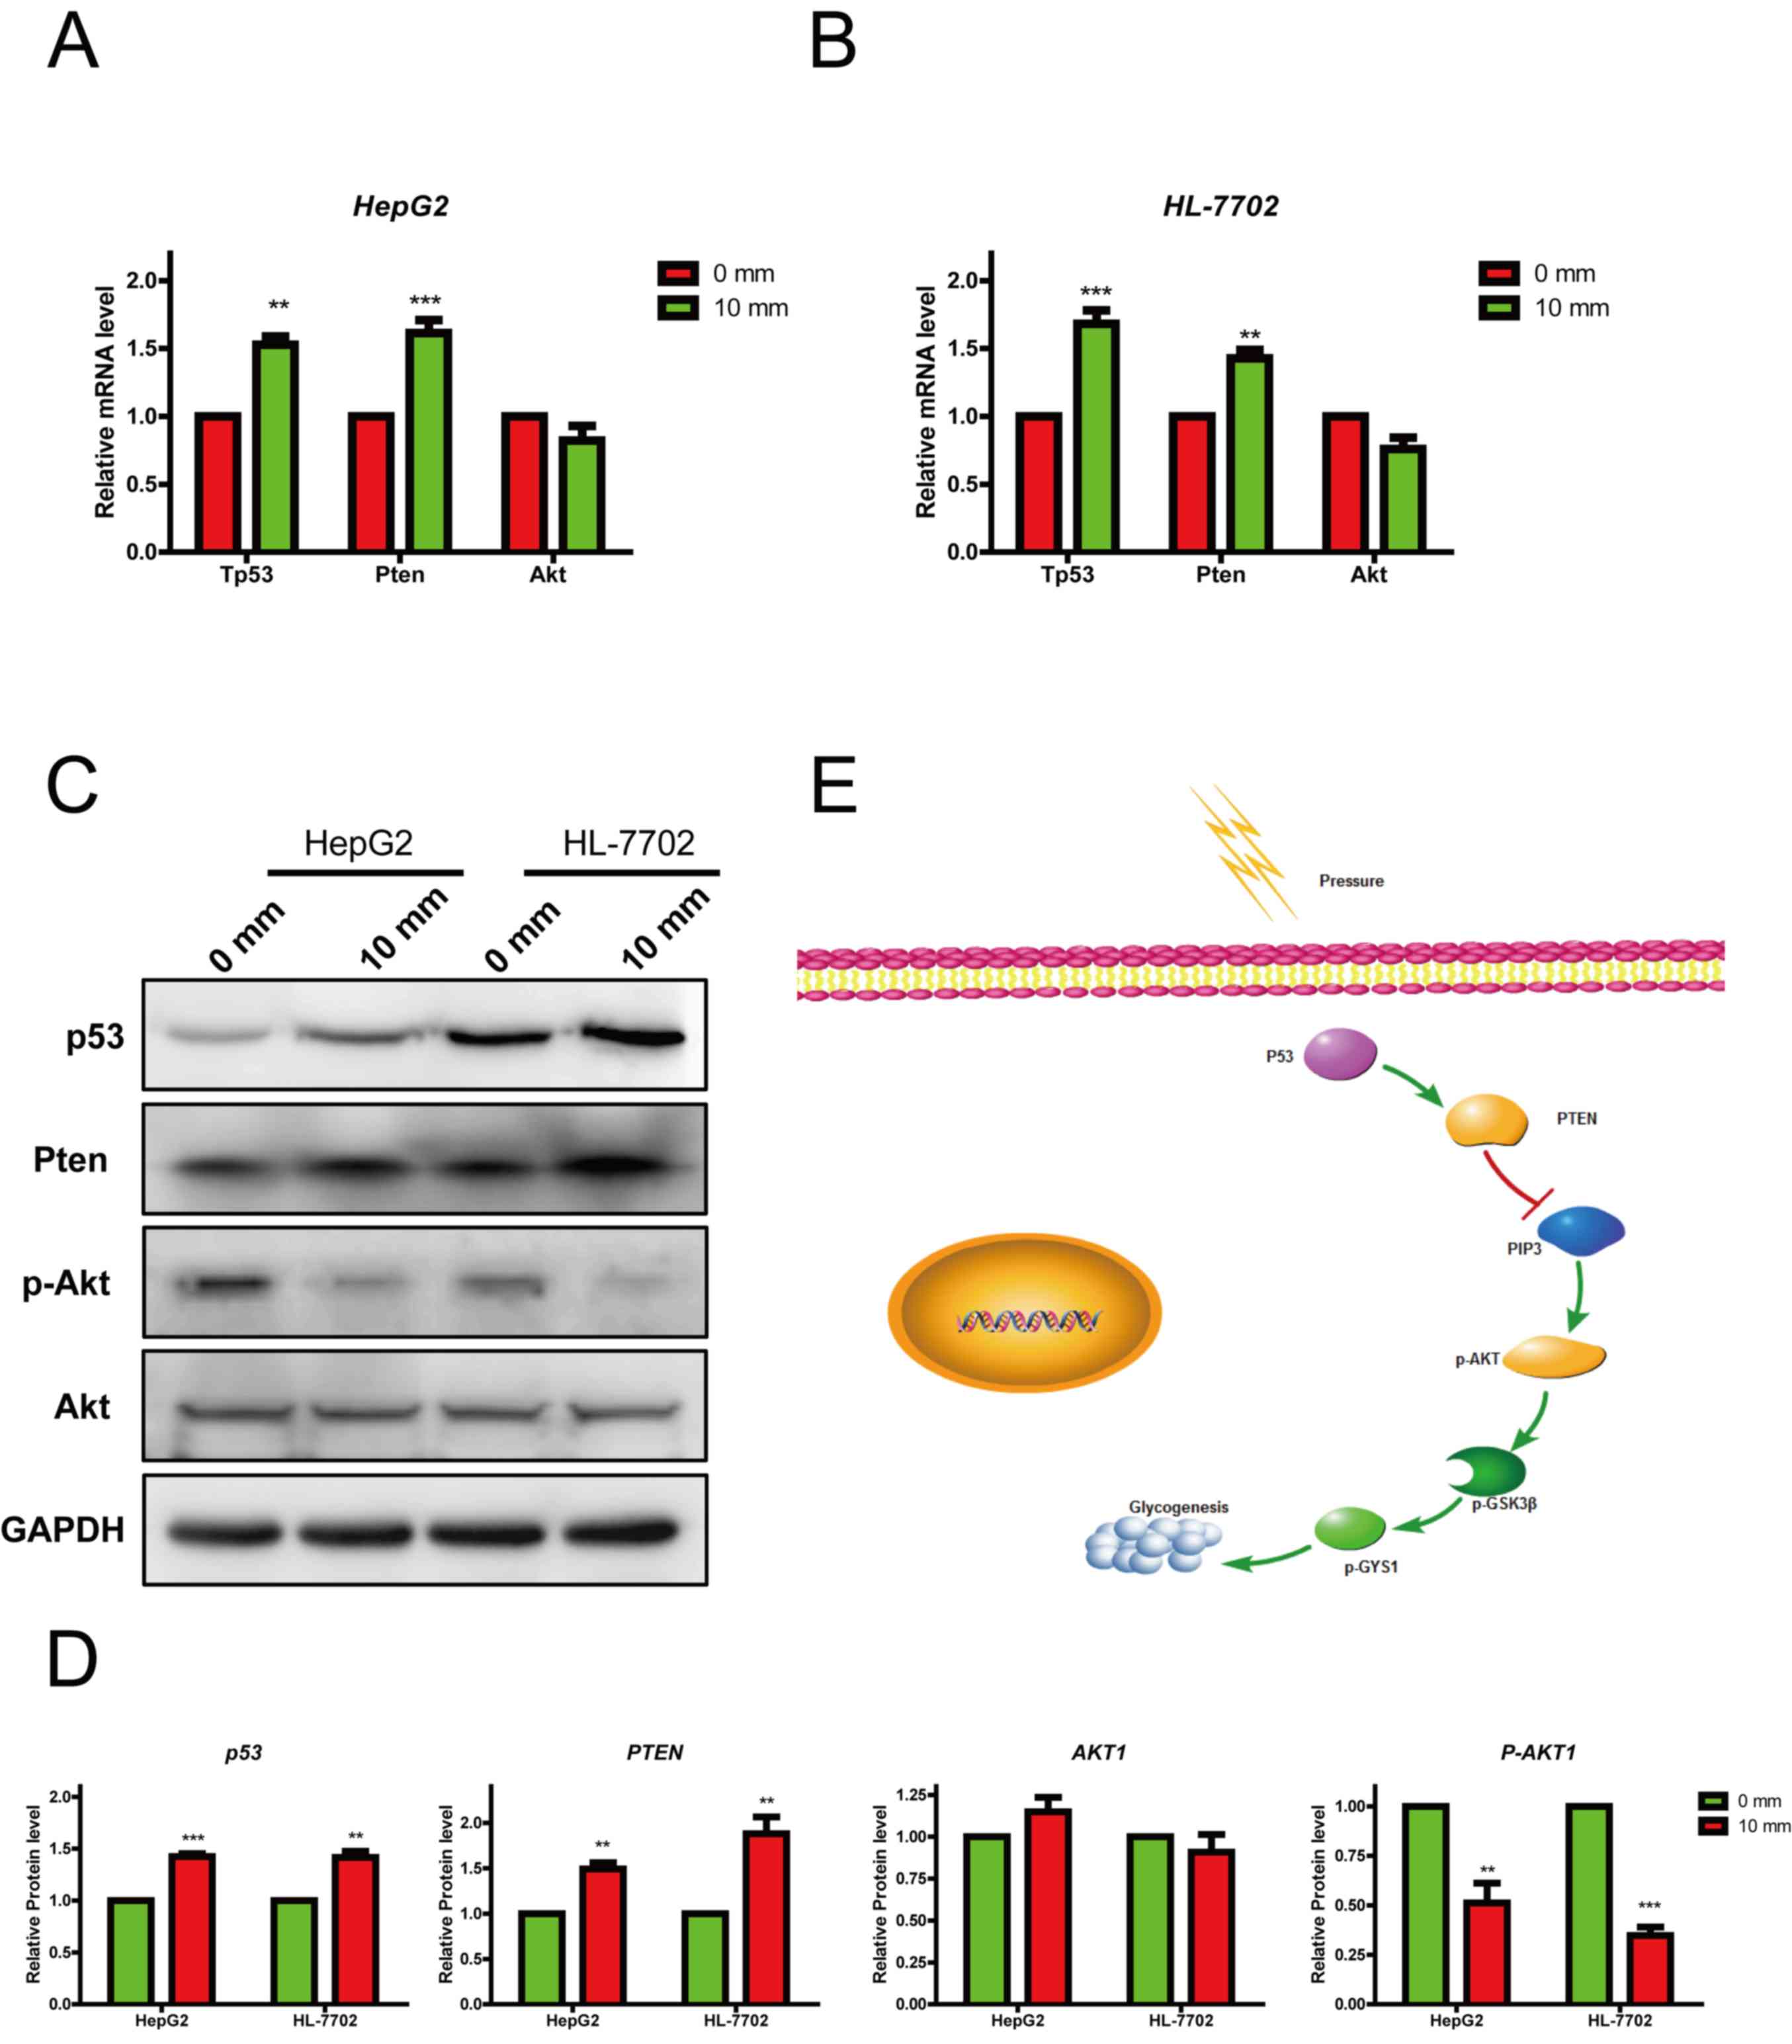 | Figure 5.Increasing pressures suppress
glycogen synthesis through activating the p53 pathway. RT-qPCR
analysis of the mRNA expression levels of genes related to the p53
pathway in (A) HepG2 and (B) HL-770 cells treated with different
pressures (0 and 10 mmHg). RT-qPCR data are displayed relative to
controls as the mean ± standard error of the mean (n=3). (C and D)
Western blot analysis of proteins related to the p53 pathway in
HepG2 and HL-7702 cells treated with different pressures (0 and 10
mmHg). (E) Proposed schematic diagram of the regulatory role of
pressure in hepatocellular glycogen synthesis. Data are presented
as the mean ± standard error of the mean, n=3. **P<0.01,
***P<0.001 vs. control. Akt, protein kinase B; GYS1, glycogen
synthase 1; mm, mmHg; P, phosphorylated; PIP3, phosphatidylinositol
(3,4,5)-trisphosphate; Pten, phosphatase and
tensin homolog; RT-qPCR, reverse transcription-quantitative PCR;
mm, mmHg. |
Discussion
The regulation of hepatocellular glycogen synthesis
and glycogenolysis is one of the principle methods in the
maintenance of blood glucose concentration. The effects of portal
hypertension on hepatocellular glycogen metabolism remain unclear.
The present study demonstrated that an increase in extracellular
pressure significantly inhibited hepatocellular glycogen synthesis
and GYS1 activity. Further experiments demonstrated that these
effects were closely associated with the p53/Pten pathway. This
pathway inhibits Akt signaling and glycogen synthesis (Fig. 5E). Therefore, the present study
revealed an association between mechanical pressure and hepatocyte
metabolism.
Mechanical factors, including pressure, influence
the extracellular microenvironment. It has been reported that such
factors regulate cellular proliferation and differentiation.
Numerous studies have demonstrated that mechanical force, such as
pressure and stretch, is an important regulator in cell metabolism
(28–30). The present study suggested that
portal hypertension significantly inhibited the synthesis of
hepatocellular glycogen. It has been reported that the right atrial
pressure of patients with portal hypertension has an interquartile
range of 12.0–15.5 mmHg (11,31).
The gradient pressures detected in this study were <15.5 mmHg;
therefore, it was hypothesized that this study could partially
reflect the pressure environment in vivo. Additionally, it
was previously demonstrated that the plasma glucagon levels of
patients with portal hypertension are particularly unstable
(32). The presented data
suggested that the influence of portal hypertension on glycogen
synthesis may provide a reason for this instability. Muscle is
another important organ in glycogen metabolism and is frequently
stimulated by mechanical forces (33,34).
Therefore, further studies focusing on the role of these mechanical
forces, including stress and tension in the muscle, glycogen
synthesis and glycogenolysis, are required.
The liver is the primary organ involved in the
regulation of blood glucose, and glycogen synthesis and
glycogenolysis are key regulatory processes. Previous studies have
demonstrated that glycogen synthesis is regulated by chemical
signals, including hormones and small molecules (35,36).
In the present study, it was established that pressure served an
important regulatory role in glycogen synthesis. Furthermore,
previous studies have confirmed that glycogen synthesis is tightly
regulated by intracellular and extracellular microenvironmental
signals (37,38). The Akt/GSK3β pathway is a critical
component of hepatocellular glycogen synthesis; notably, insulin
promotes the synthesis of glycogen by activating this pathway
(37). The present study revealed
that extracellular pressure inhibited this pathway, and regulated
the expression of associated genes. In addition to glycogen
synthesis and glycogenolysis, the liver also facilitates
gluconeogenesis and lipid metabolism, and previous studies have
demonstrated that the Akt1/GSK3β pathway is also critically
involved in gluconeogenesis and lipid metabolism (39,40).
These data suggested that portal hypertension may also serve a
principal role in gluconeogenesis and lipid metabolism.
The p53 pathway is frequently activated in response
to external stimuli, and chemotherapy-induced apoptosis is caused
by p53 activation (41). The
present study revealed that extracellular pressure induced
upregulation of p53 mRNA expression, inducing the expression of its
downstream gene, Pten. These results suggested that activation of
the p53 pathway may be one of the ways in which cells respond to
external stimuli. The p53 pathway regulates the metabolism of
cellular glucose and lipids (42,43);
these studies further demonstrated that when cells are exposed to
external stimuli at a low-intensity, p53 may be upregulated, and
subsequently inhibit glucose metabolism. Therefore, the p53 pathway
may serve a prominent role in the metabolic response to external
stimuli.
Despite these promising results, several questions
remain unanswered. Firstly, it is intriguing that the glycogen
concentration in the 15 mmHg pressure group was not considerably
decreased compared with in the 10 mmHg group. The reason for this
could be that 15 mmHg pressure may reduce glycogen concentration
compared to 10 mmHg; however, the difference may be too small and
therefore could not be detected. Secondly, this study indicated
that p53 is a critical gene that functions as a sensor that may
respond to mechanical pressure. However, further work is required
to reveal the direct relationship between pressure and p53. In
addition, this study demonstrated the effects of pressure on HepG2
and HL-7702 cell lines; further research should be undertaken to
reveal the physiological role of pressure in primary hepatocytes.
Genes associated with the regulation of apoptosis were
significantly upregulated; however, cell apoptosis was not affected
by mechanical pressure treatment for 24 h. One reason for this may
be that the alterations in the expression of apoptosis-associated
genes are insufficient to influence cell apoptosis in a short
period of time. Finally, the results revealed that pressure did not
affect cell viability and apoptosis in vitro. A further
study focusing on the effects of pressure on cell viability and
apoptosis, as well as glycogen metabolism, in vivo is
therefore suggested.
To the best of our knowledge, the present study is
the first to demonstrate that extracellular pressure significantly
inhibited hepatocellular glycogen synthesis. It was further
revealed that the p53 pathway was involved in the regulation of
hepatocellular glycogen synthesis. These results not only suggested
a regulatory effect for mechanical pressure in hepatocellular
carbohydrate metabolism, but also implied its role in
hepatocellular lipid. Given the current challenges of portal
hypertension treatment, the present study, and the associated
questions raised, demonstrated the requirement for further
investigation into the role of pressure in hepatocytes, and the
potential associated molecular mechanisms.
Acknowledgements
Not applicable.
Funding
This study was supported by the National Nature
Science Foundation of China (grant nos. NSFC-11602295 and
NSFC-11472300).
Availability of data and materials
All data generated or analyzed during this study are
included in this published article.
Authors' contributions
LZ and JC were involved in study conception and
design, manuscript revision, funding support and study supervision.
JS performed the experiments, data analysis and manuscript writing.
YS performed data analysis and manuscript writing. SS and XL
performed statistical analysis. All authors read and approved the
final manuscript.
Ethics approval and consent to
participate
Not applicable.
Patient consent for publication
Not applicable.
Competing interests
The authors declare that they have no competing
interests.
References
|
1
|
Nestor-Bergmann A, Goddard G and Woolner
S: Force and the spindle: Mechanical cues in mitotic spindle
orientation. Semin Cell Dev Biol. 34:133–139. 2014. View Article : Google Scholar : PubMed/NCBI
|
|
2
|
Lesman A, Notbohm J, Tirrell DA and
Ravichandran G: Contractile forces regulate cell division in
three-dimensional environments. J Cell Biol. 205:155–162. 2014.
View Article : Google Scholar : PubMed/NCBI
|
|
3
|
Harada S and Rodan GA: Control of
osteoblast function and regulation of bone mass. Nature.
423:349–355. 2003. View Article : Google Scholar : PubMed/NCBI
|
|
4
|
Robling AG, Castillo AB and Turner CH:
Biomechanical and molecular regulation of bone remodeling. Annu Rev
Biomed Eng. 8:455–498. 2006. View Article : Google Scholar : PubMed/NCBI
|
|
5
|
Bin G, Cuifang W, Bo Z, Jing W, Jin J,
Xiaoyi T, Cong C, Yonggang C, Liping A, Jinglin M and Yayi X: Fluid
shear stress inhibits TNF-α-induced osteoblast apoptosis via ERK5
signaling pathway. Biochem Biophys Res Commun. 466:117–123. 2015.
View Article : Google Scholar : PubMed/NCBI
|
|
6
|
Caiazzo M, Okawa Y, Ranga A, Piersigilli
A, Tabata Y and Lutolf MP: Defined three-dimensional
microenvironments boost induction of pluripotency. Nat Mater.
15:344–352. 2016. View
Article : Google Scholar : PubMed/NCBI
|
|
7
|
Altman GH, Horan RL, Martin I, Farhadi J,
Stark PR, Volloch V, Richmond JC, Vunjak-Novakovic G and Kaplan DL:
Cell differentiation by mechanical stress. ASEB J. 16:270–272.
2002.
|
|
8
|
Estes BT, Gimble JM and Guilak F:
Mechanical signals as regulators of stem cell fate. Curr Top Dev
Biol. 60:91–126. 2004. View Article : Google Scholar : PubMed/NCBI
|
|
9
|
Pillai AK, Andring B, Patel A, Trimmer C
and Kalva SP: Portal hypertension: A review of portosystemic
collateral pathways and endovascular interventions. Clin Radiol.
70:1047–1059. 2015. View Article : Google Scholar : PubMed/NCBI
|
|
10
|
Berzigotti A, Seijo S, Reverter E and
Bosch J: Assessing portal hypertension in liver diseases. Expert
Rev Gastroenterol Hepatol. 7:141–155. 2013. View Article : Google Scholar : PubMed/NCBI
|
|
11
|
Takuma Y, Nouso K, Morimoto Y, Tomokuni J,
Sahara A, Takabatake H, Matsueda K and Yamamoto H: Portal
hypertension in patients with liver cirrhosis: Diagnostic accuracy
of spleen stiffness. Radiology. 279:609–619. 2016. View Article : Google Scholar : PubMed/NCBI
|
|
12
|
Bloom S, Kemp W and Lubel J: Portal
hypertension: Pathophysiology, diagnosis and management. Intern Med
J. 45:16–26. 2015. View Article : Google Scholar : PubMed/NCBI
|
|
13
|
Ksiazyk J, Lyszkowska M and Kierkus J:
Energy metabolism in portal hypertension in children. Nutrition.
12:469–474. 1996. View Article : Google Scholar : PubMed/NCBI
|
|
14
|
Arias N, Méndez M, Arias J and Arias JL:
Brain metabolism and spatial memory are affected by portal
hypertension. Metab Brain Dis. 27:183–191. 2012. View Article : Google Scholar : PubMed/NCBI
|
|
15
|
Mohan P and Venkataraman J: Minimal
hepatic encephalopathy in noncirrhotic portal hypertension. Eur J
Gastroenterol Hepatol. 23:194–195. 2011. View Article : Google Scholar : PubMed/NCBI
|
|
16
|
Vogels BA, van Steynen B, Maas MA, Jörning
GG and Chamuleau RA: The effects of ammonia and portal-systemic
shunting on brain metabolism, neurotransmission and intracranial
hypertension in hyperammonaemia-induced encephalopathy. J Hepatol.
26:387–395. 1997. View Article : Google Scholar : PubMed/NCBI
|
|
17
|
Perisic M, Ilic-Mostic T, Stojkovic M,
Culafic D and Sarenac R: Doppler hemodynamic study in portal
hypertension and hepatic encephalopathy. Hepatogastroenterology.
52:156–160. 2005.PubMed/NCBI
|
|
18
|
Petersen MC, Vatner DF and Shulman GI:
Regulation of hepatic glucose metabolism in health and disease. Nat
Rev Endocrinol. 13:572–587. 2017. View Article : Google Scholar : PubMed/NCBI
|
|
19
|
Boden G, Cheung P, Stein TP, Kresge K and
Mozzoli M: FFA cause hepatic insulin resistance by inhibiting
insulin suppression of glycogenolysis. Am J Physiol Endocrinol
Metab. 283:E12–E19. 2002. View Article : Google Scholar : PubMed/NCBI
|
|
20
|
Yang WM, Jeong HJ, Park SY and Lee W:
Saturated fatty acid-induced miR-195 impairs insulin signaling and
glycogen metabolism in HepG2 cells. FEBS Lett. 588:3939–3946. 2014.
View Article : Google Scholar : PubMed/NCBI
|
|
21
|
Kir S, Beddow SA, Samuel VT, Miller P,
Previs SF, Suino-Powell K, Xu HE, Shulman GI, Kliewer SA and
Mangelsdorf DJ: FGF19 as a postprandial, insulin-independent
activator of hepatic protein and glycogen synthesis. Science.
331:1621–1624. 2011. View Article : Google Scholar : PubMed/NCBI
|
|
22
|
Liu TY, Shi CX, Gao R, Sun HJ, Xiong XQ,
Ding L, Chen Q, Li YH, Wang JJ, Kang YM and Zhu GQ: Irisin inhibits
hepatic gluconeogenesis and increases glycogen synthesis via the
PI3K/Akt pathway in type 2 diabetic mice and hepatocytes. Clin Sci
(Lond). 129:839–850. 2015. View Article : Google Scholar : PubMed/NCBI
|
|
23
|
Prats C, Graham TE and Shearer J: The
dynamic life of the glycogen granule. J Biol Chem. 293:7089–7098.
2018. View Article : Google Scholar : PubMed/NCBI
|
|
24
|
Watanabe S, Nagashio Y, Asaumi H, Nomiyama
Y, Taguchi M, Tashiro M, Kihara Y, Nakamura H and Otsuki M:
Pressure activates rat pancreatic stellate cells. Am J Physiol
Gastrointest Liver Physiol. 287:G1175–G1181. 2004. View Article : Google Scholar : PubMed/NCBI
|
|
25
|
Wu HJ, Zhang ZQ, Yu B, Liu S, Qin KR and
Zhu L: Pressure activates Src-dependent FAK-Akt and ERK1/2
signaling pathways in rat hepatic stellate cells. Cell Physiol
Biochem. 26:273–280. 2010. View Article : Google Scholar : PubMed/NCBI
|
|
26
|
Livak KJ and Schmittgen TD: Analysis of
relative gene expression data using real-time quantitative PCR and
the 2(-Delta Delta C(T)) method. Methods. 25:402–408. 2001.
View Article : Google Scholar : PubMed/NCBI
|
|
27
|
Fang W, Guo J, Cao Y, Wang S, Pang C, Li
M, Dou L, Man Y, Huang X, Shen T and Li J: MicroRNA-20a-5p
contributes to hepatic glycogen synthesis through targeting p63 to
regulate p53 and PTEN expression. J Cell Mol Med. 20:1467–1480.
2016. View Article : Google Scholar : PubMed/NCBI
|
|
28
|
Isogai T, Park JS and Danuser G: Cell
forces meet cell metabolism. Nat Cell Biol. 19:591–593. 2017.
View Article : Google Scholar : PubMed/NCBI
|
|
29
|
Dziegala M, Kobak KA, Kasztura M, Bania J,
Josiak K, Banasiak W, Ponikowski P and Jankowska EA: Iron depletion
affects genes encoding mitochondrial electron transport chain and
genes of non-oxidative metabolism, pyruvate kinase and lactate
dehydrogenase, in primary human cardiac myocytes cultured upon
mechanical stretch. Cells. 7(pii): E1752018. View Article : Google Scholar : PubMed/NCBI
|
|
30
|
Yi SH, Zhang Y, Tang D and Zhu L:
Mechanical force and tensile strain activated hepatic stellate
cells and inhibited retinol metabolism. Biotechnol Lett.
37:1141–1152. 2015. View Article : Google Scholar : PubMed/NCBI
|
|
31
|
Denault AY, Beaubien-Souligny W,
Elmi-Sarabi M, Eljaiek R, El-Hamamsy I, Lamarche Y, Chronopoulos A,
Lambert J, Bouchard J and Desjardins G: Clinical significance of
portal hypertension diagnosed with bedside ultrasound after cardiac
surgery. Anesth Analg. 124:1109–1115. 2017. View Article : Google Scholar : PubMed/NCBI
|
|
32
|
Johnson TJ, Quigley EM, Adrian TE, Jin G
and Rikkers LF: Glucagon, stress, and portal hypertension. Plasma
glucagon levels and portal hypertension in relation to anesthesia
and surgical stress. Dig Dis Sci. 40:1816–1823. 1995. View Article : Google Scholar : PubMed/NCBI
|
|
33
|
Mohamed JS, Lopez MA and Boriek AM:
Mechanical stretch up-regulates microRNA-26a and induces human
airway smooth muscle hypertrophy by suppressing glycogen synthase
kinase-3β. J Biol Chem. 285:29336–29347. 2010. View Article : Google Scholar : PubMed/NCBI
|
|
34
|
Ørtenblad N, Westerblad H and Nielsen J:
Muscle glycogen stores and fatigue. J Physiol. 591:4405–4413. 2013.
View Article : Google Scholar : PubMed/NCBI
|
|
35
|
Roach PJ, Depaoli-Roach AA, Hurley TD and
Tagliabracci VS: Glycogen and its metabolism: Some new developments
and old themes. Biochem J. 441:763–787. 2012. View Article : Google Scholar : PubMed/NCBI
|
|
36
|
Nakano K, Takeshita S, Kawasaki N,
Miyanaga W, Okamatsu Y, Dohi M and Nakagawa T: AJS1669, a novel
small-molecule muscle glycogen synthase activator, improves glucose
metabolism and reduces body fat mass in mice. Int J Mol Med.
39:841–850. 2017. View Article : Google Scholar : PubMed/NCBI
|
|
37
|
Han C, Wei S, He F, Liu D, Wan H, Liu H,
Li L, Xu H, Du X and Xu F: The regulation of lipid deposition by
insulin in goose liver cells is mediated by the PI3K-AKT-mTOR
signaling pathway. PLoS One. 10:e00987592015. View Article : Google Scholar : PubMed/NCBI
|
|
38
|
Nocito L, Kleckner AS, Yoo EJ, Jones Iv
AR, Liesa M and Corkey BE: The extracellular redox state modulates
mitochondrial function, gluconeogenesis, and glycogen synthesis in
murine hepatocytes. PLoS One. 10:e01228182015. View Article : Google Scholar : PubMed/NCBI
|
|
39
|
Chang YS, Tsai CT, Huangfu CA, Huang WY,
Lei HY, Lin CF, Su IJ, Chang WT, Wu PH, Chen YT, et al: ACSL3 and
GSK-3β are essential for lipid upregulation induced by endoplasmic
reticulum stress in liver cells. J Cell Biochem. 112:881–893. 2011.
View Article : Google Scholar : PubMed/NCBI
|
|
40
|
Venna VR, Benashski SE, Chauhan A and
McCullough LD: Inhibition of glycogen synthase kinase-3β enhances
cognitive recovery after stroke: The role of TAK1. Learn Mem.
22:336–343. 2015. View Article : Google Scholar : PubMed/NCBI
|
|
41
|
Hientz K, Mohr A, Bhakta-Guha D and
Efferth T: The role of p53 in cancer drug resistance and targeted
chemotherapy. Oncotarget. 8:8921–8946. 2017. View Article : Google Scholar : PubMed/NCBI
|
|
42
|
Jiang P, Du W, Wang X, Mancuso A, Gao X,
Wu M and Yang X: p53 regulates biosynthesis through direct
inactivation of glucose-6-phosphate dehydrogenase. Nat Cell Biol.
13:310–316. 2011. View Article : Google Scholar : PubMed/NCBI
|
|
43
|
Liu J, Zhang C, Hu W and Feng Z: Tumor
suppressor p53 and its mutants in cancer metabolism. Cancer Lett.
356:197–203. 2015. View Article : Google Scholar : PubMed/NCBI
|