Introduction
Cisplatin is one of the frequently used
chemotherapeutic drugs for efficient treatment of various malignant
tumors in the clinic (1).
Unfortunately, patients often experience multiple serious side
effects, including nephrotoxicity, neurotoxicity, cardiotoxicity,
hepatotoxicity, ototoxicity, vomiting and nausea (2). Among them, acute kidney injury (AKI)
represents a common adverse effect, which is estimated to occur in
~20–78% of patients undergoing cisplatin-based chemotherapy
(3–6). Cisplatin can be preferentially
accumulated in renal proximal tubule epithelial cells to trigger an
excessive inflammatory response, oxidative stress, and then cell
apoptosis and necrosis (7), all of
which promote the development of acute renal failure and lead to
the subsequent high mortality rates in patients. Therefore, there
is an urgent demand for the discovery of effective strategies to
ameliorate cisplatin-induced AKI and improve patient survival, in
order to broaden the clinical application of cisplatin.
Recently, accumulating evidence has suggested that
transplantation of mesenchymal stem cells (MSCs) may be a
potentially effective therapy for cisplatin-induced AKI (8–10).
MSCs are self-renewable multipotent progenitor cells with the
potential to transdifferentiate into a variety of cell types under
certain conditions, including renal proximal tubule epithelial
cells (11). Thereby, MSC-based
therapy, on one hand, may repair the injured renal tissues by
induction of cell regeneration to replace the damage cells. On the
other hand, MSCs have immunomodulatory characteristics that promote
the induction of anti-inflammatory regulatory T (Treg) cells
(12), but inhibit the influx of
pro-inflammatory leukocytes, macrophages, dendritic cells (DCs),
neutrophils, CD4+ T helper (Th), and CD8+
cytotoxic T lymphocytes (CTLs) (8), leading to production of less
inflammatory cytokines that cause renal cell apoptosis (12,13).
Despite evidence for the therapeutic potential of MSCs (10), the clinical use of MSCs remains
limited because the molecular mechanisms remain not well understood
and the cost is high. Therefore, further investigation of the
mechanisms of MSC therapy for AKI and exploration of drugs with
similar function to MSCs are of the essence.
MicroRNAs (miRNAs) are a class of small RNAs (18–25
nucleotides) that function in regulation of cellular processes by
downregulating target gene expression via binding to the
3′-untranslated region (UTR). There has been evidence to indicate
that miRNAs participate in the pathogenesis of cisplatin-induced
AKI (14,15). For example, Guo et al
(16) reported that miR-709 was
significantly upregulated in the proximal tubular cells of a
cisplatin-induced AKI mouse model and biopsy samples of human AKI
kidney tissue and correlated with the severity of kidney injury.
In vitro experiments indicated that overexpression of
miR-709 markedly induced mitochondrial dysfunction and cell
apoptosis by downregulating mitochondrial transcriptional factor A
(TFAM) (16). Qin et al
(17) reported that cisplatin
treatment in the rat renal proximal tubular cell line NRK-52E
significantly upregulated the levels of miR-449. Inhibition of
miR-449 by its sponge transfection in cisplatin-treated cells
significantly promoted cell viability and suppressed cell apoptosis
by downregulating acetylated p53 and BCL2 associated X (BAX)
protein levels (17). Thus,
regulation of miRNA/mRNA interactions may be an important mechanism
underlying the functions of MSCs, or other drugs with similar
function to MSCs, for treatment of cisplatin-induced AKI; however,
these have been rarely validated (18,19).
The purpose of the present study was to integrate
the transcriptomics expression data from a cisplatin-induced AKI
rat model and the miRNA expression profiles from a
cisplatin-induced AKI rat model undergoing MSC treatment, in order
to screen for crucial miRNA/mRNA targets that may explain the
mechanism of MSC function in AKI. The differentially expressed
genes (DEGs) were also uploaded into the connectivity map (CMAP)
database to identify potential drugs with similar functions to
MSCs.
Materials and methods
Microarray data
Microarray datasets under accession numbers GSE85957
(20,21) and GSE66761 (18) were downloaded from the Gene
Expression Omnibus (GEO) database of the National Center of
Biotechnology Information (http://www.ncbi.nlm.nih.gov/geo/). The GSE85957
dataset (platform, GPL1355; Rat230_2; Affymetrix Rat Genome 230 2.0
Array) compared the gene expression profiles in kidney tissues
isolated from male Han Wistar rats of AKI model induced by
intraperitoneal administration of cisplatin (1 or 3 mg/kg, once)
for 3, 5, 8 and 26 days (n=38) and controls (n=19). The GSE66761
dataset (platform, GPL14860; Agilent-031189
Unrestricted_Rat_miRNA_v16.0_Microarray) compared the miRNA
expression profiles in kidney tissues isolated from male
Sprague-Dawley control rats (n=2), AKI model induced by
administration of 6 mg/kg cisplatin for 24 h (n=3) and treatment
group with MSCs for 4 days (n=3). The successful establishment of
the AKI model was confirmed by chemistry parameters (increased
serum creatinine) and histopathological examination (18,20,21).
MSCs were identified by the expression of typical surface markers
(positive for CD29, CD44 and CD90, but negative for CD45) and their
osteogenic and adipogenic differentiation abilities (18).
Data preprocessing and identification
of DEGs and differentially expressed miRNAs (DEMs)
The raw CEL files were preprocessed and normalized
using the robust multichip average (RMA) algorithm (22) in the R Bioconductor affy package
(version 3.4.1; http://www.bioconductor.org/packages/release/bioc/html/affy.html).
The DEGs between AKI and control groups, and the DEMs between AKI,
control, and MSC treatment groups, were identified using the linear
models for microarray (LIMMA) method (23) in the Bioconductor R package
(http://www.bioconductor.org/packages/release/bioc/html/limma.html).
P<0.05 and |logFC (fold change)| >0.5 were set as the cut-off
points for screening the DEGs and DEMs. Bidirectional hierarchical
clustering heatmaps of DEGs and DEMs were constructed using the R
package pheatmap (version, 1.0.8; http://cran.r-project.org/web/packages/pheatmap/index.html).
Protein-protein interaction (PPI)
network construction
The DEGs were mapped into the PPI data extracted
from the search tool for the retrieval of interacting genes
(STRING; version 10.0; http://string-db.org/) database (24) to obtain the interaction pairs of
DEGs which were then used to construct the PPI network using the
Cytoscape software (version 3.6.1; www.cytoscape.org/) (25). The topological characteristic of
degree [the number of edges (interactions) of a node (protein)] was
calculated and plotted with ggplot2 in R package to screen hub
genes. To identify functionally related genes from the PPI network,
module analysis was then performed by using the Molecular Complex
Detection (MCODE) plugin of Cytoscape software with default
parameters (ftp://ftp.mshri.on.ca/pub/BIND/Tools/MCODE) (26). Significant modules were defined as
k-core ≥4 and nodes ≥6.
miRNA-target gene regulatory
network
The related target genes of DEMs were predicted
using the miRWalk database (version 2.0; http://zmf.umm.uni-heidelberg.de/apps/zmf/mirwalk2)
(27). Then, the target genes of
DEMs were overlapped with the DEGs to obtain the negative
relationships between DEMs and DEGs, which was used to construct
the miRNA-target gene regulatory network using the Cytoscape
software (version 3.6.1; www.cytoscape.org/) (25).
Function enrichment analysis
Kyoto encyclopedia of genes and genomes (KEGG)
pathway and Gene ontology (GO) enrichment analyses were performed
in order to explore the underlying functions of all DEGs, genes in
PPI network and modules using The Database for Annotation,
Visualization and Integrated Discovery (DAVID) (version 6.8;
http://david.abcc.ncifcrf.gov).
P<0.05 was selected as the threshold to determine the
significant enrichment for GO terms and KEGG pathways.
Screening of small molecule drugs
similar to MSC treatment
The DEGs were uploaded into the CMAP database
(http://www.broadinstitute.org/cmap/)
to identify potential drugs associated with these DEGs with the
threshold values of P<0.05 and |mean|>0.4. An enrichment
score close to +1 indicated that the corresponding small molecules
induced a similar expression profile of DEGs, while an enrichment
score close to −1 suggested that the corresponding small molecules
reversed the expression of DEGs.
Results
Identification of DEGs between the AKI
model and control groups
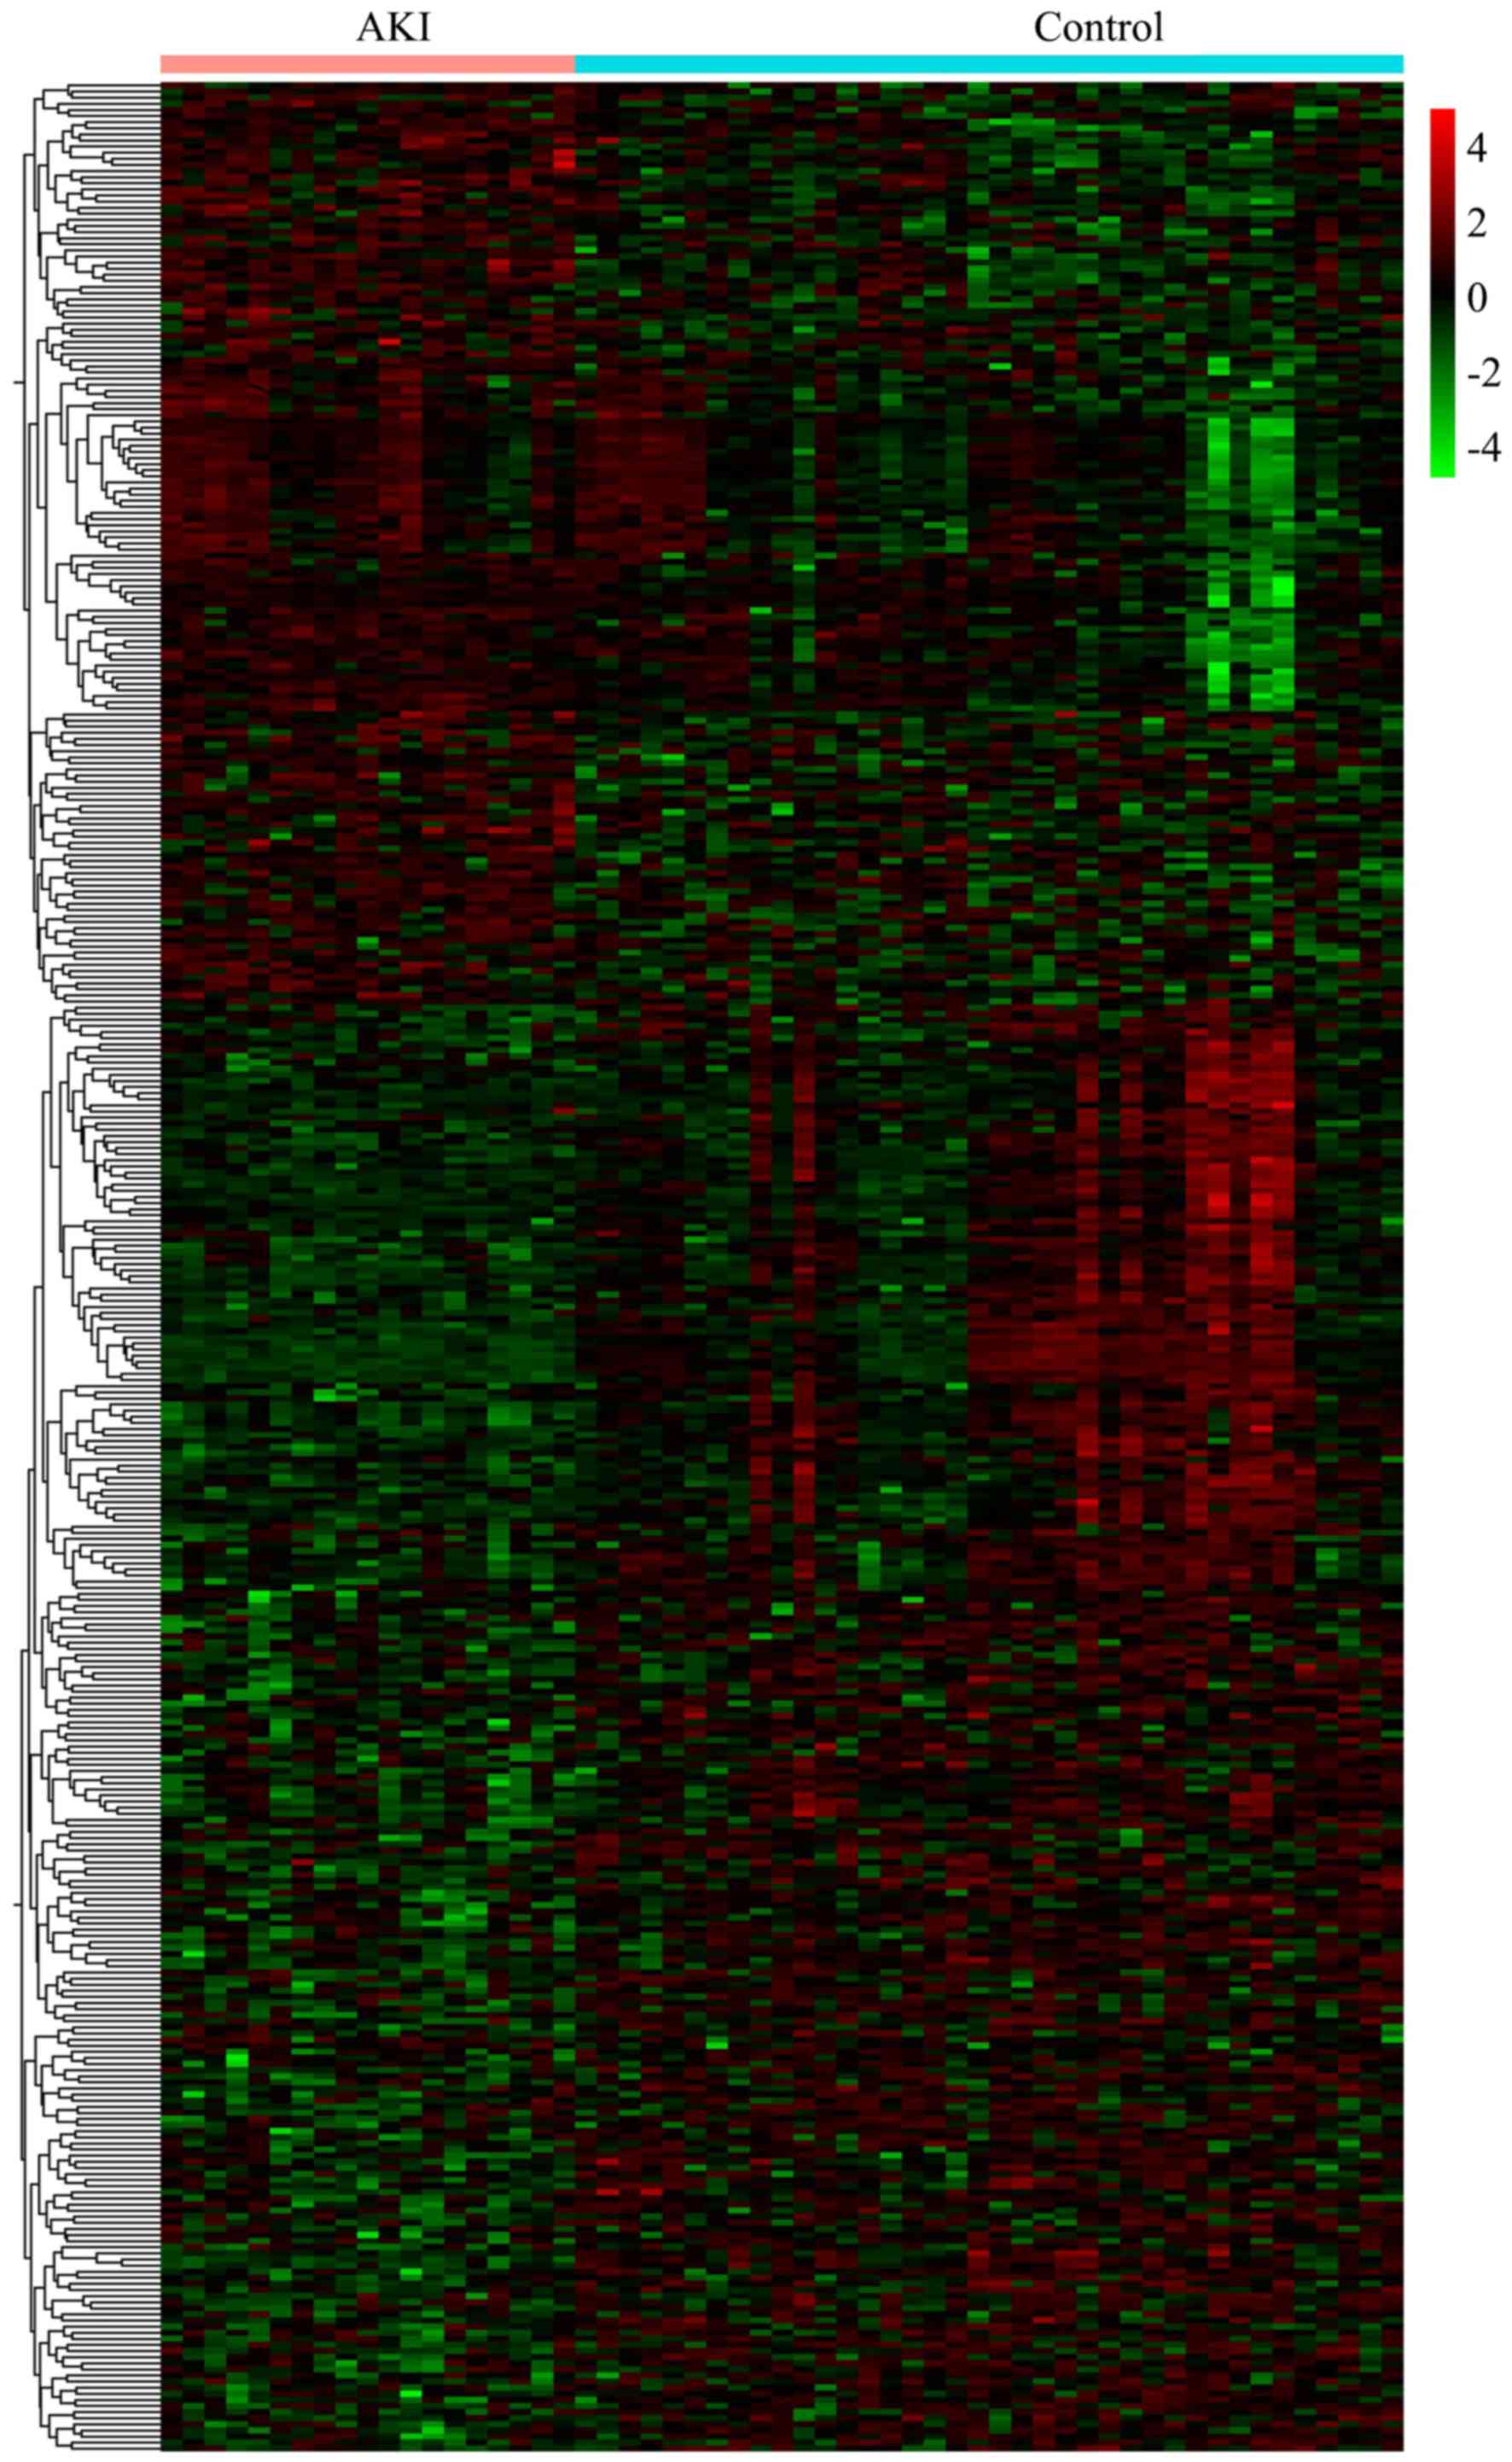
Following preprocessing, a total of 388 DEGs were
identified between AKI model and control, including 153
downregulated [prostaglandin-endoperoxide synthase 2 (Ptgs2);
angiotensinogen (Agt)] and 235 upregulated genes [serpin family E
member 1 (Serpine1); C-C motif chemokine ligand 2 (Ccl2); Fos
proto-oncogene AP-1 transcription factor subunit (Fos); FosB
proto-oncogene AP-1 transcription factor subunit (FosB); C-X-C
motif chemokine ligand 10 (Cxcl10); TIMP metallopeptidase inhibitor
1 (Timp1)]. The expression profiles of the most notable DEGs (as
determined by subsequent PPI, function enrichment and miRNA network
analyses) are presented in Table
I. Heat map analysis revealed that these DEGs accurately
distinguished the samples into two groups (Fig. 1).
 | Table I.Differentially expressed genes and
miRNAs. |
Table I.
Differentially expressed genes and
miRNAs.
| A, AKI model vs.
control |
|---|
|
|---|
| Gene | logFC | P-value |
|---|
| Lingo4 | −0.69 |
6.96×10⁻¹⁰ |
| Sytl3 | −0.53 |
3.80×10⁻⁷ |
| Rnf125 | −0.73 |
7.57×10⁻⁷ |
| Arntl | −0.63 |
4.69×10⁻⁶ |
| Epha4 | −0.64 |
6.25×10⁻⁶ |
| LOC685158 | −1.72 |
6.33×10⁻⁶ |
| Mlc1 | −0.73 |
2.07×10⁻⁵ |
| Kl | −0.56 |
2.21×10⁻³⁵ |
| Ptgs2 | −0.61 |
6.12×10⁻³ |
| Atg | −0.71 |
06.11×10⁻³ |
| Nr1d1 | 1.44 |
9.16×10⁻¹¹ |
| Egr1 | 1.48 |
3.47×10⁻¹⁰ |
| Cdkn1a | 1.82 |
4.84×10⁻¹⁰ |
| Plk2 | 1.48 |
1.46×10⁻⁹ |
| Ccng1 | 0.99 |
4.49×10⁻⁹ |
| Fos | 1.47 |
8.70×10⁻⁹ |
| Cxcl10 | 0.59 |
1.18×10⁻⁵ |
| Serpine1 | 0.97 |
3.97×10⁻⁵ |
| Timp1 | 0.73 |
7.37×10⁻³ |
| Ccl2 | 0.52 |
9.79×10⁻⁴ |
|
| B, AKI model vs.
control |
|
| miRNA | logFC | P-value |
|
| rno-let-7b | −0.58 |
6.22×10−45 |
|
rno-miR-3545-3p | −6.45 |
3.27×10⁻⁷ |
|
rno-miR-466b-2* | −4.07 |
2.29×10⁻⁶ |
| rno-miR-598-3p | −6.05 |
1.99×10⁻⁵ |
| rno-miR-192* | −6.03 |
2.77×10⁻⁵ |
| rno-miR-192 | −0.75 |
1.19×10⁻⁴ |
| rno-miR-218 | −0.68 |
5.85×10⁻⁴ |
| rno-miR-210 | −0.67 |
3.60×10⁻² |
| rno-miR-99a* | −4.72 |
4.39×10⁻² |
| rno-miR-378 | −0.53 |
4.91×10⁻² |
| rno-miR-21* | 71.49 |
4.89×10⁻⁶ |
| rno-miR-132 | 47.91 |
1.67×10⁻⁵ |
| rno-miR-455 | 41.03 |
2.68×10⁻⁵ |
| rno-miR-222 | 34.50 |
4.54×10⁻⁵ |
| rno-let-7i | 15.97 |
4.75×10⁻⁴ |
| rno-miR-21 | 15.22 |
5.50×10⁻⁴ |
| rno-miR-494 | 12.86 |
9.15×10⁻⁴ |
| rno-miR-34a | 12.55 |
9.84×10⁻⁴ |
| rno-miR-18a | 12.18 |
1.08×10⁻³ |
| rno-miR-146b | 11.53 |
1.27×10⁻³ |
|
| C, MSC treatment
vs. AKI |
|
| miRNA | logFC | P-value |
|
| rno-miR-146b | −1.06 |
4.01×10⁻⁴ |
| rno-miR-29b | −0.57 |
1.13×10⁻² |
| rno-miR-182 | −0.82 |
1.24×10⁻² |
| rno-miR-103 | −0.58 |
1.46×10⁻² |
| rno-miR-107 | −0.67 |
1.74×10⁻² |
| rno-miR-203 | −0.95 |
2.27×10⁻² |
| rno-miR-183 | −1.04 |
2.74×10⁻² |
| rno-miR-132 | −0.56 |
3.01×10⁻² |
| rno-miR-322 | −1.13 |
3.68×10⁻² |
| rno-miR-22* | −0.52 |
4.37×10⁻² |
|
rno-miR-125b-5p | 0.53 |
1.87×10⁻⁵ |
| rno-miR-532-5p | 0.91 |
2.25×10⁻⁴ |
| rno-miR-142-3p | 1.12 |
1.08×10⁻³ |
| rno-miR-222 | 1.50 |
1.44×10⁻³ |
|
rno-miR-199a-5p | 0.97 |
1.54×10⁻³ |
| rno-miR-145 | 0.55 |
2.14×10⁻³ |
| rno-miR-221 | 0.77 |
2.37×10⁻³ |
| rno-miR-378 | 0.58 |
1.25×10⁻² |
| rno-miR-210 | 1.11 |
1.62×10⁻² |
| rno-miR-99a* | 4.03 |
4.77×10⁻² |
Functional enrichment analysis for
DEGs between the AKI model and control groups
The downregulated DEGs were significantly enriched
into 7 KEGG pathways (e.g. renin-angiotensin system) and 57 GO
biological process terms (e.g. response to drug; positive
regulation of cell proliferation). The upregulated DEGs were
significantly enriched into 12 KEGG pathways (e.g. p53 signaling
pathway, amphetamine addiction, cytokine-cytokine receptor
interaction) and 161 GO biological process terms (e.g. cellular
response to fibroblast growth factor stimulus, negative regulation
of endothelial cell apoptotic process, response to drug, positive
regulation of monocyte chemotaxis, negative regulation of apoptotic
process, response to cytokine). The results from the enrichment
analysis, including the most notable KEGG pathways and GO processes
as determined by their association with key genes, are presented in
Table II.
| Table II.Function enrichment analysis for the
upregulated and downregulated differentially expressed genes. |
Table II.
Function enrichment analysis for the
upregulated and downregulated differentially expressed genes.
| A,
Downregulated |
|---|
|
|---|
| Category | Term | P-value | Genes involved |
|---|
| KEGG |
rno04614:Renin-angiotensin system |
1.94×10⁻³ | PREP, KLK1C8, AGT,
MAS1 |
| KEGG |
rno04726:Serotonergic synapse |
2.77×10⁻³ | ALOX15, CYP2D5,
PTGS2, ALOX12E, GNG13, CYP2C11 |
| KEGG |
rno00590:Arachidonic acid metabolism |
2.54×10⁻² | ALOX15, PTGS2,
ALOX12E, CYP2C11 |
| KEGG |
rno01230:Biosynthesis of amino acids |
2.70×10⁻² | SDS, OTC, SDSL,
PGAM2 |
| KEGG | rno00290:Valine,
leucine and isoleucine biosynthesis |
3.10×10⁻² | SDS, SDSL |
| KEGG | rno00260:Glycine,
serine and threonine metabolism |
3.72×10⁻² | SDS, SDSL,
PGAM2 |
| KEGG | rno00270:Cysteine
and methionine metabolism |
3.90×10⁻² | SDS, SDSL,
CDO1 |
| GO BP | GO:0040018~positive
regulation of multicellular organism growth |
1.96×10⁻³ | DRD2, AGT, ATP8A2,
HMGA2 |
| GO BP | GO:0042493~response
to drug |
2.04×10⁻² | TNFRSF11B, DAB1,
CYP1A1, CRYAA, PTGS2, SFRP2, DRD2, OTC, SNCA, MAS1, SLCO1A6 |
| GO BP | GO:0008284~positive
regulation of cell proliferation |
4.94×10⁻³ | ALOX15, KLK1C9,
IL5, PTGS2, SFRP2, AGT, HLX, MAS1, TFF2, HMGA2 |
| GO BP | GO:0030308~negative
regulation of cell growth |
7.78×10⁻³ | SFRP2, AGT, TRO,
EAF2, SLIT3 |
| GO BP | GO:0008285~negative
regulation of cell proliferation |
1.02×10⁻² | FEZF2, PLK5,
GTPBP4, PTGS2, SFRP2, DRD2, AGT, SLIT3 |
|
| B,
Upregulated |
|
|
Category | Term | P-value | Genes
involved |
|
| KEGG | rno04115:p53
signaling pathway |
2.22×10⁻⁴ | CDKN1A, BBC3,
SERPINE1, MDM2, SFN, CCNG1, GTSE1 |
| KEGG | rno05166:HTLV–I
infection |
9.41×10⁻⁴ | ZFP36, EGR1,
WNT10A, FOS, CDKN1A, ATF3, EGR2, RT1-M6-1, MYC, FOSL1, RT1-T24-4,
RT1-N2 |
| KEGG | rno00140:Steroid
hormone biosynthesis |
3.30×10⁻³ | CYP2B3, AKR1C3,
UGT2B17, HSD3B1, CYP1B1, CYP3A9 |
| KEGG |
rno04512:ECM-receptor interaction |
4.94×10⁻³ | LAMB3, COL6A5,
LAMC2, SV2B, THBS3, SPP1 |
| KEGG |
rno05031:Amphetamine addiction |
8.15×10⁻³ | FOS, STX1A, TH,
FOSB, GRIN3A |
| KEGG | rno04610:Complement
and coagulation cascades |
1.22×10⁻² | FGG, FGA, FGB,
SERPINE1, LOC100911545 |
| KEGG |
rno04060:Cytokine-cytokine receptor
interaction |
1.80×10⁻² | OSM, CCL2, CLCF1,
TNFRSF12A, CCR2, TNFRSF8, TNFRSF4, CXCL10 |
| KEGG |
rno00590:Arachidonic acid metabolism |
1.82×10⁻² | CYP2B3, GPX2,
ALOX5, PLA2G4B, PLA2G2D |
| KEGG |
rno05169:Epstein-Barr virus infection |
2.29×10⁻² | CDKN1A, ENTPD8,
MDM2,RT1-M6-1, HSPA1B, MYC, RT1-T24-4, RT1-N2 |
| KEGG | rno05204:Chemical
carcinogenesis |
2.66×10⁻² | CYP2B3, UGT2B17,
CYP1B1, CYP3A9, GSTP1 |
| KEGG | rno04913:Ovarian
steroidogenesis |
3.24×10⁻² | HSD3B1, CYP1B1,
ALOX5, PLA2G4B |
| KEGG | rno05206:MicroRNAs
in cancer |
3.28×10⁻² | CDKN1A, CYP1B1,
ABCB1A, MDM2, CCNG1, MYC |
| GO BP | GO:0042493~response
to drug |
5.75×10⁻⁷ | EGR1, CYP2B3,
HAVCR1, HSD3B1, CCL2, TH, FOSB, CPS1, RAD54L, JUNB, LCN2, FOS,
SLC1A2, CDKN1A, HMGCS2, ABCB1A, TGIF1, MDM2, ABCC2, FOSL1, MYC |
| GO BP | GO:0032496~response
to lipopolysaccharide |
3.53×10⁻⁵ | CCL2, TH, TNFRSF8,
CPS1, TNFRSF4, JUNB, CXCL10, FOS, UGT2B17, PDE5A, SERPINE1, CNR2,
NKX2-1 |
| GO BP | GO:0044344~cellular
response to fibroblast growth factor stimulus |
6.92×10⁻⁵ | ZFP36, CCL2,
HSD3B1,SERPINE1, CPS1, MYC |
| GO BP | GO:2000352~negative
regulation of endothelial cell apoptotic process |
2.44×10⁻⁴ | FGG, FGA, FGB,
SERPINE1, ANGPTL4 |
| GO BP | GO:0090026~positive
regulation of monocyte chemotaxis |
7.87×10⁻⁴ | CCL2, SERPINE1,
CCR2, CXCL10 |
| GO BP | GO:0043066~negative
regulation of apoptotic process |
9.74×10⁻⁴ | IER3, CLU, HSPA1B,
IL24, CCNG1, TIMP1, CDKN1A, PLK2, BTG2, MDM2, POU4F1, NQO1, FOXE3,
ANGPTL4, CYR61 |
| GO BP |
GO:0006954~inflammatory response |
3.79×10⁻³ | CCL2, CCR2, CNR2,
TNFRSF8, IL24, ALOX5, ADAM8, TNFRSF4, SPP1, CXCL10 |
| GO BP | GO:0034097~response
to cytokine |
1.94×10⁻² | FOS, SERPINE1,
FOSL1, JUNB, TIMP1 |
PPI network and module analyses for
DEGs between the AKI model and control groups
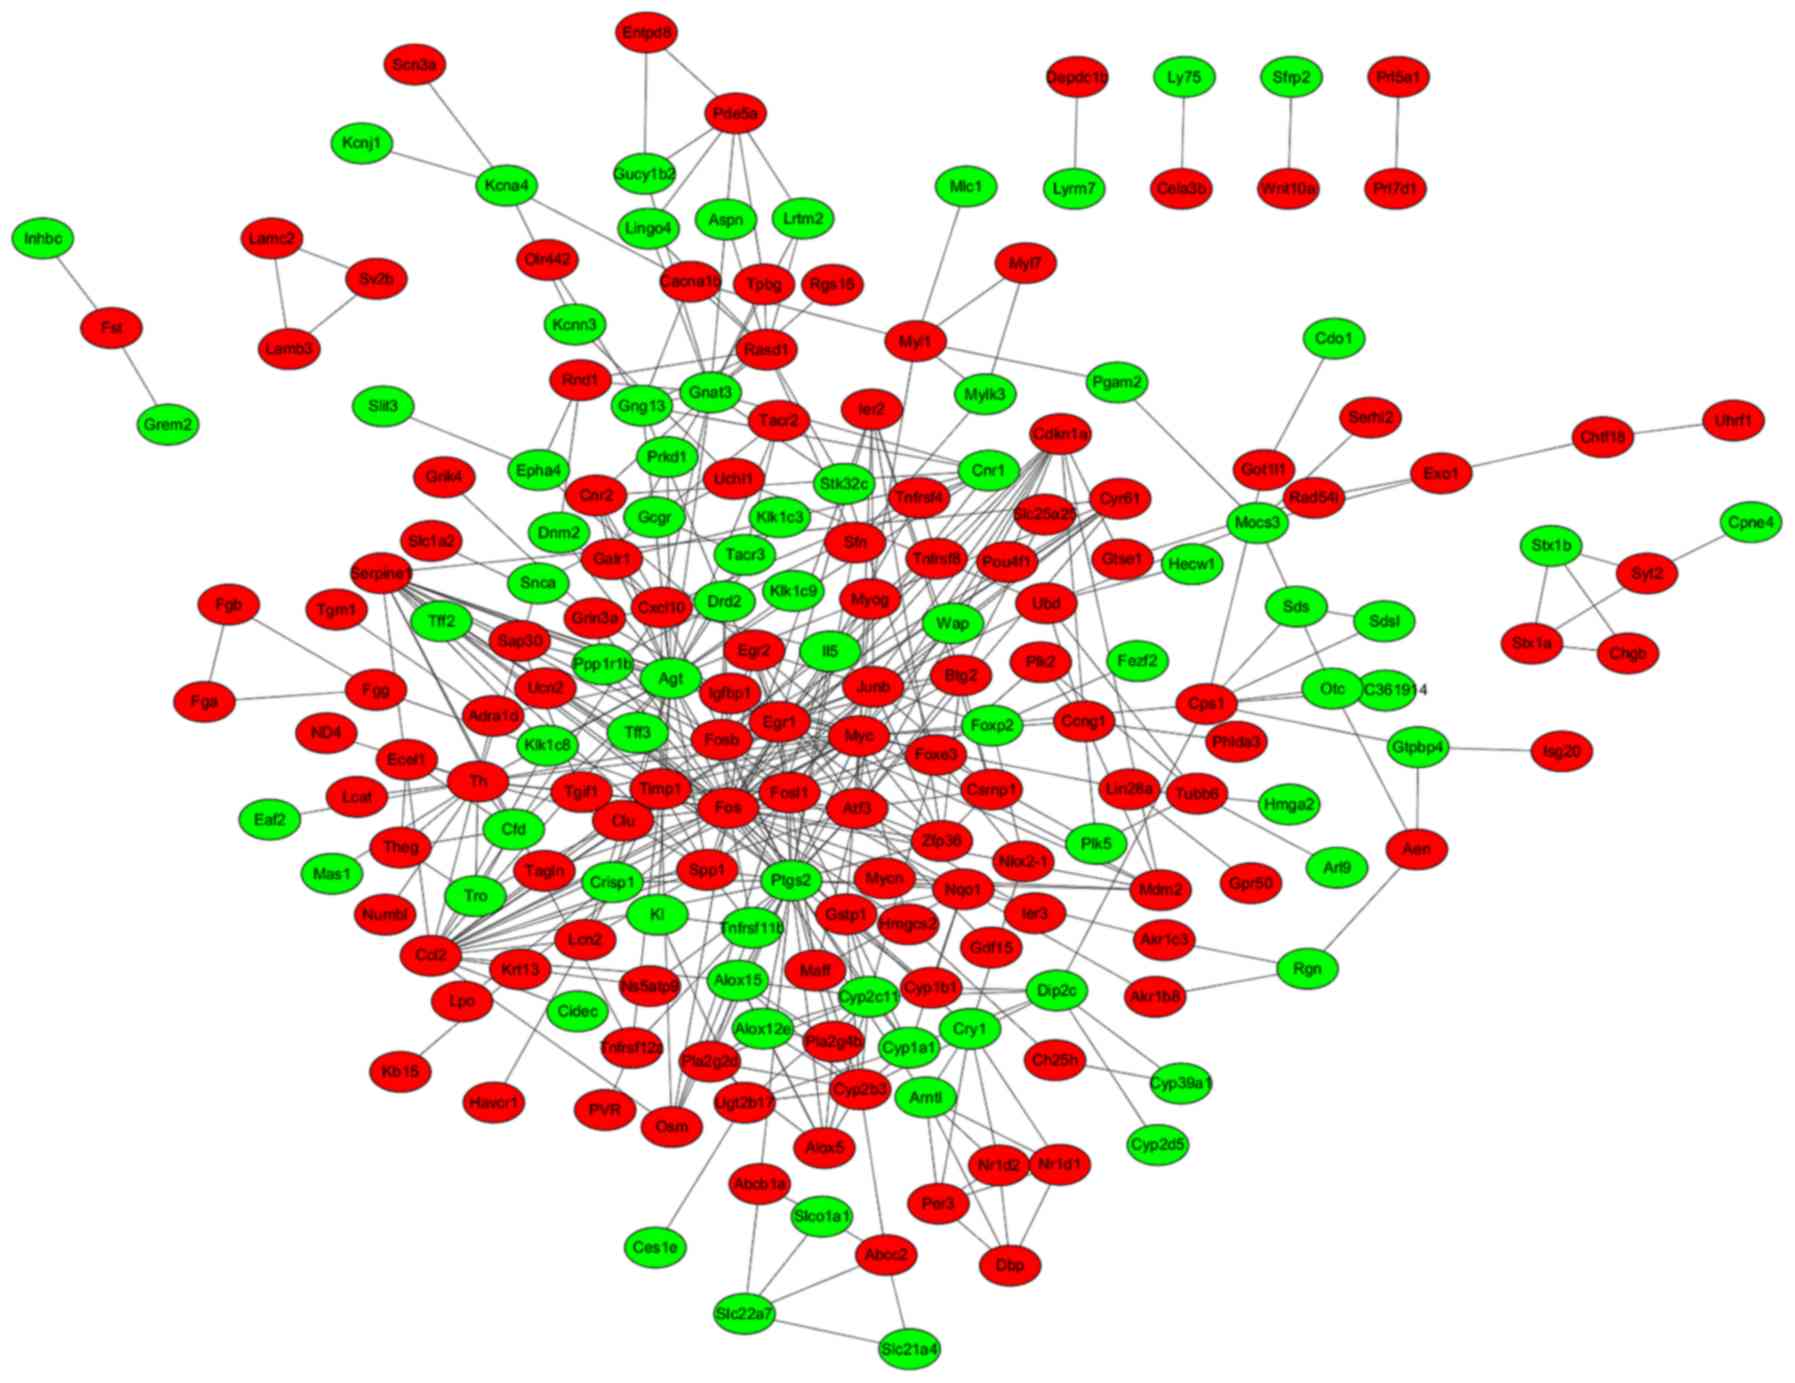
A total of 456 PPI pairs (e.g. Ccl2-Cxcl10,
Cxcl10-Ptgs2, Agt-Cxcl10, Timp1-Fos, Agt-Timp1, Timp1-Ptgs2) were
predicted from the STRING database after uploading the DEGs, which
were used for constructing the PPI network, including 74
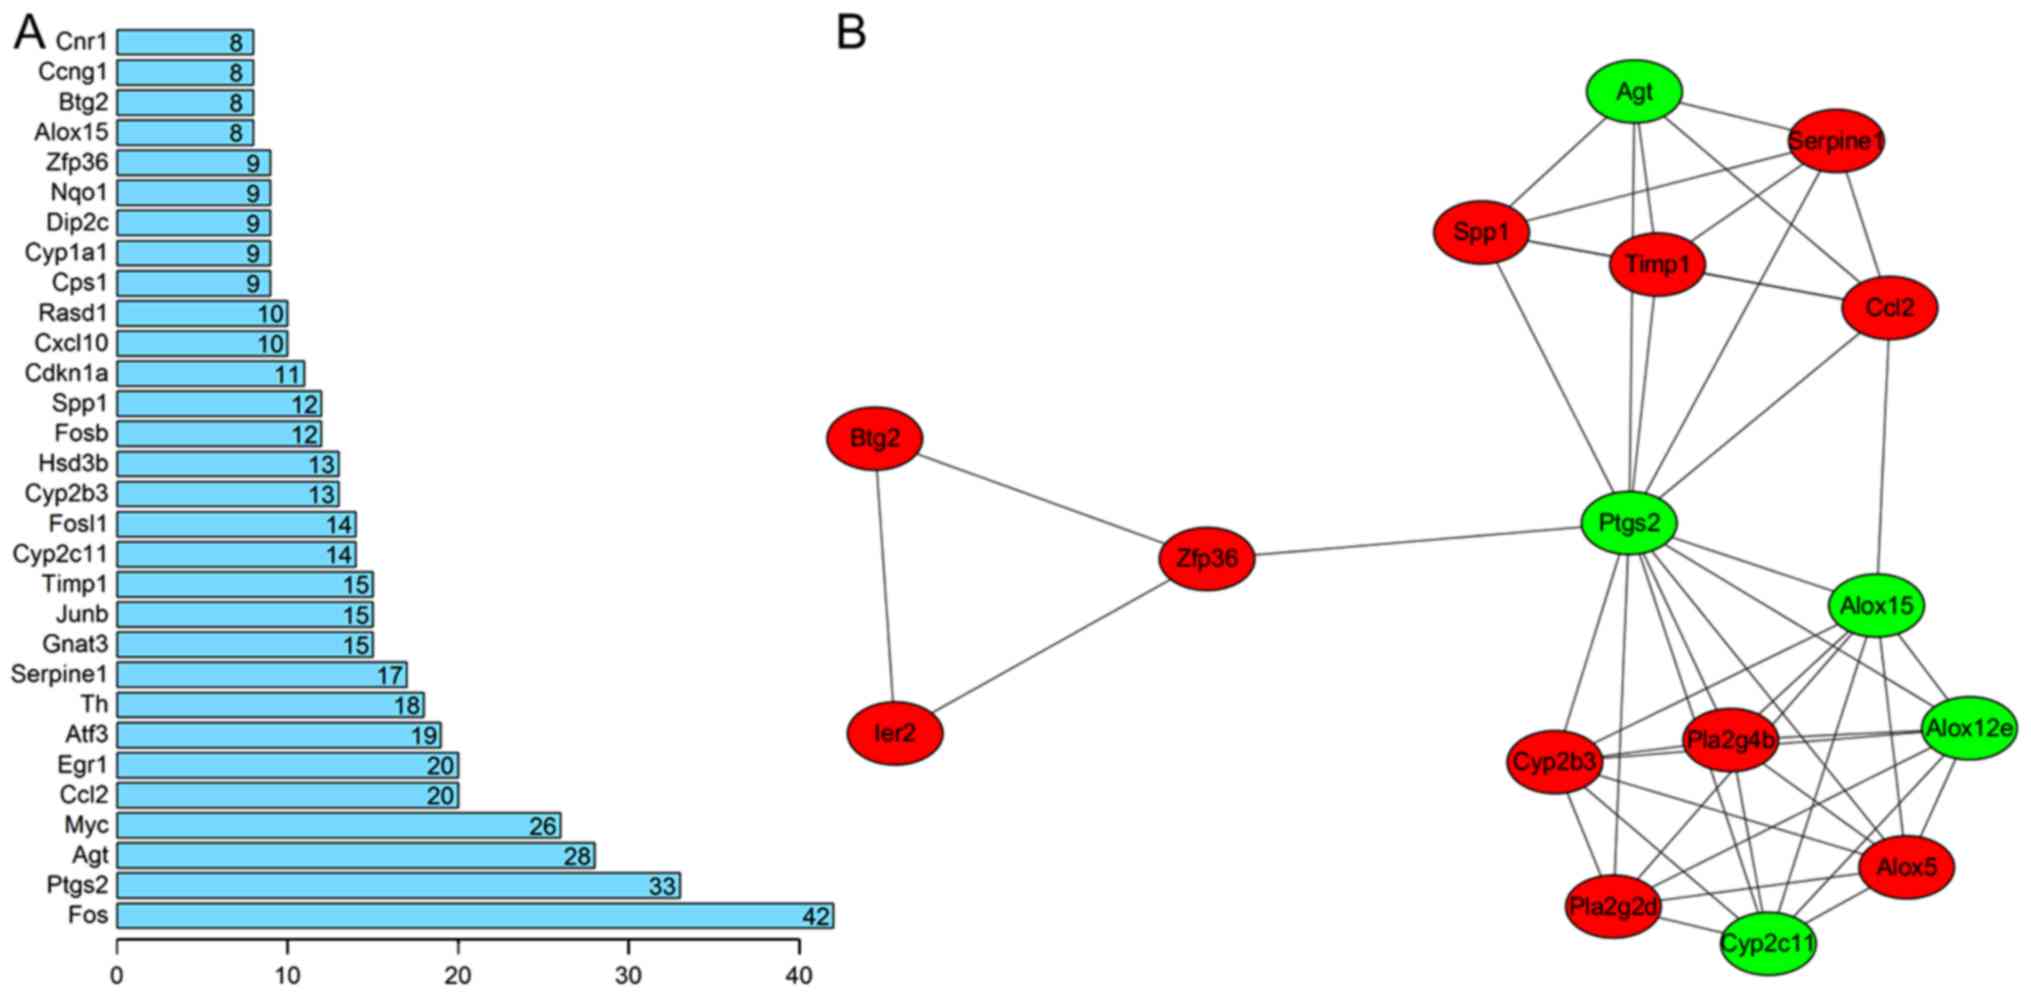
downregulated and 123 upregulated nodes (Fig. 2). The hub proteins in the PPI
network were screened by computing the degree (Fig. 3A). The results revealed that Fos
(degree=42), Ptgs2 (degree=33), Agt (degree=28), Ccl2 (degree=20),
Serpine1 (degree=17), Timp1 (degree=15), FosB (degree=12) and
Cxcl10 (degree=10) may be hub genes for AKI.
From the PPI network, only one significant module
was screened (Fig. 3B). The hub
genes of this module included Ptgs2, Agt, Serpine1, Ccl2 and Timp1.
Functional enrichment analyses revealed that the genes in this
module were involved multiple processes, including cellular
response to fibroblast growth factor stimulus (Serpine1, Ccl2),
inflammatory response (Ccl2, Ptgs2), response to cytokine
(Serpine1, Ptgs2, Timp1), positive regulation of cell proliferation
(Ptgs2, Agt, Timp1), and negative regulation of neuron apoptotic
process (Ccl2, Agt; Table
III).
| Table III.Function enrichment analysis for the
genes in module. |
Table III.
Function enrichment analysis for the
genes in module.
| Category | Term | P-value | Genes involved |
|---|
| KEGG |
rno00590:Arachidonic acid metabolism |
3.30×10⁻¹¹ | CYP2B3, ALOX15,
PTGS2, ALOX12E, ALOX5, CYP2C11, PLA2G4B, PLA2G2D |
| KEGG |
rno04726:Serotonergic synapse |
1.69×10⁻⁶ | ALOX15, PTGS2,
ALOX12E, ALOX5, CYP2C11, PLA2G4B |
| KEGG | rno00591:Linoleic
acid metabolism |
4.75×10⁻⁵ | ALOX15, CYP2C11,
PLA2G4B, PLA2G2D |
| KEGG | rno01100:Metabolic
pathways |
4.01×10⁻³ | CYP2B3, ALOX15,
PTGS2, ALOX12E, ALOX5, CYP2C11, PLA2G4B, PLA2G2D |
| KEGG | rno04913:Ovarian
steroidogenesis |
4.38×10⁻³ | PTGS2, ALOX5,
PLA2G4B |
| KEGG | rno05204:Chemical
carcinogenesis |
1.12×10⁻² | CYP2B3, PTGS2,
CYP2C11 |
| KEGG |
rno04750:Inflammatory mediator regulation
of TRP channels |
1.76×10⁻² | ALOX12E, CYP2C11,
PLA2G4B |
| KEGG |
rno00592:alpha-Linolenic acid
metabolism |
4.41×10⁻² | PLA2G4B,
PLA2G2D |
| GO BP | GO:0044344~cellular
response to fibroblast growth factor stimulus |
5.77×10⁻⁴ | ZFP36, CCL2,
SERPINE1 |
| GO BP |
GO:0055114~oxidation-reduction
process |
1.85×10⁻³ | CYP2B3, PTGS2,
ALOX12E, ALOX5, CYP2C11 |
| GO BP |
GO:0006954~inflammatory response |
1.88×10⁻³ | CCL2, PTGS2, ALOX5,
SPP1 |
| GO BP | GO:0034097~response
to cytokine |
3.16×10⁻³ | PTGS2, SERPINE1,
TIMP1 |
| GO BP | GO:0043524~negative
regulation of neuron apoptotic process |
7.84×10⁻³ | CCL2, BTG2,
AGT |
| GO BP | GO:0008284~positive
regulation of cell proliferation |
8.26×10⁻³ | ALOX15, PTGS2, AGT,
TIMP1 |
| GO BP | GO:0071222~cellular
response to lipopolysaccharide |
8.73×10⁻³ | ZFP36, CCL2,
SERPINE1 |
| GO BP | GO:0090026~positive
regulation of monocyte chemotaxis |
1.53×10⁻² | CCL2, SERPINE1 |
| GO BP | GO:0032496~response
to lipopolysaccharide |
2.33×10⁻² | CCL2, PTGS2,
SERPINE1 |
| GO BP | GO:0034612~response
to tumor necrosis factor |
3.00×10⁻² | CCL2, PTGS2 |
| GO BP | GO:0055093~response
to hyperoxia |
3.62×10⁻² | SERPINE1,
ALOX5 |
| GO BP | GO:0045429~positive
regulation of nitric oxide biosynthetic process |
3.78×10⁻² | PTGS2, AGT |
| GO BP | GO:0045907~positive
regulation of vasoconstriction |
3.78×10⁻² | PTGS2, ALOX5 |
| GO BP | GO:0008285~negative
regulation of cell proliferation |
4.00×10⁻² | BTG2, PTGS2,
AGT |
| GO BP |
GO:0030593~neutrophil chemotaxis |
4.85×10⁻² | CCL2, SPP1 |
DEMs identification
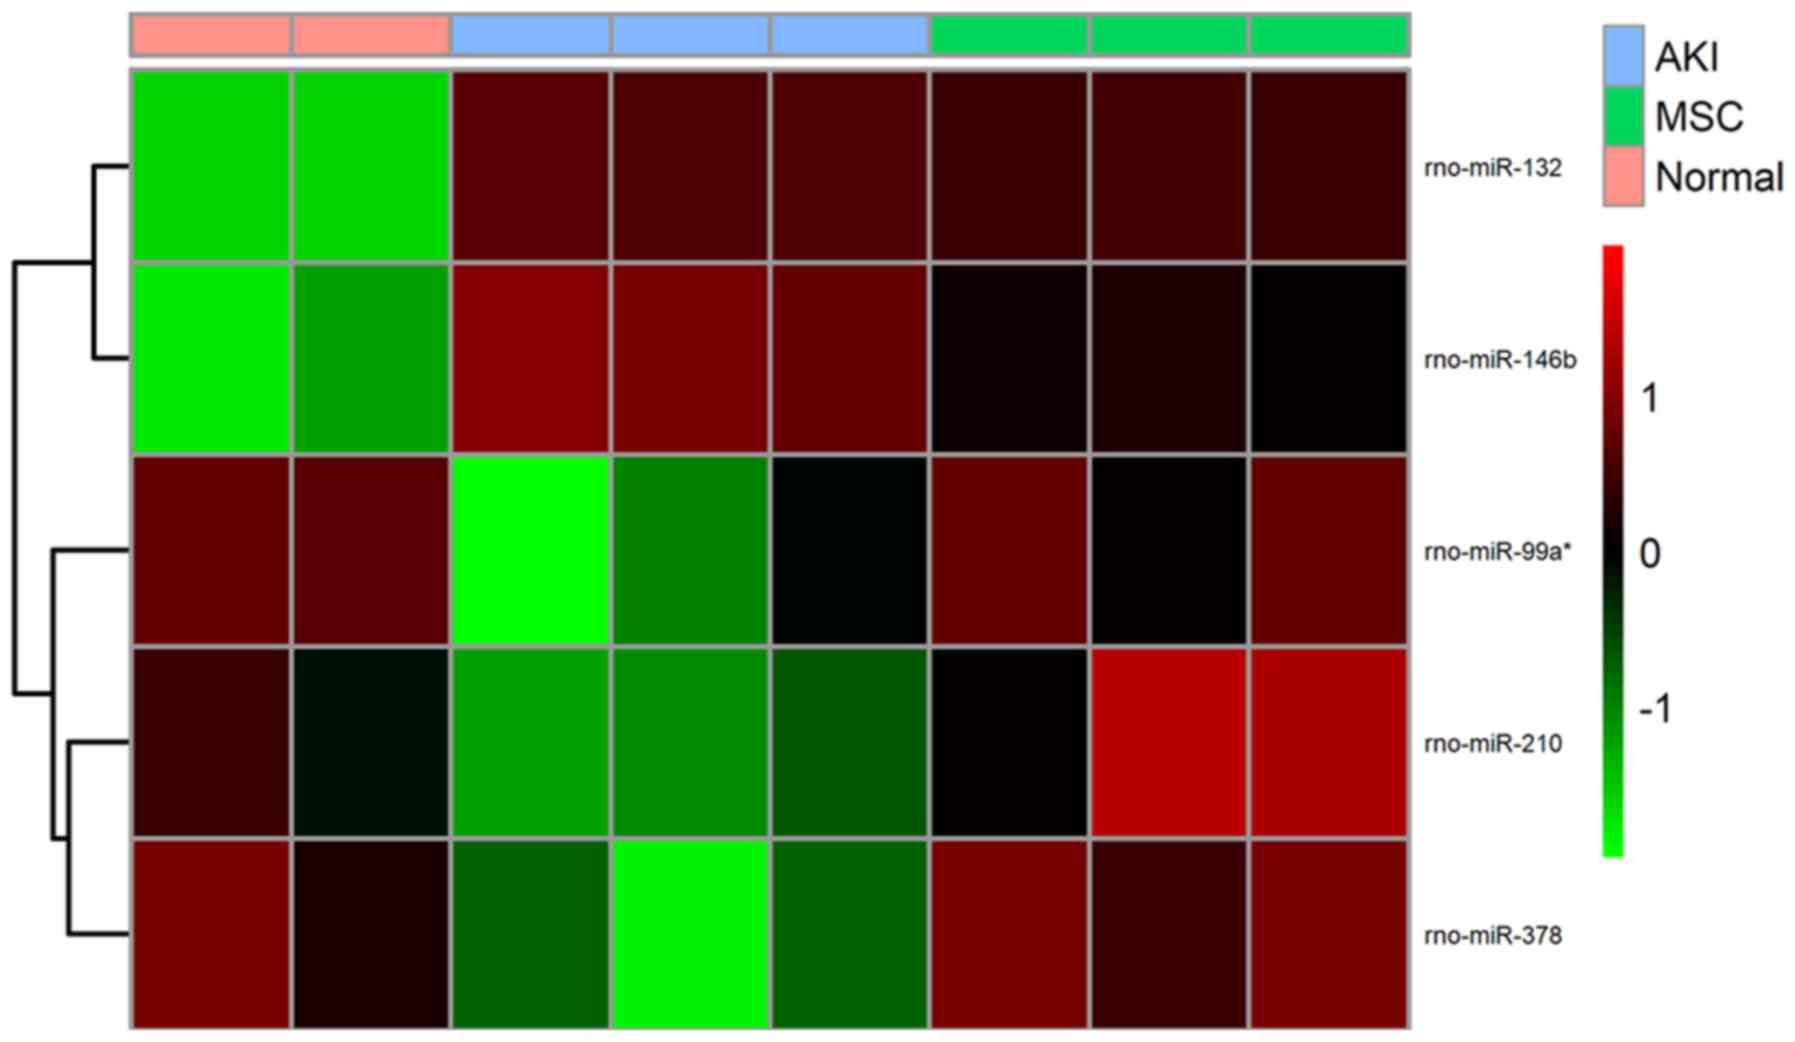
A total of 56 DEMs (29 downregulated and 21
upregulated miRNAs) were identified between AKI model and control
groups (Table I), while 40 DEMs
(10 downregulated and 30 upregulated miRNAs) were identified
between the MSC treatment and AKI groups. After comparing the
downregulated DEMs in AKI group with the upregulated DEMs in MSC
treatment group, 3 common miRNAs (rno-miR-378, rno-miR-210 and
rno-miR-99a*) were obtained. Comparison of the upregulated DEMs in
the AKI group with the downregulated DEMs in the MSC treatment
group detected 2 common miRNAs (rno-miR-146b and rno-miR-132).
These findings suggested these 5 miRNAs were crucial for the
development of AKI and that they could be reversed following MSC
treatment. Heat map analysis revealed that these miRNAs could
obviously distinguish the AKI from the control and MSC treatment
groups (Fig. 4).
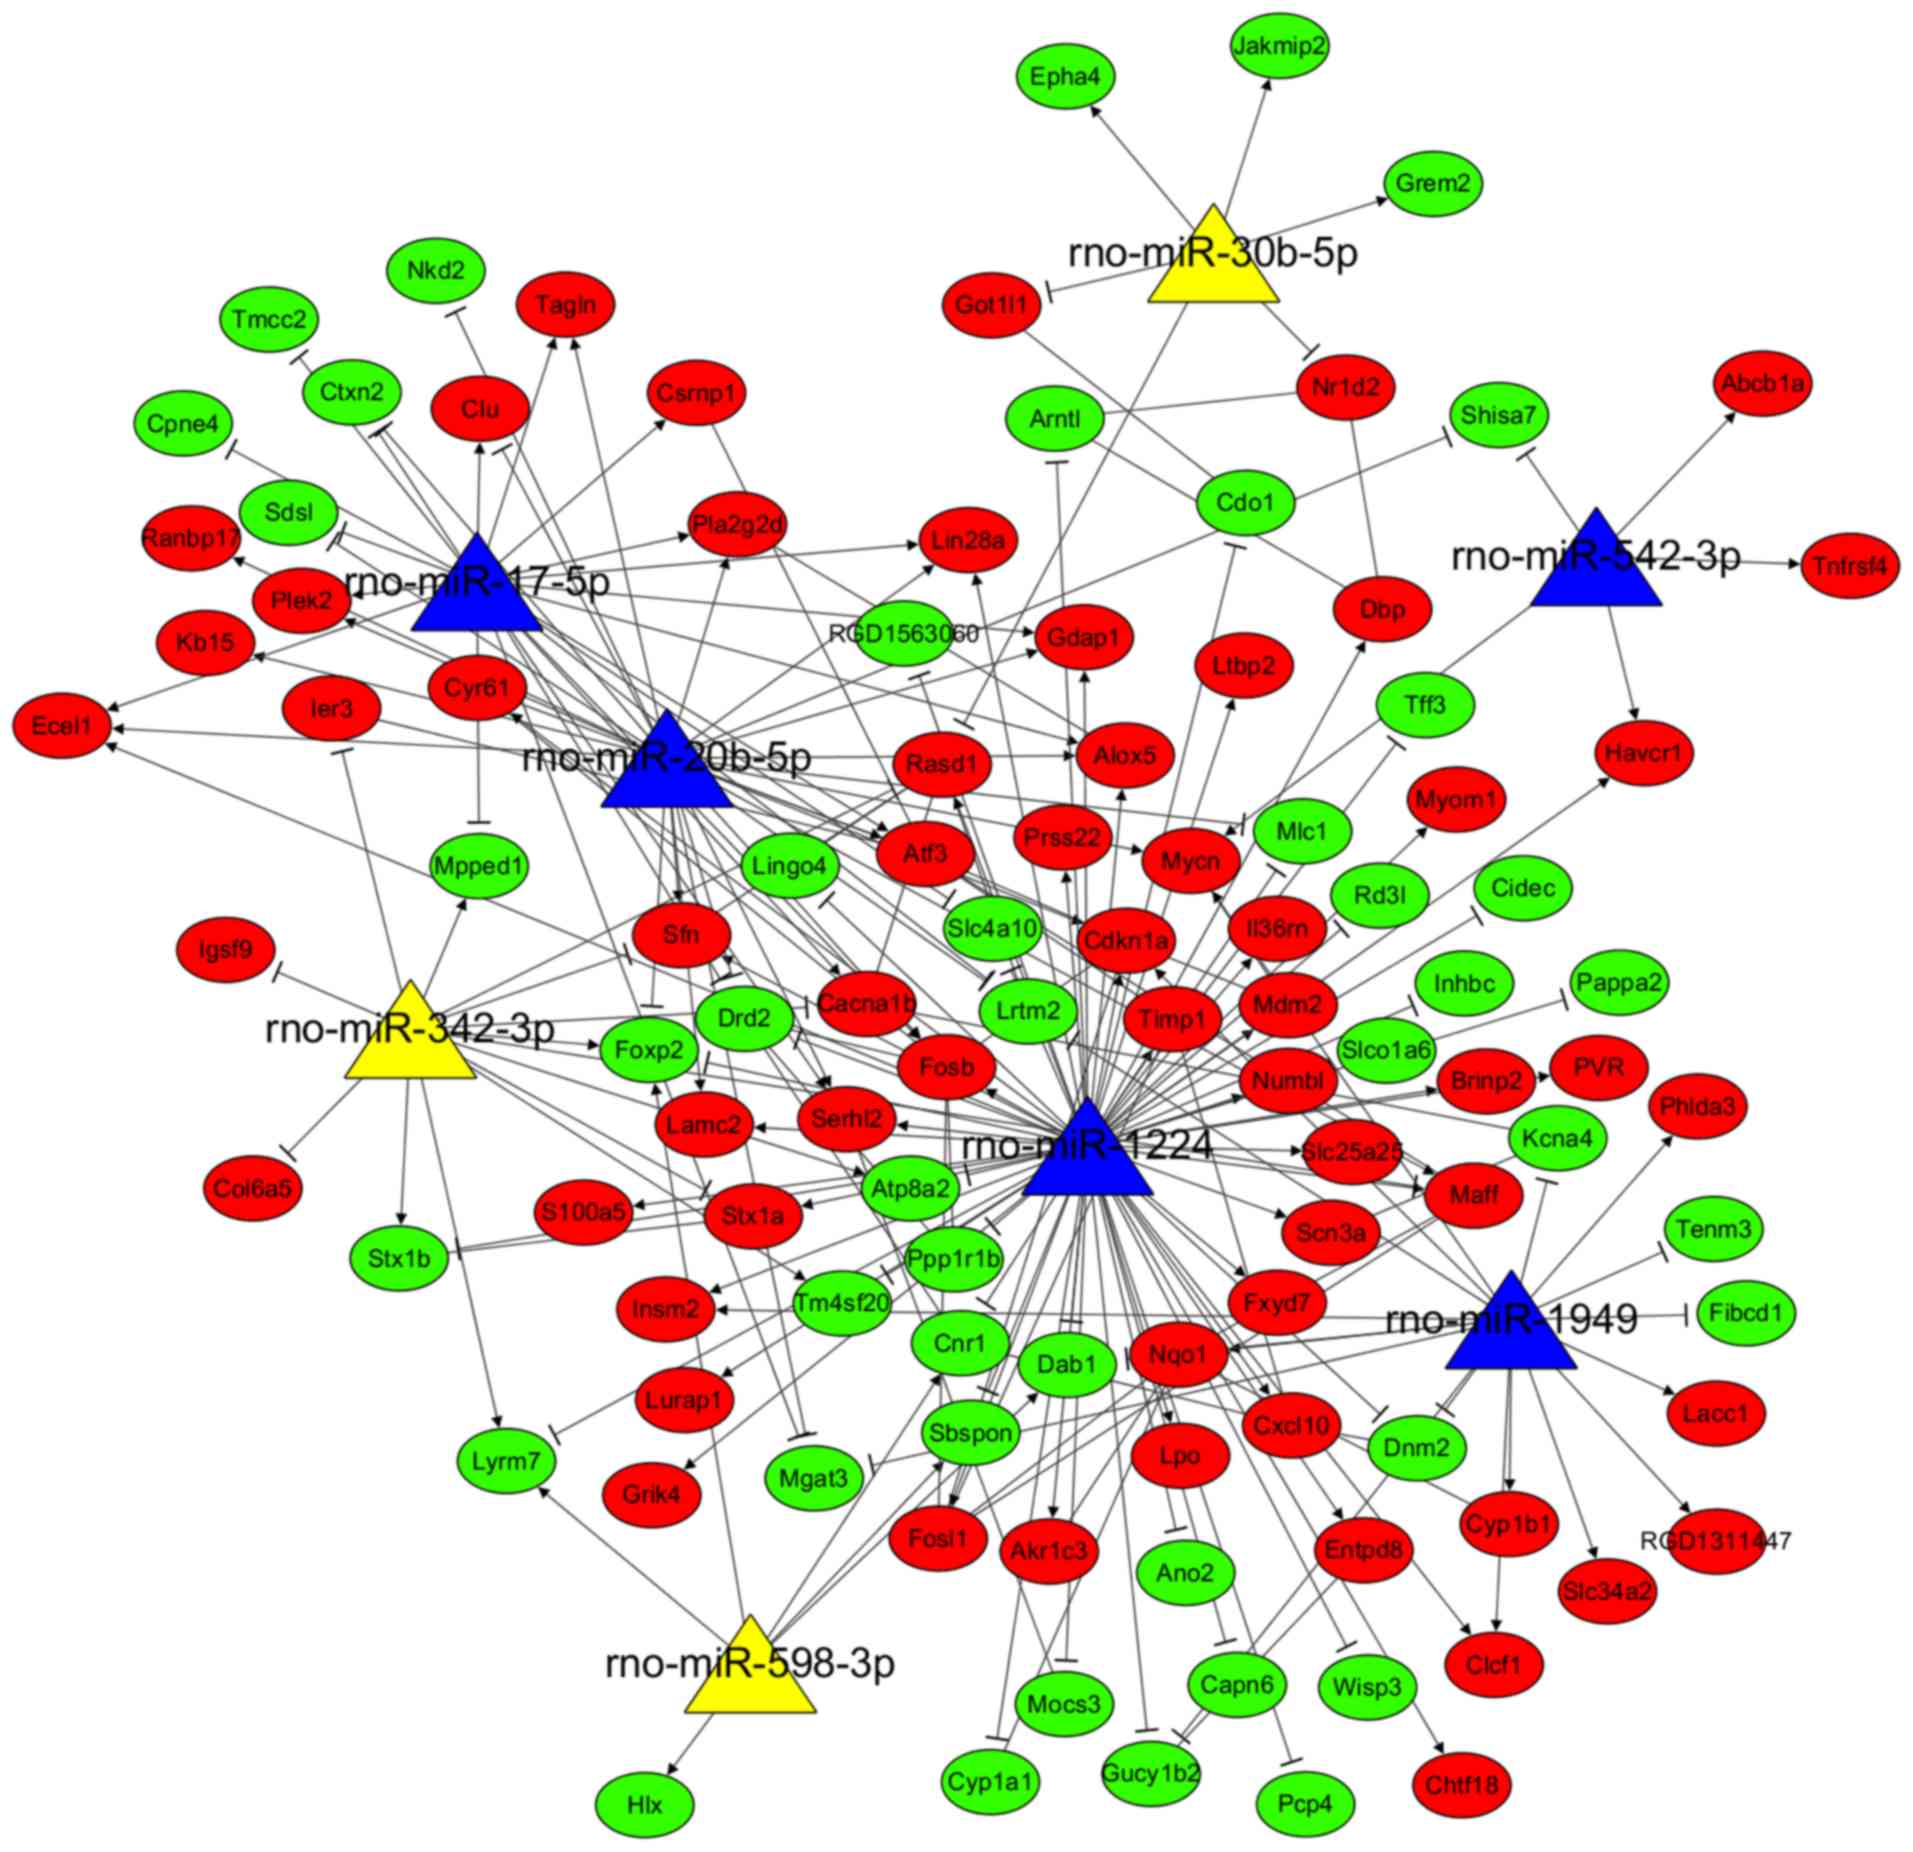
miRNA-target gene regulatory network
analysis
Using the miRWalk2.0 database, 5,920 target genes of
56 DEMs between AKI and control were predicted, which were then
overlapped with the 388 DEGs, resulting in 107 common genes (46
upregulated and 61 downregulated). These 107 common genes and their
related 8 miRNAs were used to construct the AKI-related DEM-target
gene regulatory network (Fig. 5),
including 206 interaction pairs (e.g. rno-miR-1224/Cxcl10;
rno-miR-1224/Timp1; rno-miR-17-5p/FosB).
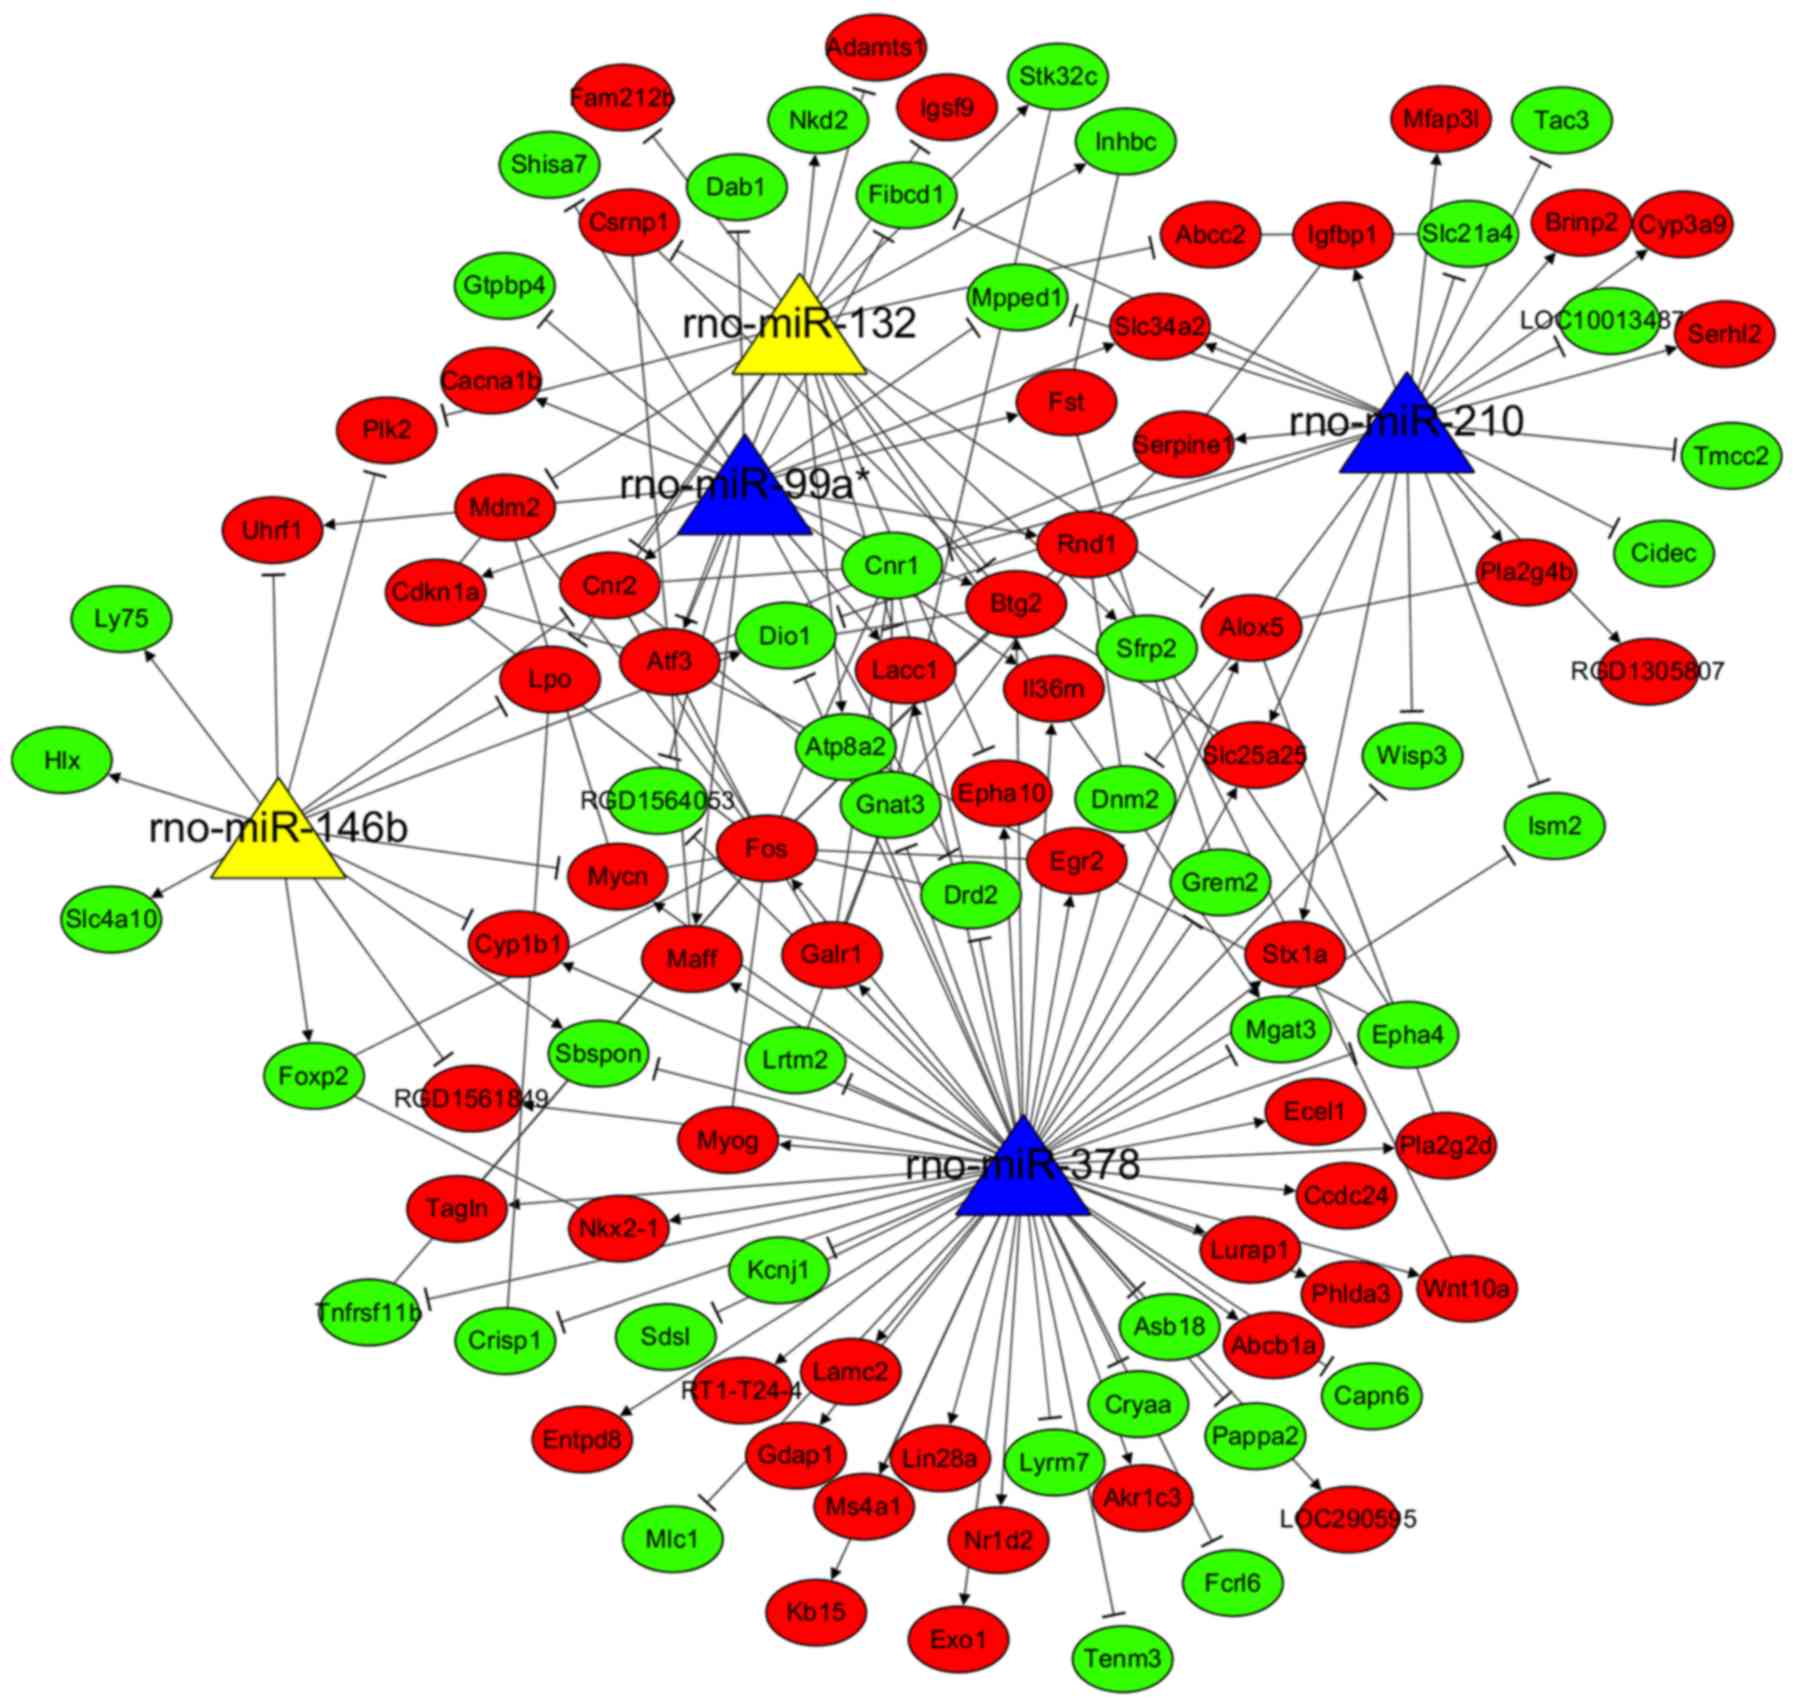
Furthermore, 5,646 target genes were predicted for
the 5 common DEMs in AKI and MSC treatment groups, which were then
also overlapped with the 388 DEGs, resulting in 103 common genes
(44 upregulated and 59 downregulated). These 103 common genes and
their related 5 miRNAs were used to construct the MSC
treatment-related DEM-target gene regulatory network (Fig. 6), consisting of 180 interaction
pairs (e.g. rno-miR-210/Serpine1; rno-miR-378/Fos).
Functional enrichment analyses for
genes in miRNA-target gene regulatory network
The functions of the genes in the AKI and
MSC-related miRNA-target gene regulatory networks were also
evaluated by GO and KEGG enrichment analyses using DAVID. As listed
in Table IV, the target genes in
AKI network were significantly enriched in 6 KEGG pathways (e.g.
cocaine addiction and amphetamine addiction) and 53 GO BP terms
(e.g. positive regulation of cell proliferation). As presented in
Table V, the target genes in MSC
network were significantly enriched in 3 KEGG pathways (e.g. HTLV–I
infection) and 63 GO BP terms (e.g. negative regulation of cell
migration, response to drug, response to lipopolysaccharide); the
GO BP terms with the most notable association with identified key
genes are included in Tables IV
and V.
| Table IV.Function enrichment analysis for
genes in acute kidney injury-associated miRNA-mRNA network. |
Table IV.
Function enrichment analysis for
genes in acute kidney injury-associated miRNA-mRNA network.
| Category | Term | P-value | Genes involved |
|---|
| KEGG | rno04721:Synaptic
vesicle cycle |
4.44×10⁻³ | STX1A, STX1B,
CACNA1B, DNM2 |
| KEGG | rno05030:Cocaine
addiction |
2.53×10⁻² | PPP1R1B, DRD2,
FOSB |
| KEGG |
rno05031:Amphetamine addiction |
4.65×10⁻² | STX1A, PPP1R1B,
FOSB |
| GO BP | GO:0043278~response
to morphine |
7.20×10⁻⁵ | ABCB1A, DRD2, CNR1,
MDM2, FOSB |
| GO BP | GO:0042493~response
to drug |
1.43×10⁻³ | CDKN1A, HAVCR1,
DAB1, CYP1A1, ABCB1A, DRD2, MDM2, FOSB, SLCO1A6, FOSL1 |
| GO BP | GO:0008284~positive
regulation of cell proliferation |
4.01×10⁻² | AKR1C3, ATF3,
CLCF1, HLX, CLU, LAMC2, TIMP1, MYCN, CXCL10 |
| GO BP | GO:0010033~response
to organic substance |
7.50×10⁻³ | CDKN1A, CYP1B1,
CYP1A1, ABCB1A, TIMP1 |
| GO BP | GO:0051412~response
to corticosterone |
2.01×10⁻² | CDKN1A, FOSB,
FOSL1 |
| GO BP | GO:0043066~negative
regulation of apoptotic process |
4.77×10⁻² | IER3, CDKN1A, CLU,
MDM2, NQO1, CYR61, TIMP1 |
| Table V.Function enrichment analysis for
genes in mesenchymal stem cell treatment-associated miRNA-mRNA
network. |
Table V.
Function enrichment analysis for
genes in mesenchymal stem cell treatment-associated miRNA-mRNA
network.
| Category | Term | P-value | Genes involved |
|---|
| KEGG | rno00591:Linoleic
acid metabolism |
2.42×10⁻² | CYP3A9, PLA2G4B,
PLA2G2D |
| KEGG | rno05166:HTLV–I
infection |
2.77×10⁻² | WNT10A, FOS,
CDKN1A, ATF3, EGR2, RT1-T24-4 |
| KEGG | rno04913:Ovarian
steroidogenesis |
4.30×10⁻² | CYP1B1, ALOX5,
PLA2G4B |
| GO BP | GO:0035914~skeletal
muscle cell differentiation |
6.00×10⁻⁶ | MAFF, FOS, ATF3,
EGR2, BTG2, MYOG |
| GO BP | GO:0030336~negative
regulation of cell migration |
1.45×10⁻⁴ | GTPBP4, CYP1B1,
SFRP2, DRD2, SERPINE1, NKX2-1 |
| GO BP | GO:0042493~response
to drug |
1.12×10⁻³ | FOS, CDKN1A,
TNFRSF11B, DAB1, ABCB1A, CRYAA, SFRP2, DRD2, MDM2, ABCC2 |
| GO BP | GO:0032496~response
to lipopolysaccharide |
1.22×10⁻² | FOS, TNFRSF11B,
CNR1, SERPINE1, CNR2, NKX2-1 |
| GO BP | GO:0033602~negative
regulation of dopamine secretion |
2.91×10⁻² | DRD2, CNR1 |
| GO BP | GO:0033629~negative
regulation of cell adhesion mediated by integrin |
2.91×10⁻² | CYP1B1,
SERPINE1 |
Small molecule drugs similar to MSC
treatment
After uploading the DEGs into the CMAP database, 48
small molecule chemicals were predicted, including 29 with positive
and 19 with negative mean and enrichment scores. The top small
molecules with positive enrichment scores >0.9 may induce the
development of AKI similar to cisplatin, such as ciclopirox and
arachidonyltrifluoromethane (Table
VI). By contrast, the top small molecules with negative
enrichment scores <-0.9 may have potential effects similar to
MSCs for treatment of AKI, or may exert a synergistic effect with
MSCs, such as gliclazide (Table
VI).
| Table VI.Small molecule drugs. |
Table VI.
Small molecule drugs.
| CMAP name | Mean | N | Enrichment | P-value | %non-null |
|---|
| Gliclazide | −0.63 | 4 | −0.90 |
1.60×10⁻⁴ | 100 |
| Cyproterone | −0.65 | 4 | −0.88 |
5.20×10⁻⁴ | 100 |
| Metacycline | −0.62 | 4 | −0.87 |
6.20×10⁻⁴ | 100 |
| Ginkgolide A | −0.62 | 4 | −0.86 |
6.60×10⁻⁴ | 100 |
| Estriol | −0.63 | 4 | −0.83 |
1.77×10⁻³ | 100 |
| Adrenosterone | −0.54 | 4 | −0.82 |
2.07×10⁻³ | 100 |
| Zimeldine | −0.57 | 5 | −0.79 |
7.80×10⁻⁴ | 100 |
| H-7 | −0.54 | 4 | −0.78 |
5.11×10⁻³ | 100 |
| Tetramisole | −0.59 | 4 | −0.76 |
6.76×10⁻³ | 100 |
| Beclometasone | −0.40 | 3 | −0.75 |
3.03×10⁻² | 66 |
| Aminocaproic
acid | −0.42 | 3 | −0.74 |
3.67×10⁻² | 66 |
| Nicotinic acid | −0.50 | 4 | −0.72 |
1.20×10⁻² | 75 |
| Oxybuprocaine | −0.40 | 4 | −0.68 |
2.38×10⁻² | 75 |
| Adipiodone | −0.43 | 4 | −0.68 |
2.46×10⁻² | 75 |
| Tiabendazole | −0.48 | 4 | −0.68 |
2.50×10⁻² | 75 |
| Nabumetone | −0.52 | 4 | −0.67 |
2.69×10⁻² | 75 |
| Prestwick-1084 | −0.54 | 4 | −0.67 |
2.84×10⁻² | 75 |
| Cyclopentolate | −0.48 | 4 | −0.66 |
2.98×10⁻² | 75 |
|
Sulfametoxydiazine | −0.49 | 4 | −0.65 |
3.12×10⁻² | 75 |
| Hydrocotarnine | −0.50 | 4 | −0.64 |
4.23×10⁻² | 75 |
| Rimexolone | −0.51 | 4 | −0.62 |
4.99×10⁻² | 75 |
|
Phthalylsulfathiazole | −0.45 | 5 | −0.58 |
3.75×10⁻² | 60 |
|
3-acetylcoumarin | −0.45 | 5 | −0.58 |
3.79×10⁻² | 80 |
| Pirenzepine | −0.41 | 5 | −0.57 |
4.72×10⁻² | 80 |
| Sulindac | 0.47 | 7 | 0.58 |
9.36×10⁻³ | 71 |
| Thiamazole | 0.42 | 6 | 0.61 |
1.17×10⁻² | 66 |
| Colistin | 0.45 | 4 | 0.64 |
4.28×10⁻² | 75 |
| Etoposide | 0.48 | 4 | 0.66 |
2.99×10⁻² | 75 |
| Adenosine
phosphate | 0.45 | 4 | 0.66 |
2.97×10⁻² | 75 |
| Viomycin | 0.50 | 4 | 0.66 |
2.93×10⁻² | 75 |
| Biperiden | 0.48 | 5 | 0.67 |
1.05×10⁻² | 80 |
| Iohexol | 0.53 | 4 | 0.68 |
2.25×10⁻² | 75 |
| Atractyloside | 0.54 | 5 | 0.71 |
5.09×10⁻³ | 80 |
| Ramifenazone | 0.41 | 4 | 0.76 |
6.15×10⁻³ | 75 |
| Hexetidine | 0.53 | 4 | 0.79 |
3.64×10⁻³ | 75 |
| Metixene | 0.53 | 4 | 0.81 |
2.53×10⁻³ | 75 |
| Eticlopride | 0.55 | 4 | 0.81 |
2.27×10⁻³ | 100 |
| Cefmetazole | 0.75 | 4 | 0.82 |
1.83×10⁻³ | 100 |
| Lasalocid | 0.66 | 4 | 0.85 |
8.60×10⁻⁴ | 100 |
| Penbutolol | 0.59 | 3 | 0.85 |
6.23×10⁻³ | 100 |
| STOCK1N-35696 | 0.62 | 2 | 0.87 |
3.49×10⁻² | 100 |
| Atracurium
besilate | 0.62 | 3 | 0.89 |
3.08×10⁻³ | 100 |
|
Arachidonyltrifluoromethane | 0.62 | 2 | 0.91 |
1.84×10⁻² | 100 |
| Ciclopirox | 0.68 | 4 | 0.91 |
6.00×10⁻⁵ | 100 |
Discussion
The present study identified five miRNAs
(rno-miR-378, rno-miR-210, rno-miR-99a*, rno-miR-146b and
rno-miR-132) that were differentially expressed in the AKI model
group compared with control group, and that were reversed following
MSC treatment. Among them, two miRNAs (rno-miR-210 and rno-miR-378)
could regulate hub genes (Fos, Serpine1) differentially expressed
in AKI, and could affect regulation of inflammation and cell
apoptosis.
Serpine1 is a gene that encodes a plasminogen
activator inhibitor-1 (PAI-1). Upregulation of PAI-1 may inhibit
fibrinolysis and promote renal interstitial fibrosis, which is a
pathological characteristic of AKI (28,29).
Furthermore, it has been reported that PAI-1 expression was
increased accompanied with exaggeration of renal inflammatory
injury [exhibiting high expression of nuclear factor (NF)-κB, tumor
necrosis factor (TNF)-α, interleukin (IL)-6 and monocyte
chemotactic protein-1] (30,31),
whereas PAI-1 knockdown markedly reduced the production of the
aforementioned proinflammatory cytokines, and protected mice
against severe AKI and renal apoptosis (32). Elevated plasma PAI-1 levels were
also revealed to be an independent factor associated with the risk
of AKI (odds ratio=2.08; 95% CI: 1.42–3.05, P<0.001) following
adjustment for demographics, interventions and severity of illness
(33). Consistent with these
studies, the present study also demonstrated that the Serpine1 gene
was significantly upregulated in kidney tissues of
cisplatin-induced AKI and was enriched into the GO term “response
to cytokine”. Thus, inhibition of SERPINA1 may be a potential
method to alleviate renal injury induced by cisplatin.
c-Fos is a component of the dimeric transcription
factor activator protein-1 (AP-1) which is composed of various
combinations of Fos (c-Fos, FosB, Fra-1 and Fra-2) and Jun (c-Jun,
JunB and JunD) proteins (34).
Fos/AP-1 directly controls the transcription of inflammatory
cytokines (such as TNF-α, IL-1β and IL-6) by binding to their
promoters, leading to their high expression and inducing AKI. The
administration of Fos/AP-1 inhibitor has been confirmed to inhibit
the increase in these cytokine levels in an endotoxin-induced AKI
model (35,36). In accordance with these studies,
the present study also demonstrated that Fos was significantly
upregulated in kidney tissues of cisplatin-induced AKI.
It has been demonstrated that miRNAs induce
silencing of their target genes via binding to the 3′-UTR. Thus,
expression of miRNAs was also investigated in the present study. By
integrating the miRNA and mRNA expression data, the results
revealed that the downregulation of miR-210 may be a potential
mechanism resulting in the upregulation of Serpine1 in
cisplatin-induced AKI. Although their regulatory relationship has
not been previously demonstrated in the literature, studies on the
roles of miR-210 in AKI and inflammation may indirectly explain the
present results. Aguado-Fraile et al (37) observed that miR-210-3p was
significantly lower expressed in AKI patients and correlated with
AKI severity. Using in vitro experiments, Liu et al
(38) demonstrated that
overexpression of miR-210 significantly attenuated apoptosis in
renal tubular cells, while miR-210 knockdown exerted the opposite
effects. Furthermore, it was also observed that transfection with
miR-210 mimic inhibited pro-inflammatory cytokine production (such
as IL-4, IL-1β, IL-6 and TNF-α), cell viability reduction and cell
apoptosis in chondrocytes (39) or
cytotrophoblasts (40).
Accordingly, it can be speculated that downregulated miR-210 may be
involved in cisplatin-induced AKI by upregulating Serpine1 and then
inducing cell apoptosis. This hypothesis needs to be validated by
future experimental confirmation. A previous study revealed that
c-Fos may be a target gene for miR-155. Treatment with cisplatin of
miR-155(−/-) mice triggered a significantly higher level
of kidney injury accompanied with significantly higher levels of
c-Fos mRNA and protein (41).
However, studies of miRNAs regulating Fos in AKI remain rare. In
the present study, the results predicted that Fos can also be
regulated by miR-378. To date, no study has explored the roles of
miR-378 in AKI, but a recent report implied that miR-378 was
downregulated in diabetic nephropathy and inhibition of miR-378
promoted the apoptosis of podocytes (42). This finding may indirectly indicate
the anti-apoptotic roles of miR-378 in AKI, which would agree with
our inflammation-apoptosis hypothesis for AKI. However, the
relationship between miR-378 and Fos in AKI requires further
experimental validation.
Previous studies have investigated the miRNAs that
may underlie the mechanisms of MSC treatment in AKI, including
miR-146 (18), miR-30 (43), miR-101 (44), miR-880, miR-141, miR-377, and
miR-21 (19). In the present
study, the microarray data generated by Zhu et al (18) were used and further screened for
crucial miRNAs by integrating with the mRNA expression data from an
AKI model. The present study, for the first time, demonstrated that
downregulation of miR-210 and miR-378 may be key mechanisms of
action of the MSC treatment in AKI. However, these findings will
need to be validated by further experiments in the future.
In addition to the mechanisms of MSC treatment, the
present study also predicted that gliclazide may be a potential
drug to protect against AKI. Previous studies may support this
hypothesis, showing that intraperitoneal injection of gliclazide
reduced the levels of serum creatinine, blood urea nitrogen and
microalbuminuria in diabetic rats and lessened diabetic nephropathy
(45,46). The molecular mechanism of
gliclazide was suggested to suppress the endoplasmic reticulum
response (45) or oxidative stress
(47). Thus, it can be speculated
that gliclazide may be used alone or in combination with MSCs to
treat cisplatin-induced AKI.
In conclusion, the present study revealed that MSCs
and gliclazide may be effective for treatment of cisplatin-induced
AKI by regulating miR-210/Serpine1 and miR-378/Fos-mediated
inflammation. Further investigations using cell lines, animals
models and clinical samples are warranted to confirm these
conclusions.
Acknowledgements
Not applicable.
Funding
No funding was received.
Availability of data and materials
The microarray data GSE85957 and GSE66761 were
downloaded from the GEO database in NCBI (http://www.ncbi.nlm.nih.gov/geo/).
Authors' contributions
CMZ and HLY were involved in the design of the
study. CMZ, PYM and ZYZ collected the data and performed the
bioinformatics analyses. NJ, DDL and PFH contributed to the
acquisition and interpretation of data. CMZ and HLY drafted and
revised the manuscript. All authors read and approved the final
manuscript.
Ethics approval and consent to
participate
Not applicable.
Patient consent for publication
Not applicable.
Competing interests
The authors declare that they have no competing
interests.
References
|
1
|
Dasari S and Tchounwou PB: Cisplatin in
cancer therapy: Molecular mechanisms of action. Eur J Pharmacol.
740:364–378. 2014. View Article : Google Scholar : PubMed/NCBI
|
|
2
|
Florea AM and Büsselberg D: Cisplatin as
an anti-tumor drug: Cellular mechanisms of activity, drug
resistance and induced side effects. Cancers (Basel). 3:1351–1371.
2011. View Article : Google Scholar : PubMed/NCBI
|
|
3
|
Bhat ZY, Cadnapaphornchai P, Ginsburg K,
Sivagnanam M, Chopra S, Treadway CK, Lin HS, Yoo G, Sukari A and
Doshi MD: Understanding the risk factors and long-term consequences
of cisplatin-associated acute kidney injury: An observational
cohort study. PLoS One. 10:e01422252015. View Article : Google Scholar : PubMed/NCBI
|
|
4
|
Faig J, Haughton M, Taylor RC, D'Agostino
RB Jr, Whelen MJ, Porosnicu Rodriguez KA, Bonomi M, Murea M and
Porosnicu M: Retrospective analysis of cisplatin nephrotoxicity in
patients with head and neck cancer receiving outpatient treatment
with concurrent high-dose cisplatin and radiotherapy. Am J Clin
Oncol. 41:432–440. 2018. View Article : Google Scholar : PubMed/NCBI
|
|
5
|
Saleena UV, Athiyaman MS, Vadhiraja BM,
Fernandes DJ, Prabhu R and Nalini K: Evaluation of urinary tubular
enzymes for the detection of early kidney injury due to cisplatin
chemotherapy. Int J Biol Med Res. 3:2241–2246. 2012.
|
|
6
|
Peres LA, da Cunha AD Jr, Assumpção RA,
Schäfer A Jr, da Silva AL, Gaspar AD, Scarpari DF, Alves JB,
Girelli Neto R and de Oliveira TF: Evaluation of the cisplatin
nephrotoxicity using the urinary neutrophil gelatinase-associated
lipocalin (NGAL) in patients with head and neck cancer. J Bras
Nefrol. 36:280–288. 2014.(In Portuguese). View Article : Google Scholar : PubMed/NCBI
|
|
7
|
Ozkok A and Edelstein CL: Pathophysiology
of cisplatin-induced acute kidney injury. Biomed Res Int.
2014:9678262014. View Article : Google Scholar : PubMed/NCBI
|
|
8
|
Simovic Markovic B, Gazdic M, Arsenijevic
A, Jovicic N, Jeremic J, Djonov V, Arsenijevic N, Lukic ML and
Volarevic V: Mesenchymal stem cells attenuate cisplatin-induced
nephrotoxicity in iNOS-dependent manner. Stem Cells Int.
2017:13153782017. View Article : Google Scholar : PubMed/NCBI
|
|
9
|
Elhusseini FM, Saad MA, Anber N, Elghannam
D, Sobh MA, Alsayed A, El-Dusoky S, Sheashaa H, Abdel-Ghaffar H and
Sobh M: Long term study of protective mechanisms of human adipose
derived mesenchymal stem cells on cisplatin induced kidney injury
in sprague-dawley rats. J Stem Cells Regen Med. 12:36–48.
2016.PubMed/NCBI
|
|
10
|
Lee SJ, Ryu MO, Seo MS, Park SB, Ahn JO,
Han SM, Kang KS, Bhang DH and Youn HY: Mesenchymal stem cells
contribute to improvement of renal function in a canine kidney
injury model. In Vivo. 31:1115–1124. 2017.PubMed/NCBI
|
|
11
|
Moghadasali R, Mutsaers HA, Azarnia M,
Aghdami N, Baharvand H, Torensma R, Wilmer MJ and Masereeuw R:
Mesenchymal stem cell-conditioned medium accelerates regeneration
of human renal proximal tubule epithelial cells after gentamicin
toxicity. Exp Toxicol Pathol. 65:595–600. 2013. View Article : Google Scholar : PubMed/NCBI
|
|
12
|
Park JH, Jang HR, Kim DH, Kwon GY, Lee JE,
Huh W, Choi SJ, Oh W, Oh HY and Kim YG: Early, but not late,
treatment with human umbilical cord blood-derived mesenchymal stem
cells attenuates cisplatin nephrotoxicity through immunomodulation.
Am J Physiol Renal Physiol. 313:F984–F996. 2017. View Article : Google Scholar : PubMed/NCBI
|
|
13
|
Sherif IO, Almutabagani LA, Alnakhli AM,
Sobh MA and Mohammed HE: Renoprotective effects of angiotensin
receptor blocker and stem cells in acute kidney injury: Involvement
of inflammatory and apoptotic markers. Exp Biol Med (Maywood).
240:1572–1579. 2015. View Article : Google Scholar : PubMed/NCBI
|
|
14
|
Liao W, Fu Z, Zou Y, Wen D, Ma H, Zhou F,
Chen Y, Zhang M and Zhang W: MicroRNA-140-5p attenuated oxidative
stress in Cisplatin induced acute kidney injury by activating
Nrf2/ARE pathway through a Keap1-independent mechanism. Exp Cell
Res. 360:292–302. 2017. View Article : Google Scholar : PubMed/NCBI
|
|
15
|
Lee CG, Kim JG, Kim HJ, Kwon HK, Cho IJ,
Choi DW, Lee WH, Kim WD, Hwang SJ, Choi S and Kim SG: Discovery of
an integrative network of microRNAs and transcriptomics changes for
acute kidney injury. Kidney Int. 86:943–953. 2014. View Article : Google Scholar : PubMed/NCBI
|
|
16
|
Guo Y, Ni J, Chen S, Bai M, Lin J, Ding G,
Zhang Y, Sun P, Jia Z, Huang S, et al: MicroRNA-709 mediates acute
tubular injury through effects on mitochondrial function. J Am Soc
Nephrol. 29:449–461. 2018. View Article : Google Scholar : PubMed/NCBI
|
|
17
|
Qin W, Xie W, Yang X, Xia N and Yang K:
Inhibiting microRNA-449 attenuates cisplatin-induced injury in
NRK-52E cells possibly via regulating the SIRT1/P53/BAX pathway.
Med Sci Monit. 22:818–823. 2016. View Article : Google Scholar : PubMed/NCBI
|
|
18
|
Zhu Y, Yu J, Yin L, Zhou Y, Sun Z, Jia H,
Tao Y, Liu W, Zhang B, Zhang J, et al: MicroRNA-146b, a sensitive
indicator of mesenchymal stem cell repair of acute renal injury.
Stem Cells Transl Med. 5:1406–1415. 2016. View Article : Google Scholar : PubMed/NCBI
|
|
19
|
de Almeida DC, Bassi ÊJ, Azevedo H,
Anderson L, Origassa CS, Cenedeze MA, de Andrade-Oliveira V,
Felizardo RJ, da Silva RC, Hiyane MI, et al: A regulatory
miRNA-mRNA network is associated with tissue repair induced by
mesenchymal stromal cells in acute kidney injury. Front Immunol.
7:6452017. View Article : Google Scholar : PubMed/NCBI
|
|
20
|
Pavkovic M, Riefke B and
Ellinger-Ziegelbauer H: Urinary microRNA profiling for
identification of biomarkers after cisplatin-induced kidney injury.
Toxicology. 324:147–157. 2014. View Article : Google Scholar : PubMed/NCBI
|
|
21
|
Pavkovic M, Riefke B, Gutberlet K, Raschke
M and Ellinger-Ziegelbauer H: Comparison of the MesoScale discovery
and Luminex multiplex platforms for measurement of urinary
biomarkers in a cisplatin rat kidney injury model. J Pharmacol
Toxicol Methods. 69:196–204. 2014. View Article : Google Scholar : PubMed/NCBI
|
|
22
|
Irizarry RA, Hobbs B, Collin F,
Beazer-Barclay YD, Antonellis KJ, Scherf U and Speed TP:
Exploration, normalization, and summaries of high density
oligonucleotide array probe level data. Biostatistics. 4:249–264.
2003. View Article : Google Scholar : PubMed/NCBI
|
|
23
|
Ritchie ME, Phipson B, Wu D, Hu Y, Law CW,
Shi W and Smyth GK: limma powers differential expression analyses
for RNA-sequencing and microarray studies. Nucleic Acids Res.
43:e472015. View Article : Google Scholar : PubMed/NCBI
|
|
24
|
Szklarczyk D, Franceschini A, Wyder S,
Forslund K, Heller D, Huerta-Cepas J, Simonovic M, Roth A, Santos
A, Tsafou KP, et al: STRING v10: Protein-protein interaction
networks, integrated over the tree of life. Nucleic Acids Res 43
(Database Issue). D447–D452. 2015. View Article : Google Scholar
|
|
25
|
Kohl M, Wiese S and Warscheid B:
Cytoscape: Software for visualization and analysis of biological
networks. Methods Mol Biol. 696:291–303. 2011. View Article : Google Scholar : PubMed/NCBI
|
|
26
|
Bader GD and Hogue CW: An automated method
for finding molecular complexes in large protein interaction
networks. BMC Bioinformatics. 4:22003. View Article : Google Scholar : PubMed/NCBI
|
|
27
|
Dweep H and Gretz N: miRWalk2.0: A
comprehensive atlas of microRNA-target interactions. Nat Methods.
12:6972015. View Article : Google Scholar : PubMed/NCBI
|
|
28
|
Zhang W, Sha Y, Wei K, Wu C, Ding D, Yang
Y, Zhu C, Zhang Y, Ding G, Zhang A, et al: Rotenone ameliorates
chronic renal injury caused by acute ischemia/reperfusion.
Oncotarget. 9:24199–24208. 2018. View Article : Google Scholar : PubMed/NCBI
|
|
29
|
Eren M, Place AT, Thomas PM, Flevaris P,
Miyata T and Vaughan DE: PAI-1 is a critical regulator of FGF23
homeostasis. Sci Adv. 3:e16032592017. View Article : Google Scholar : PubMed/NCBI
|
|
30
|
Xue HY, Yuan L, Cao YJ, Fan YP, Chen XL
and Huang XZ: Resveratrol ameliorates renal injury in spontaneously
hypertensive rats by inhibiting renal micro-inflammation. Biosci
Rep. 36(pii): e003392016. View Article : Google Scholar : PubMed/NCBI
|
|
31
|
Jesmin S, Gando S, Zaedi S, Prodhan SH,
Sawamura A, Miyauchi T, Hiroe M and Yamaguchi N: Protease-activated
receptor 2 blocking peptide counteracts endotoxin-induced
inflammation and coagulation and ameliorates renal fibrin
deposition in a rat model of acute renal failure. Shock.
32:626–632. 2009. View Article : Google Scholar : PubMed/NCBI
|
|
32
|
Gupta KK, Donahue DL, Sandoval-Cooper MJ,
Castellino FJ and Ploplis VA: Abrogation of plasminogen activator
inhibitor-1-vitronectin interaction ameliorates acute kidney injury
in murine endotoxemia. PLoS One. 10:e01207282015. View Article : Google Scholar : PubMed/NCBI
|
|
33
|
Liu KD, Glidden DV, Eisner MD, Parsons PE,
Ware LB, Wheeler A, Korpak A, Thompson BT, Chertow GM and Matthay
MA; National Heart, Lung and Blood Institute ARDS Network Clinical
Trials Group, : Predictive and pathogenetic value of plasma
biomarkers for acute kidney injury in patients with acute lung
injury. Crit Care Med. 35:2755–2761. 2007. View Article : Google Scholar : PubMed/NCBI
|
|
34
|
Angel P and Karin M: The role of Jun, Fos
and the AP-1 complex in cell-proliferation and transformation.
Biochim Biophys Acta. 1072:129–157. 1991.PubMed/NCBI
|
|
35
|
Miyazaki H, Morishita J, Ueki M, Nishina
K, Shiozawa S and Maekawa N: The effects of a selective inhibitor
of c-Fos/activator protein-1 on endotoxin-induced acute kidney
injury in mice. BMC Nephrol. 13:1532012. View Article : Google Scholar : PubMed/NCBI
|
|
36
|
Ishida M, Ueki M, Morishita J, Ueno M,
Shiozawa S and Maekawa N: T-5224, a selective inhibitor of
c-Fos/activator protein-1, improves survival by inhibiting serum
high mobility group box-1 in lethal lipopolysaccharide-induced
acute kidney injury model. J Intensive Care. 3:492015. View Article : Google Scholar : PubMed/NCBI
|
|
37
|
Aguado-Fraile E, Ramos E, Conde E,
Rodríguez M, Martín-Gómez L, Lietor A, Candela Á, Ponte B, Liaño F
and García-Bermejo ML: A pilot study identifying a set of microRNAs
as precise diagnostic biomarkers of acute kidney injury. PLoS One.
10:e01271752015. View Article : Google Scholar : PubMed/NCBI
|
|
38
|
Liu LL, Li D, He YL, Zhou YZ, Gong SH, Wu
LY, Zhao YQ, Huang X, Zhao T, Xu L, et al: miR-210 protects renal
cell against hypoxia-induced apoptosis by targeting HIF-1 alpha.
Mol Med. 23:258–271. 2017. View Article : Google Scholar : PubMed/NCBI
|
|
39
|
Zhang D, Cao X, Li J and Zhao G: MiR-210
inhibits NF-κB signaling pathway by targeting DR6 in
osteoarthritis. Sci Rep. 5:127752015. View Article : Google Scholar : PubMed/NCBI
|
|
40
|
Kopriva SE, Chiasson VL, Mitchell BM and
Chatterjee P: TLR3-induced placental miR-210 down-regulates the
STAT6/interleukin-4 pathway. PLoS One. 8:e677602013. View Article : Google Scholar : PubMed/NCBI
|
|
41
|
Pellegrini KL, Han T, Bijol V, Saikumar J,
Craciun FL, Chen WW, Fuscoe JC and Vaidya VS: MicroRNA-155
deficient mice experience heightened kidney toxicity when dosed
with cisplatin. Toxicol Sci. 141:484–492. 2014. View Article : Google Scholar : PubMed/NCBI
|
|
42
|
Lei X, Zhang BD, Ren JG and Luo FL:
Astragaloside suppresses apoptosis of the podocytes in rats with
diabetic nephropathy via miR-378/TRAF5 signaling pathway. Life Sci.
206:77–83. 2018. View Article : Google Scholar : PubMed/NCBI
|
|
43
|
Gu D, Zou X, Ju G, Zhang G, Bao E and Zhu
Y: Mesenchymal stromal cells derived extracellular vesicles
ameliorate acute renal ischemia reperfusion injury by inhibition of
mitochondrial fission through miR-30. Stem Cells Int.
2016:20939402016. View Article : Google Scholar : PubMed/NCBI
|
|
44
|
Liu J, Hua R, Gong Z, Shang B, Huang Y,
Guo L, Liu T and Xue J: Human amniotic epithelial cells inhibit
CD4+ T cell activation in acute kidney injury patients by
influencing the miR-101-c-Rel-IL-2 pathway. Mol Immunol. 81:76–84.
2017. View Article : Google Scholar : PubMed/NCBI
|
|
45
|
Zhang YW, Wang X, Ren X and Zhang M:
Involvement of glucose-regulated protein 78 and spliced X-box
binding protein 1 in the protective effect of gliclazide in
diabetic nephropathy. Diabetes Res Clin Pract. 146:41–47. 2018.
View Article : Google Scholar : PubMed/NCBI
|
|
46
|
Ezel T, Kocyigit Y, Deveci E, Atamer Y,
Sermet A, Uysal E, Aktaş A and Yavuz D: Biochemical and
histopathological investigation of resveratrol, gliclazide, and
losartan protective effects on renal damage in a diabetic rat
model. Anal Quant Cytopathol Histpathol. 37:187–198.
2015.PubMed/NCBI
|
|
47
|
Onozato ML, Tojo A, Goto A and Fujita T:
Radical scavenging effect of gliclazide in diabetic rats fed with a
high cholesterol diet. Kidney Int. 65:951–960. 2004. View Article : Google Scholar : PubMed/NCBI
|