Introduction
Intrahepatic cholangiocarcinoma (ICC) is the second
most common intrahepatic primary tumor after hepatocellular
carcinoma (HCC) (1). Despite
improvements in surgical techniques, the resectability and
curability of ICC remain unsatisfactory (2). Currently, the main treatment option
for ICC is curative resection; however, the prognosis of patients
with ICC remains poor due to the high frequency of recurrence and
metastasis following surgical resection (3–5).
Thus, the elucidation of the underlying mechanisms involved in ICC
hepatocarcinogenesis is of utmost importance.
Glutaminase is an amidohydrolase that catalyzes the
first step in the glutaminolysis of glutamine to glutamate.
Glutaminase exists as two isoforms, GLS1 and GLS2, which were
originally identified as kidney and liver glutaminases,
respectively. The majority of cancer types, including ICC, require
a constant supply of glutamine to support tumor progression and
cell proliferation (6). An
increasing number of studies have indicated that an aberrant
expression level of GLS1 is associated with cancer invasion and
metastasis in HCC, breast cancer cell lines and colorectal cancer
(7–9). These findings indicate that GLS1 is a
key mediator of tumor migration and invasion. It has been
demonstrated that epithelial-mesenchymal transition (EMT) is a
critical cause of invasion and migration in a number of types of
cancer of epithelial origin (10).
EMT involves profound phenotypic alterations, including the loss of
epithelial cell polarity following reductions in the levels of
epithelial proteins, such as E-cadherin and increases in the levels
of mesenchymal proteins that increase mesenchymal proliferation and
invasion (11). Recently, a study
reported that GLS1 metabolism is possibly involved in the
activation of TGF-β/Wnt signaling and the induction of EMT
(12). Thus, GLS1 may well become
a novel target for the treatment of malignant tumor cells
undergoing EMT-driven invasion and mobility. However, the specific
association between GLS1 and EMT-related markers in ICC cells
remains unclear.
In this study, we examined the expression of GLS1 in
ICC and investigated the role and mechanisms of action of GLS1 in
ICC cell invasion and migration. In addition, clinical
characteristics, such as overall survival (OS) and the cumulative
recurrence rate were also assessed.
Materials and methods
Patients and samples
In this study, a tissue microarray was used
containing 138 paired paraffin-embedded ICC tissue samples and
corresponding peritumoral tissues samples obtained from patients
who had undergone hepatic resection at Zhongshan Hospital, Fudan
University from 2007 to 2012. The use of these tissue specimens was
approved by the Zhongshan Hospital Research Ethics Committee and
written consent was obtained from the patients. The detailed
clinicopathological characteristics of the patients are presented
in Table I.
 | Table I.Associations between GLS1 with
clinicopathologic characteristics of the 138 patients with ICC. |
Table I.
Associations between GLS1 with
clinicopathologic characteristics of the 138 patients with ICC.
|
| No. of patients |
|
|---|
|
|
|
|
|---|
| Characteristic |
GLS1low |
GLS1high | P-value |
|---|
| Sex |
|
| 0.609 |
| Male | 25 | 33 |
|
|
Female | 38 | 42 |
|
| Age, years |
|
| 0.090 |
| ≥53 | 27 | 43 |
|
|
<53 | 36 | 32 |
|
| HBsAg |
|
| 0.657 |
|
Positive | 38 | 48 |
|
|
Negative | 25 | 27 |
|
| Child-Pugh score |
|
| 0.299 |
| A | 62 | 70 |
|
| B | 1 | 5 |
|
| Serum CA 19-9,
ng/Ml |
|
| 0.061 |
| ≥37 | 33 | 51 |
|
|
<37 | 30 | 24 |
|
| CEA |
|
| 0.215 |
|
≥3.4 | 22 | 34 |
|
|
<3.4 | 41 | 41 |
|
| Serum ALT, U/l |
|
| 0.872 |
|
≥75 | 9 | 10 |
|
|
<75 | 54 | 65 |
|
| Serum AFP,
ng/ml |
|
| 0.871 |
|
≥20 | 7 | 9 |
|
|
<20 | 56 | 66 |
|
| GGT |
|
| 0.485 |
|
≥75 | 29 | 39 |
|
|
<75 | 34 | 36 |
|
| Cirrhosis |
|
| 0.586 |
|
Yes | 24 | 32 |
|
| No | 39 | 43 |
|
| Tumor size
(diameter, cm) |
|
| 0.950 |
| ≥5 | 49 | 58 |
|
|
<5 | 14 | 17 |
|
| Tumor number |
|
| 0.202 |
|
Multiple | 3 | 8 |
|
|
Solitary | 60 | 67 |
|
| Embolus |
|
| 0.492 |
|
Yes | 9 | 14 |
|
| No | 54 | 61 |
|
| Capsulation |
|
| 0.252 |
|
Yes | 50 | 65 |
|
| No | 13 | 10 |
|
| Lymphatic
metastasis |
|
| 0.029 |
|
Yes | 10 | 24 |
|
| No | 53 | 51 |
|
| Tumor
differentiation |
|
| 0.001 |
|
III/IV | 21 | 46 |
|
|
I/II | 42 | 29 |
|
Cells and cell culture
Three ICC cell lines, QBC939, HCCC-9810 and RBE,
were obtained from the Institute of Biochemistry and Cell Biology
of the Chinese Academy of Sciences and maintained in RPMI-1640
medium supplemented with 10% fetal bovine serum, penicillin (100
U/ml) and streptomycin (100 µg/ml) (all Gibco; Thermo Fisher
Scientific) under 95% air and 5% CO2 at 37°C.
Tissue microarrays (TMAs),
immunohistochemistry and hematoxylin-eosin (H&E) staining
A tissue microarray that included 138 ICC tissue
samples with corresponding adjacent tissue samples was constructed
by Shanghai Outdo Biotech Co., Ltd. (13). Briefly, 4-µm sections were obtained
from the TMA blocks using a microtome Shanghai Outdo Biotech Co.,
Ltd. The 4-µm sections on the TMAs were dried at 60°C for 4 h,
de-paraffinized in xylene I for 10 min, de-paraffinized in xylene
II for another 10 min, and then rehydrated in graded ethanol (100%
ethanol for 5 min, 90% ethanol for 5 min, 80% ethanol for 5 min and
70% ethanol for 5 min). Ethanol was subsequently removed by washing
with phosphate-buffered saline (PBS) for 15 min. For
immunohistochemistry, the sections were incubated in 3%
H2O2 at room temperature for 20 min to block
endogenous peroxidases. The TMAs were then microwaved in EDTA
[1:500; pH 8.0; Absin (Shanghai) Biotechnology Co., Ltd.] for 15
min for antigen retrieval and subsequently incubated with 1% bovine
serum albumin [1:500; pH 8.0; Absin (Shanghai) Biotechnology Co.,
Ltd.]. Subsequently, TMAs were incubated with the following rabbit
anti-human primary antibodies for 12 h at 4°C: Anti-GLS1 (1:200;
cat. no. ab93434; Abcam), anti-E-cadherin (1:200, cat. no. 24E10;
Cell Signaling Technology, Inc.) and anti-Vimentin (1:150; cat. no.
D21H3; Cell Signaling Technology, Inc.). Subsequently, TMAs were
incubated with horseradish peroxidase-labeled secondary antibodies
[1:1,000; cat. no. abs957; Absin (Shanghai) Biotechnology Co.,
Ltd.] for 2 h at 37°C. DAB [1:500; Absin (Shanghai) Biotechnology
Co., Ltd.] was used as a detection reagent and was incubated with
the TMAs for 1.5 min, after which, the samples were counterstained
with hematoxylin for 2 min at room temperature, and were
subsequently dehydrated in a gradient series of ethanol. Images of
the sections were subsequently captured under a light microscope
(Olympus BX-51; Olympus Corporation). All specimens were reviewed
and scored by investigators blinded to the clinical characteristics
of the patients. The expression of GLS1, Vimentin and E-cadherin
was scored as follows: 0, no staining; 1, weak staining; 2,
moderate staining; and 3, strong staining. The percentage of
positively stained cells was scored as follows: 0, 0–10%; 1, 1–25%;
2, 26–50%; 3, 51–75%; and 4, >75%. A final score of 0–2 was
considered as negative expression, whereas a score of 3–12 was
considered as positive expression.
For H&E staining, sections were stained with
hematoxylin solution (0.2%) for 4 min, followed by eosin solution
(0.5%) for 90 sec at room temperature.
Western blot analysis
Cell and tissue proteins were extracted using
radioimmunoprecipitation assay buffer (cat. no. P0013C; Beyotime
Institute of Biotechnology), and the protein concentration was
measured using an enhanced Bicinchoninic Acid Protein Assay kit
(cat. no. P0010; Beyotime Institute of Biotechnology). Proteins
were loaded at 20 µg/lane, separated by 10% SDS-PAGE (cat. no.
P0012A; Beyotime Institute of Biotechnology) and were transferred
to polyvinylidene fluoride membranes (EMD Millipore) for western
blot analysis. Subsequently, the membranes were blocked with TBS
containing 0.1% Tween 20 and 5% non-fat milk for 2 h at room
temperature, and were subsequently incubated with the following
rabbit primary antibodies at 4°C for 12 h: Anti-GLS1 (1:1,000; cat.
no. ab93434; Abcam), anti-E-cadherin (1:1,000; cat. no. 24E10; Cell
Signaling Technology, Inc.), anti-Vimentin (1:500; cat. no. D21H3;
Cell Signaling Technology, Inc.) and anti-GAPDH (1:1,000; cat. no.
D16H11; Cell Signaling Technology, Inc.). The membranes were then
rinsed and incubated with secondary antibody (1:5,000; cat. no.
A0208; Beyotime Institute of Biotechnology) at room temperature for
2 h. Densitometric analysis using an enhanced chemiluminescence
system (EMD Millipore) and ImageJ software (version 1.49; National
Institutes of Health) was performed to detect protein
expression.
Regulation of GLS1 by siRNA and pcDNA
transfection
siRNAs and a pcDNA plasmid that can regulate the
human GLS1 gene were obtained from Shanghai Genomeditech Co. Two
siRNAs were designed to silence GLS1, and the cells were randomly
divided into the siRNA1-transfected cell group; siRNA2-transfected
cell group; the negative control (NC) group, which was transfected
with non-targeting siRNA; and the mock group, which consisted of
untransfected cells. A pc-DNA3.1 plasmid was designed to induce
overexpression of GLS1, and the cells were divided into the
pc-DNA3.1-GLS1-transfected cell group; the NC group, which was
transfected with an empty pc-DNA3.1 vector; and the mock group,
which consisted of untransfected cells. The siRNA sequences were as
follows: siRNA1, upstream 5′-CCAGGUUGAAAGAGUGUAUTT-3′, downstream
5′-AUACACUCUUUCAACCUGGTT-3′; siRNA2, upstream
5′-CCCUGAAGCAGUUCGAAAUTT-3′, downstream 5′AUUUCGAACUGCUUCAGGGTT-3′;
NC, upstream 5′-UUCUCCGAACGUGUCACGUTT-3′, downstream
5′-ACGUGACACGUUCGGAGAATT-3′. Briefly, cells were seeded at a
density of 1×10⁶ cells/well in 6-well plates and were
incubated until 70% confluence was reached. siRNAs and pc-DNA3.1
plasmids were transfected into the QBC939 and RBE cells using
Lipofectamine® 2000 (Invitrogen; Thermo Fisher
Scientific, Inc.) according to the manufacturer's instructions.
After 72 h, the cells were harvested for total protein extraction
and examined by western blot analysis.
Cell migration assays
Cell migration was assessed using a wound-healing
assay. ICC cells were plated in a 6-well plate and were incubated
until they reached 100% confluence. Following serum starvation for
1 day, cells were wounded with a 200-µl plastic tip. Cells were
washed three times with sterile PBS to remove the floating cells
and were then incubated for 24 h at 37°C under 95% air and 5%
CO2. The same wound areas were observed and images were
captured under a light microscope (Olympus IX71; Olympus
Corporation) at 0 and 24 h. The migratory abilities were quantified
by measuring the percentage of the migration area of cells in the
scratched regions, as follows: 0 h scratch area-24 h scratch area/0
h scratch area ×100%.
Cell invasion assays
A Transwell assay was conducted to assess the
invasive ability of cells in response to GLS1 overexpression or
knockdown. The upper surface of the Transwell filter used in the
assay was coated with Matrigel. Cells (1×10⁵) suspended
in 150 µl serum-free medium were added to the Transwell chamber
(cat. no. 3413; Corning, Inc.), which was placed into a 24-well
plate containing complete medium. After 24 h of incubation at 37°C,
the filter was extracted and cells on the upper surface of the
filter were removed with cotton swabs. Cells on the underside of
the Transwell filter were fixed with 4% paraformaldehyde for 25 min
and stained with 0.1% crystal violet for 15 min at 37°C, after
which, images were captured (Olympus IX71; Olympus Corporation) and
the number of cells was quantified.
Statistical analysis
Statistical analyses were performed using SPSS 23.0
(IBM Corp.) and GraphPad Prism7 (GraphPad Software, Inc.) software.
The Student's t-test was used to compare differences between
groups. One-way analysis of variance (ANOVA) was used to compare
differences among groups. Spearman's correlation analysis was used
for the correlation analysis and Fisher's exact test was used to
determine the association of GLS1 with ICC characteristics. OS and
the cumulative recurrence rate were determined using Kaplan-Meier
survival curves and the log-rank test. Independent prognostic
factors were evaluated by with Cox proportional hazards model. A
P-value <0.05 was considered to indicate a statistically
significant difference.
Results
GLS1 is overexpressed in ICC tumor
specimens
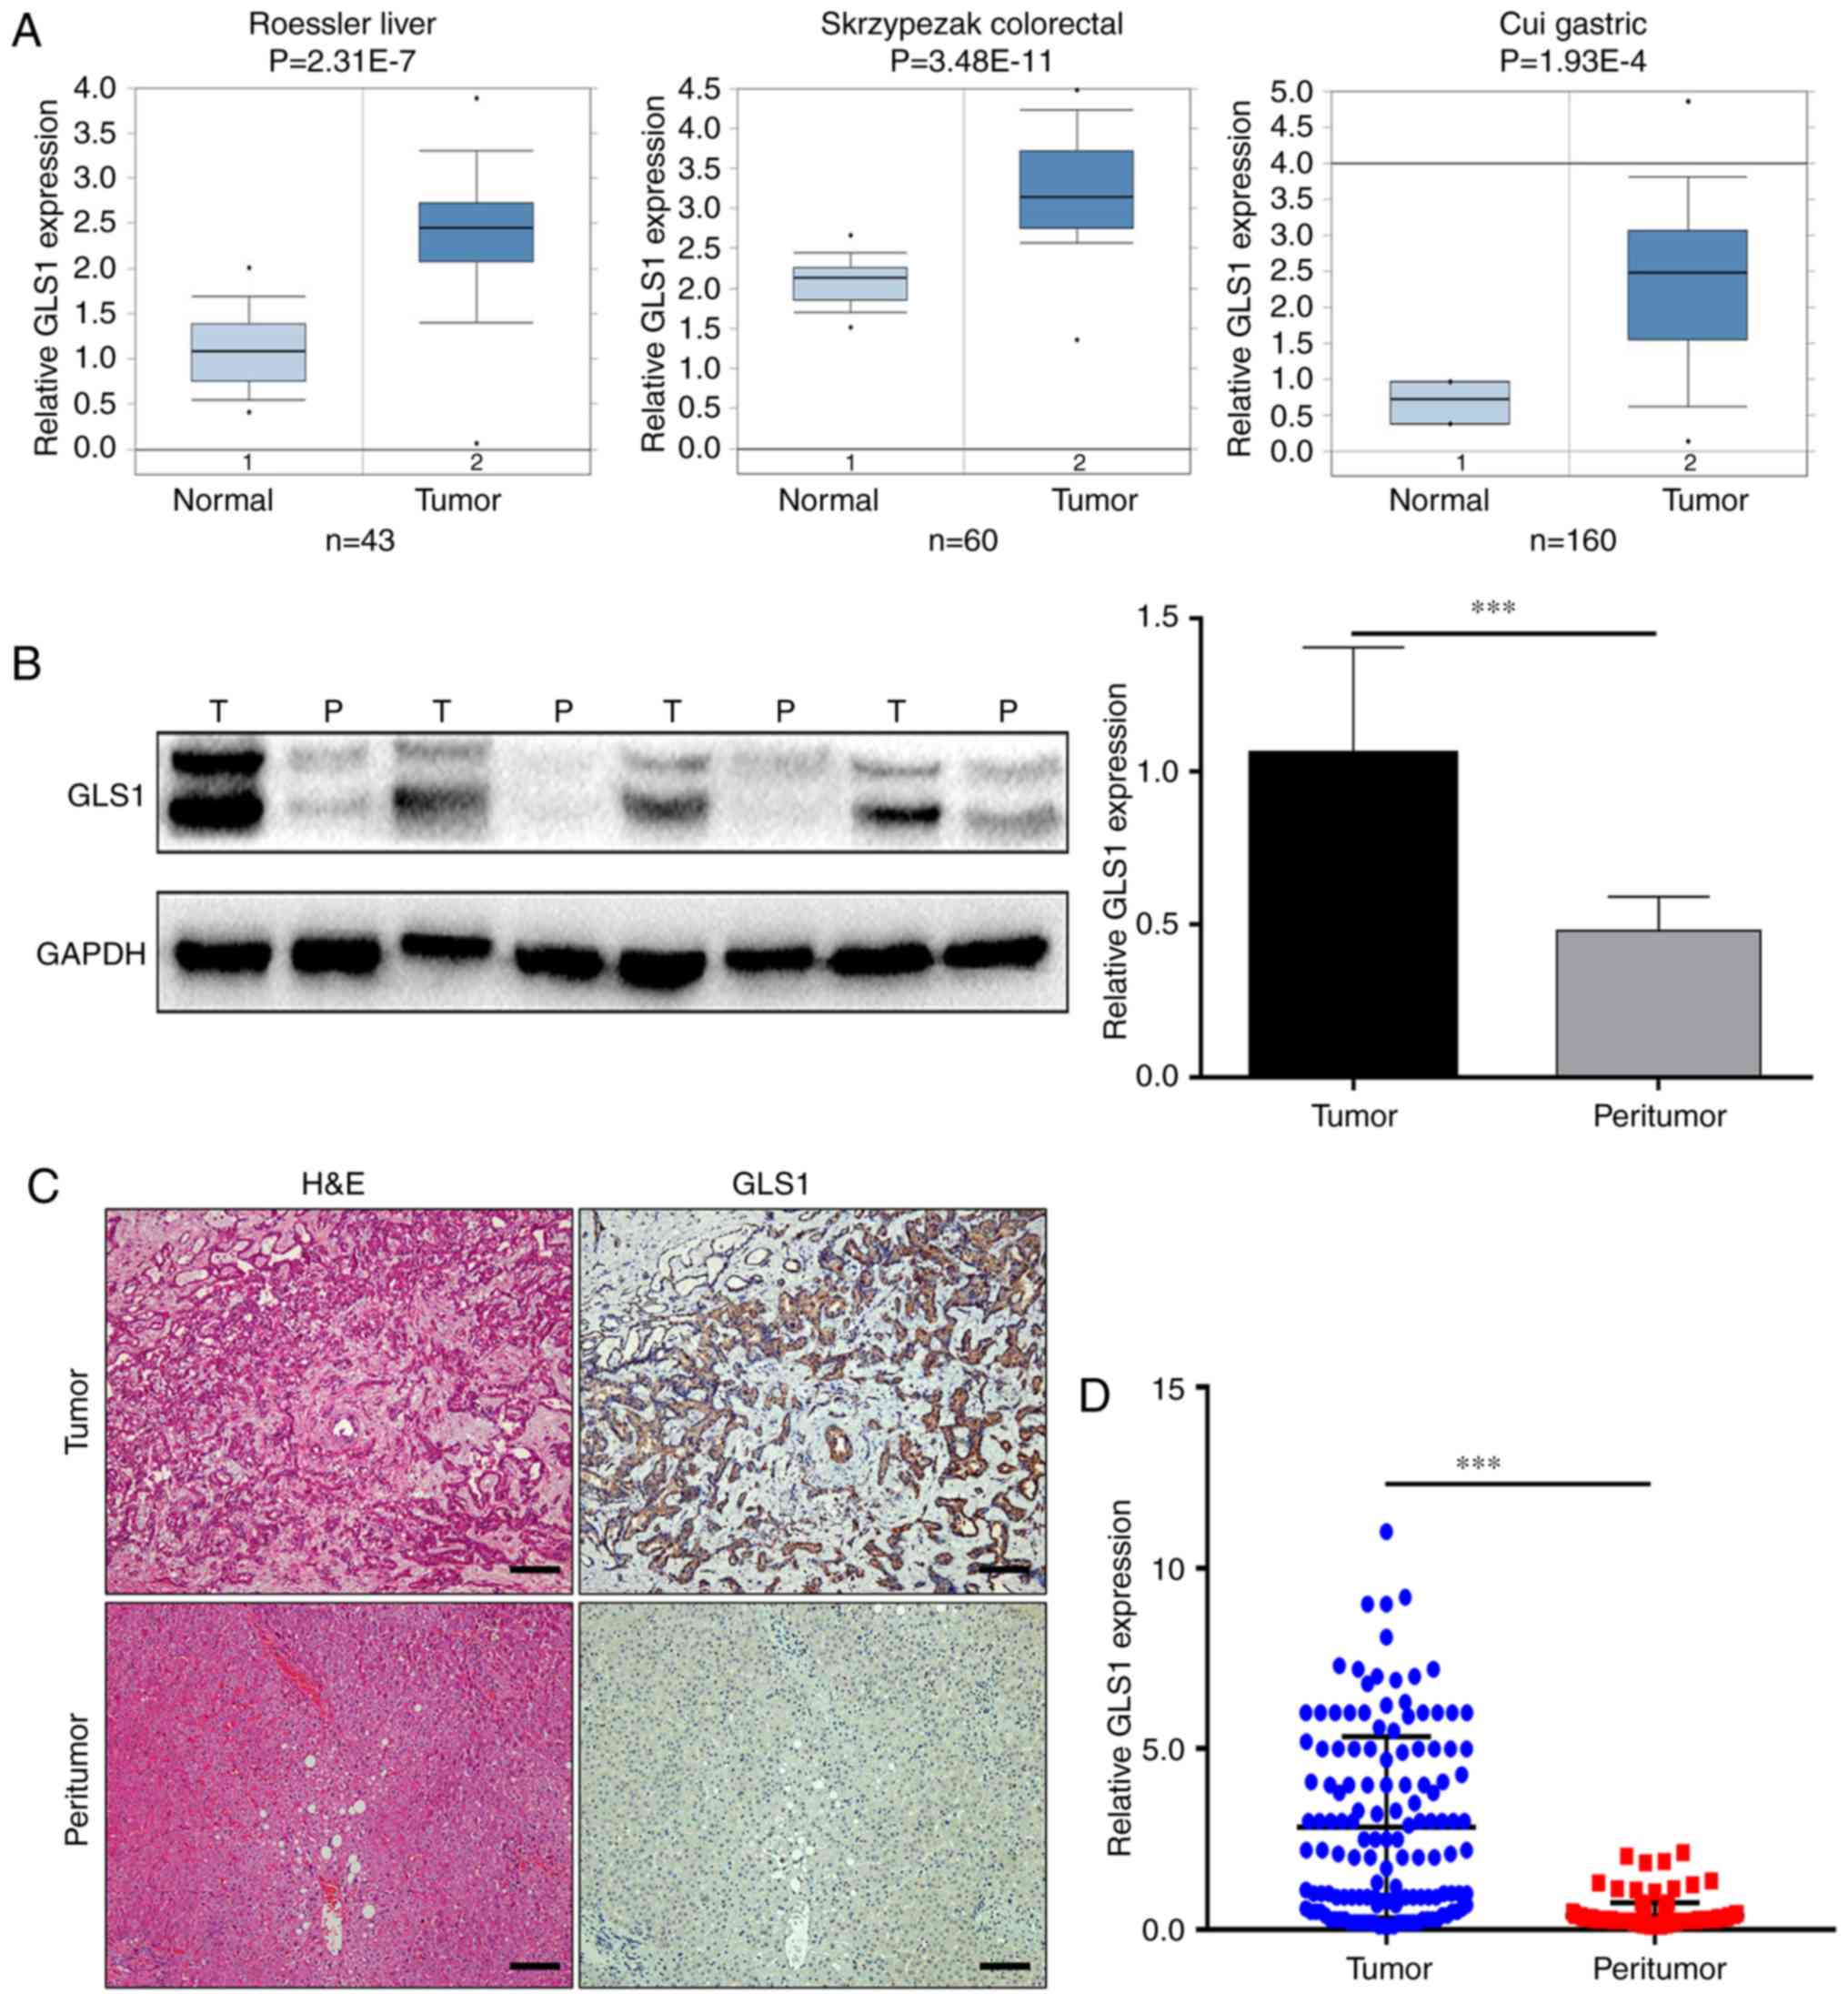
First, data from the Oncomine database were used to
analyze GLS1 transcripts in 3 types of digestive system tumors. As
shown in Fig. 1A, the mRNA levels
of GLS1 in the tumor tissues samples were higher than those in the
paired peritumoral tissues samples, including in the liver cancer,
colorectal cancer and gastric cancer samples (14–16).
However, the expression of GLS1 in ICC tissues remains unclear.
Subsequently, the GLS1 protein levels in the ICC tissue samples and
matched peritumoral specimens were examined by western blot
analysis and immunohistochemistry. The results revealed that the
GLS1 protein levels were higher in the ICC tumor tissue samples
than in the adjacent normal tissue samples (P<0.001; Fig. 1B and D) and found that GLS1 was
mainly expressed in the cytoplasm (Fig. 1C).
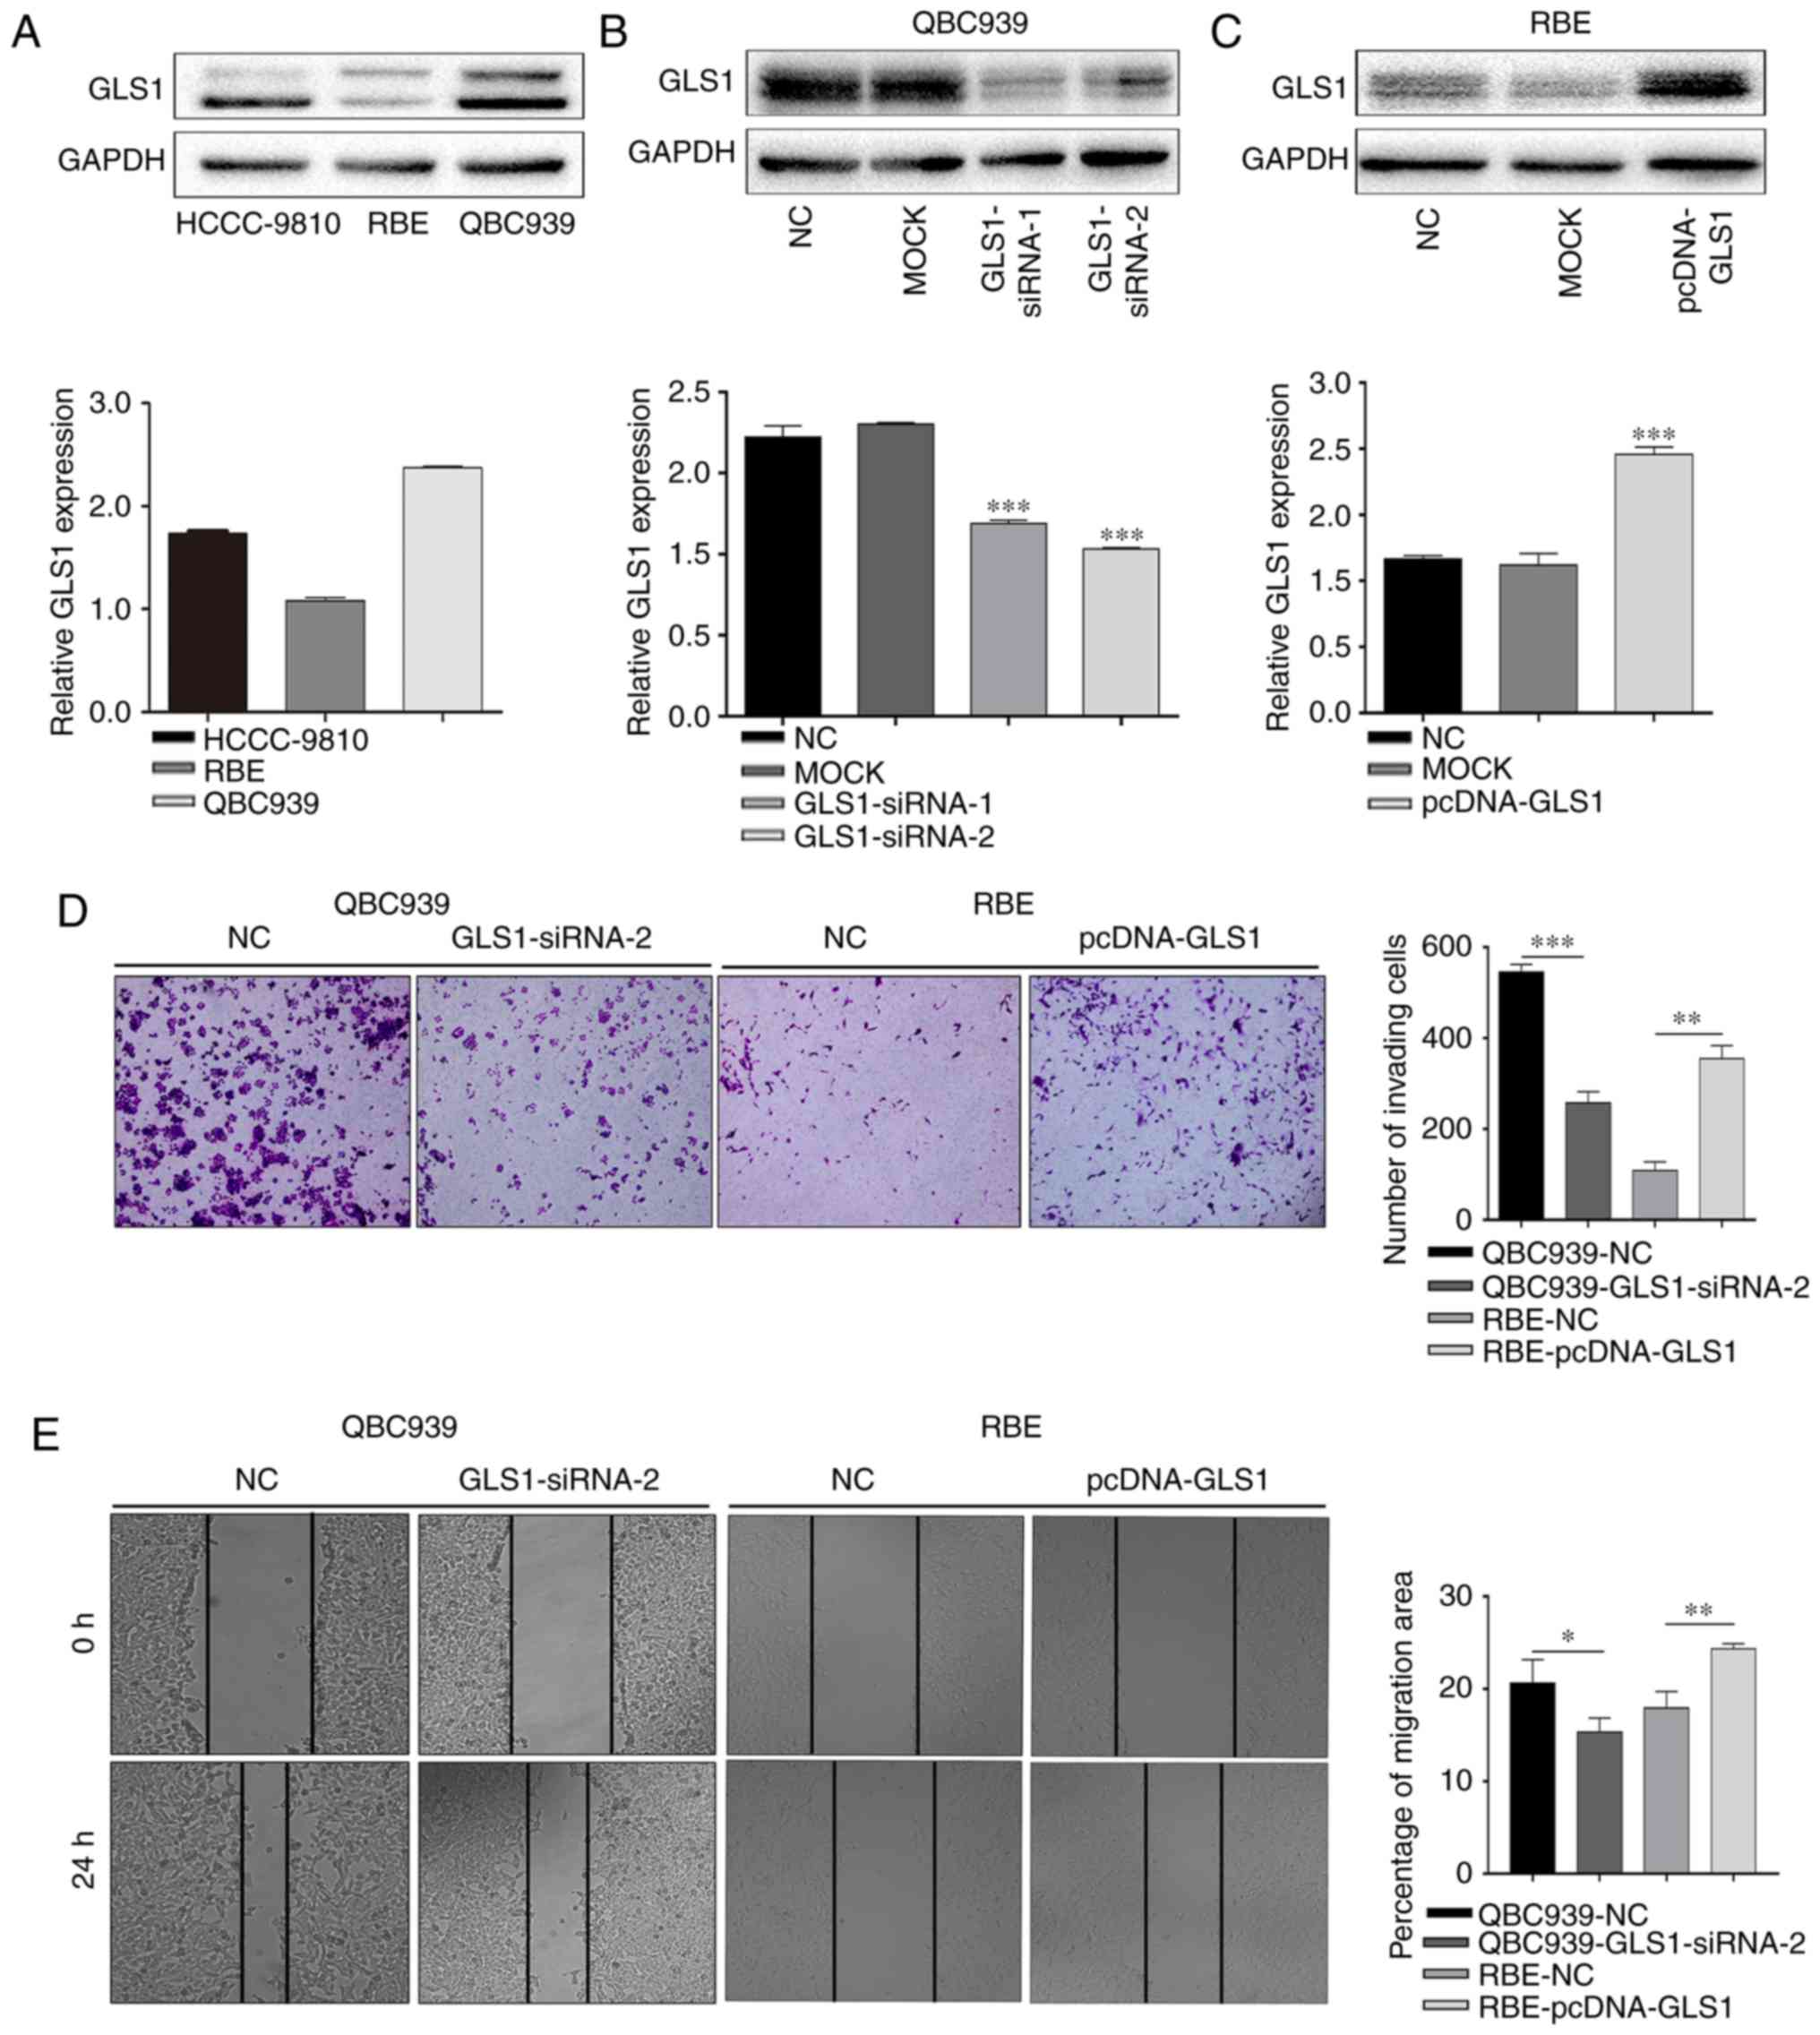
GLS1 regulates the migratory and
invasive abilities of ICC cells
To further examine the role of GLS1 in ICC cell
invasion and migration, the GLS1 protein levels were examined in a
panel of ICC cell lines (QBC939, HCCC-9810 and RBE) by western blot
analysis (Fig. 2A). The data
indicated that the QBC939 cells exhibited the highest expression of
GLS1 and that the RBE cells exhibited the lowest expression level
of GLS1 among all the ICC cell lines examined. Therefore, the
QBC939 cell line and RBE cell line were used in the subsequent
experiments. The results of western blot analysis revealed that
GLS1 expression was markedly knocked down in the
GLS1-siRNA-2-transfected cell lines (Fig. 2B). Therefore, GLS1-siRNA-2 was used
in the subsequent experiments. GLS1 was also overexpressed in the
RBE cells (Fig. 1C). Subsequently,
a Transwell assay revealed that the GLS1-siRNA-2-transfected cells
exhibited a significantly lower rate of invasion than the GLS1-NC
cells (Fig. 2D). A wound-healing
assay also indicated that the downregulation of GLS1 decreased
migration of the GLS1-siRNA-2 ICC cells compared with that of the
GLS1-NC cells at 24 h (Fig. 2E).
However, compared with the NC cells, the RBE cells with an
upregulated GLS1 expression exhibited increased invasion and
metastasis (Fig. 2D and E). These
data indicate that GLS1 positively regulates the migratory and
invasive abilities of ICC cells.
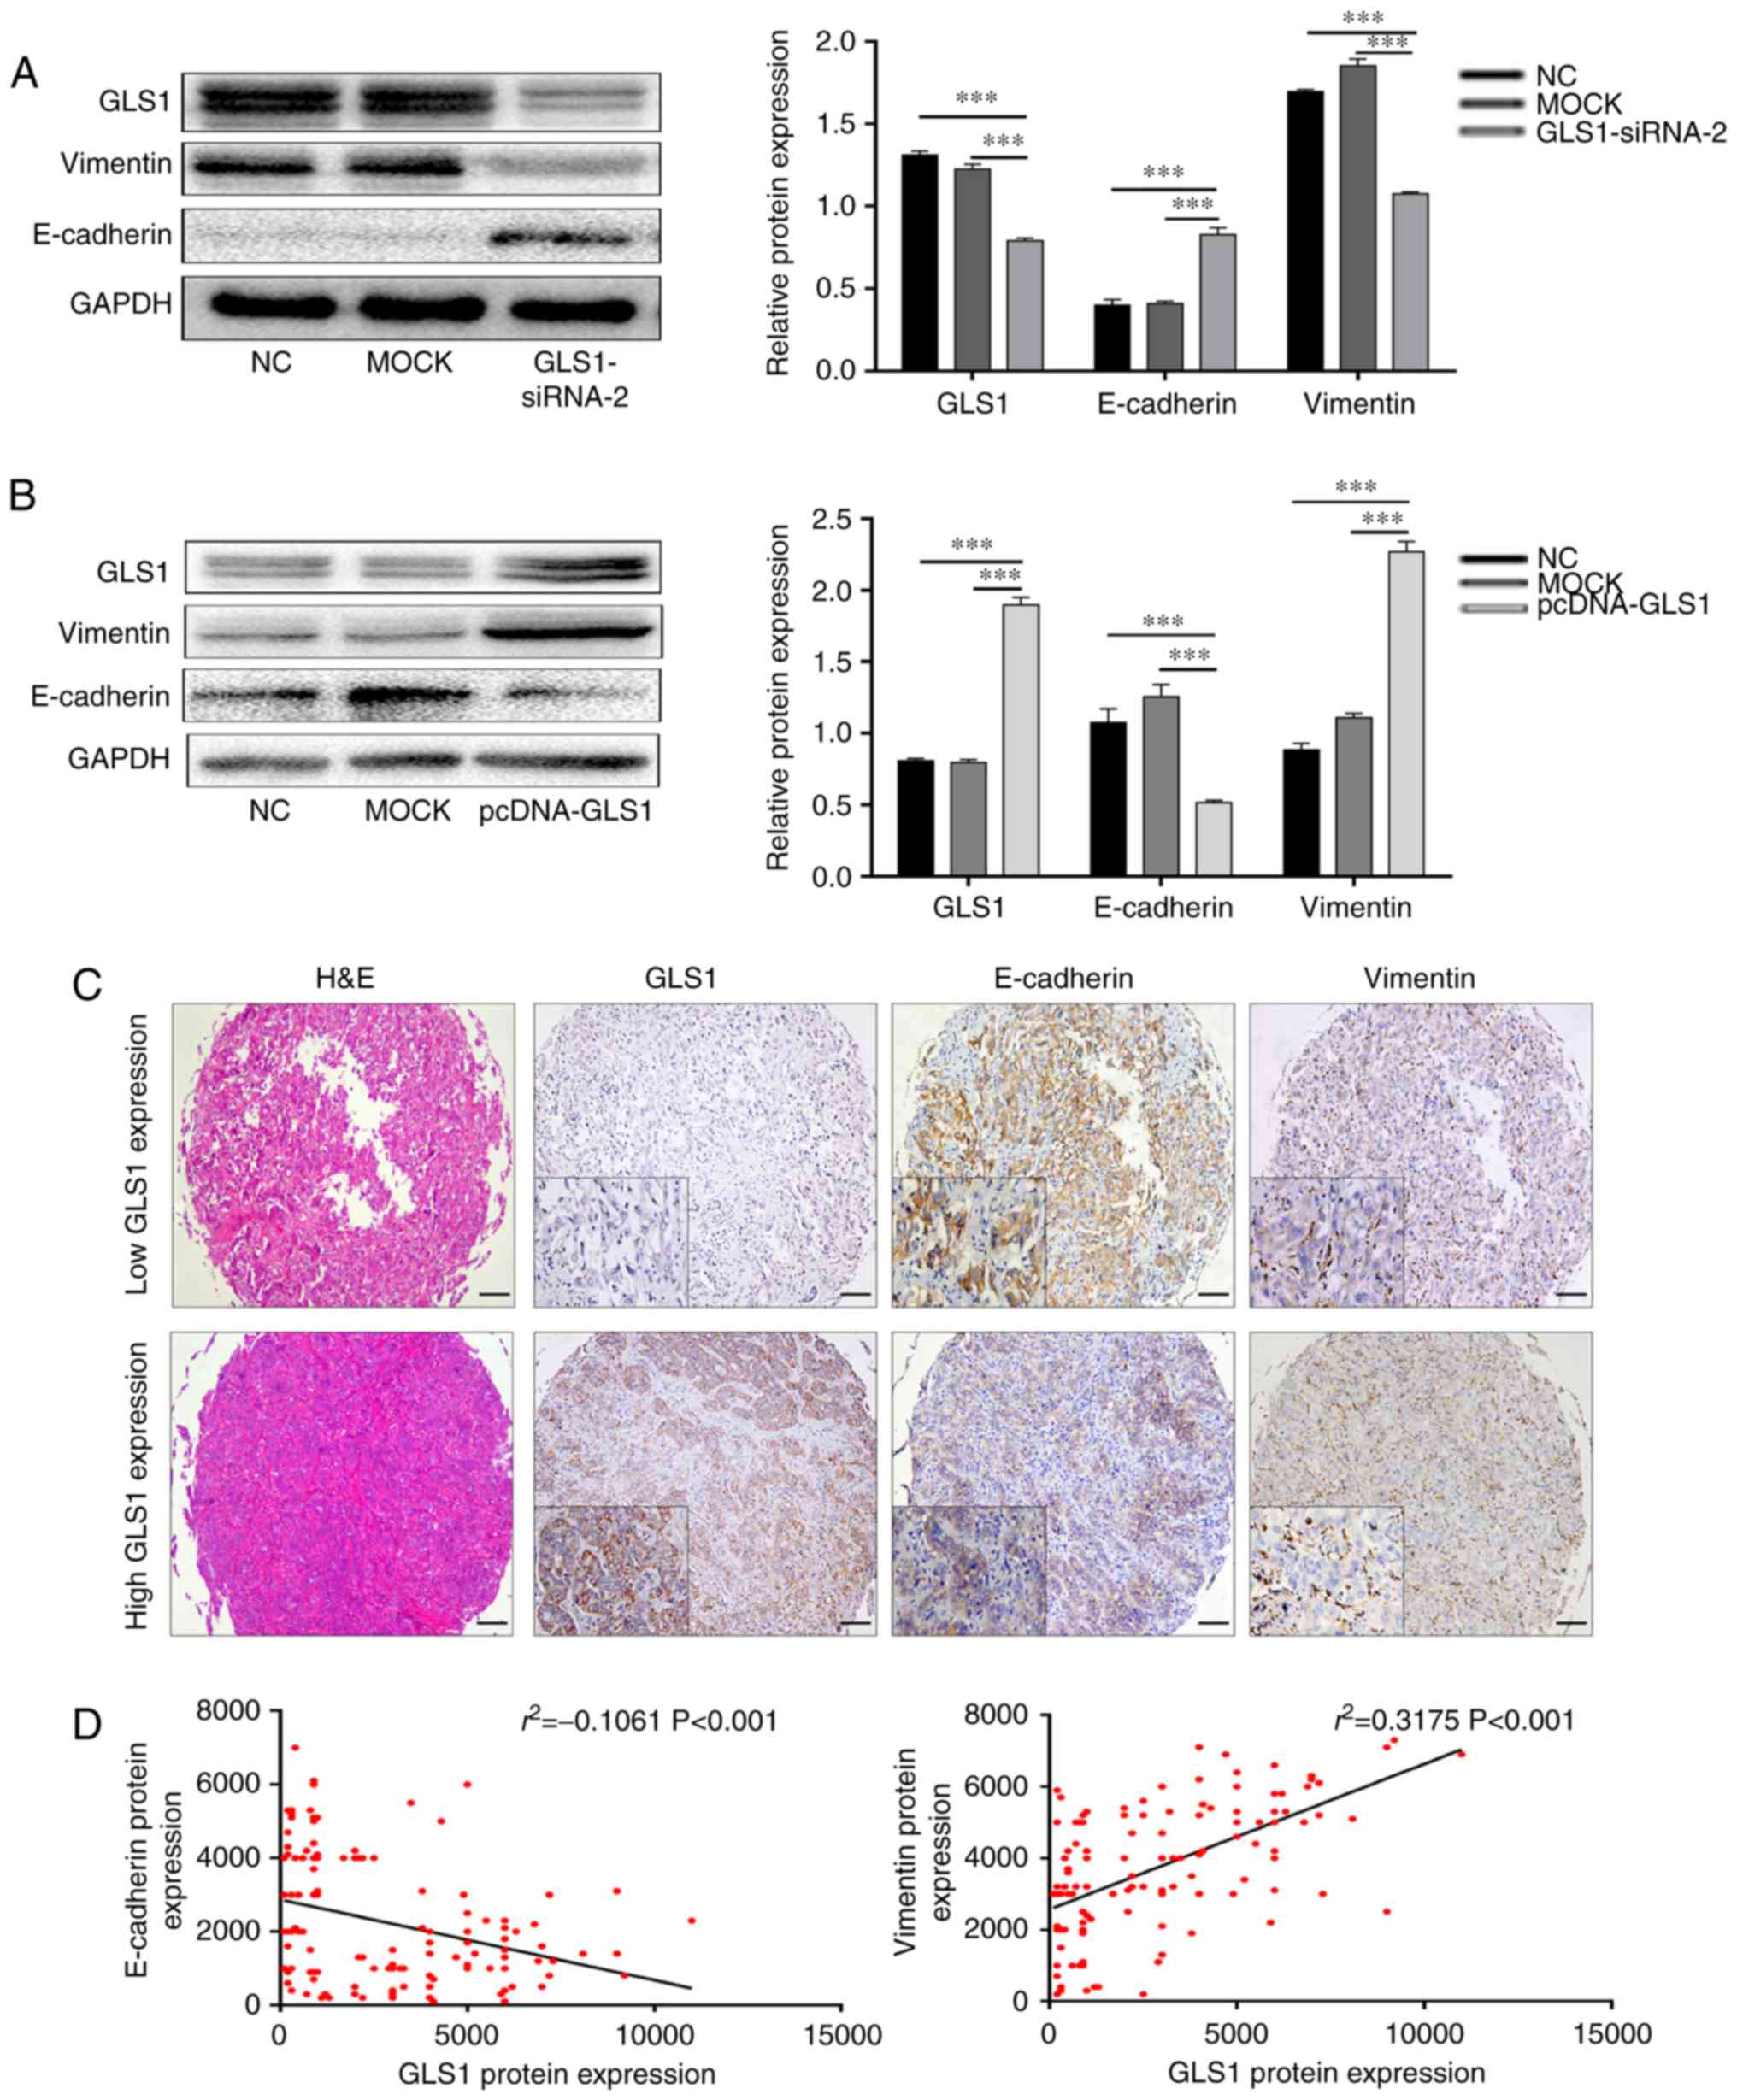
GLS1 regulates the levels of
EMT-related markers in ICC cells
Recently, a previous study demonstrated that GLS1
reduces cell-cell contact and increases cell motility by inducing
EMT in lung cancer cells (12).
Thus, in this study, the expression of two EMT-related markers,
Vimentin and E-cadherin, was determined by western blot analysis.
This experiment indicated that the expression of Vimentin was
significantly reduced, whereas the levels of E-cadherin were
significantly increased following the knockdown of GLS1 expression
in QBC939 cells (P<0.001; Fig.
3A). However, the overexpression of GLS1 in the RBE cells
yielded opposite results (P<0.001; Fig. 3B). Subsequently, using an ICC
tissue array, immunohistochemistry was performed to simultaneously
analyze GLS1, Vimentin and E-cadherin expression (Fig. 3C). The results indicated that in
the human ICC tissue, the GLS1 levels were positively associated
with Vimentin expression and negatively associated with E-cadherin
expression. In addition, Spearman's correlation analysis also
revealed that the GLS1 levels positively correlated with Vimentin
expression (r2=0.3175; P<0.001) and negatively
correlated with E-cadherin expression (r2=−0.1061;
P<0.001; Fig. 3D). These data
indicate that the expression of GLS1 is essential for the EMT
process and for the progression of ICC.
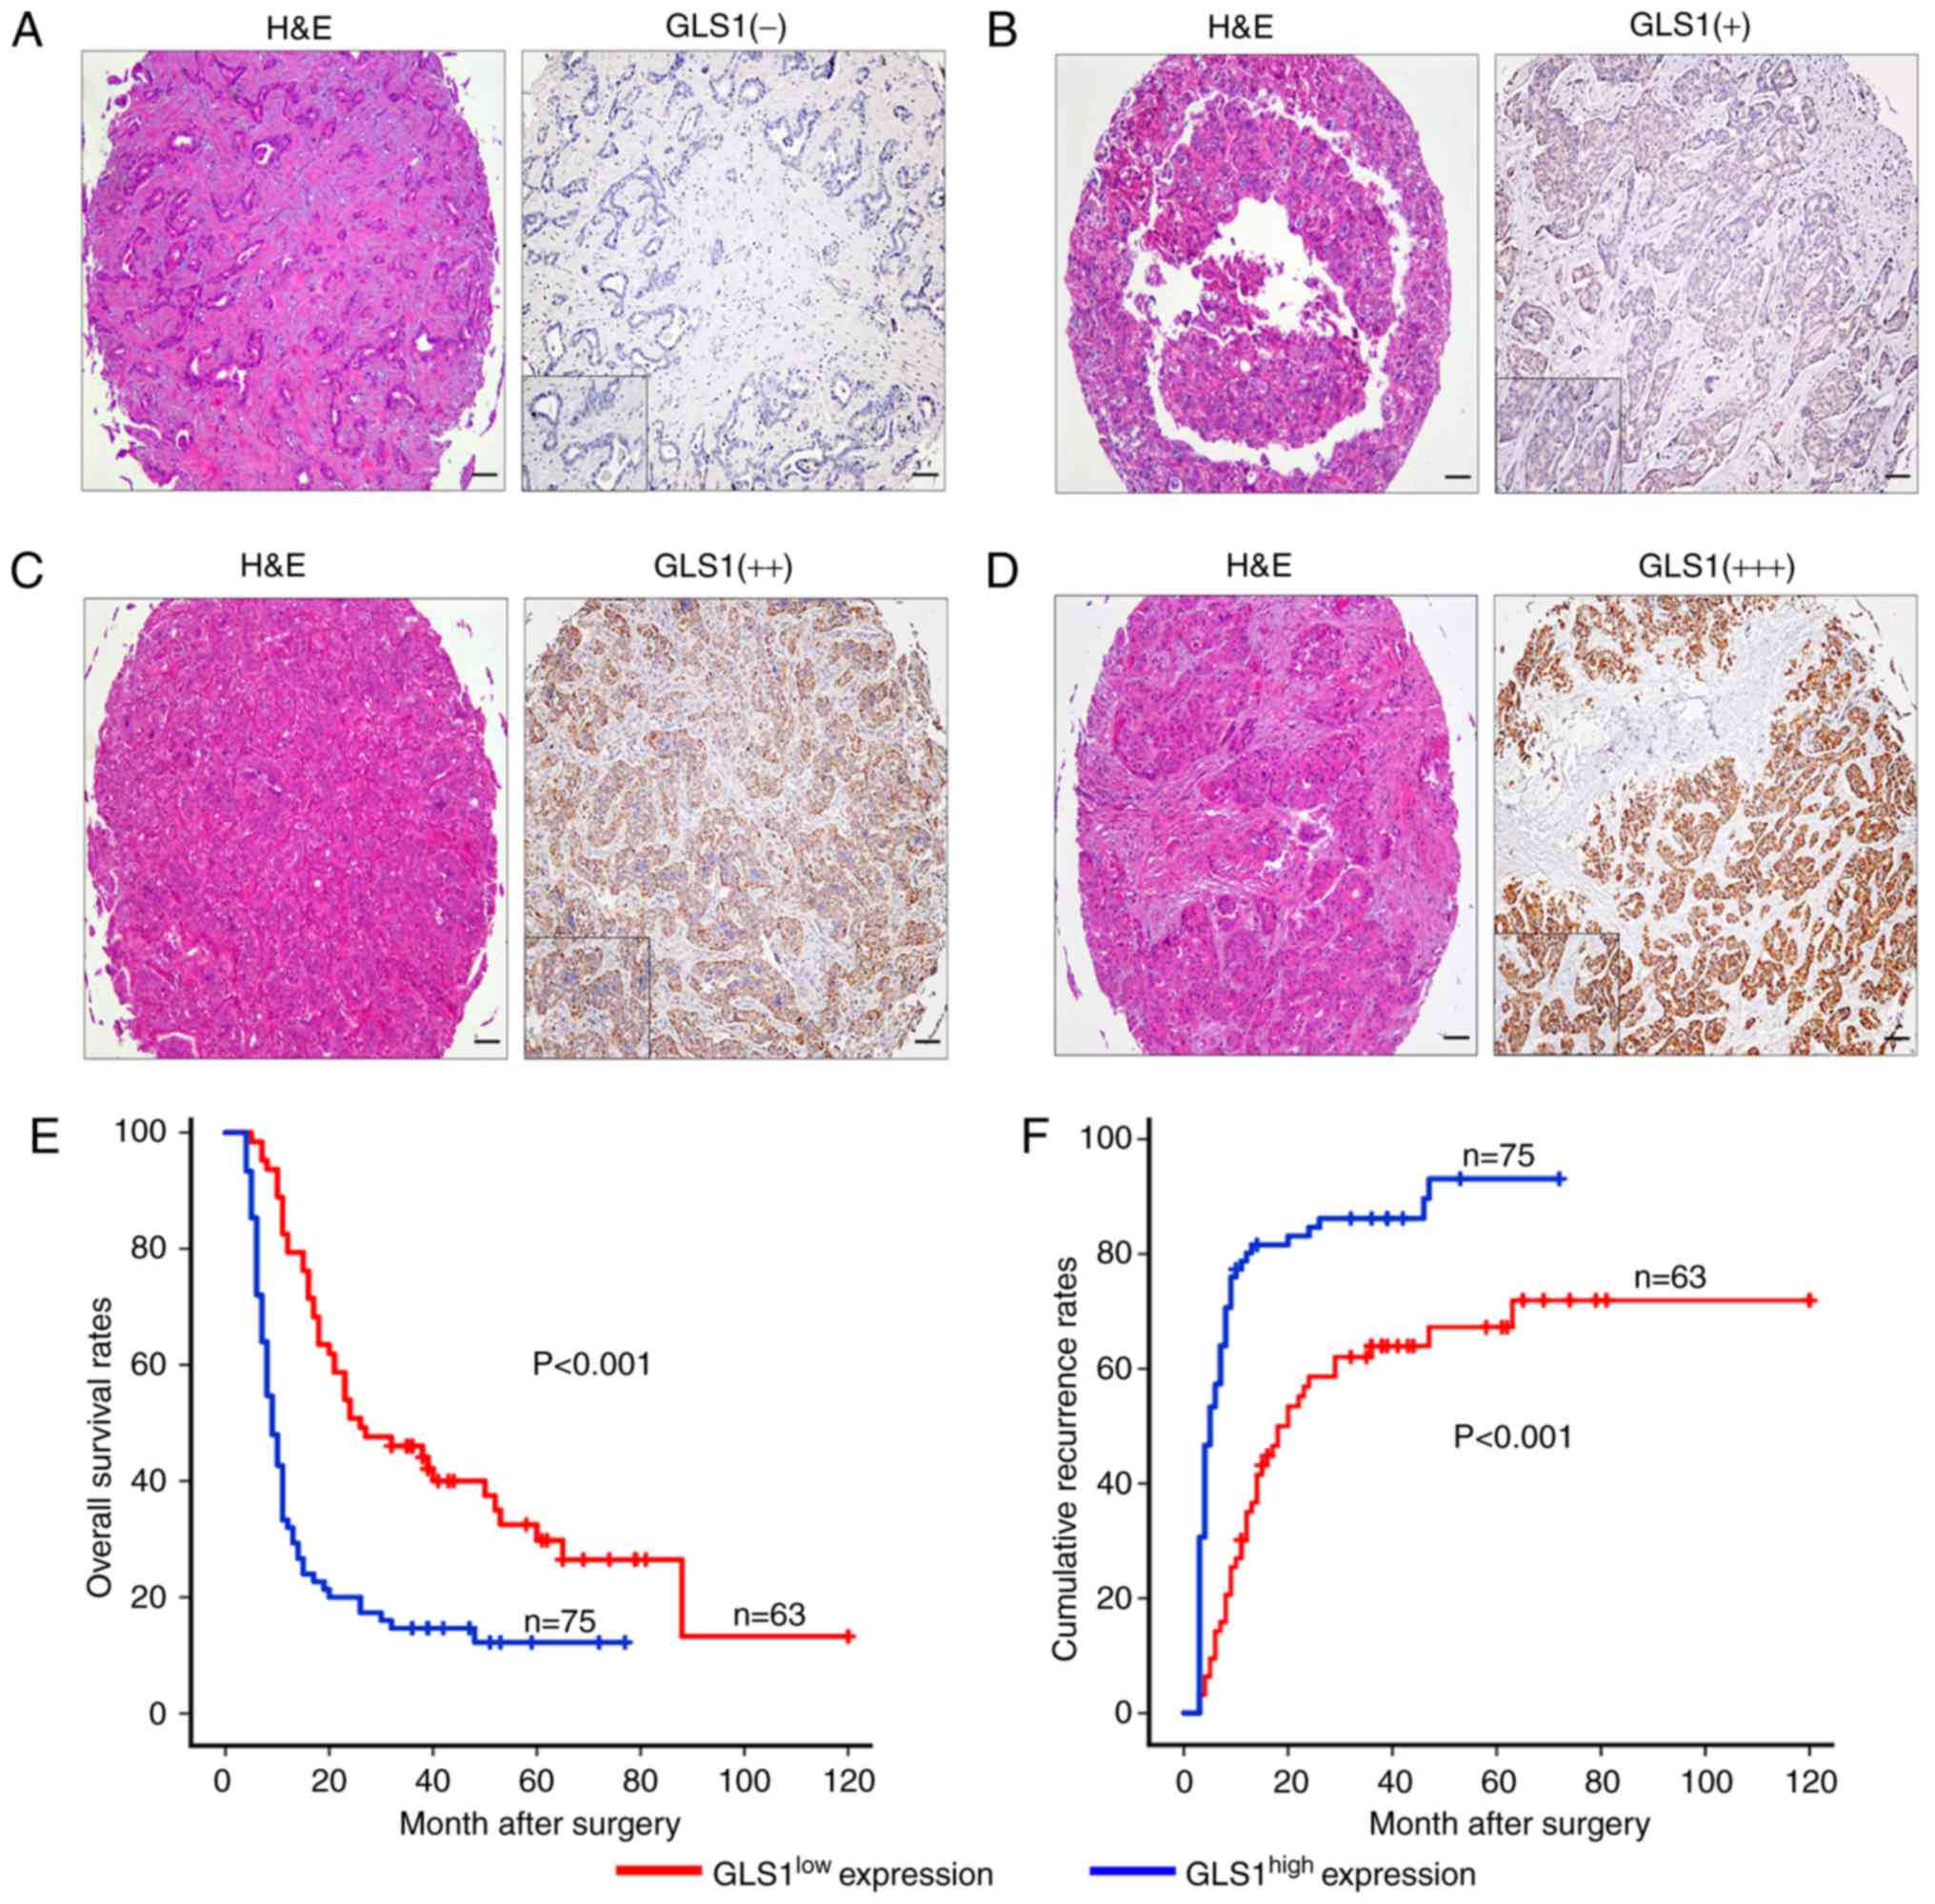
A high expression of GLS1 is
associated with a poor prognostic phenotype
The samples were classified into 2 groups, a
GLS1high (++, moderate; +++, strong) group and a
GLS1low (−, absent; +, weak) group, according to the
mean value of the expression of GLS1 in the tumor tissue samples
(Fig. 4A-D). The
GLS1high group accounted for 54.3% (n=75) of the
samples, and the GLS1low group accounted for 45.7%
(n=63). We found that the overexpression of GLS1 was associated
with malignant phenotypic features, such as lymphatic metastasis
(P=0.029) and poor tumor differentiation (P=0.001) (Table I). By contrast, other
clinicopathological characteristics including age, microvascular
invasion, tumor size and number were not associated with GLS1
expression. The GLS1high expression group was also found
to be associated with a worse OS time than the GLS1low
expression group (P<0.001; Fig.
4E). The 2- and 5-year OS rates in the GLS1high
group were significantly lower than those in the GLS1low
group (21.1 vs. 53.3% and 14.5 vs. 35.5%, respectively). The 2- and
5-year cumulative recurrence rates were also markedly higher in the
GLS1high group compared with the GLS1low
group (81.5 vs. 55.5% and 88.1 vs. 66.1%, respectively; Fig. 4E). Univariate analysis revealed
that GLS1 expression, tumor size, tumor number, embolus and
lymphatic metastasis were significantly associated with OS and
cumulative recurrence rate in patients with ICC (Table II). In addition, multivariate
analysis revealed that GLS1 expression was an independent predictor
of OS (P<0.001) and cumulative recurrence (P<0.001) (Table II).
| Table II.Univariate and multivariate analyses
of factors associated with recurrence and survival of patients with
ICC. |
Table II.
Univariate and multivariate analyses
of factors associated with recurrence and survival of patients with
ICC.
|
| Overall
survival | Cumulative
recurrence |
|---|
|
|
|
|
|---|
|
| Univariate | Multivariate | Univariate | Multivariate |
|---|
|
|
|
|
|
|
|---|
| Variable | P-value | HR (95% CI) | P-value | P-value | HR (95% CI) | P-value |
|---|
| Sex (male vs.
female) | 0.847 |
| NA | 0.921 |
| NA |
| Age, years (≥53 vs.
<53) | 0.491 |
| NA | 0.338 |
| NA |
| HBsAg (positive vs
negative) | 0.949 |
| NA | 0.518 |
| NA |
| Child–Pugh score (a
vs. B) | 0.131 |
| NA | 0.388 |
| NA |
| Serum CA 19-9,
ng/ml (≥37 vs., <37) | 0.272 |
| NA | 0.215 |
| NA |
| Serum ALT, U/l (≥75
vs., <75) | 0.599 |
| NA | 0.799 |
| NA |
| AFP | 0.130 |
| NA | 0.562 |
| NA |
| CEA | 0.981 |
| NA | 0.361 |
| NA |
| GGT | 0.044 |
| NS | 0.190 |
| NA |
| Cirrhosis (yes vs.
no) | 0.276 |
| NA | 0.458 |
| NA |
| Tumor size
(diameter, cm) (≥5 vs., <5) | 0.022 | 0.562
(0.338–0.935) | 0.026 | 0.005 | 0.540
(0.282–0.816) | 0.007 |
| Tumor number
(multiple vs. solitary) | 0.007 |
| NS | 0.001 | 0.479
(0.235–0.882) | 0.020 |
| Embolus (yes vs.
no) | 0.032 |
| NS | 0.031 | 0.619
(0.403–0.952) | 0.290 |
| Capsulation (yes
vs. no) | 0.252 |
| NA | 0.125 |
| NA |
| Lymphatic
metastasis (yes vs. no) | 0.007 | 0.539
(0.352–0.826) | 0.040 | 0.001 | 0.619
(0.352–0.826) | 0.029 |
| Tumor
differentiation (III/IV vs. I/II) | 0.069 |
| NS | 0.059 |
| NA |
| GLS1 density
(<50% vs. ≥50%) | <0.001 | 2.718
(1.820–4.059) | <0.001 | <0.001 | 2.774
(1.84–4.182) | <0.001 |
Discussion
In this study, we demonstrated that GLS1 was
overexpressed in ICC tissue compared with adjacent normal tissue,
and the downregulation of GLS1 expression in QBC939 cells
suppressed ICC cell invasion and migration. The expression of the
EMT mesenchymal marker, Vimentin, was downregulated following the
knockdown of GLS1 expression in QBC939 cells. By contrast, the
expression of the epithelial marker, E-cadherin, was upregulated.
However, the overexpression of GLS1 in the RBE cells induced a
lower expression of E-cadherin and a higher expression of Vimentin.
Clinically, we detected GLS1 expression among 138 patients with
ICC. The results revealed that a high GLS1 expression was strongly
associated with poor tumor differentiation, lymphatic metastasis,
early recurrence and an unfavorable prognosis. Patients with a high
expression of GLS1 had a poorer OS and higher cumulative recurrence
rates than patients with a low GLS1 expression.
The ‘Warburg effect’ describes the phenomenon of
cancer cells creating energy predominantly from the glycolytic
breakdown of glycose, rather than mitochondrial oxidative
phosphorylation (17). In most
situations, cancer cells that exhibit the Warburg effect also
exhibit a significant dependence on glutamine and cannot
proliferate in cell culture without this molecule, a state called
‘glutamine addiction’ (18). GLS1
dysregulation has been reported in a number of types of cancer. For
instance, Pan et al (19)
found that GLS1 participated in the TCA cycle, elevating glucose
intake and promoting the growth of prostate cancer cells. In our
previous study, we also found that GLS1 protein was frequently
expressed in HCC tissue samples and that this expression was
associated with a poor prognosis (7). The underlying mechanisms may be
associated with the EMT process. Research has indicated that GLS1
regulates E-cadherin and Snail in MCF-7 cells (12), which indicates that GLS1 can
regulate EMT-associated genes. Recent evidence has also indicated
that GLS1 plays a significant role in the progression of ICC,
suggesting that GLS1 may be a novel prognostic factor and treatment
target in ICC.
Previous studies have reported that EMT is a
potential mechanism of cancer metastasis, and this process
activates the mesenchymal phenotype and represses the epithelial
phenotype, driving separation from the primary tumor (20–22).
Recently, GLS1 was demonstrated to regulate Vimentin, E-cadherin
and Snail expression (12,23). Therefore, GLS1 may regulate
E-cadherin and Vimentin expression in ICC. The findings of this
study indicated that GLS1 expression negatively correlated with
E-cadherin expression and positively correlated with Vimentin
expression. Moreover, the regulation of GLS1 expression affected
E-cadherin and Vimentin expression in ICC cells. These data suggest
that there is a potential association between GLS1 and EMT as
regards the progression of ICC.
In conclusion, the interactions of GLS1 with
E-cadherin and Vimentin were confirmed in this study. However,
whether other EMT markers are regulated by GLS1 warrants further
investigation in the future. The results of this study, suggest
that GLS1 may prove to be an innovative therapeutic target in
patients with ICC.
Acknowledgements
Not applicable.
Funding
This study was supported by the Health research
project in Jiangsu Province (grant no. H201661), Cancer Biology
State Key Laboratory Project (grant no. CBSKL201717) and the
National Natural Science Foundation of China (grant no.
81702861).
Availability of data and materials
The datasets used and/or analyzed during the current
study are available from the corresponding author upon reasonable
request.
Authors' contributions
JC and DSB were involved in study design and drafted
the manuscript. CZ, GQJ, SJJ and AWK were involved in TMA analysis.
ZHG, DCY and QW were involved in statistical analysis. YQF, DWL and
AQW were involved in clinical data collection. DSB was involved in
the study design, financial support and proof-reading of the
manuscript. All authors read and approved the final manuscript.
Ethics approval and consent to
participate
The use of these tissue specimens was approved by
the Zhongshan Hospital Research Ethics Committee and written
consent was obtained from the patients.
Patient consent for publication
Not applicable.
Competing interests
The authors declare that they have no competing
interests.
References
|
1
|
Bartella I and Dufour JF: Clinical
diagnosis and staging of intrahepatic cholangiocarcinoma. J
Gastrointestin Liver Dis. 24:481–489. 2015.PubMed/NCBI
|
|
2
|
Guo LH and Xu HX: Contrast-enhanced
ultrasound in the diagnosis of hepatocellular carcinoma and
intrahepatic cholangiocarcinoma: Controversy over the ASSLD
Guideline. Biomed Res Int. 2015:3491722015. View Article : Google Scholar : PubMed/NCBI
|
|
3
|
Guro H, Kim JW, Choi Y, Cho JY, Yoon YS
and Han HS: Multidisciplinary management of intrahepatic
cholangiocarcinoma: Current approaches. Surg Oncol. 26:146–152.
2017. View Article : Google Scholar : PubMed/NCBI
|
|
4
|
Yoh T, Hatano E, Nishio T, Seo S, Taura K,
Yasuchika K, Okajima H, Kaido T and Uemoto S: Significant
improvement in outcomes of patients with intrahepatic
cholangiocarcinoma after surgery. World J Surg. 40:2229–2236. 2016.
View Article : Google Scholar : PubMed/NCBI
|
|
5
|
Guglielmi A, Ruzzenente A, Campagnaro T,
Pachera S, Valdegamberi A, Nicoli P, Cappellani A, Malfermoni G and
Iacono C: Intrahepatic cholangiocarcinoma: Prognostic factors after
surgical resection. World J Surg. 33:1247–1254. 2009. View Article : Google Scholar : PubMed/NCBI
|
|
6
|
Hanahan D and Weinberg RA: Hallmarks of
cancer: The next generation. Cell. 144:646–674. 2011. View Article : Google Scholar : PubMed/NCBI
|
|
7
|
Yu D, Shi X, Meng G, Chen J, Yan C, Jiang
Y, Wei J and Ding Y: Kidney-type glutaminase (GLS1) is a biomarker
for pathologic diagnosis and prognosis of hepatocellular carcinoma.
Oncotarget. 6:7619–7631. 2015.PubMed/NCBI
|
|
8
|
Qie S, Chu C, Li W, Wang C and Sang N:
ErbB2 activation upregulates glutaminase 1 expression which
promotes breast cancer cell proliferation. J Cell Biochem.
115:498–509. 2014. View Article : Google Scholar : PubMed/NCBI
|
|
9
|
Huang F, Zhang Q, Ma H, Lv Q and Zhang T:
Expression of glutaminase is upregulated in colorectal cancer and
of clinical significance. Int J Clin Exp Pathol. 7:1093–1100.
2014.PubMed/NCBI
|
|
10
|
Huang F, Wang BR and Wang YG: Role of
autophagy in tumorigenesis, metastasis, targeted therapy and drug
resistance of hepatocellular carcinoma. World J Gastroenterol.
24:4643–4651. 2018. View Article : Google Scholar : PubMed/NCBI
|
|
11
|
Klymkowsky MW: Beta-catenin and its
regulatory network. Hum Pathol. 36:225–227. 2005. View Article : Google Scholar : PubMed/NCBI
|
|
12
|
Lee SY, Jeon HM, Ju MK, Jeong EK, Kim CH,
Park HG, Han SI and Kang HS: Dlx-2 and glutaminase upregulate
epithelial-mesenchymal transition and glycolytic switch.
Oncotarget. 7:7925–7939. 2016.PubMed/NCBI
|
|
13
|
Bai DS, Dai Z, Zhou J, Liu YK, Qiu SJ, Tan
CJ, Shi YH, Huang C, Wang Z, He YF and Fan J: Capn4 overexpression
underlies tumor invasion and metastasis after liver transplantation
for hepatocellular carcinoma. Hepatology. 49:460–470. 2009.
View Article : Google Scholar : PubMed/NCBI
|
|
14
|
Roessler S, Jia HL, Budhu A, Forgues M, Ye
QH, Lee JS, Thorgeirsson SS, Sun Z, Tang ZY, Qin LX and Wang XW: A
unique metastasis gene signature enables prediction of tumor
relapse in early-stage hepatocellular carcinoma patients. Cancer
Res. 70:10202–10212. 2010. View Article : Google Scholar : PubMed/NCBI
|
|
15
|
Cui J, Chen Y, Chou WC, Sun L, Chen L, Suo
J, Ni Z, Zhang M, Kong X, Hoffman LL, et al: An integrated
transcriptomic and computational analysis for biomarker
identification in gastric cancer. Nucleic Acids Res. 39:1197–1207.
2011. View Article : Google Scholar : PubMed/NCBI
|
|
16
|
Skrzypczak M, Goryca K, Rubel T, Paziewska
A, Mikula M, Jarosz D, Pachlewski J, Oledzki J and Ostrowski J:
Modeling oncogenic signaling in colon tumors by multidirectional
analyses of microarray data directed for maximization of analytical
reliability. PLoS One. 5(pii): e130912010. View Article : Google Scholar : PubMed/NCBI
|
|
17
|
Zhao Y, Butler EB and Tan M: Targeting
cellular metabolism to improve cancer therapeutics. Cell Death Dis.
4:e5322013. View Article : Google Scholar : PubMed/NCBI
|
|
18
|
Abu Aboud O, Habib SL, Trott J, Stewart B,
Liang S, Chaudhari AJ, Sutcliffe J and Weiss RH: Glutamine
addiction in kidney cancer suppresses oxidative stress and can Be
exploited for real-time imaging. Cancer Res. 77:6746–6758. 2017.
View Article : Google Scholar : PubMed/NCBI
|
|
19
|
Pan T, Gao L, Wu G, Shen G, Xie S, Wen H,
Yang J, Zhou Y, Tu Z and Qian W: Elevated expression of glutaminase
confers glucose utilization via glutaminolysis in prostate cancer.
Biochem Biophys Res Commun. 456:452–458. 2015. View Article : Google Scholar : PubMed/NCBI
|
|
20
|
Krebs AM, Mitschke J, Lasierra Losada M,
Schmalhofer O, Boerries M, Busch H, Boettcher M, Mougiakakos D,
Reichardt W, Bronsert P, et al: The EMT-activator Zeb1 is a key
factor for cell plasticity and promotes metastasis in pancreatic
cancer. Nat Cell Biol. 19:518–529. 2017. View Article : Google Scholar : PubMed/NCBI
|
|
21
|
Qureshi R, Arora H and Rizvi MA: EMT in
cervical cancer: Its role in tumour progression and response to
therapy. Cancer Lett. 356:321–331. 2015. View Article : Google Scholar : PubMed/NCBI
|
|
22
|
Terry S, Savagner P, Ortiz-Cuaran S,
Mahjoubi L, Saintigny P, Thiery JP and Chouaib S: New insights into
the role of EMT in tumor immune escape. Mol Oncol. 11:824–846.
2017. View Article : Google Scholar : PubMed/NCBI
|
|
23
|
Ulanet DB, Couto K, Jha A, Choe S, Wang A,
Woo HK, Steadman M, DeLaBarre B, Gross S, Driggers E, et al:
Mesenchymal phenotype predisposes lung cancer cells to impaired
proliferation and redox stress in response to glutaminase
inhibition. PLoS One. 9:e1151442014. View Article : Google Scholar : PubMed/NCBI
|