Introduction
Cervical cancer (CerC) is a leading cause of
cancer-associated mortality in women worldwide (1,2).
Surgery in combination with chemotherapy and radiotherapy is the
most common strategy for CerC treatment. Radiotherapy significantly
improves CerC patient prognosis (3). However, the overall survival of
patients with CerC diagnosed at advanced stages remains poor, with
the 5-year survival rate ≤50%, despite advanced surgical protocols
and diagnostic methods (4).
The general prognosis criteria of the International
Federation of Gynecology and Obstetrics (FIGO) classification do
not include all prognostic factors, including histologic subtypes
and lymph node metastasis, which are effective for the prediction
of CerC prognosis (5). Molecular
markers and clinical parameters are crucial for the prediction of
clinical outcomes and deciding treatment strategies (2,5). In
addition, the identification of biomarkers associated with
radiotherapy response is of great importance for understanding the
molecular mechanisms of CerC and developing novel strategies.
Radiotherapy significantly benefits patients with
CerC (3). The methylation status
in the promoters of a number of genes is associated with patient
outcomes after radiotherapy (6–8). For
example, Dunn et al (6)
demonstrated that the
O6-methyxlguanine-DNA-methyltransferase (MGMT) promoter
methylation level was positively associated with the
progression-free survival and overall survival of patients with
glioblastomas treated with temozolomide and radiotherapy (6). Huang et al (7) indicated that the combined Ras
association domain family member (RASSF) 1A/RASSF2A methylation
level was negatively correlated with the disease-free survival
(DFS) of radiotherapy-treated squamous cell carcinoma.
Widschwendter et al (9)
revealed that the methylated myoblast determination protein 1
(MYOD1) in CerC was associated with poor DFS (9).
An increasing number of studies have indicated the
prognostic power of gene signatures for diease prognosis,
metastasis and recurrence. Okayama et al (10) identified a 4 gene signature with
prediction power for stage I lung cancer prognosis (10); Cheng et al (11) described an 8-gene classifier with
predictive power for locoregional recurrence of breast cancer in
patients post-mastectomy (11).
Therefore, the predictive power of multigene sigatures for disease
development may be of great clinical interest. A 12-gene classifier
has been used for the clinical diagnosis of low and high metastasis
of in uveal melanoma (12,13). In addition, the DNA methylation
level is a significant factor in disease development (6–8).
However, to the best of our knowledge, there have been few studies
investigating gene methylation signatures for prognosis in
radiotherapy-treated patients with CerC.
The present study was designed to explore a novel
risk model for predicting outcome of patients with CerC by
analyzing RNA sequencing (RNA-seq) data in combination with matched
DNA methylation profiles from The Cancer Genome Atlas (TCGA)
database. A multigene risk model that predicted the outcomes of
patients with CerC treated with or without radiotherapy was
identified.
Materials and methods
TCGA and Gene Expression Omnibus (GEO)
dataset
Training data were downloaded from TCGA database
(https://gdc-portal.nci.nih.gov/) in June
2018. A total of 307 mRNA-seq profiles (Illumina Hiseq2000) and 312
DNA methylation profiles (Illumina Infinium Human Methylation 450
BeadChip) were downloaded. Paired mRNA-seq and methylation data
were included in the present study. Clinical features including
age, pathologic stage and grade, and survival rate of patients with
CerC were extracted and used for subsequent analysis.
Validation dataset GSE44001 (GPL14951 Illumina
HumanHT-12 WG-DASL V4.0 R2 expression beadchip) (14) was downloaded from the National
Center of Biotechnology Information GEO database (http://www.ncbi.nlm.nih.gov/geo/). The GSE44001
dataset consists of 300 patients with primary early CerC (FIGO
stage I–II). Prognostic data were available for the training and
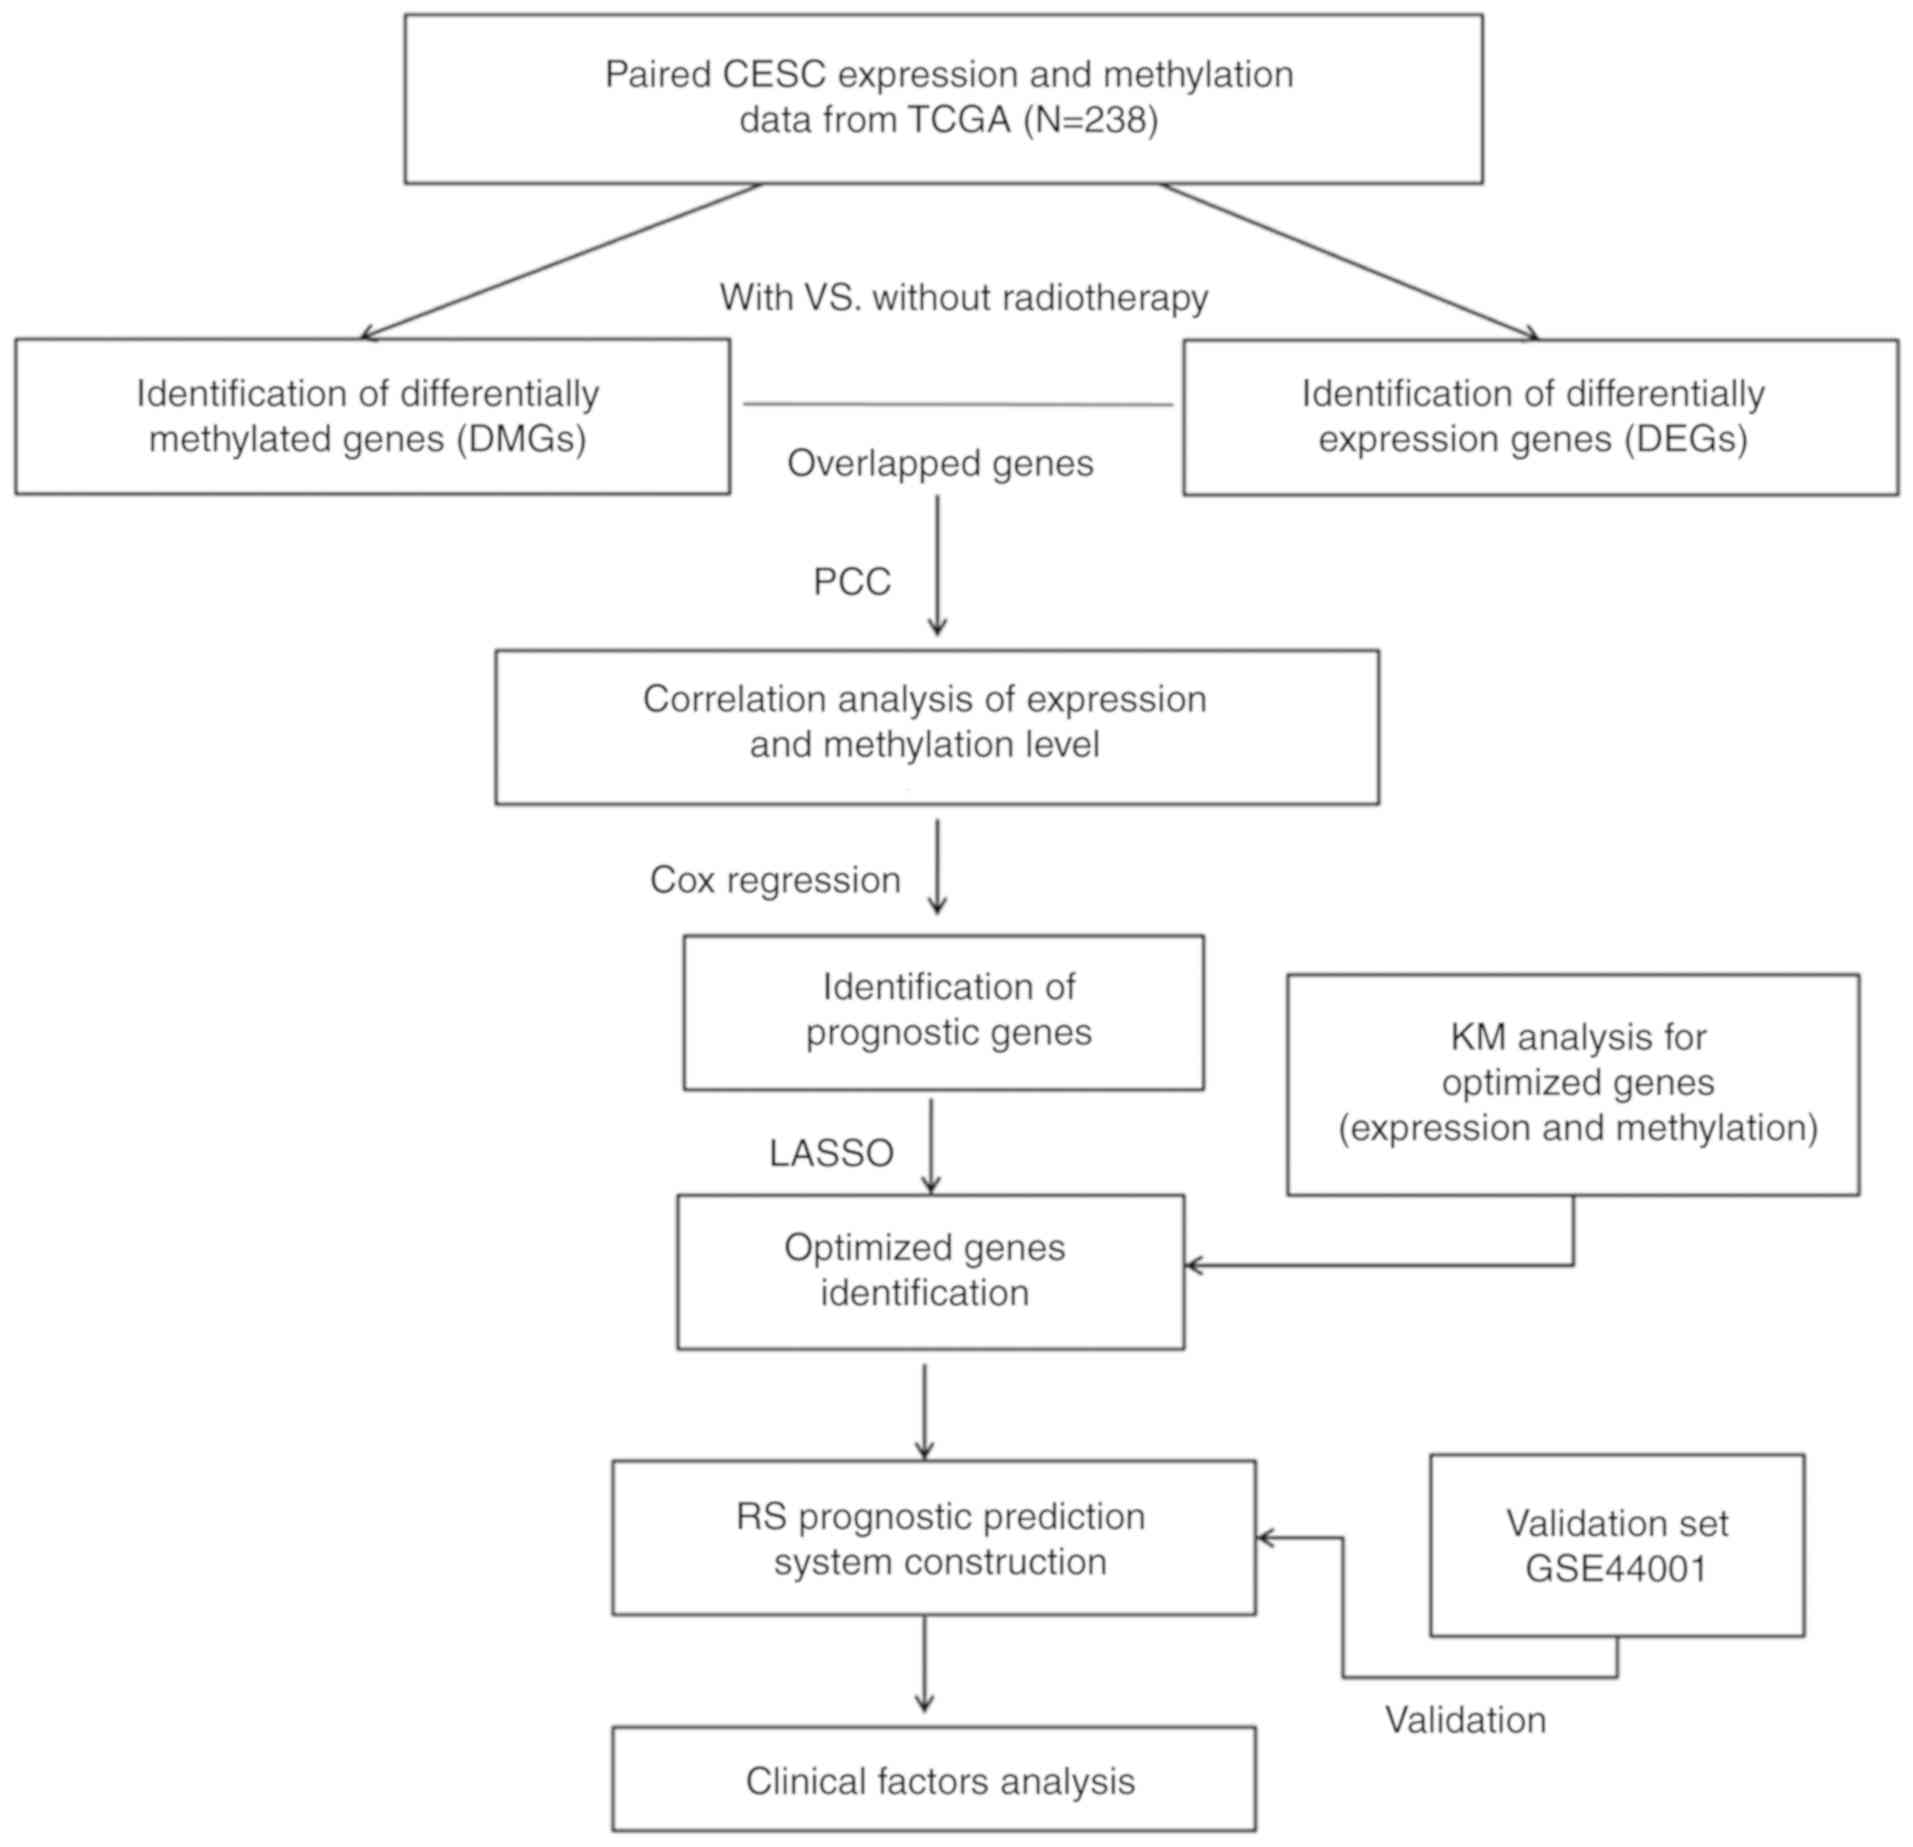
validation sets. The study design presented in Fig. 1.
Identification of differentially
expressed and methylated genes
Samples from the TCGA training set were assigned
into two groups according to radiotherapy treatment (with and
without radiotherapy). Differentially expressed genes (DEGs) and
differentially methylated genes (DMGs) between the two groups were
identified using Linear Models for Microarray Data (Limma) package
(version 3.34.7) in R (https://bioconductor.org/packages/release/bioc/html/limma.html).
A false discovery rate (FDR) <0.05 and |log2 fold
change (FC) | >0.263 (>1.2 FC) were set as the cutoffs. DEGs
with differential methylation were selected.
Correlation analysis between gene
expression and methylation level
Pearson's correlation between gene expression and
the methylation level of DEGs was calculated using Cor. Test
function (https://stat.ethz.ch/R-manual/R-devel/library/stats/html/cor.test.html)
in R. DEGs with significantly correlated expression and methylation
level (P<0.05) were included as candidate genes for subsequent
analysis.
Selection of prognostic DEGs
Univariate Cox regression analysis in survival
package of R (version 2.41.3; http://CRAN.R-project.org/package=survival) (15) was used to screen the DEGs and DMGs
associated with the prognosis of patients with CerC. P<0.05,
determined by a Kaplan-Meier log-rank test, was defined as the
significant cutoff value.
Definition and validation of
prognostic risk model
Cox's proportional hazards (Cox-PH) model based on
the L1-penalized least absolute shrinkage and selection operator
regression algorithm in the penalized package (version 0.9.50) was
used for optimizing a prediction model with a linear gene signature
(16). The optimized parameter
‘lamba’ was obtained by 1,000 rounds of cross-validated likelihood
(cvl) circular calculation. The risk score of each sample was
defined as the linear combination of prognostic gene expression
level and Cox-PH regression coefficient: Risk
score=∑coefgene × Expression (Methylation) gene.
Patients were assigned into high-risk and low-risk groups according
to the median value of risk score. The overall survival difference
between the two groups was evaluated using Kaplan-Meier and
log-rank methods in survival package of R (version 2.41.3;
http://CRAN.R-project.org/package=survival). The
GSE44001 dataset was used to validate the performance and
predictive power of the prognostic risk model. The area under the
time-independent receiver operating characteristic curve (AUC) was
used for evaluation (2).
Selection and stratification analyses
of potential clinical prognostic factors
The independent prognostic risk factors among
clinical variables in TCGA patients were selected using univariate
and multivariate Cox regression analysis in survival package of R
(https://CRAN.R-project.org/package=survival).
P<0.05, determined by a Kaplan-Meier log-rank test, was set as
the significant cutoff value. Stratification analysis was performed
for patients with and without radiotherapy, with a significant
threshold of P<0.05, as determined by a log-rank test.
Bioinformatic analysis of prognostic
DEGs
Patients within the training set were assigned into
high-risk (samples with higher risk scores than the median) and
low-risk (samples with lower risk scores than the median) groups
according to the computed risk scores. DEGs between the two groups
(FDR <0.05 and |logFC| >0.263) were identified using Limma
package in R. Hierarchical clustering analysis of DEGs was analyzed
using the Pheatmap package (version 1.0.8; http://CRAN.R-project.org/package=pheatmap) in R
(17,18). Gene Set Enrichment Analysis (GSEA)
(19,20) was performed to identify the Kyoto
Encyclopedia of Genes and Genomes (KEGG) (21) pathways significantly (P<0.05)
associated with DEGs between the two groups.
Statistical analysis
Continuous clinical variables, including age and
overall survival, are presented as the mean ± standard deviation
(SD), and differences between groups were analyzed using Student's
t-test. Differences in categorical variables, including mortality
and pathological characteristics, between two groups were analyzed
using Fisher's exact test. Univariate Cox regression analysis was
employed for the identification of independent prognostic genes,
and a two-step Cox regression analysis was used to identify
independent prognostic factors among clinical variables. In the
stratified analysis, prognostic differences between the high-risk
and low-risk patients stratification analysis were analyzed using
Kaplan-Meier survival analysis. All analyses were performed in R
(version 3.4.1; http://www.r-project.org/), and P<0.05 was
considered to indicate a statistically significantly
difference.
Results
Baseline characteristics of patients
with CerC
A total of 238 patients with CerC with paired
mRNA-seq and DNA methylation profiles from TCGA were used in the
present study. Table I describes
the baseline characteristics of the included 238 patients. A total
of 64 and 174 patients were assigned into non-radiotherapy and
radiotherapy groups, respectively. Significant differences in age
(P=3.12×10⁻²), pathologic N stage
(P=2.15×10⁻³), pathologic T stage
(P=1.90×10⁻⁵), pathologic stage
(P=9.84×10⁻⁵), new tumor incidence (recurrence;
P=2.20×10⁻¹⁶) and therapy strategy
(P=3.16×10⁻¹⁰) were observed between patients with and
without radiotherapy. There was no difference in overall survival
and survival rate between the two groups (Table I).
 | Table I.Baseline characteristics of The
Cancer Genome Atlas patients with cervical cancer treated with or
without radiotherapy. |
Table I.
Baseline characteristics of The
Cancer Genome Atlas patients with cervical cancer treated with or
without radiotherapy.
| Clinical
characteristics | Without
radiotherapy (N=64) | With radiotherapy
(N=174) | P-value |
|---|
| Age, years, mean ±
SD | 45.09±11.49 | 49.01±14.19 |
3.12×10⁻²a |
| Pathologic M
(M0/M1/NA) | 29/1/34 | 57/9/108 |
1.65×10⁻¹b |
| Pathologic N
(N0/N1/NA) | 45/7/12 | 58/35/81 |
2.15×10⁻³b |
| Pathologic T
(T1/T2/T3/T4/NA) | 47/9/0/4/4 | 62/46/17/5/44 |
1.902×10⁻⁵b |
| Pathologic stage
(I/II/III/IV/NA) | 49/8/2/4/1 | 78/47/29/16/4 |
9.842×10⁻⁵b |
| Pathologic grade
(1/2/3/4/NA) | 6/27/26/0/5 | 10/79/66/1/18 |
6.92×10⁻¹b |
| Smoking
(reformed/current/never/NA) | 7/12/38/7 | 33/43/86/12 |
2.06×10⁻²b |
| New tumor
(yes/no/-) | 51/12/1 | 31/142/1 |
2.20×10⁻¹⁶b |
| Targeted molecular
therapy (yes/no/NA) | 5/25/34 | 127/37/10 |
3.164×10⁻¹⁰b |
| Death
(dead/alive) | 15/49 | 51/123 |
4.17×10⁻¹b |
| Overall survival
months, mean ± SD | 35.11±43.03 | 38.75±38.92 |
5.54×10⁻¹a |
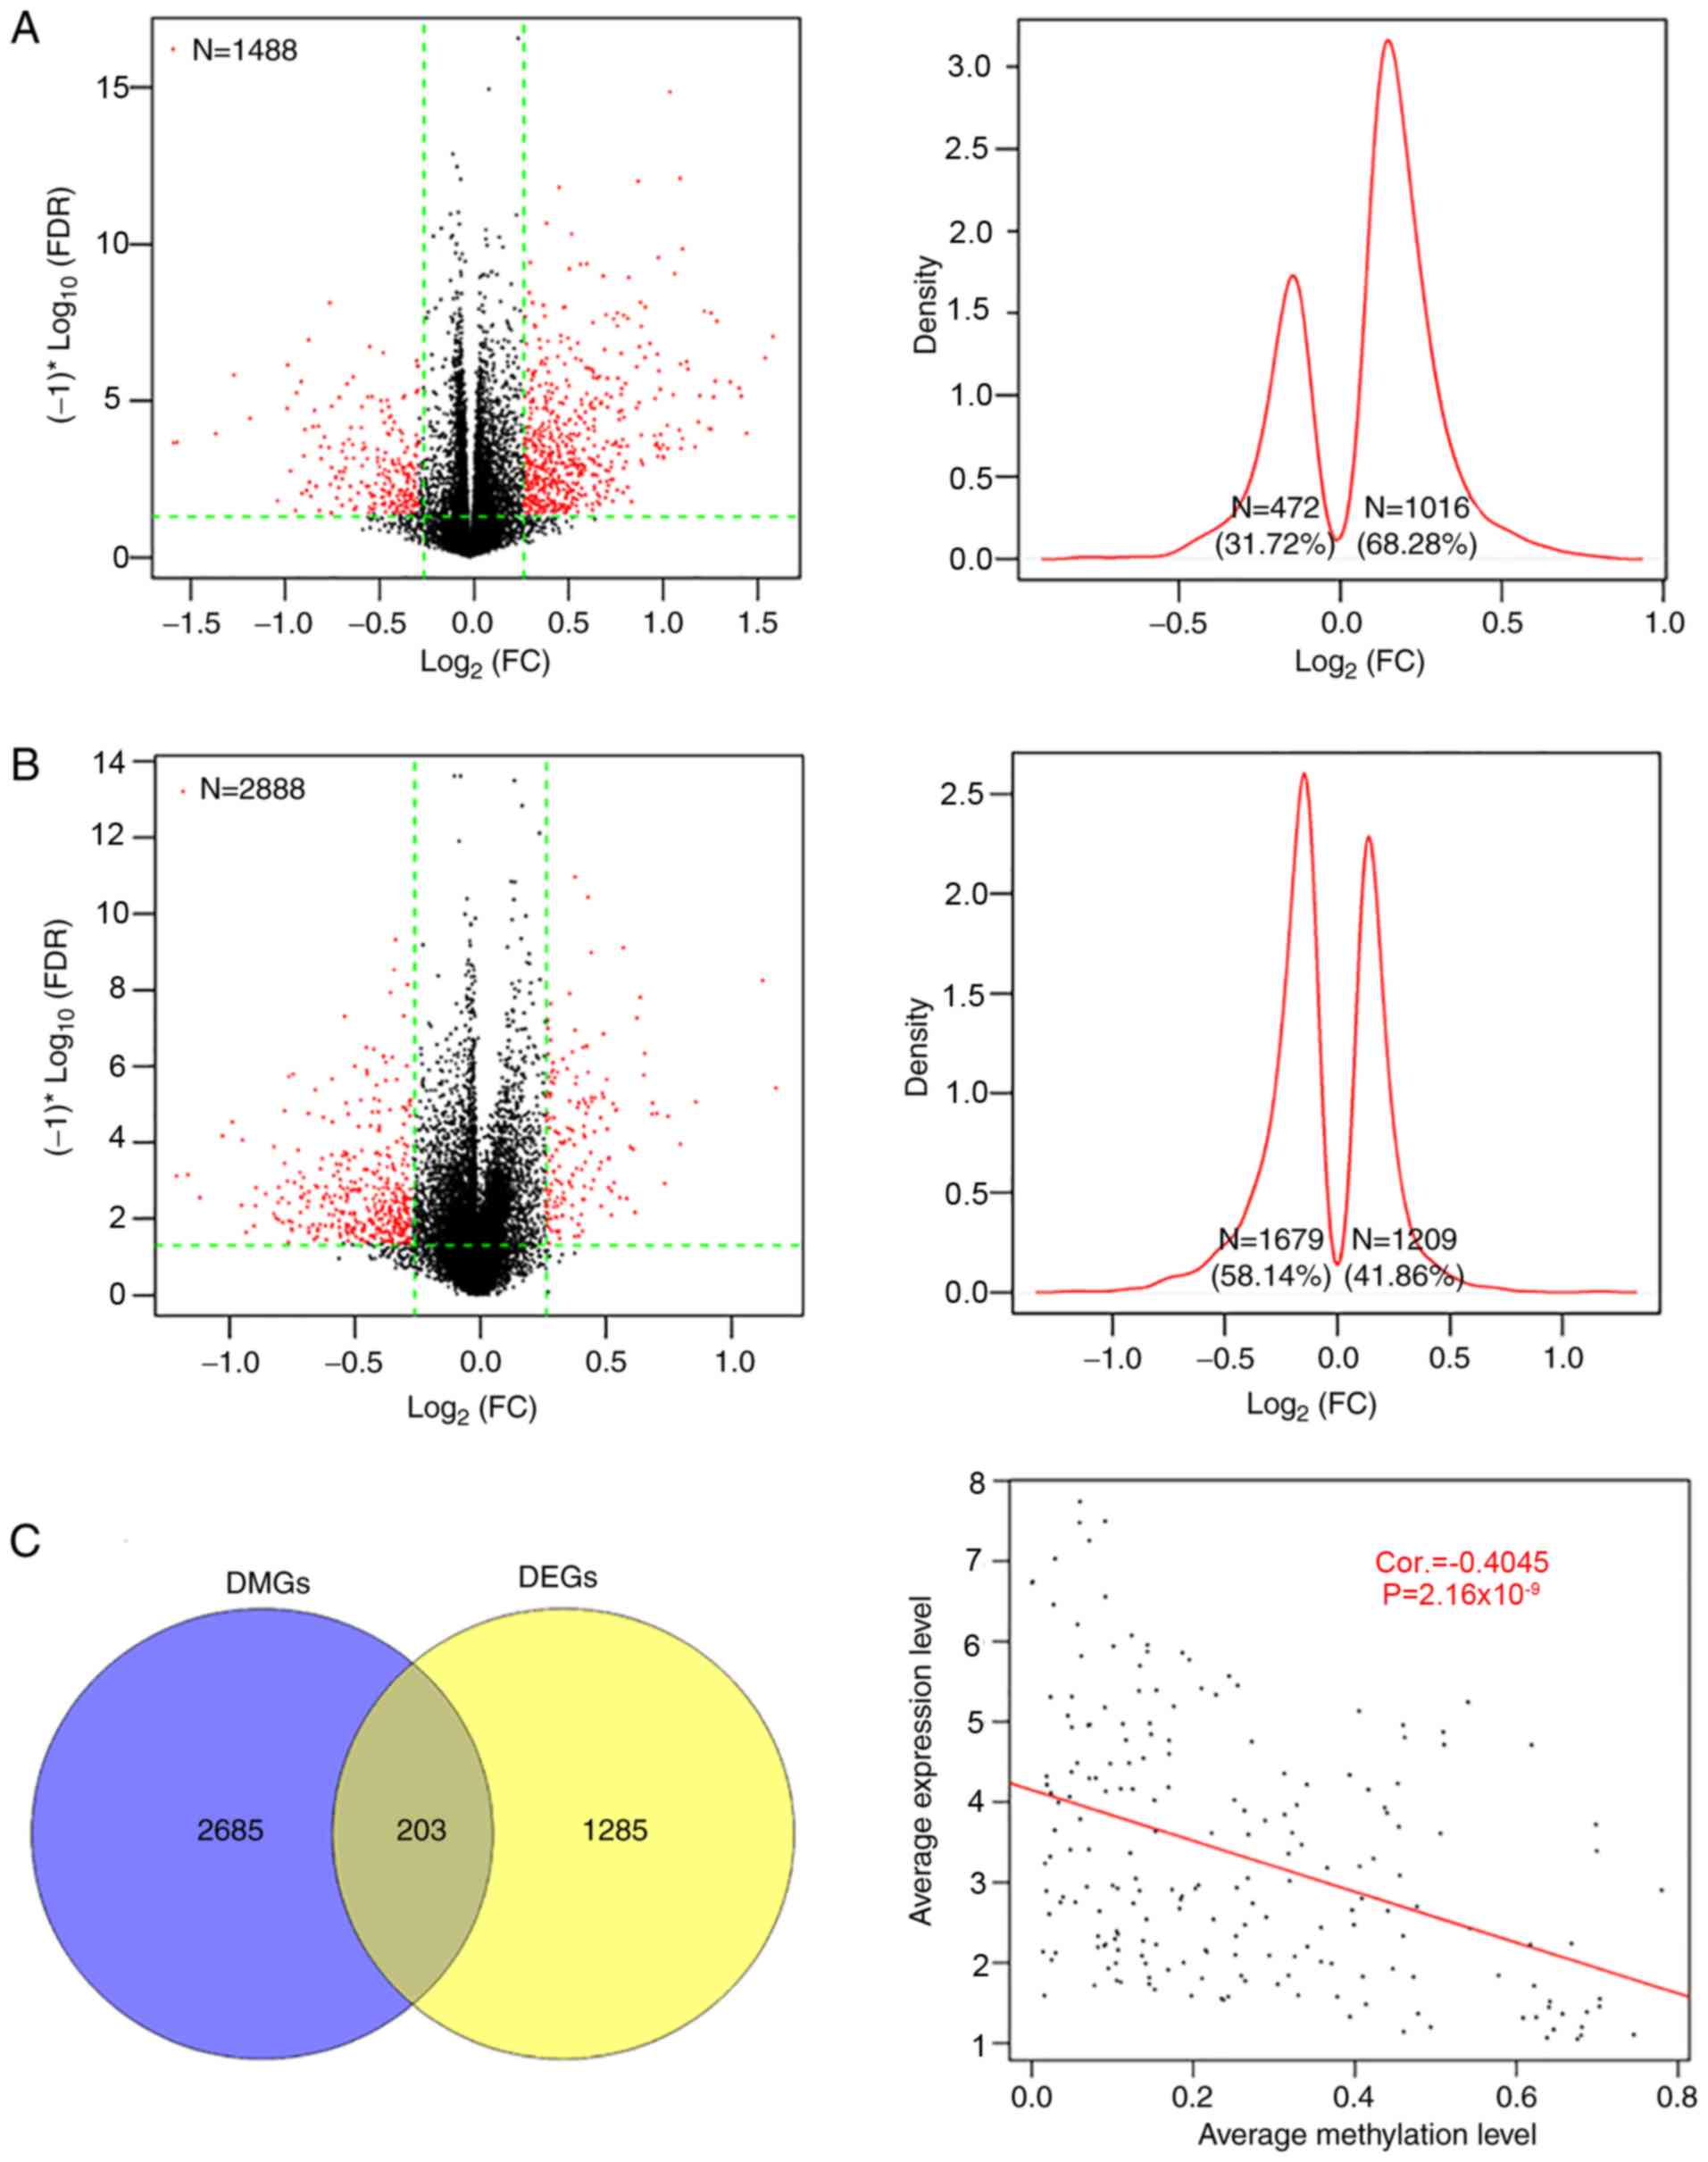
Identification of DEGs and DMGs in
patients with CerC
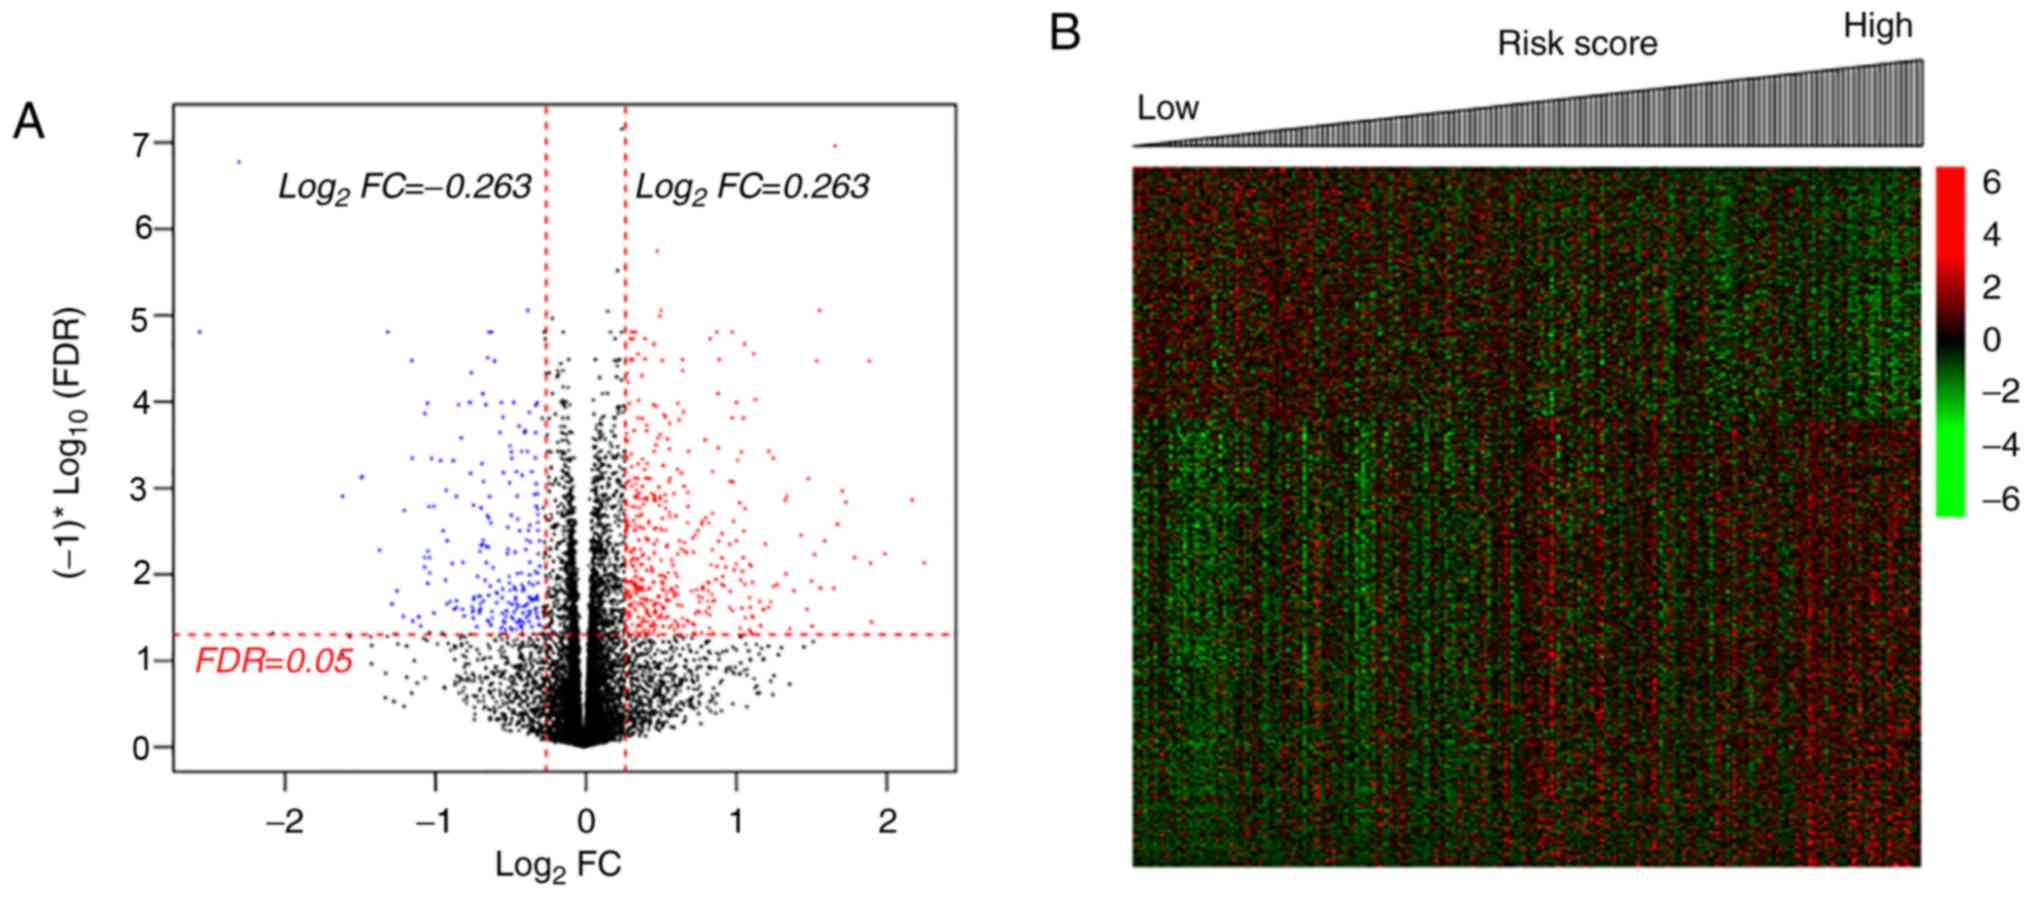
There were 1,488 DEGs and 2,888 DMGs identified
between the two groups (Fig. 2);
the majority of the DEGs (62.28%, 1,016/1,488) were upregulated and
the majority of the DMGs (58.14%, 1,679/2,888) were hypomethylated
by radiotherapy, compared with the non-radiotherapy group (Fig. 2A and B). There were 203 overlapping
genes, with an overall negative correlation between average
expression and methylation levels (Cor=−0.4045;
P=2.16×10⁻⁹; Fig. 2C).
Pearson's correlation analysis identified 107 genes (including 83
up- and 24 downregulated genes, Table
SI) with negatively correlated expression and methylation
levels.
Identification of prognostic
genes
Using univariate Cox regression analysis in the
survival package of R, a total of 25 prognostic DEGs and 21
prognostic DMGs were identified from the aforementioned 107 genes
(Table SII), including 8
overlapped genes, which were identified to be candidate genes
associated with the prognosis of patients with CerC (Fig. 3A). The optimal 8-gene matrix was
obtained using Cox-PH model (max ‘lambda’=5.8598, max
cvl=−367.5751; Fig. 3B).
The Cox-PH regression coefficients are indicated in Fig. 3C and Table II. Accordingly, 238 patients in
the training set were stratified into high-expression (n=119) and
low-expression (n=119) groups, according to the median expression
value of each gene.
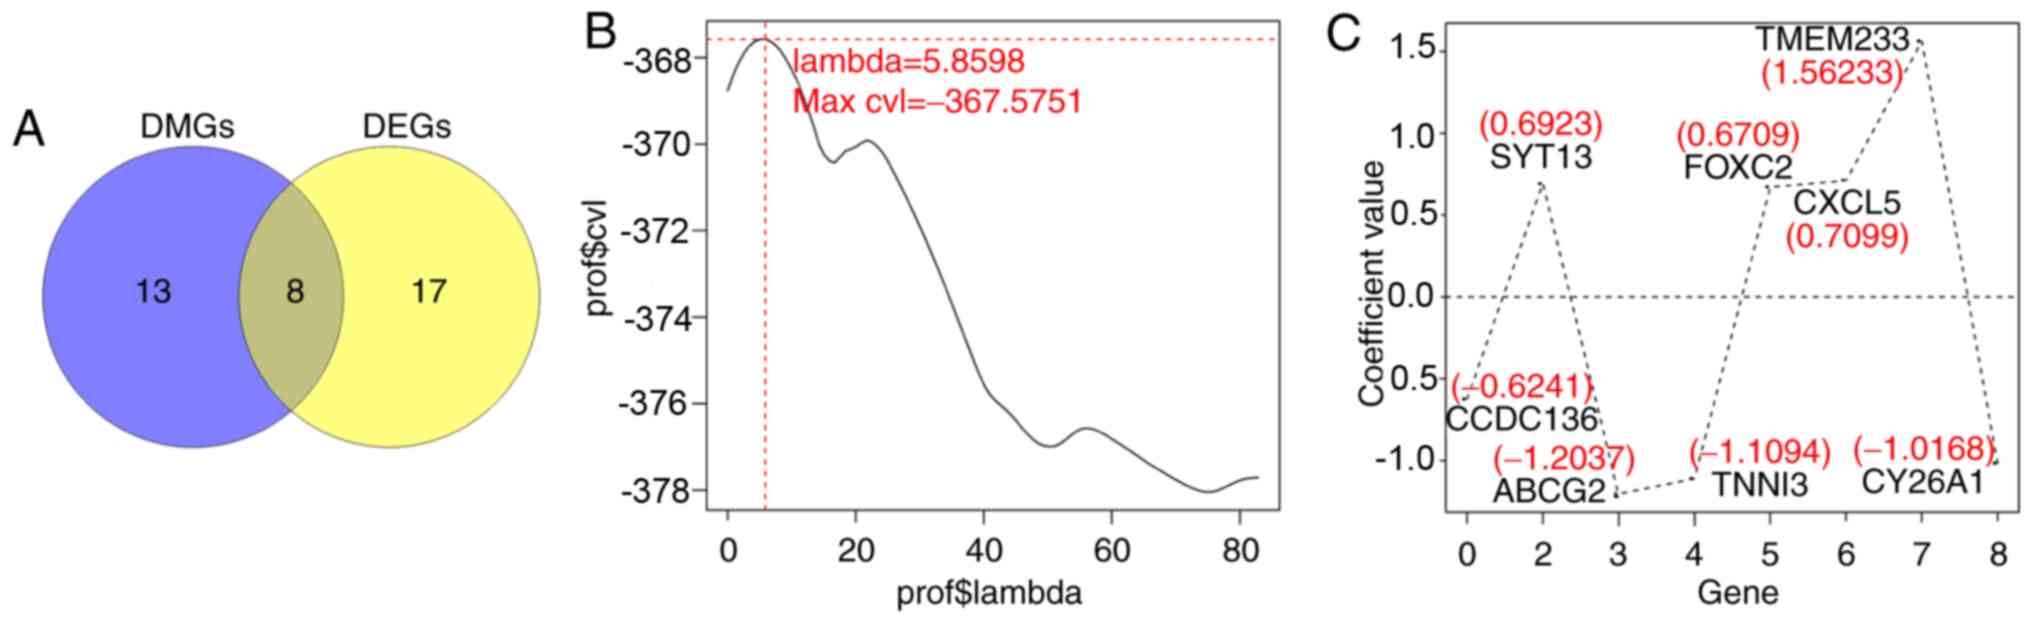 | Figure 3.Selection of optimal prognostic genes
using the Cox-PH model. (A) Venn diagram of overlapped DEGs and
DMGs, FDR <0.05 and |log2FC| >0.263. (B) The
optimal ‘lambda’ parameters by cvl circular calculation. (C) The
Cox-PH regression coefficients distribution of the 8 genes in the
optimal matrix. Cox-PH, Cox's proportional hazards; DEGs,
differentially expressed genes; DMGs, differentially methylated
genes; cvl, Cross-validation likelihood; CCDC136, coiled-coil
domain containing 136 gene; ABCG2, ATP binding cassette subfamily G
member 2 gene; SYT13, synaptotagmin XIII gene; TNNI3, cardiac
troponin I gene; FOXC2, Forkhead 1 gene; CXCL5, epithelial
neutrophil-activating peptide-78 gene; TMEM233, transmembrane
protein 233 gene; CY26A1, cytochrome P450 26A1 gene. |
| Table II.Cox's proportional hazards regression
coefficients of the 8 signature genes. |
Table II.
Cox's proportional hazards regression
coefficients of the 8 signature genes.
| Gene | Correlation
coefficient | HR (95% CI) | P-value |
|---|
| CCDC136 | −0.6241 | 0.917
(0.758–0.991) |
2.71×10⁻² |
| ABCG2 | −1.2037 | 0.847
(0.699–0.925) |
4.76×10⁻² |
| CYP26A1 | −1.0168 | 0.889
(0.786–0.998) |
6.00×10⁻³ |
| TNNI3 | −1.1094 | 0.881
(0.799–0.971) |
4.87×10⁻² |
| SYT13 |
0.6923 | 1.076
(1.008–1.168) |
4.52×10⁻² |
| FOXC2 |
0.6709 | 1.066
(1.056–1.189) |
2.12×10⁻³ |
| CXCL5 |
0.7099 | 1.075
(1.006–1.160) |
2.48×10⁻³ |
| TMEM233 |
1.5623 | 1.234
(1.007–1.526) |
2.61×10⁻⁴ |
Subsequent Kaplan-Meier survival analyses
demonstrated that the expression of coiled-coil domain containing
136 gene (CCDC136), ATP binding cassette subfamily G member
2 gene (ABCG2), cardiac troponin I gene (TNNI3) and
Cytochrome P450 26A1 gene (CYP26A1) were positively
associated with survival of patients with CerC, whereas the
expression of Synaptotagmin XIII gene (SYT13), Forkhead 1
gene (FOXC2), epithelial neutrophil-activating peptide-78
gene (CXCL5) and transmembrane protein 233 gene
(TMEM233) were negatively correlated (log-rank test;
P<0.05; Fig. 4A; Table II). For methylation levels,
analysis indicated the hypermethylation of CCDC136, ABCG2,
TNNI3, and CYP26A1 genes, and the hypomethylation of
SYT13, FOXC2, CXCL5, and TMEM233 genes was associated
with the poor survival of patients with CerC (P<0.05, log-rank
test; Fig. 4B). These data
demonstrated that the expression and methylation levels of these 8
genes were potential independent risk factors for prognosis in
patients with CerC.
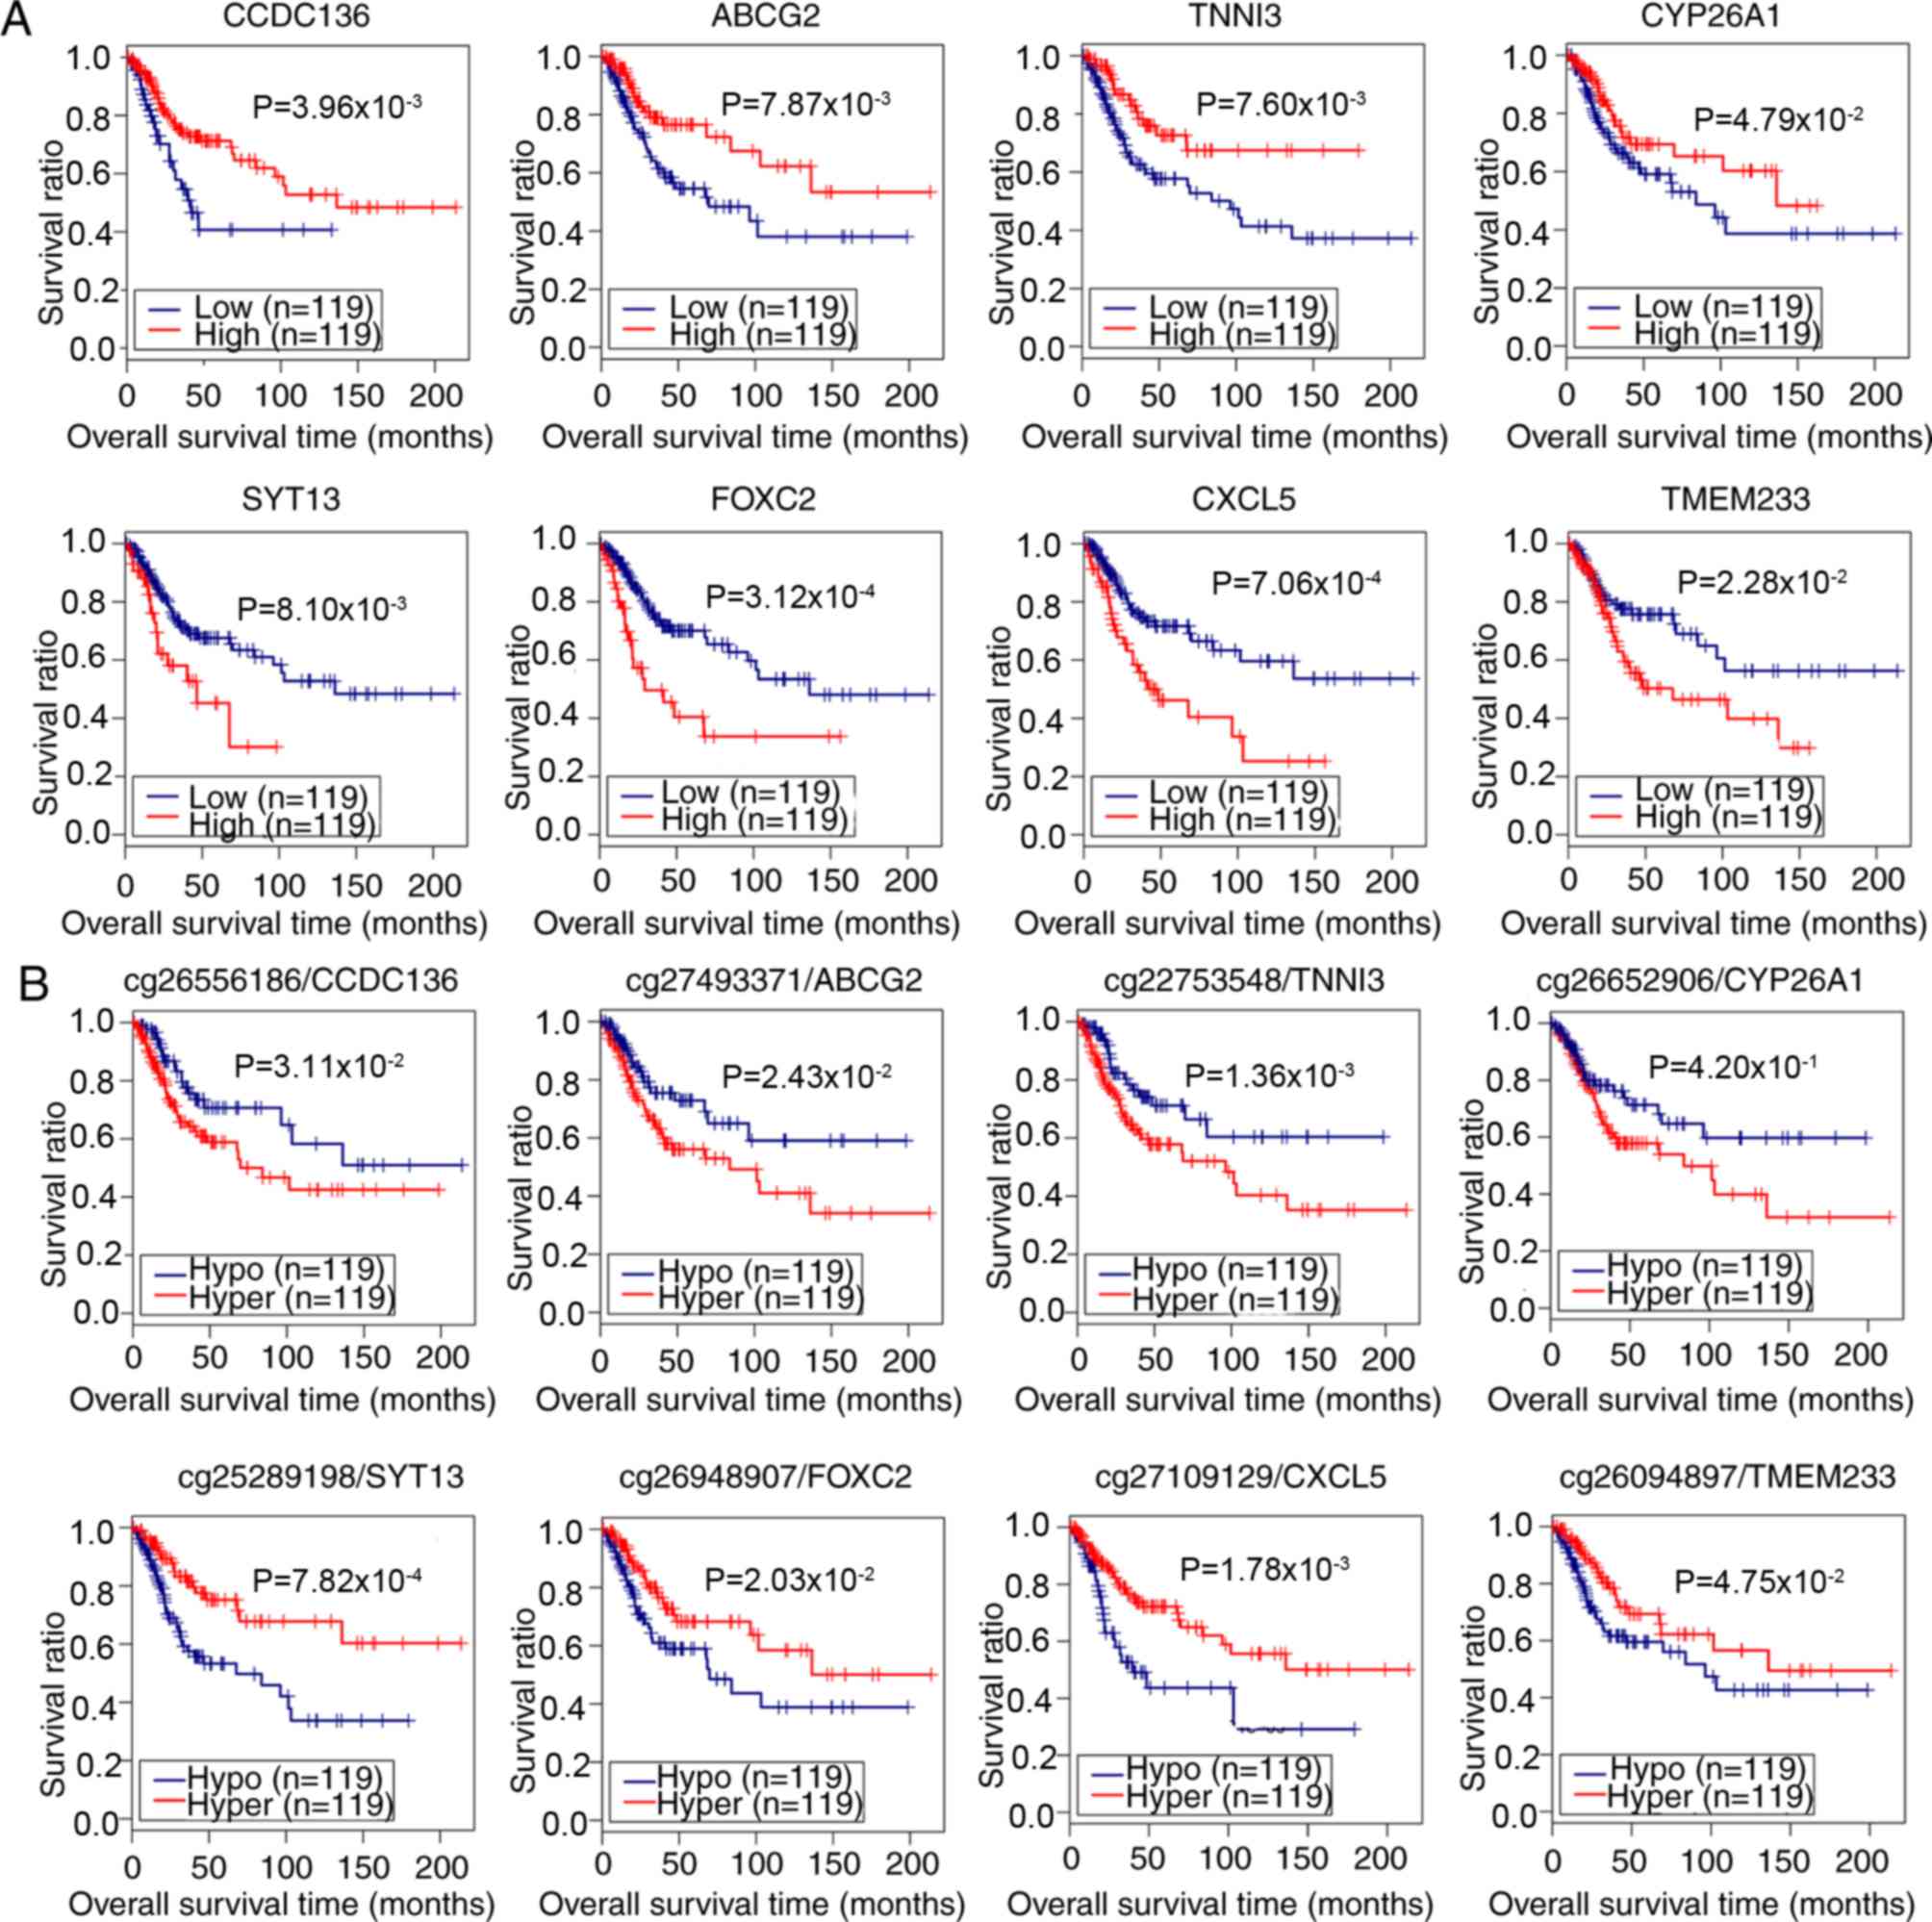 | Figure 4.Correlation analysis of the
expression and methylation levels of 8 potential prognostic genes
with survival of patients with CerC. (A) Correlation between the
expression of 8 genes and the prognosis of patients with CerC. Red
and blue lines indicate high and low expression levels,
respectively. (B) Correlation between the DNA methylation level and
prognosis of patients with CerC. The number prior to the gene
symbols indicates the methylation loci. Red and blue lines denote
hyper- and hypomethylation, respectively. Correlation analysis was
performed using Kaplan-Meier survival analysis. CCDC136,
coiled-coil domain containing 136 gene; ABCG2, ATP binding cassette
subfamily G member 2 gene; SYT13, synaptotagmin XIII gene; TNNI3,
cardiac troponin I gene; FOXC2, Forkhead 1 gene; CXCL5, epithelial
neutrophil-activating peptide-78 gene; TMEM233, transmembrane
protein 233 gene; CY26A1, cytochrome P450 26A1 gene; CerC, cervical
cancer. |
Establishment and evaluation of the
risk model
The mRNA prognostic model based on the combination
of Cox-PH regression coefficients and gene expression levels was
established as: Risk score=(−0.6241) ×
ExpCCDC136+ (−1.2037) ×
ExpABCG2 + (−1.0168) ×
ExpCYP26A1+ (−1.1094) ×
ExpTNNI3+ (0.6923) × ExpSYT13 +
(0.6709) × ExpFOXC2+ (0.7099) ×
ExpCXCL5 + (1.5623) ×
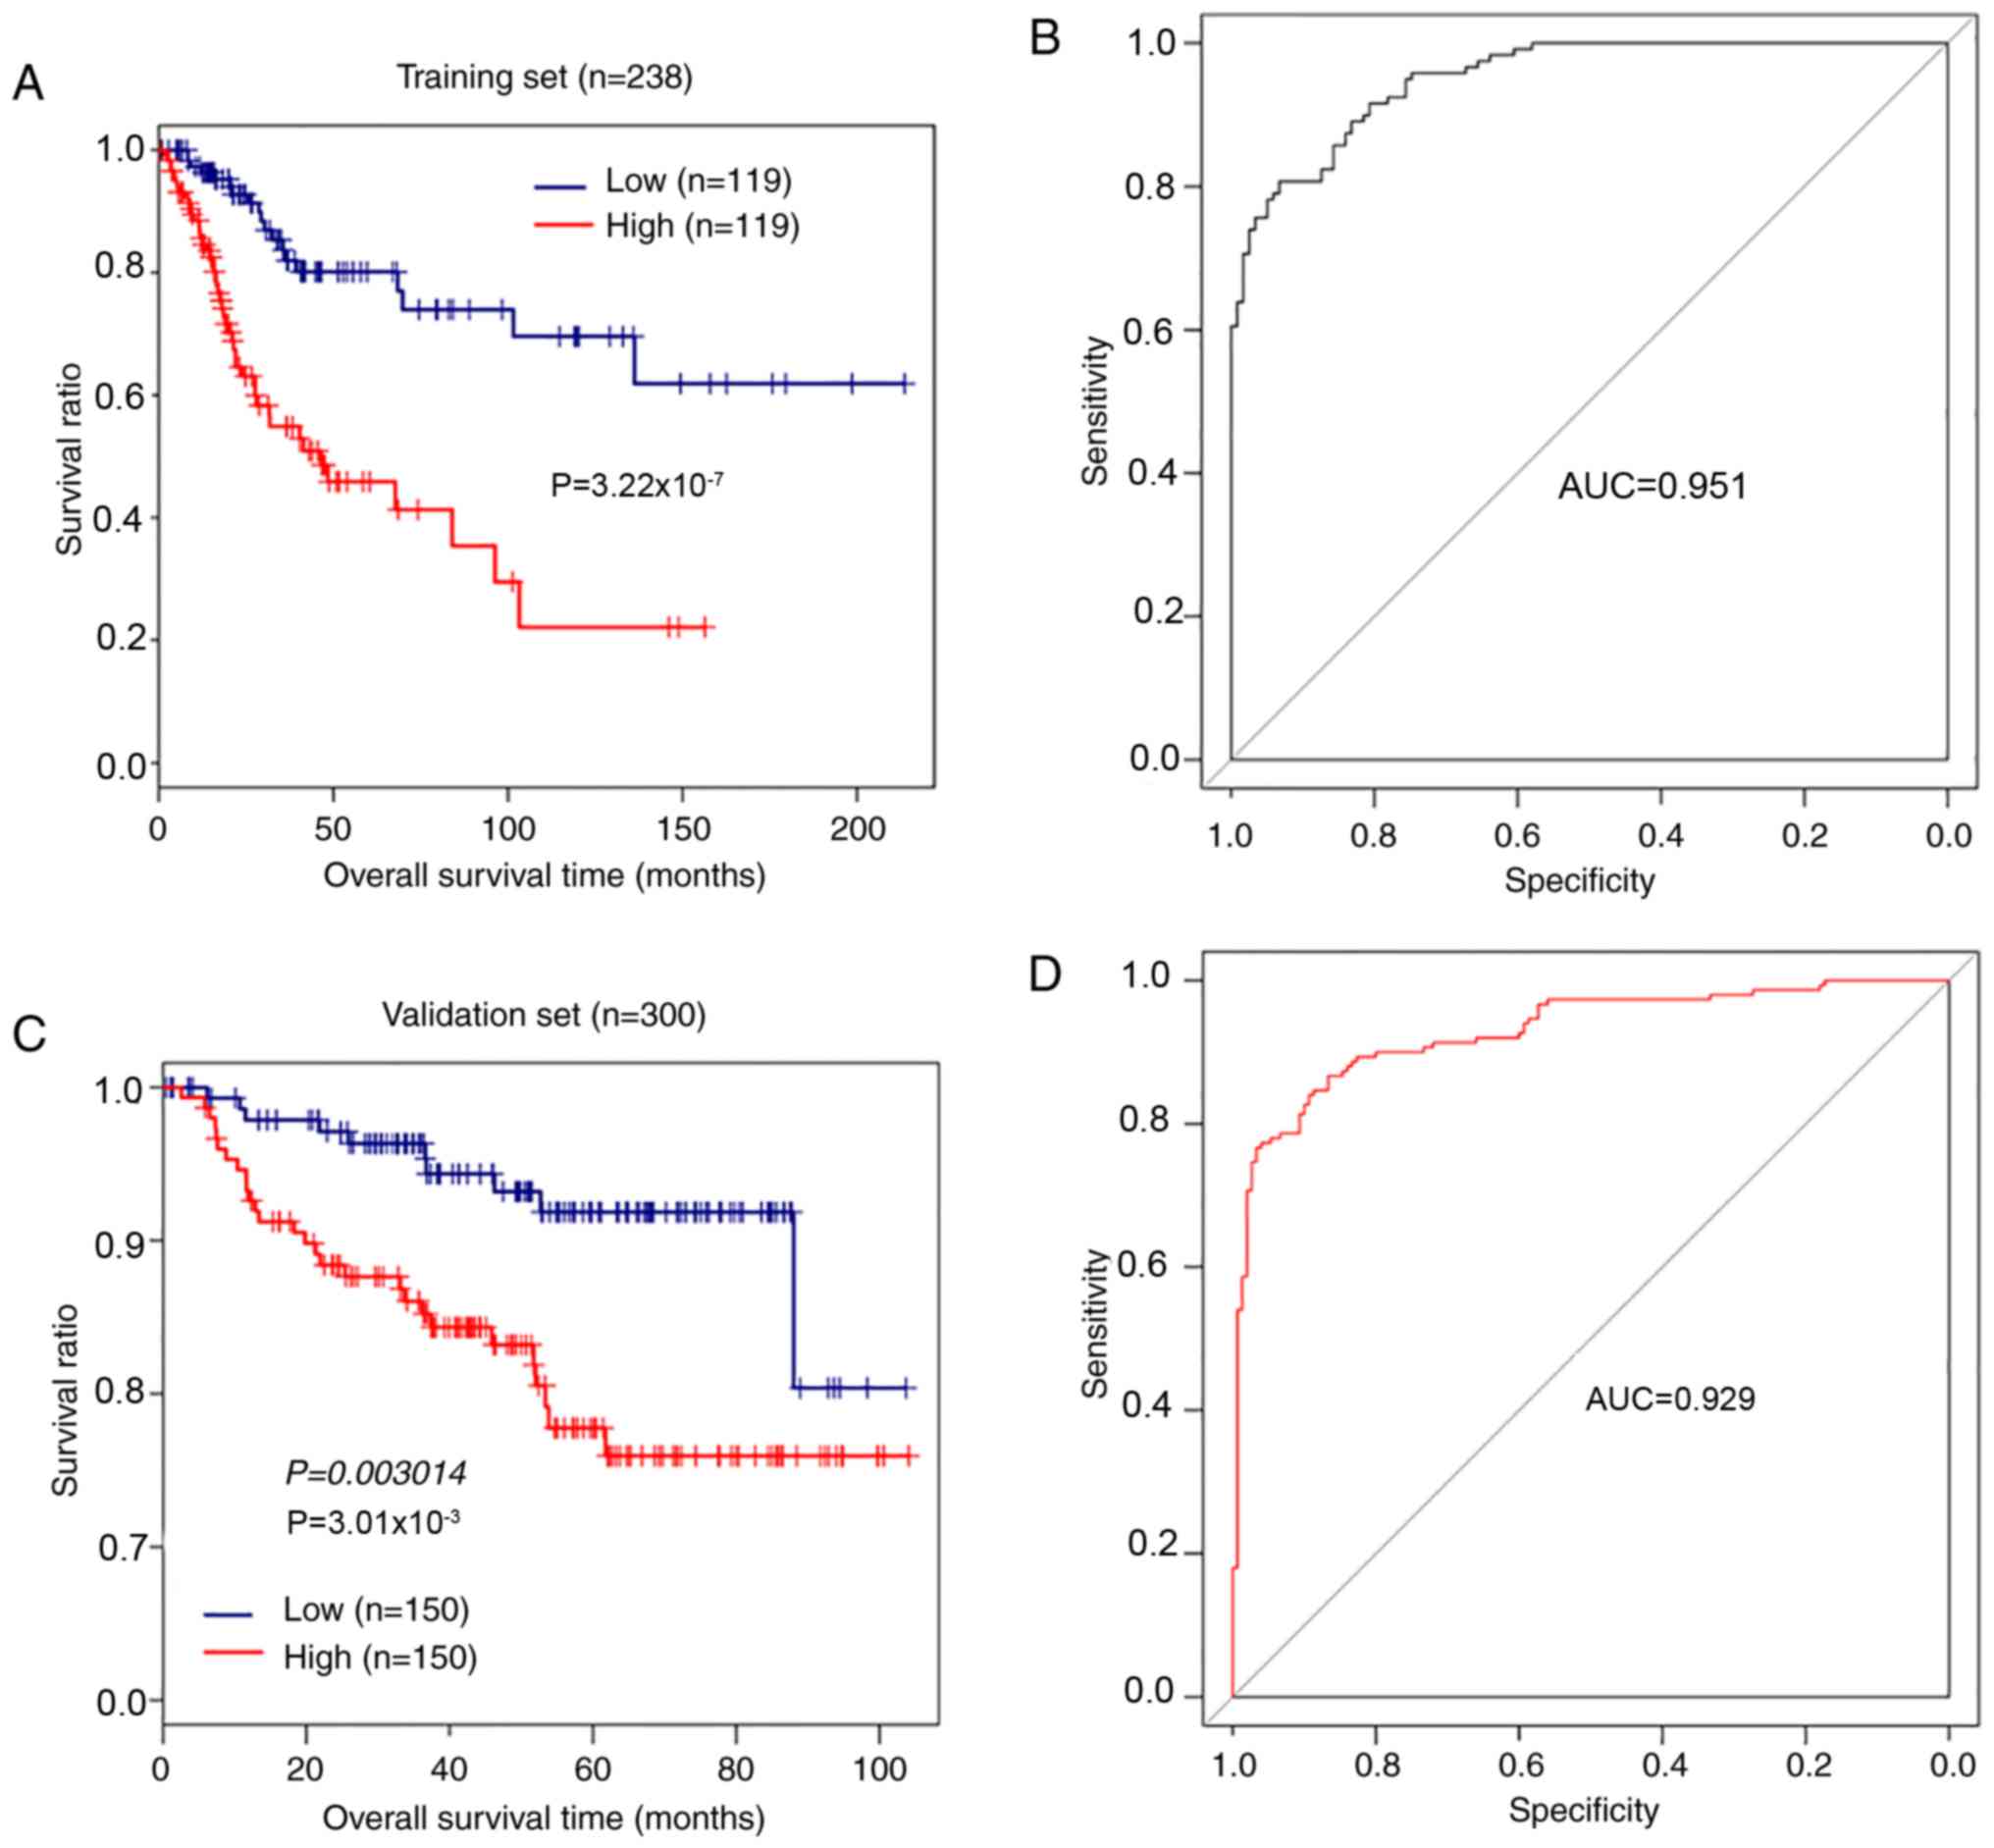
ExpTMEM233. According to the median risk score,
238 patients with CerC in the training set were assigned into
high-risk and low-risk groups. Kaplan-Meier survival analysis
indicated that patients with low-risk scores exhibited longer
overall survival compared with patients with high-risk scores
(P=3.22×10⁻⁷, log-rank test; Fig. 5A). The AUC was 0.951 (Fig. 5B). Analysis of the validation set
GSE44001 demonstrated that patients with CerC with high-risk scores
exhibited significantly shorter overall survival times compared
with patients with low-risk scores (P=3.01×10⁻³,
log-rank test; Fig. 5C), and the
AUC was 0.929 (Fig. 5D). These
results demonstrated that the 8-gene signature had performance and
predictive power for outcomes of patients with CerC.
Prognostic value of clinical
variables
A two-step Cox regression analyses (univariate and
multivariate) were used to define the potential prognostic values
of clinical variables, including age, pathologic stage and grade,
smoking, radiotherapy, recurrence and risk status, in patients from
the TCGA data. Table III
demonstrates that 3 independent risk factors, including pathologic
stage [hazard ratio (HR)=2.386; 95% confidence interval (CI),
1.097–5.192; P=0.0284), new tumor (recurrence; HR=7.333; 95% CI,
1.833–12.235; P=3.21×10⁻⁹) and risk status (HR=1.359;
95% CI, 1.702–8.905; P=1.28×10⁻³) were of prognostic
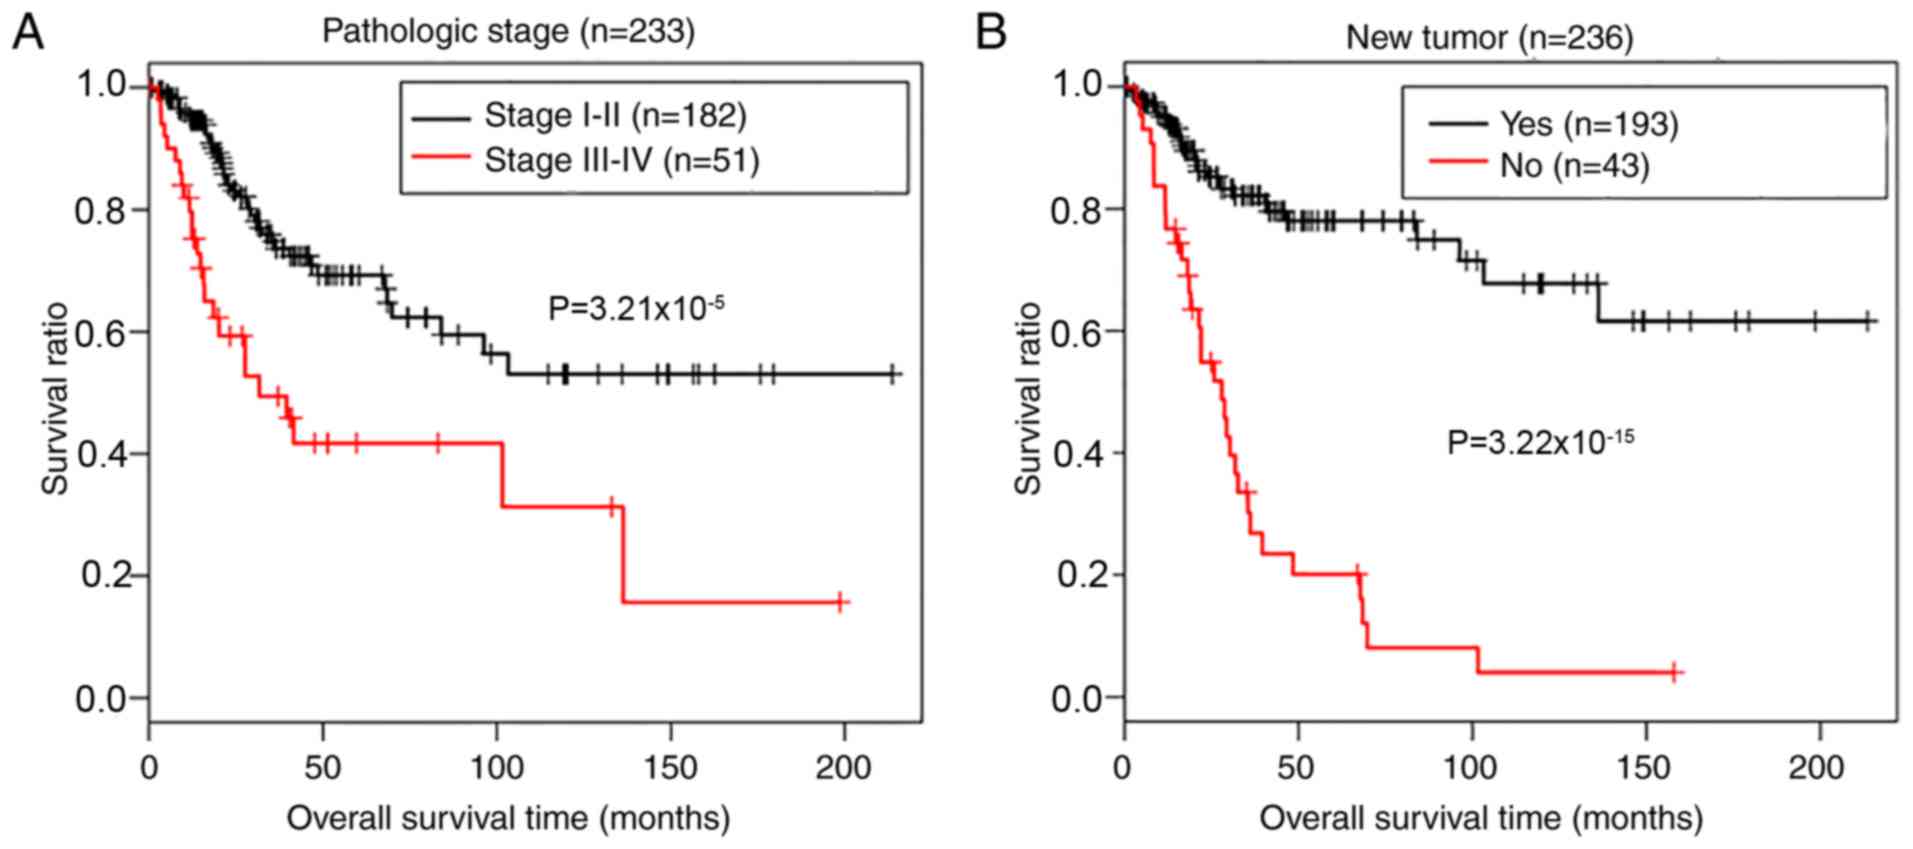
value for the outcomes of patients with CerC. Kaplan-Meier survival
analysis determined the prognostic potential of pathologic stage
and tumor recurrence. As presented in Fig. 6, there was a significantly shorter
overall survival time in patients with advanced (III–IV)
pathological stages (P=3.21×10⁻⁵, log-rank test;
Fig. 6A) and recurrence
(P=9.22×10⁻¹⁵, log-rank test; Fig. 6B), compared with patients in early
stage disease without recurrence.
| Table III.Cox regression analyses for the
prognostic value of clinical variables. |
Table III.
Cox regression analyses for the
prognostic value of clinical variables.
|
| Univariate
analysis | Multivariate
analysis |
|---|
|
|
|
|
|---|
| Variables | HR (95% CI) | P-value | HR (95% CI) | P-value |
|---|
| Age
(≤45/>45) | 1.014
(0.996–1.032) | 0.138 | – | – |
| Pathologic M
(M0/M1) | 4.101
(1.356–12.41) | 0.0677 | – | – |
| Pathologic N
(N0/N1) | 2.923
(1.440–5.932) |
1.86×10⁻³ | 1.535
(0.711–3.315) |
2.76×10⁻¹ |
| Pathologic T
(T1/T2/T3/T4) | 1.986
(1.473–2.678) |
2.69×10⁻⁶ | 1.900
(0.986–3.662) |
5.51×10⁻² |
| Pathologic stage
(I/II/III/IV) | 1.594
(1.277–1.989) |
2.20×10⁻⁵ | 2.386
(1.097–5.192) |
2.84×10⁻² |
| Pathologic grade
(1/2/3/4) | 0.943
(0.612–1.452) |
7.89×10⁻¹ | – | – |
| Smoking
(reformed/current/never) | 0.984
(0.719–1.346) |
9.18×10⁻¹ | – | – |
| New tumor
(yes/no) | 5.637
(3.446–9.22) |
9.22×10⁻¹⁵ | 7.33
(1.833–12.235) |
3.22×10⁻⁹ |
| Targeted molecular
therapy (yes/no) | 0.953
(0.547–1.659) |
8.64×10⁻¹ | – | – |
| Risk status
(high/low) | 3.736
(2.177–6.411) |
3.22×10⁻⁷ | 1.359
(1.702–8.905) |
1.28×10⁻³ |
Stratification analysis for risk
factors associated with radiotherapy
To additionally confirm the risk factors associated
with radiotherapy, stratified analysis for patients with
radiotherapy and without radiotherapy was performed. A two-step Cox
regression analyses indicated that pathologic N stage (HR=4.247;
95% CI, 1.3651–6.216; P=1.25×10⁻²), pathologic stage
(HR=2.275; 95% CI, 1.052–3.868; P=4.53×10⁻²), recurrence
(HR=3.841; 95% CI, 1.332–5.122; P=2.27×10⁻⁵) and risk
status (HR=5.110; 95% CI, 1.578–6.547; P=6.51×10⁻³) were
risk factors for radiotherapy-treated patients, whereas recurrence
(HR=4.665; 95% CI, 2.367–9.463; P=1.58×10⁻³) and risk
status (HR=7.546; 95% CI, 1.177–8.364; P=3.30×10⁻²) were
risk factors for patients treated without radiotherapy (Table IV). These results demonstrated
that recurrence and 8-gene signature risk status were independent
risk factors for predicting the prognosis of patients with
CerC.
| Table IV.Stratification analysis for risk
factors associated with radiotherapy in patients from The Cancer
Genome Atlas training set. |
Table IV.
Stratification analysis for risk
factors associated with radiotherapy in patients from The Cancer
Genome Atlas training set.
|
| Univariate
analysis | Multivariate
analysis |
|---|
|
|
|
|
|---|
| Variables | HR | 95% CI | P-value | HR | 95% CI | P-value |
|---|
| With radiotherapy
(n=174) |
|
|
|
|
|
|
| Age
(≤45/>45) | 1.006 | 0.986–1.026 |
5.48×10⁻¹ | – | – | – |
| Pathologic M
(M0/M1) | 5.457 | 1.436–10.73 |
5.13×10⁻² | – | – | – |
| Pathologic N
(N0/N1) | 4.651 | 1.769–12.23 |
6.31×10⁻⁴ | 4.247 | 1.3651–6.216 |
1.25×10⁻² |
| Pathologic T
(T1/T2/T3/T4) | 1.652 | 1.135–2.407 |
7.65×10⁻³ | 1.564 | 0.7868–3.107 |
2.02×10⁻¹ |
| Pathologic stage
(I/II/III/IV) | 2.320 | 1.327–4.056 |
2.36×10⁻³ | 2.275 | 1.052–3.868 |
4.53×10⁻² |
| Pathologic grade
(1/2/3/4) | 0.878 | 0.540–1.428 |
6.01×10⁻¹ | – | – | – |
| Smoking
(reformed/current/never) | 0.998 | 0.705–1.415 |
9.95×10⁻¹ | – | – | – |
| New tumor
(yes/no) | 5.191 | 2.986–9.026 |
7.89×10⁻¹¹ | 3.841 | 1.332–5.122 |
2.27×10⁻⁵ |
| Targeted molecular
therapy (yes/no) | 1.06 | 0.539–2.081 |
.66×10−1 | – | – | – |
| Risk status
(high/low) | 3.198 | 1.762–5.804 |
5.51×10⁻⁵ | 5.11 | 1.578–6.547 |
6.51×10⁻³ |
| Without
radiotherapy (n=64) |
|
|
|
|
|
|
| Age
(≤45/>45) | 1.051 | 1.004–1.1 |
3.13×10⁻² | 1.031 | 0.977–1.089 |
2.67×10⁻¹ |
| Pathologic M
(M0/M1) | – | – | – | – | – | – |
| Pathologic N
(N0/N1) | 1.348 | 0.287–2.337 |
7.05×10⁻¹ | – | – | – |
| Pathologic T
(T1/T2/T3/T4) | 3.638 | 1.999–6.623 |
2.29×10⁻⁹ | 1.187 | 0.122–1.598 |
8.83×10⁻¹ |
| Pathologic stage
(I/II/III/IV) | 2.462 | 1.281–3.148 |
4.53×10⁻⁵ | 2.655 | 1.243–4.007 |
4.05×10⁻¹ |
| Pathologic grade
(1/2/3/4) | 1.192 | 0.438–3.245 |
7.31×10⁻¹ | – | – | – |
| Smoking
(reformed/current/never) | 0.863 | 0.395–1.882 |
7.10×10⁻¹ | – | – | – |
| New tumor
(yes/no) | 7.802 | 2.53–14.06 |
2.52×10⁻⁵ | 4.665 | 2.367–9.463 |
1.58×10⁻³ |
| Targeted molecular
therapy (yes/no) | 1.408 | 0.998–2.181 |
2.77×10⁻¹ | – | – | – |
| Risk status
(high/low) | 6.762 | 1.804–10.35 |
1.40×10⁻³ | 7.546 | 1.177–8.364 |
3.30×10⁻² |
Identification of DEGs and KEGG
pathways associated with risk status of patients with CerC
To define the gene profiles between patients with
high and low risk status, 490 DEGs were identified (Table SIII) in the high-risk group,
compared with the low-risk group (Fig.
7A), including 313 upregulated DEGs (63.88%, including
CXCL5, SYT13, FOXC2, ITGB3 and TMEM233) and 177
downregulated DEGs (36.18%, including CYP26A1 and
TNNI3) in the high-risk group. Fig. 7B demonstrates the markedly altered
expression profiles of these DEGs in patients with low and high
risk scores. GSEA KEGG pathway analysis indicated that these genes
(including CYP26A1 and CXCL5) were associated with
pathways including ‘ECM Receptor Interaction’, ‘Retinol
Metabolism’, ‘Focal Adhesion’, ‘Hedgehog Signaling Pathway’,
‘NOD-like Receptor Signaling Pathway’ and ‘Chemokine Signaling
Pathway’ (Table V).
| Table V.Gene Set Enrichment Analysis of the
KEGG pathways associated with differentially expressed genes
between patients with cervical cancer with high- and low-risk
scores. |
Table V.
Gene Set Enrichment Analysis of the
KEGG pathways associated with differentially expressed genes
between patients with cervical cancer with high- and low-risk
scores.
| KEGG term | ES | NES | NOM P-value | Gene |
|---|
| ECM receptor
interaction | 0.7695 | 1.2517 |
1.88×10⁻² | LAMA1, COL11A1,
ITGB3, IBSP |
| Retinol
Metabolism | −0.8045 | −1.2455 |
2.05×10⁻² | ADH7, CYP26A1,
CYP26C1, UGT2A1 |
| Focal adhesion | 0.6963 | 1.2640 |
2.14×10⁻² | LAMA1, COL11A1,
ITGB3 |
| Hedgehog signaling
pathway | −0.7371 | −1.2183 |
2.34×10⁻² | WNT3A, BMP7 |
| NOD-like receptor
signaling pathway | 0.7413 | 1.1071 |
3.98×10⁻² | CXCL2, IL6,
IL1B |
| Chemokine signaling
pathway | 0.5071 | 0.9989 |
4.72×10⁻² | CXCL2, CXCL6,
ADCY1, CXCL3, CXCL5 |
Discussion
Identification of molecular biomarkers associated
with radiotherapy may aid in devising strategies for improving
radiotherapy response (22). In
the present study, a large-scale analysis of RNA-seq from TCGA CerC
samples, in combination with matched DNA methylation profiles, was
performed, and an 8-gene risk model was identified (CCDC136,
ABCG2, CYP26A1, TNNI3, CXCL5, SYT13 FOXC2, ITGB3, and
TMEM233) to predict the risk status of patients with CerC.
This 8-gene signature was defined to be an independent prognostic
factor, with predictive power for prognosis of patients with CerC.
Among these 8 genes, 4 hypermethylated genes (CCDC136, ABCG2,
CYP26A1 and TNNI3) were positively associated the
overall survival of patients with CerC, and 4 hypomethylated genes
(SYT13, FOXC2, CXCL5 and TMEM233) were negatively
associated the overall survival of patients with CerC.
The 4 hypermethylated genes (CCDC136, ABCG2,
CYP26A1 and TNNI3) had previously been identified to be
dysregulated in various human cancer tissues (23–26).
Among these, TNNI3 is an angiogenesis inhibitor responsible for the
inhibition of endothelial cell tube formation (27,28).
Kern et al (28) suggested
that metastasis was decreased in a mouse model of pancreatic cancer
in response to troponin I treatment, compared with control mice.
Downregulated troponin I inhibits cancer cell proliferation, as it
is required for tumor growth (29). CCDC136, also known as
nasopharyngeal carcinoma-associated gene 6, is located at
chromosome 7q31-32. It is commonly deleted in a number of types of
malignant human cancer, and has been recognized to function as a
putative tumor suppressor in gastric tumor and nasopharyngeal
carcinoma (23,30). Wei et al (30) suggested that CCDC136
negatively regulated the Wnt/β-catenin signaling pathway in
zebrafish embryos. Wnt/β-catenin signaling is oncogenic and confers
cancer cell proliferation, drug resistance and metastasis in
various types of human cancer, including ovarian cancer and CerC
(31–34) (Fig.
8). In the present study, it was identified that CCDC136
and TNNI3 were upregulated in the radiotherapy group,
compared with the non-radiotherapy group. This may be associated
with the decreased angiogenesis and downregulated Wnt/β-catenin
signaling in patients treated with radiotherapy, which in turn is
associated with the lower recurrence and improved prognosis
observed in the radiotherapy group.
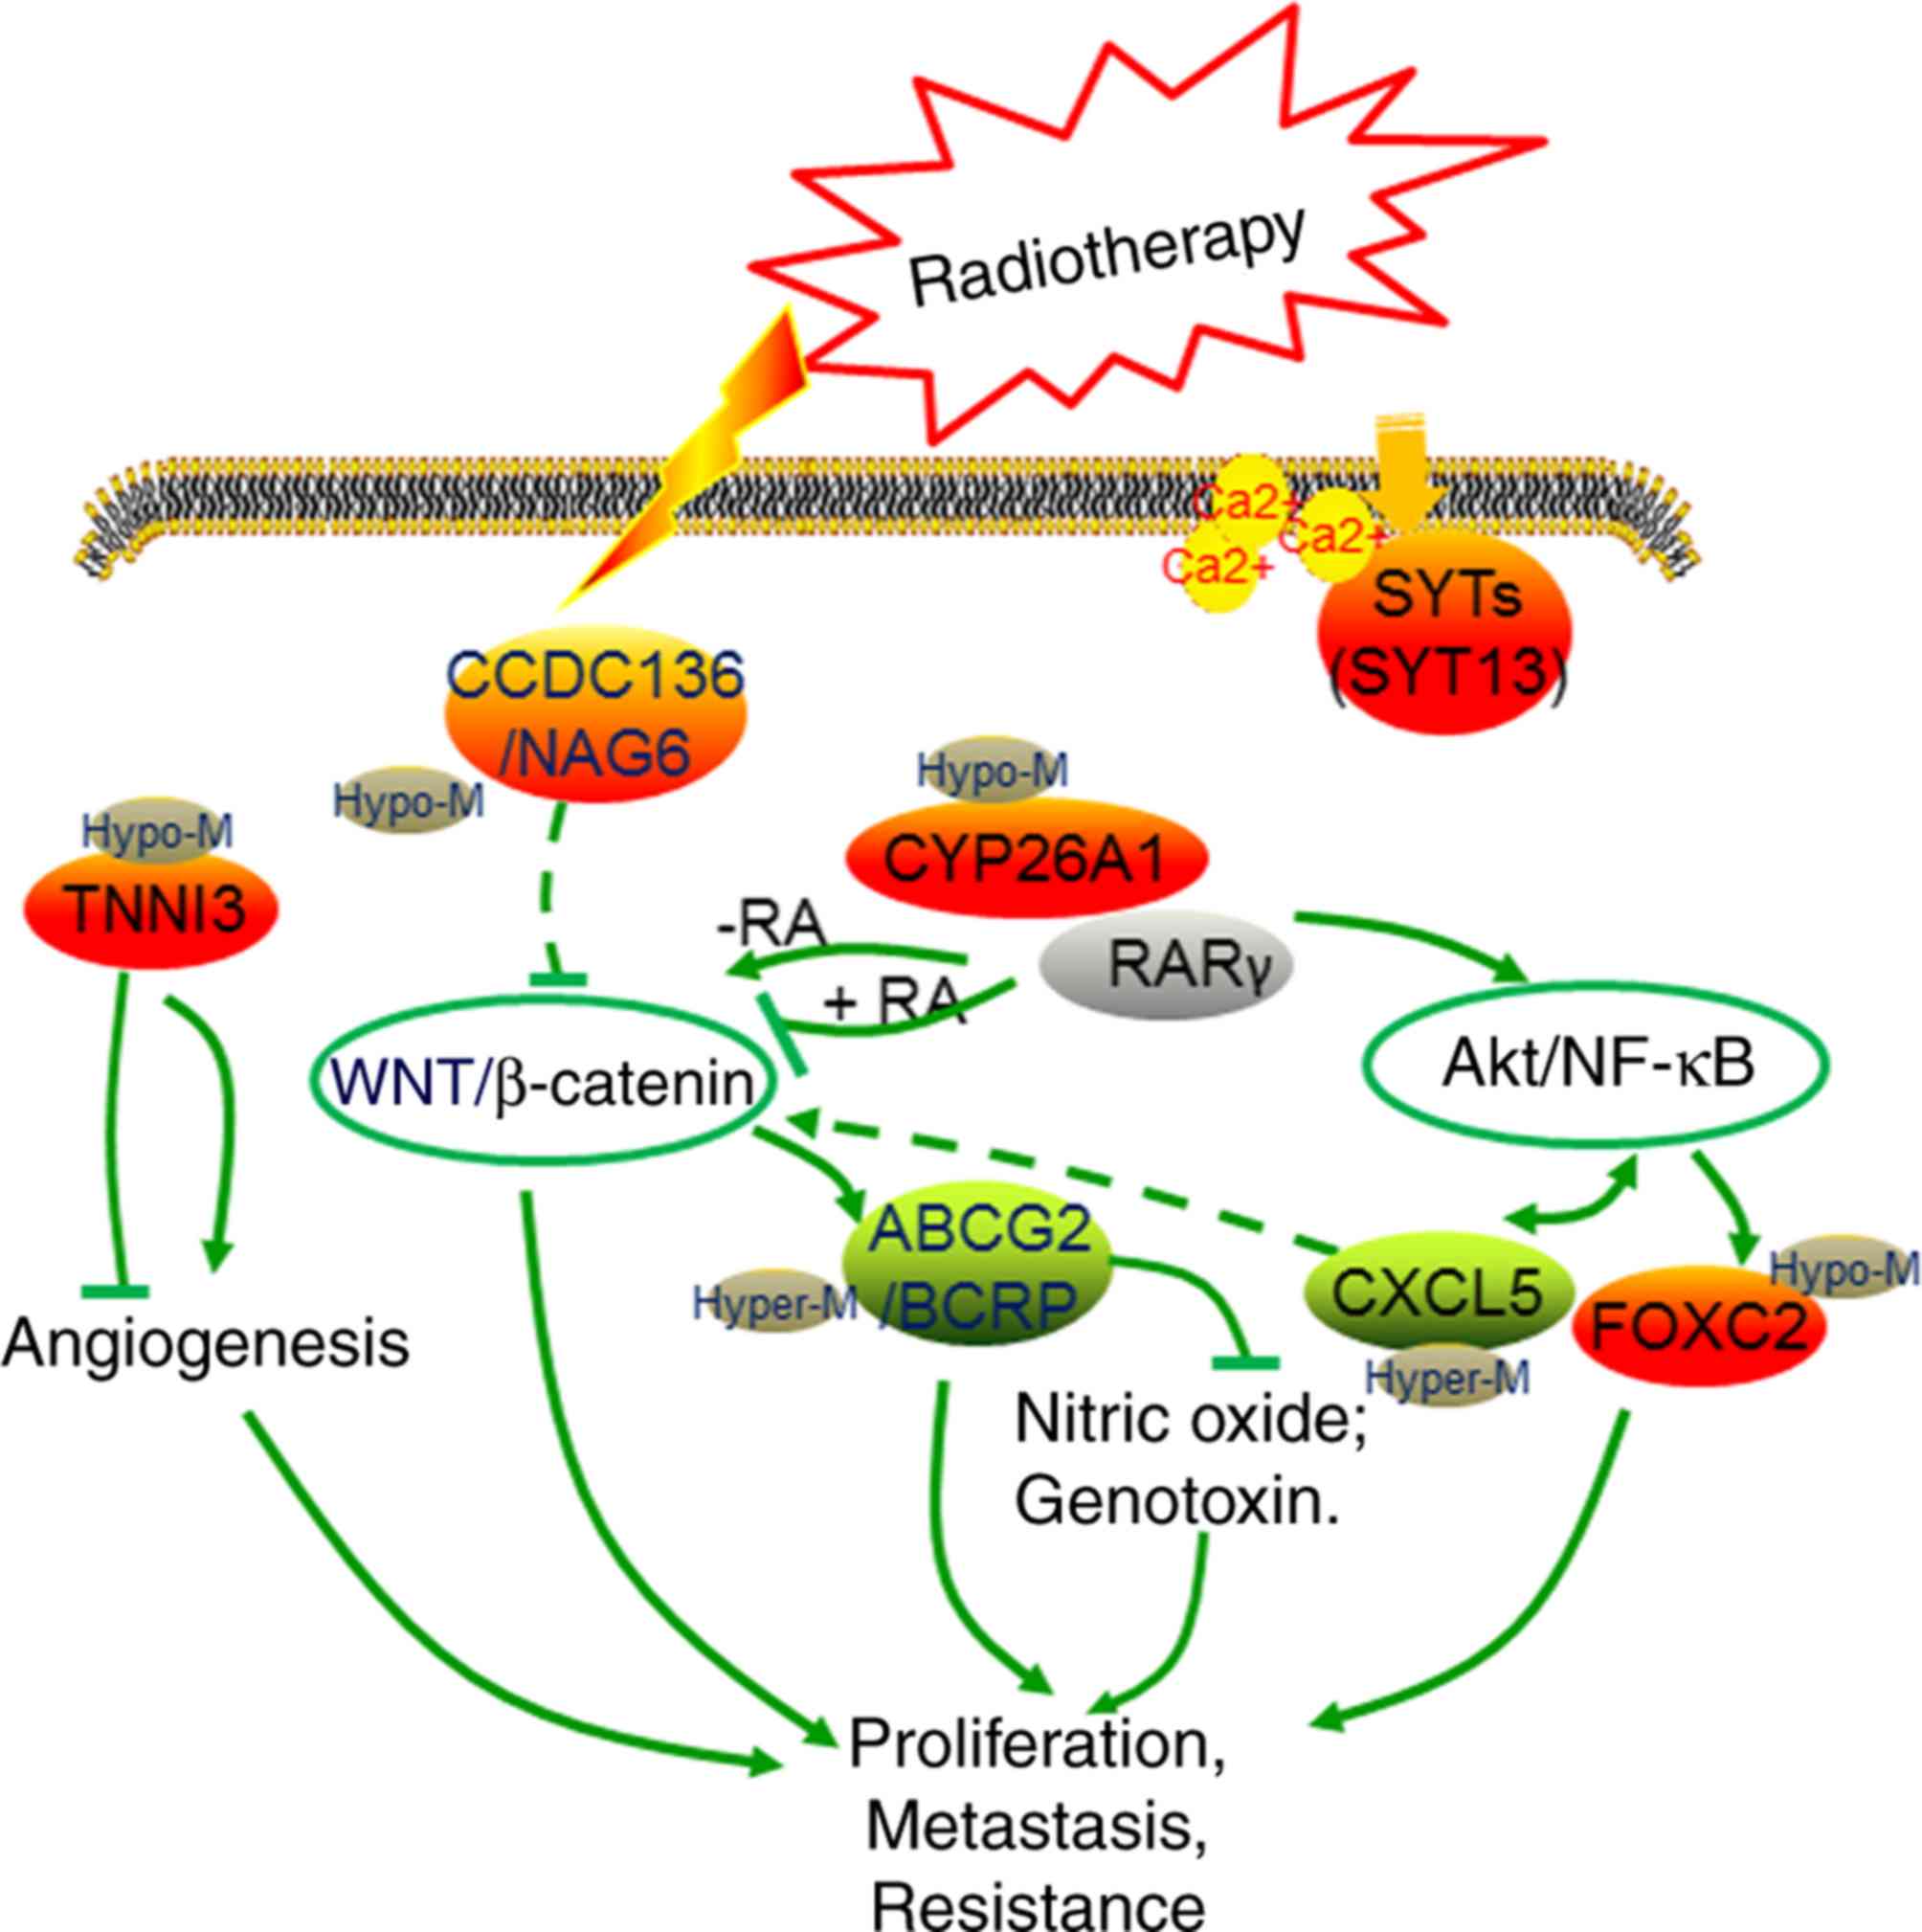 | Figure 8.Graphical presentation of the
radiotherapy-relevant 8-gene signature in cervical cancer. Green
and red points indicate downregulated and upregulated genes in the
radiotherapy group, respectively. SYT13, synaptotagmin XIII gene;
CCDC136/ NAG6, coiled-coil domain containing 136 gene; TNNI3,
cardiac troponin I gene; CY26A1, cytochrome P450 26A1 gene; RA,
retinoic acid; RARγ, RA receptor γ; ABCG2/BCRP, ATP binding
cassette subfamily G member 2 gene; CXCL5, epithelial
neutrophil-activating peptide-78 gene; FOXC2, Forkhead 1 gene. |
ABCG2 encodes an multidrug transporter
protein, breast cancer resistance protein (BCRP), which contributes
to drug resistance in cancer cell lines and tumors (35,36).
It has been reported that ABCG2 is downstream of
Wnt/β-catenin signaling and is responsible for chemoresistance
(37). Downregulated
BCRP/ABCG2 is common in tumor tissues, including
CerC, which may function in tumorigenesis by promoting the
accumulation of genotoxins and nitric oxide (24,38,39).
In addition, ABCG2 promoter methylation has been described
in multiple myeloma tissues (40).
The demethylation of ABCG2 increases its expression and
enhances multidrug resistance in cancer cells (40,41).
CYP26A1 is an oncogenic protein in breast cancer, cervical
squamous neoplasia, ovarian cancer, and head and neck cancer
(25,26,42).
CYP26A1 is a metabolizing enzyme for retinoic acids (RAs) (25). RAs induce the differentiation of
various types of stem cells (43),
and the RA receptor γ (RARγ) is associated with the Akt/NF-κB and
Wnt/β-catenin signaling pathways in tumorigenesis (44). Yasuhara et al (45) suggested that RARγ enhances and
inhibits Wnt/β-catenin signaling in RA-free and RA-treated
conditions, respectively. Demethylation and hypermethylation of
CYP26A1 had been demonstrated in the CYP26A1-positive T47D
cell line, which exhibits low rates of metastasis, and the
CYP26A1-negative T47D cell line, which exhibits high rates of
metastasis, respectively (46). It
has been suggested that increased methylation levels in the
CYP26A1 promoter is associated with poor survival in
patients with prostate cancer (47). In the present study, the expression
levels of ABCG2 and CYP26A1 were downregulated and
upregulated, respectively, in patients in the radiotherapy group
compared with the non-radiotherapy group. These two genes were
identified to be positively associated with the prognosis of
patients with CerC, and their hypermethylation was correlated with
poor survival. In addition, it was also observed that
CYP26A1 was associated with the ‘Retinol Metabolism’ GSEA
KEGG pathway, which was associated with RA metabolism in cancer
cells (48). These results
suggested the complex roles of these genes in response to
radiotherapy, and their potential prognostic value.
Among the 4 hypomethylated genes (SYT13, FOXC2,
CXCL5 and TMEM233), SYT13, FOXC2 and CXCL5
have been demonstrated to be associated with tumorigenesis.
FOXC2 is a downstream target of the Akt/NF-κB signaling
pathway and is critical for tumor metastasis (49). The inhibition of FOXC2
results in the suppression of tumor metastasis and chemoresistance
in lung cancer cells, nasopharyngeal carcinomas and CerC cells
(49–51). Synaptotagmins are a family of Ca2+
sensors that function in promoting membrane fusion (52,53).
Overexpression of synaptotagmin has previously been described in
human cancer (54–57). Kanda et al (58) demonstrated that SYT13 was
upregulated in gastric cancer and was associated with metastatic
status. CXCL5 is a CXC-type chemokine, and is involved in
angiogenesis and associated with poor prognosis in cancer patients
(59–62). In addition, CXCL5 expression
activated the Akt/NF-κB and Wnt/β-catenin signaling pathways
(63–65). FOXC2 and CXCL5 were
upregulated in the patients treated with radiotherapy compared with
patients without radiotherapy, and their expression was associated
with poor survival in patients with CerC. These demonstrated the
potential prognostic value of SYT13, FOXC2 and CXCL5
for predicting patients with high risk status or poor outcomes.
In conclusion, a significant difference in survival
was observed between the patients with CerC with high- and low-risk
scores according to the 8-gene signature. The AUC and survival
analysis in the training and validation set revealed the
performance and predictive power of the 8-gene signature risk model
for predicting survival of patients with CerC. Cox regression
analysis indicated that the 8-gene signature was an independent
risk factor for the prognosis of patients with CerC. Validation
with more and larger clinical cohorts may additionally verify the
potential prognostic value of the 8-gene signature in patients with
CerC.
Supplementary Material
Supporting Data
Acknowledgements
Not applicable.
Funding
The present study was supported by grants from the
Double Tenth Engineering of Major Research Project of Jilin
Provincial Science and Technology Department (grant no.
20140201012YY) and the Major Development Programs for New Drugs of
the Chinese Academy of Sciences during the 12th Five-Year Plan
Period (grant no. 2011ZX09102-001-36).
Availability of data and materials
The results published here are in part based upon
data generated by the TCGA Research Network (https://www.cancer.gov/tcga). The Gene Expression
Omnibus dataset GSE44001 is available at http://www.ncbi.nlm.nih.gov/geo/. All data generated
during this study are included in this published article.
Authors' contributions
FX, DD and GT were responsible for the conception
and design of the research. ND, LG, WN, HY, NZ, JJ and GL acquired
and analyzed the data. FX and DD drafted the manuscript. LG, WN,
HY, NZ, JJ and GL revised important intellectual content. All
authors agreed with the final revision.
Ethics approval and consent to
participate
Not applicable.
Patient consent for publication
Not applicable.
Competing interests
The authors declare that they have no competing
interests.
References
|
1
|
Cancer Genome Atlas Research Network;
Albert Einstein College of Medicine; Analytical Biological
Services; Barretos Cancer Hospital; Baylor College of Medicine;
Beckman Research Institute of City of Hope; Buck Institute for
Research on Aging; Canada's Michael Smith Genome Sciences Centre;
Harvard Medical School, . Helen F, et al: Integrated genomic and
molecular characterization of cervical cancer. Nature. 543:378–384.
2017. View Article : Google Scholar : PubMed/NCBI
|
|
2
|
Huang K, Sun H, Li X, Hu T, Yang R, Wang
S, Jia Y, Chen Z, Tang F, Shen J, et al: Prognostic risk model
development and prospective validation among patients with cervical
cancer stage IB2 to IIB submitted to neoadjuvant chemotherapy. Sci
Rep. 6:275682016. View Article : Google Scholar : PubMed/NCBI
|
|
3
|
Jadon R, Pembroke CA, Hanna CL,
Palaniappan N, Evans M, Cleves AE and Staffurth J: A systematic
review of organ motion and image-guided strategies in external beam
radiotherapy for cervical cancer. Clin Oncol (R Coll Radiol).
26:185–196. 2014. View Article : Google Scholar : PubMed/NCBI
|
|
4
|
White A, Joseph D, Rim SH, Johnson CJ,
Coleman MP and Allemani C: Colon cancer survival in the United
States by race and stage (2001–2009): Findings from the CONCORD-2
study. Cancer. 123 (Suppl 24):S5014–S5036. 2017. View Article : Google Scholar
|
|
5
|
Obrzut B, Kusy M, Semczuk A, Obrzut M and
Kluska J: Prediction of 5-year overall survival in cervical cancer
patients treated with radical hysterectomy using computational
intelligence methods. BMC Cancer. 17:8402017. View Article : Google Scholar : PubMed/NCBI
|
|
6
|
Dunn J, Baborie A, Alam F, Joyce K, Moxham
M, Sibson R, Crooks D, Husband D, Shenoy A, Brodbelt A, et al:
Extent of MGMT promoter methylation correlates with outcome in
glioblastomas given temozolomide and radiotherapy. Br J Cancer.
101:124–131. 2009. View Article : Google Scholar : PubMed/NCBI
|
|
7
|
Huang KH, Huang SF, Chen IH, Liao CT, Wang
HM and Hsieh LL: Methylation of RASSF1A, RASSF2A, and HIN-1 is
associated with poor outcome after radiotherapy, but not surgery,
in oral squamous cell carcinoma. Clin Cancer Res. 15:4174–4180.
2009. View Article : Google Scholar : PubMed/NCBI
|
|
8
|
Miousse IR, Kutanzi KR and Koturbash I:
Effects of ionizing radiation on DNA methylation: From experimental
biology to clinical applications. Int J Radiat Biol. 93:457–469.
2017. View Article : Google Scholar : PubMed/NCBI
|
|
9
|
Widschwendter A, Müller HH, Fiegl H,
Ivarsson L, Wiedemair A, Müller-Holzner E, Goebel G, Marth C and
Widschwendter M: DNA methylation in serum and tumors of cervical
cancer patients. Clin Cancer Res. 10:565–571. 2004. View Article : Google Scholar : PubMed/NCBI
|
|
10
|
Okayama H, Schetter AJ, Ishigame T, Robles
AI, Kohno T, Yokota J, Takenoshita S and Harris CC: The expression
of four genes as a prognostic classifier for stage I lung
adenocarcinoma in 12 independent cohorts. Cancer Epidemiol
Biomarkers Prev. 23:2884–2894. 2014. View Article : Google Scholar : PubMed/NCBI
|
|
11
|
Cheng SH, Horng CF, Huang TT, Huang ES,
Tsou MH, Shi LS, Yu BL, Chen CM and Huang AT: An eighteen-gene
classifier predicts locoregional recurrence in post-mastectomy
breast cancer patients. EBioMedicine. 5:74–81. 2016. View Article : Google Scholar : PubMed/NCBI
|
|
12
|
Harbour JW: A prognostic test to predict
the risk of metastasis in uveal melanoma based on a 15-gene
expression profile. Methods Mol Biol. 1102:427–440. 2014.
View Article : Google Scholar : PubMed/NCBI
|
|
13
|
Field MG, Decatur CL, Kurtenbach S, Gezgin
G, van der Velden PA, Jager MJ, Kozak KN and Harbour JW: PRAME as
an independent biomarker for metastasis in Uveal melanoma. Clin
Cancer Res. 22:1234–1242. 2016. View Article : Google Scholar : PubMed/NCBI
|
|
14
|
Lee YY, Kim TJ, Kim JY, Choi CH, Do IG,
Song SY, Sohn I, Jung SH, Bae DS, Lee JW and Kim BG: Genetic
profiling to predict recurrence of early cervical cancer. Gynecol
Oncol. 131:650–654. 2013. View Article : Google Scholar : PubMed/NCBI
|
|
15
|
Wang P, Wang Y, Hang B, Zou X and Mao JH:
A novel gene expression-based prognostic scoring system to predict
survival in gastric cancer. Oncotarget. 7:55343–55351.
2016.PubMed/NCBI
|
|
16
|
Goeman JJ: L1 penalized estimation in the
Cox proportional hazards model. Biom J. 52:70–84. 2010.PubMed/NCBI
|
|
17
|
Wang L, Cao C, Ma Q, Zeng Q, Wang H, Cheng
Z, Zhu G, Qi J, Ma H, Nian H and Wang Y: RNA-seq analyses of
multiple meristems of soybean: Novel and alternative transcripts,
evolutionary and functional implications. BMC Plant Biol.
14:1692014. View Article : Google Scholar : PubMed/NCBI
|
|
18
|
Eisen MB, Spellman PT, Brown PO and
Botstein D: Cluster analysis and display of genome-wide expression
patterns. Proc Natl Acad Sci USA. 95:14863–14868. 1998. View Article : Google Scholar : PubMed/NCBI
|
|
19
|
Subramanian A, Tamayo P, Mootha VK,
Mukherjee S, Ebert BL, Gillette MA, Paulovich A, Pomeroy SL, Golub
TR, Lander ES and Mesirov JP: Gene set enrichment analysis: A
knowledge-based approach for interpreting genome-wide expression
profiles. Proc Natl Acad Sci USA. 102:15545–15550. 2005. View Article : Google Scholar : PubMed/NCBI
|
|
20
|
Mootha VK, Lindgren CM, Eriksson KF,
Subramanian A, Sihag S, Lehar J, Puigserver P, Carlsson E,
Ridderstråle M, Laurila E, et al: PGC-1alpha-responsive genes
involved in oxidative phosphorylation are coordinately
downregulated in human diabetes. Nat Genet. 34:267–273. 2003.
View Article : Google Scholar : PubMed/NCBI
|
|
21
|
Kanehisa M, Furumichi M, Tanabe M, Sato Y
and Morishima K: KEGG: New perspectives on genomes, pathways,
diseases and drugs. Nucleic Acids Res. 45:D353–D361. 2017.
View Article : Google Scholar : PubMed/NCBI
|
|
22
|
Liu FF, Shi W, Done SJ, Miller N, Pintilie
M, Voduc D, Nielsen TO, Nofech-Mozes S, Chang MC, Whelan TJ, et al:
Identification of a Low-Risk luminal a breast cancer cohort that
may not benefit from breast radiotherapy. J Clin Oncol.
33:2035–2040. 2015. View Article : Google Scholar : PubMed/NCBI
|
|
23
|
Zhang XM, Sheng SR, Wang XY, Bin LH, Wang
JR and Li GY: Expression of tumor related gene NAG6 in gastric
cancer and restriction fragment length polymorphism analysis. World
J Gastroenterol. 10:1361–1364. 2004. View Article : Google Scholar : PubMed/NCBI
|
|
24
|
Gupta N, Martin PM, Miyauchi S, Ananth S,
Herdman AV, Martindale RG, Podolsky R and Ganapathy V:
Down-regulation of BCRP/ABCG2 in colorectal and cervical cancer.
Biochem Biophys Res Commun. 343:571–577. 2006. View Article : Google Scholar : PubMed/NCBI
|
|
25
|
Osanai M and Lee GH: Increased expression
of the retinoic acid-metabolizing enzyme CYP26A1 during the
progression of cervical squamous neoplasia and head and neck
cancer. BMC Res Notes. 7:6972014. View Article : Google Scholar : PubMed/NCBI
|
|
26
|
Downie D, Mcfadyen MC, Rooney PH,
Cruickshank ME, Parkin DE, Miller ID, Telfer C, Melvin WT and
Murray GI: Profiling cytochrome P450 expression in ovarian cancer:
Identification of prognostic markers. Clin Cancer Res.
11:7369–7375. 2005. View Article : Google Scholar : PubMed/NCBI
|
|
27
|
Wang D, Li T, Cui H and Zhang Y: Analysis
of the indicating value of cardiac troponin I, tumor necrosis
factor-α, interleukin-18, Mir-1 and Mir-146b for viral myocarditis
among Children. Cell Physiol Biochem. 40:1325–1333. 2016.
View Article : Google Scholar : PubMed/NCBI
|
|
28
|
Kern BE, Balcom JH, Antoniu BA, Warshaw AL
and Fernández-del Castillo C: Troponin I peptide (Glu94-Leu123), a
cartilage-derived angiogenesis inhibitor: In vitro and in vivo
effects on human endothelial cells and on pancreatic cancer. J
Gastrointest Surg. 7:961–969. 2003. View Article : Google Scholar : PubMed/NCBI
|
|
29
|
Casas-Tintó S, Maraver A, Serrano M and
Ferrús A: Troponin-I enhances and is required for oncogenic
overgrowth. Oncotarget. 7:52631–52642. 2016. View Article : Google Scholar : PubMed/NCBI
|
|
30
|
Wei S, Shang H, Cao Y and Wang Q: The
coiled-coil domain containing protein Ccdc136b antagonizes maternal
Wnt/β-catenin activity during zebrafish dorsoventral axial
patterning. J Genet Genomics. 43:431–438. 2016. View Article : Google Scholar : PubMed/NCBI
|
|
31
|
Kopczynski J, Kowalik A, Chłopek M, Wang
ZF, Góźdź S, Lasota J and Miettinen M: Oncogenic activation of the
Wnt/β-catenin signaling pathway in signet ring stromal cell tumor
of the ovary. Appl Immunohistochem Mol Morphol. 24:e28–e33. 2016.
View Article : Google Scholar : PubMed/NCBI
|
|
32
|
Nagaraj AB, Joseph P, Kovalenko O, Singh
S, Armstrong A, Redline R, Resnick K, Zanotti K, Waggoner S and
DiFeo A: Critical role of Wnt/β-catenin signaling in driving
epithelial ovarian cancer platinum resistance. Oncotarget.
6:23720–23734. 2015. View Article : Google Scholar : PubMed/NCBI
|
|
33
|
Emons G, Spitzner M, Reineke S, Auslander
N, Kramer F, Rave-Fraenk M, Gaedcke J, Ghadimi M, Ried T and Grade
M: Abstract 4760: Wnt/β-catenin signaling mediates resistance of
colorectal cancer cell lines to chemoradiotherapy. Cancer Res.
77:4760. 2017.
|
|
34
|
Lan K, Zhao Y, Fan Y, Ma B, Yang S, Liu Q,
Linghu H and Wang H: Sulfiredoxin may promote cervical cancer
metastasis via Wnt/β-catenin signaling pathway. Int J Mol Sci.
18(pii): E9172017.PubMed/NCBI
|
|
35
|
Sarkadi B, Ozvegy-Laczka C, Német K and
Váradi A: ABCG2-a transporter for all seasons. FEBS Lett.
567:116–120. 2004. View Article : Google Scholar : PubMed/NCBI
|
|
36
|
Elkind NB, Szentpétery Z, Apáti A,
Ozvegy-Laczka C, Várady G, Ujhelly O, Szabó K, Homolya L, Váradi A,
Buday L, et al: Multidrug transporter ABCG2 prevents tumor cell
death induced by the epidermal growth factor receptor inhibitor
Iressa (ZD1839, Gefitinib). Cancer Res. 65:1770–1777. 2005.
View Article : Google Scholar : PubMed/NCBI
|
|
37
|
Chau WK, Ip CK, Mak AS, Lai HC and Wong
AS: c-Kit mediates chemoresistance and tumor-initiating capacity of
ovarian cancer cells through activation of
Wnt/β-catenin-ATP-binding cassette G2 signaling. Oncogene.
32:2767–2781. 2013. View Article : Google Scholar : PubMed/NCBI
|
|
38
|
Liu HG, Pan YF, You J, Wang OC, Huang KT
and Zhang XH: Expression of ABCG2 and its significance in
colorectal cancer. Asian Pac J Cancer Prev. 11:845–848.
2010.PubMed/NCBI
|
|
39
|
Sari FM, Yanar HT and Ozhan G:
Investigation of the functional single-nucleotide polymorphisms in
the BCRP transporter and susceptibility to colorectal cancer.
Biomed Rep. 3:105–109. 2015. View Article : Google Scholar : PubMed/NCBI
|
|
40
|
Turner JG, Gump JL, Zhang C, Cook JM,
Marchion D, Hazlehurst L, Munster P, Schell MJ, Dalton WS and
Sullivan DM: ABCG2 expression, function, and promoter methylation
in human multiple myeloma. Blood. 108:3881–3889. 2006. View Article : Google Scholar : PubMed/NCBI
|
|
41
|
Bram EE, Stark M, Raz S and Assaraf YG:
Chemotherapeutic drug-induced ABCG2 promoter demethylation as a
novel mechanism of acquired multidrug resistance 1 2. Neoplasia.
11:1359–1370. 2009. View Article : Google Scholar : PubMed/NCBI
|
|
42
|
Chang CL, Hong E, Lao-Sirieix P and
Fitzgerald RC: A novel role for the retinoic acid-catabolizing
enzyme CYP26A1 in Barrett's associated adenocarcinoma. Oncogene.
27:2951–2960. 2008. View Article : Google Scholar : PubMed/NCBI
|
|
43
|
Tang XH and Gudas LJ: Retinoids, retinoic
acid receptors, and cancer. Annu Rev Pathol. 6:345–364. 2011.
View Article : Google Scholar : PubMed/NCBI
|
|
44
|
Huang GL, Luo Q, Rui G, Zhang W, Zhang QY,
Chen QX and Shen DY: Oncogenic activity of retinoic acid receptor γ
is exhibited through activation of the Akt/NF-κB and Wnt/β-catenin
pathways in cholangiocarcinoma. Mol Cell Biol. 33:3416–3425. 2013.
View Article : Google Scholar : PubMed/NCBI
|
|
45
|
Yasuhara R, Yuasa T, Williams JA, Byers
SW, Shah S, Pacifici M, Iwamoto M and Enomoto-Iwamoto M:
Wnt/beta-catenin and retinoic acid receptor signaling pathways
interact to regulate chondrocyte function and matrix turnover. J
Biol Chem. 285:317–327. 2010. View Article : Google Scholar : PubMed/NCBI
|
|
46
|
Francesca C, Stefano R, Gaia B, Ren M and
Nicoletta S: Derangement of a factor upstream of RARalpha triggers
the repression of a pleiotropic epigenetic network. PLoS One.
4:e43052009. View Article : Google Scholar : PubMed/NCBI
|
|
47
|
Liu LY: Association of tissue promoter
methylation levels of APC, RASSF1A, CYP26A1 and TBX15 with prostate
cancer progression (unpublished PhD thesis)University of Toronto
(Canada); 2012
|
|
48
|
García-Mariscal A, Peyrollier K, Basse A,
Pedersen E, Rühl R, van Hengel J and Brakebusch C: RhoA controls
retinoid signaling by ROCK dependent regulation of retinol
metabolism. Small GTPases. 9:433–444. 2018. View Article : Google Scholar : PubMed/NCBI
|
|
49
|
Yu YH, Chen HA, Chen PS, Cheng YJ, Hsu WH,
Chang YW, Chen YH, Jan Y, Hsiao M, Chang TY, et al:
MiR-520h-mediated FOXC2 regulation is critical for inhibition of
lung cancer progression by resveratrol. Oncogene. 32:431–443. 2013.
View Article : Google Scholar : PubMed/NCBI
|
|
50
|
Zheng CH, Quan Y, Li YY, Deng WG, Shao WJ
and Fu Y: Expression of transcription factor FOXC2 in cervical
cancer and effects of silencing on cervical cancer cell
proliferation. Asian Pac J Cancer Prev. 15:1589–1595. 2014.
View Article : Google Scholar : PubMed/NCBI
|
|
51
|
Zhou Z, Zhang L, Xie B, Wang X, Yang X,
Ding N, Zhang J, Liu Q, Tan G, Feng D and Sun LQ: FOXC2 promotes
chemoresistance in nasopharyngeal carcinomas via induction of
epithelial mesenchymal transition. Cancer Lett. 363:137–145. 2015.
View Article : Google Scholar : PubMed/NCBI
|
|
52
|
Martens S, Kozlov MM and Mcmahon HT: How
synaptotagmin promotes membrane fusion. Science. 316:1205–1208.
2007. View Article : Google Scholar : PubMed/NCBI
|
|
53
|
Geppert M, Goda Y, Hammer RE, Li C, Rosahl
TW, Stevens CF and Südhof TC: Synaptotagmin I: A major Ca2+ sensor
for transmitter release at a central synapse. Cell. 79:717–727.
1994. View Article : Google Scholar : PubMed/NCBI
|
|
54
|
Jahn JE and Coleman WB: Phenotypic
normalization of GN6TF rat liver tumor cells results from WT1
expression following transfection of human SYT13-containing BACs.
FASEB J. 20:A10912006.
|
|
55
|
Kanda M, Shimizu D, Tanaka H, Tanaka C,
Kobayashi D, Hayashi M, Iwata N, Niwa Y, Yamada S, Fujii T, et al:
Significance of SYT8 For the detection, prediction, and treatment
of peritoneal metastasis from gastric cancer. Ann Surg.
267:495–503. 2016. View Article : Google Scholar
|
|
56
|
Sung HY, Han J, Ju W and Ahn JH:
Synaptotagmin-like protein 2 gene promotes the metastatic potential
in ovarian cancer. Oncol Rep. 36:535–541. 2016. View Article : Google Scholar : PubMed/NCBI
|
|
57
|
Jin H, Xu G, Zhang Q, Pang Q and Fang M:
Synaptotagmin-7 is overexpressed in hepatocellular carcinoma and
regulates hepatocellular carcinoma cell proliferation via Chk1-p53
signaling. Onco Targets Ther. 10:4283–4293. 2017. View Article : Google Scholar : PubMed/NCBI
|
|
58
|
Kanda M, Shimizu D, Tanaka H, Tanaka C,
Kobayashi D, Hayashi M, Takami H, Niwa Y, Yamada S, Fujii T, et al:
Synaptotagmin XIII expression and peritoneal metastasis in gastric
cancer. Br J Surg. 105:1349–1358. 2018. View Article : Google Scholar : PubMed/NCBI
|
|
59
|
Li A, King J, Moro A, Sugi MD, Dawson DW,
Kaplan J, Li G, Lu X, Strieter RM, Burdick M, et al: Overexpression
of CXCL5 is associated with poor survival in patients with
pancreatic cancer. Am J Pathol. 178:1340–1349. 2011. View Article : Google Scholar : PubMed/NCBI
|
|
60
|
Park JY, Park KH, Bang S, Kim MH, Lee JE,
Gang J, Koh SS and Song SY: CXCL5 overexpression is associated with
late stage gastric cancer. J Cancer Res Clin Oncol. 133:835–840.
2007. View Article : Google Scholar : PubMed/NCBI
|
|
61
|
Kawamura M, Toiyama Y, Tanaka K, Saigusa
S, Okugawa Y, Hiro J, Uchida K, Mohri Y, Inoue Y and Kusunoki M:
CXCL5, a promoter of cell proliferation, migration and invasion, is
a novel serum prognostic marker in patients with colorectal cancer.
Eur J Cancer. 48:2244–2251. 2012. View Article : Google Scholar : PubMed/NCBI
|
|
62
|
Begley L, Kasina S, Mehra R, Adsule S,
Admon AJ, Lonigro RJ, Chinnaiyan AM and Macoska JA: CXCL5 promotes
prostate cancer progression. Neoplasia. 10:244–254. 2008.
View Article : Google Scholar : PubMed/NCBI
|
|
63
|
Wang C, Li A, Yang S, Qiao R, Zhu X and
Zhang J: CXCL5 promotes mitomycin C resistance in non-muscle
invasive bladder cancer by activating EMT and NF-κB pathway.
Biochem Biophys Res Commun. 498:862–868. 2018. View Article : Google Scholar : PubMed/NCBI
|
|
64
|
Guan Z, Li C, Fan J, He D and Li L:
Androgen receptor (AR) signaling promotes RCC progression via
increased endothelial cell proliferation and recruitment by
modulating AKT→NF-κB→CXCL5 signaling. Sci Rep. 6:370852016.
View Article : Google Scholar : PubMed/NCBI
|
|
65
|
Zhao J, Ou B, Han D, Wang P, Zong Y, Zhu
C, Liu D, Zheng M, Sun J, Feng H and Lu A: Tumor-derived CXCL5
promotes human colorectal cancer metastasis through activation of
the ERK/Elk-1/Snail and AKT/GSK3β/β-catenin pathways. Mol Cancer.
16:702017. View Article : Google Scholar : PubMed/NCBI
|