Introduction
Neuroblastoma (NB) is an embryological malignant
disease primarily affecting the adrenal medulla; however, NBs may
occur in the abdomen, chest, pelvis and other areas where nerves
terminate (1). NB is among the
most common types of pediatric solid tumors, and ~90% of NB cases
occur in children <5 years of age with a median age of 18 months
(2). NB accounts for ~8% of total
pediatric malignancies and ~15% of total cancer mortalities
(3). The International
Neuroblastoma Staging System defined four stages for NB (4), and the survival rate is determined by
the age and the disease stage of patients with NB (3). Although multimodal therapies have
been developed to improve the survival rate of patients with NB,
the overall survival rate remains <40%, and patients with NB at
stage four have a five-year survival rate of 30–35% (5). Therefore, early diagnosis and
pathogenesis of NB are important factors for improving the survival
rate of patients with NB.
A number of potential markers for early diagnosis
and therapeutic targets of NB have been investigated. The
neuropeptide Y (NPY), a sympathetic neurotransmitter expressed in
the central nervous system, was significantly overexpressed in NB
tumor tissues of a TH-MYCN mouse model and its increased expression
level was associated with poor survival, tumor metastasis and
relapse of NB (6). Astrocyte
elevated gene-1, which encodes for metadherin, was upregulated in
NB and promotes NB cell proliferation by activating the
phosphatidylinositol-3-kinase/AKT serine/threonine kinase 1
signaling pathway (7). Pim 1
proto-oncogene, serine/threonine kinase (PIM1), PIM2 and PIM3 are
proto-oncogenes encoding for Ser/Thr protein kinases; the high
expressions of these genes were significantly correlated with poor
overall survival of patients with NB (8). Galinski et al (9) suggested a novel therapeutic
biomarker, exportin-1 (XPO1), for patients with NB, and
demonstrated that high expression of XPO1 in patients with NB was
associated with poor outcomes. Additionally, downregulation of bone
morphogenetic protein receptor 2 increased the cell growth and
clonogenicity of NB cells (10). A
previous study demonstrated that neuropilin 1 may be a promising
diagnostic biomarker for NB, and its knockdown increased the
migration and invasion of SK-N-AS NB cells (11). In contrast, knockdown of solute
carrier family 39 member 8 inhibited the progression and metastasis
of NB (12). Transcription factors
(TFs) serve important roles in the initiation and progression of
NB. POU class 4 homeobox 2 (POU4F2) TF regulates the growth,
invasive capacity and proliferation of NB cells, and decreased
expression of POU4F2 may inhibit these effects (13). In 2010, Souzaki et al
(14) suggested that increased
expression levels of sonic hedgehog, GLI family zinc finger 1 and
patched 1 are involved in activating the hedgehog signaling
pathway, and it was suggested that activation of this pathway is
involved in NB differentiation (14). Although numerous previous studies
identified potential markers and examined the mechanisms associated
with NB development, the molecular mechanisms underlying NB
progression remain unclear.
In the present study, the GSE78061 dataset from Hart
et al (15) was downloaded
from the Gene Expression Omnibus (GEO) database, to conduct a
bioinformatics analysis. The GSE78061 dataset was analyzed to
identify differentially expressed genes (DEGs) between NB cell
lines and normal retinal pigment epithelial (RPE) cells.
Furthermore, the protein-protein interactions (PPIs) of the
proteins encoded by DEGs were investigated, in order to examine the
TFs regulating the DEGs, and to investigate the molecular
mechanisms underlying NB. Additionally, the present study may
provide novel diagnostic and therapeutic markers for NB.
Materials and methods
Microarray data
The GSE78061 dataset (15) used in the present study was
downloaded from GEO (www.ncbi.nlm.nih.gov/geo/), based on the Affymetrix
human gene 1.0 ST array (Thermo Fisher Scientific, Inc., Waltham,
MA, USA). Expression data from 25 human NB cell lines and four RPE
cell lines were analyzed in the GSE78061 dataset.
Data preprocessing
Raw expression data in CEL format were downloaded
and the Oligo package in R (version 3.4.1; CRAN.R-project.org/bin/windows/base) was used to read
the chip data (16). The
expression data of all samples were preprocessed and normalized
using the robust multi-array average method (17), which included background-adjusted
quantile normalization, log-transformed perfect match values and
summarization.
DEGs and hierarchical cluster
analyses
The probe levels were extracted from the expression
matrix following data preprocessing. The linear models for
microarray data (limma; version 3.26.9; www.bioconductor.org/packages/3.2/bioc/html/limma.html)
package in R was applied to screen for DEGs between NB samples and
RPE samples (18). The threshold
values for identifying DEGs were defined as adj.p.val <0.01 and
|log2 fold-change (FC) |>2. Additionally, the
pheatmap package was used (version 1.0.8; cran.r-project.org/web/packages/pheatmap/index.html)
in R to draw two-dimensional clustering heatmaps based on the
expression levels of the identified DEGs.
Functional and pathway enrichment
analyses
The Gene Ontology (GO; www.geneontology.org) database provides functional
categorization and annotations of biological process (BP),
molecular function (MF) and cellular component (CC) for large-scale
transcriptomic data (19). The
Kyoto Encyclopedia of Genes and Genomes (KEGG; www.genome.jp/kegg) is a comprehensive database that
integrates genomic, chemical and systemic information to define the
function of genes or proteins involved in various metabolic and
regulatory pathways (20).
Additionally, the Database for Annotation, Visualization and
Integrated Discovery (DAVID; version 6.8; david.abcc.ncifcrf.gov) (21) is a tool for performing GO and KEGG
pathway enrichment analyses. In the present study, DAVID was used
to perform functional enrichment analysis for upregulated and
downregulated genes. The significantly enriched results were
selected with the following cutoffs: Enriched gene count ≥2 and
P-value <0.01.
PPI network and submodule
analyses
The Search Tool for the Retrieval of Interacting
Genes (STRING; string-db.org/) (22) is a database that integrates
functional interactions among proteins in numerous organisms. The
weighted protein interactions provide information associated with
functional linkages between proteins and genomic associations among
gene products. In the present study, the STRING database was used
to investigate interacting proteins encoded by DEGs and the default
value of the combined score >0.4 was set as the criteria for
selecting significant interactions. Cytoscape software (www.cytoscape.org/; version 3.3.0) is a visualization
tool for analyzing molecular networks (23), in which nodes represent proteins,
and edges connecting the nodes indicate their associations. Key
nodes in the PPI network were obtained based on the ranks of their
connectivity degrees.
In the PPI network, the distances between two nodes
are associated with their function and nodes tend to cluster
together based on similar function. Therefore, submodule analysis
is an effective strategy for predicting protein function. The
Molecular Complex Detection (MCODE, version 1.4.2) tool was used to
perform submodule analysis for the PPI network (24).
TF prediction and construction of
transcriptional regulation network
Transcriptional Regulatory Relationships Unravelled
by Sentence-based Text-mining (TRRUST; version 2; www.grnpedia.org/trrust) is a database that
contains 8,444 and 6,552 TF-target regulatory associations of 800
human TFs and 828 mouse TFs, respectively. The TRRUST database
draws from 11,237 PubMed articles and represents small-scale
experimental studies of transcriptional regulation (25). The TRRUST database was used to
identify the TFs among the DEGs and the regulatory associations
between the TFs and their target genes. Subsequently, the predicted
target genes among the DEGs were screened, and a transcriptional
regulation network was constructed using Cytoscape software.
Validation of gene expression by
reverse transcription-quantitative polymerase chain reaction
(RT-qPCR)
RT-qPCR analysis was performed to detect the gene
expression levels of numerous DEGs predicted to be associated with
human NB. hTERT RPE-1 cells (Jennio Bioech Co., Ltd., Guangzhou,
China) were cultured in RPMI-1640 medium (Gibco; Thermo Fisher
Scientific, Inc.), and SH-SY5Y cells (cat. no. SCSP-5014; Stem Cell
Bank, Chinese Academy of Sciences, Shanghai, China) were cultured
in Dulbecco's modified Eagle's medium/nutrient mixture F-12 (Gibco;
Thermo Fisher Scientific, Inc). Both cells lines were cultured at
37°C under a humidified 5% CO2 atmosphere. Total RNA was
extracted using TRIzol® reagent (Invitrogen; Thermo
Fisher Scientific, Inc.), and RNA was reverse-transcribed using
PrimeScript RT master mix (Takara Bio, Inc., Otsu, Japan) for cDNA
synthesis at 37°C for 60 min, followed by 37°C for 5s. Following
cDNA synthesis, qPCR was conducted using Power SYBR Green PCR
master mix (Thermo Fisher Scientific, Inc.). The RCR thermocycling
conditions were as follows: 50°C for 3 min, 40 cycles of (95°C for
3 min, 95°C for 10s, and 60°C for 30s), followed by 72°C for 5 min.
GAPDH was used as the reference gene. Primer sequences are listed
in Table I. Relative gene
expression was calculated using the 2−ΔΔCq method
(26). All experiments were
repeated three times.
 | Table I.Primer sequences for the validated
genes. |
Table I.
Primer sequences for the validated
genes.
| Primer name | Primer sequence
(5′-3′) |
|---|
| ITGA2-F |
GTGGCTTTCCTGAGAACCGA |
| ITGA2-R |
GATTCCCACATTGCTGTGCC |
| MAPK10-F |
TGGTGACACGTTATTACAGAGC |
| MAPK10-R |
GGCCGATTCTCCACATAGTTTCT |
| TUBB2B-F |
TACTTTAGGTGTGCGCTGGG |
| TUBB2B-R |
GAGGACACCATTCCGACACA |
| RALS11B-F |
CGGTTCCTCACCAAACGATTC |
| RALS11B-R |
GGCTGTTCTCATGGACCTGAA |
| GAPDH-F |
TGACAACTTTGGTATCGTGGAAGG |
| GAPDH-R |
AGGCAGGGATGATGTTCTGGAGAG |
Statistical analysis
All results are presented as the mean ± standard
error. Differences between groups were evaluated by Student's
t-test. Statistical analysis of differences between groups was
performed using SPSS software (version 22; IBM Corp., Armonk, NY,
USA) and P<0.05 was considered to indicate a statistically
significant difference. Graphs were obtained using Prism (version
5; GraphPad Software, Inc., La Jolla, CA, USA).
Results
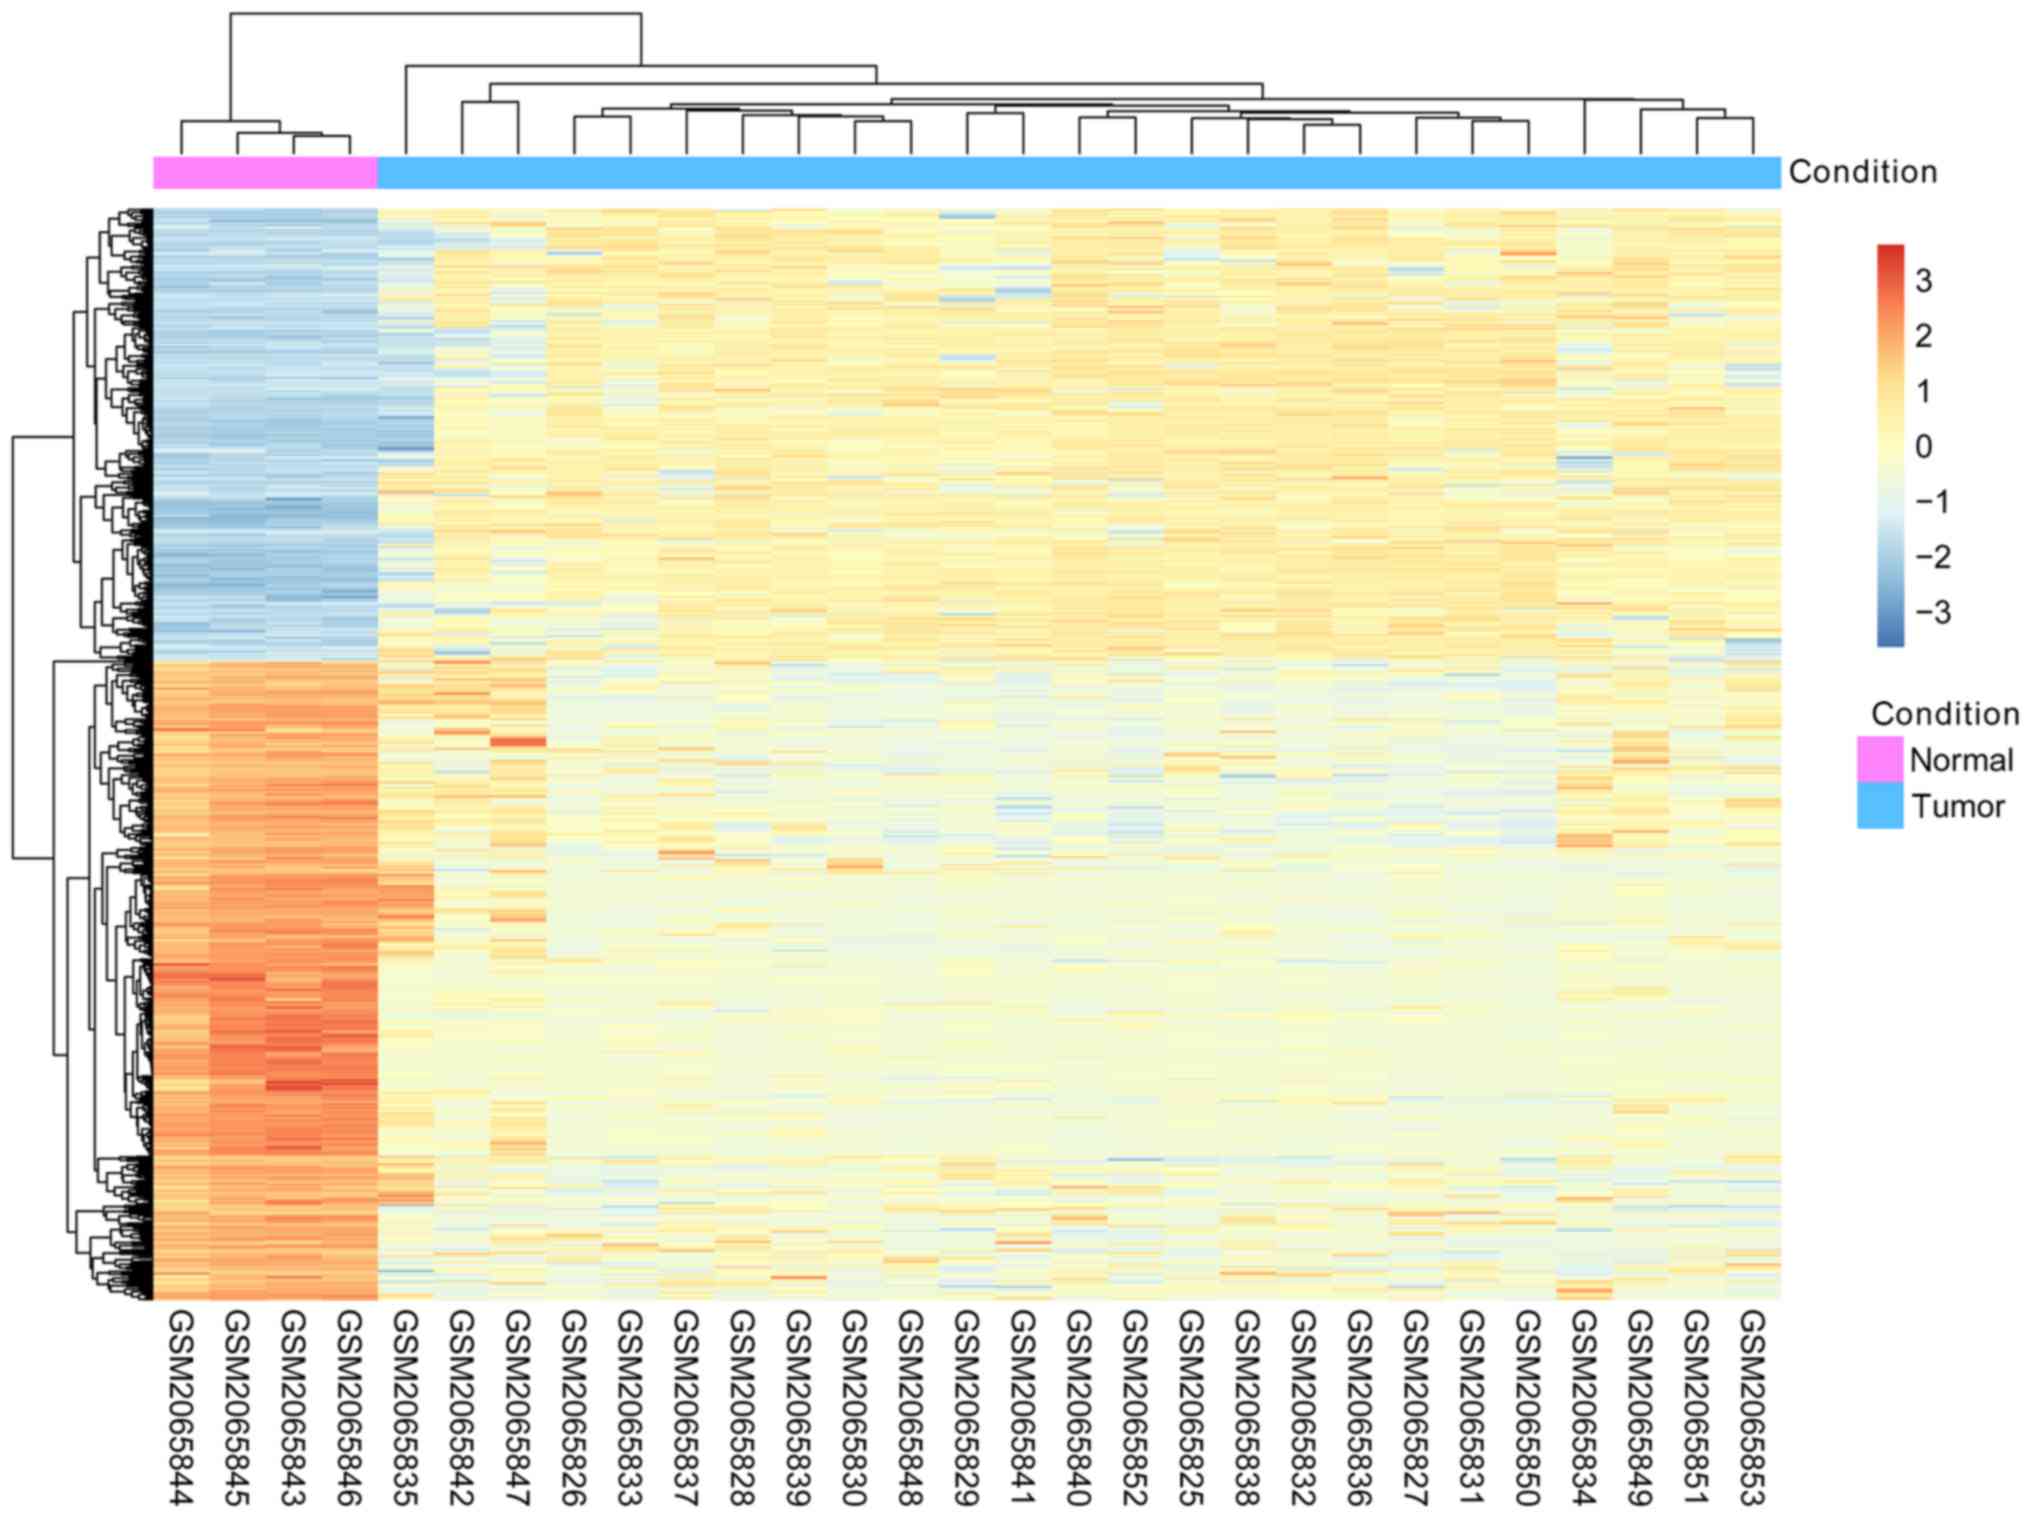
Identification of DEGs and
hierarchical cluster analysis
Using the cutoff criteria of adj.p.val <0.01 and
|log2 FC|>2, 928 DEGs were identified in human NB
cell lines compared with RPE cell lines. Among the 928 DEGs
identified, 386 DEGs were upregulated and 542 DEGs were
downregulated. The number of downregulated DEGs was 1.4-fold
increase compared with upregulated DEGs. Additionally, hierarchy
cluster analysis suggested that the DEGs clustered according to the
two types of cell lines based on their expression profiles,
suggesting that the DEGs may be used for further analyses (Fig. 1).
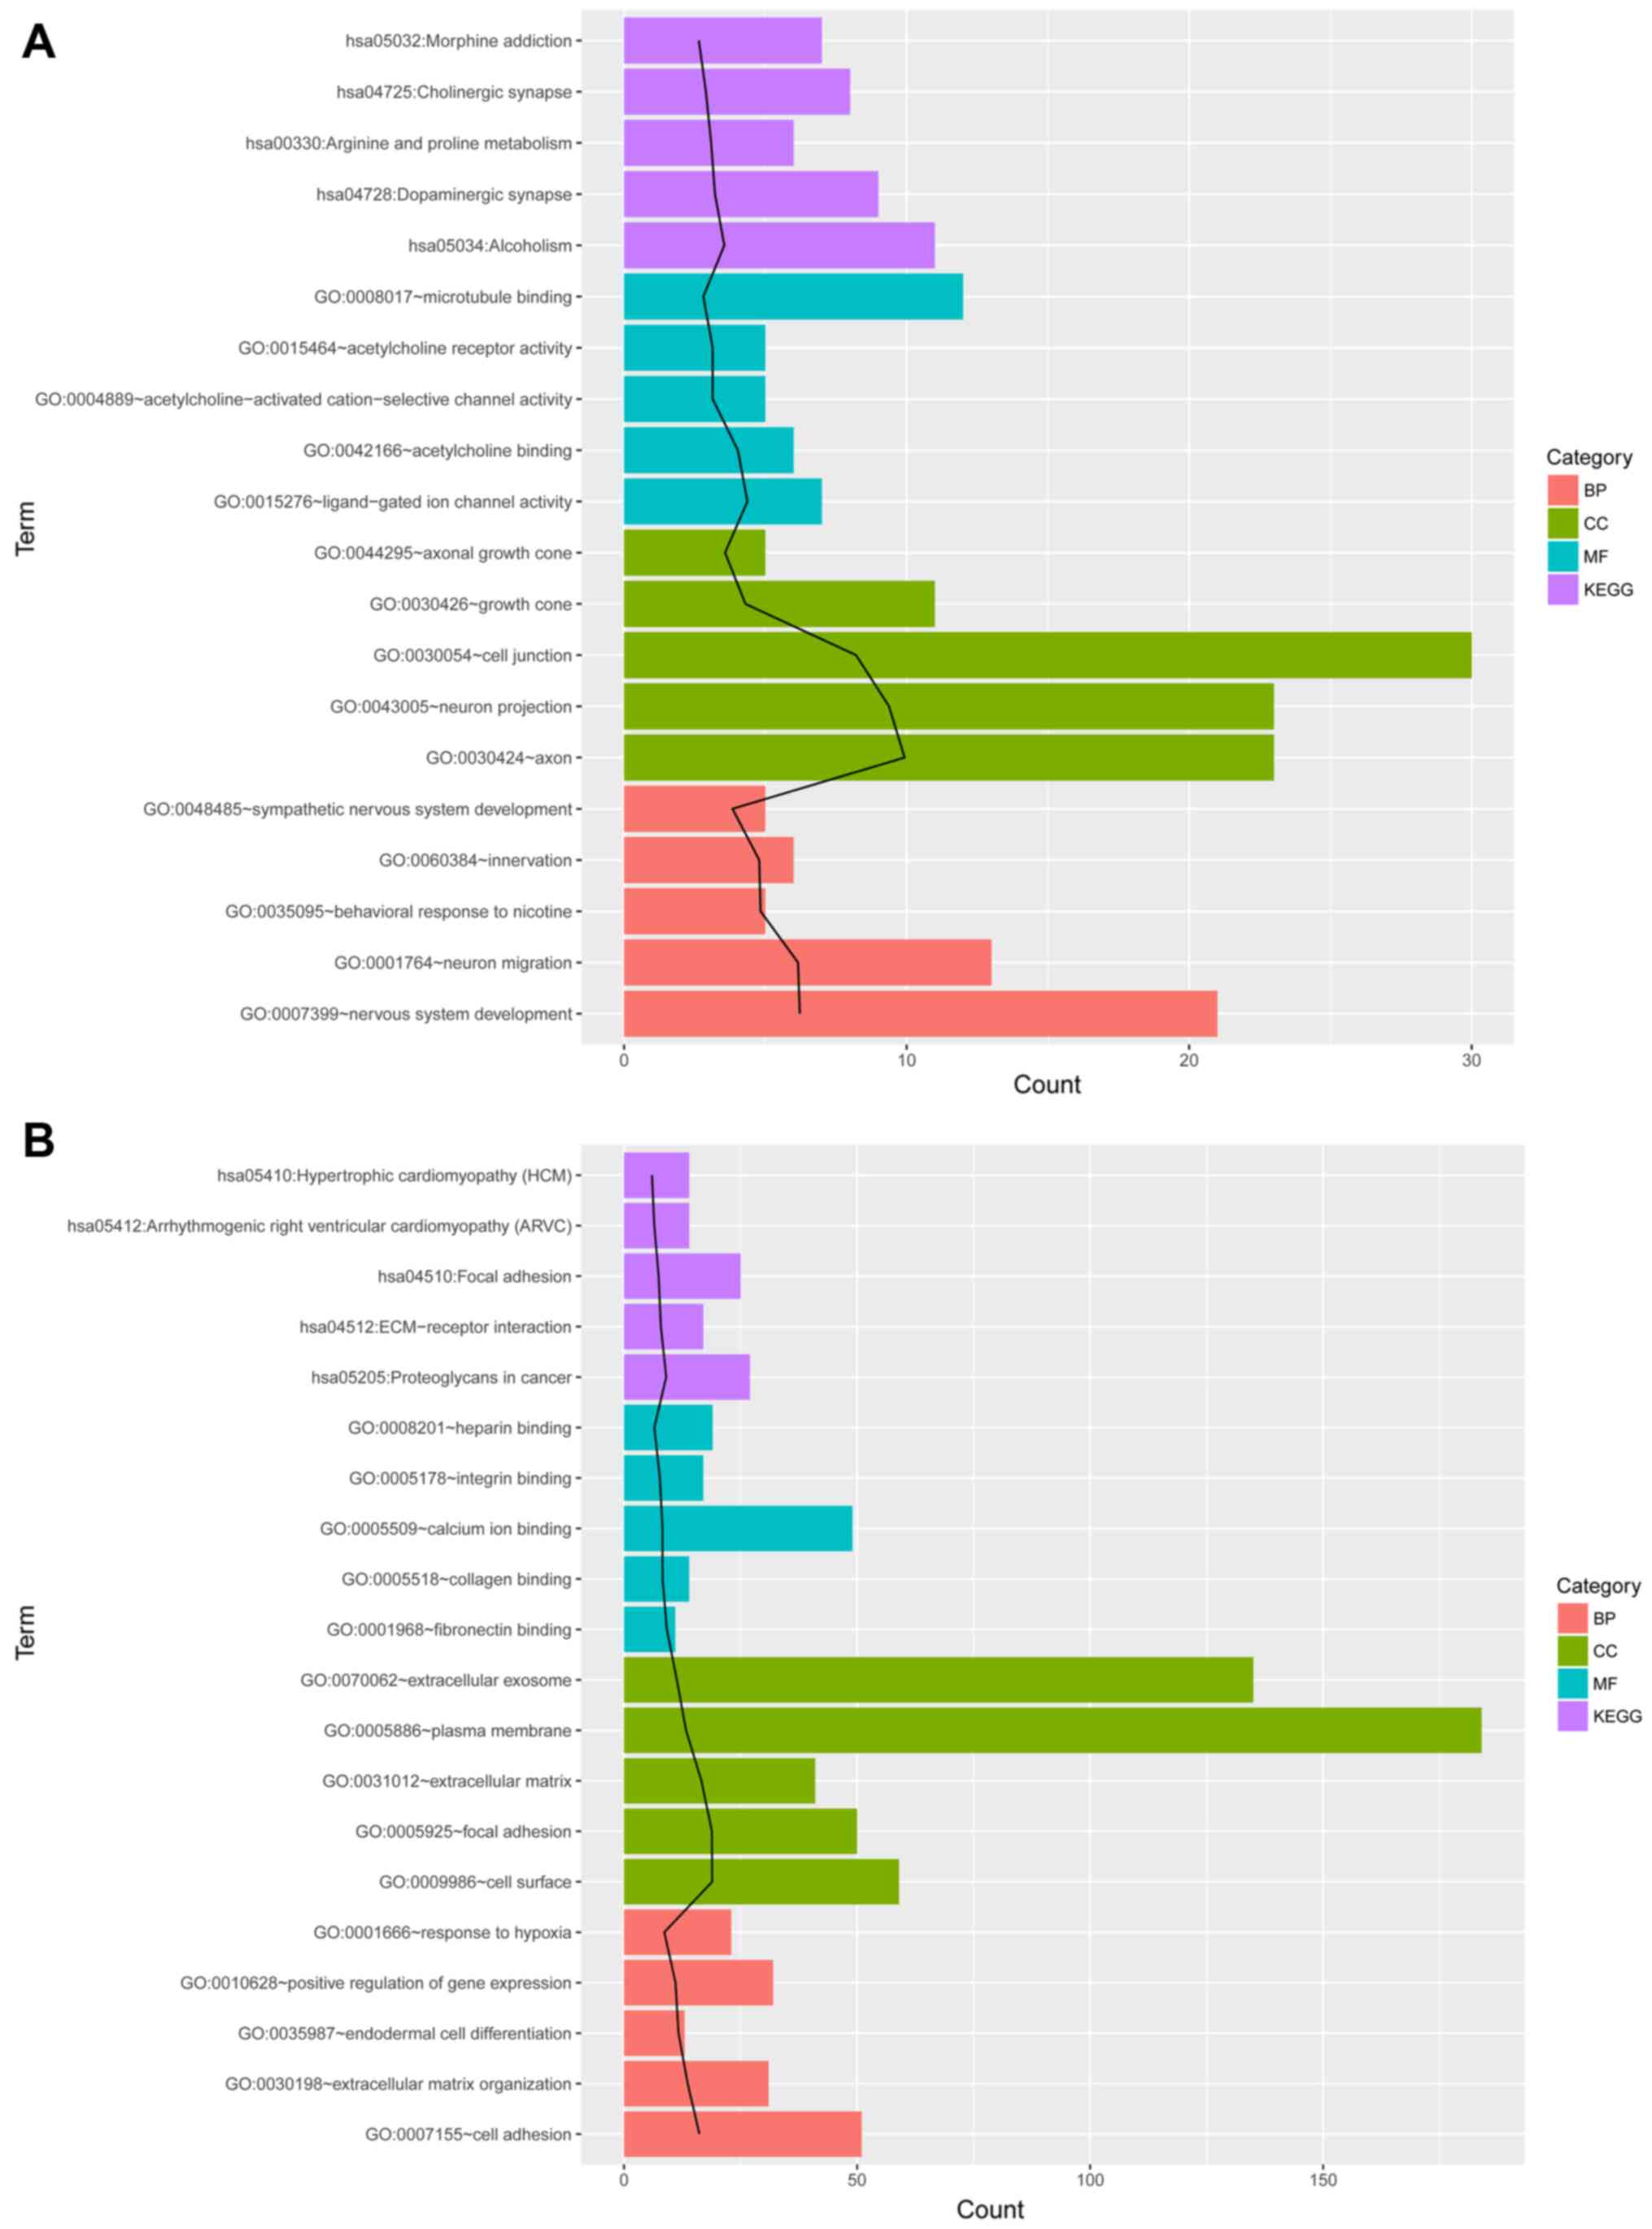
Functional enrichment analysis of
DEGs
DEGs were analyzed using DAVID software to identify
significant KEGG pathways and GO terms in the category of BP, CC
and MF. The top five GO terms within BP, CC and MF, and the top
five KEGG pathways for upregulated and downregulated DEGs are
presented in Table II and in
Fig. 2. Upregulated genes were
significantly enriched in ‘neuron migration’ [GO term: GO:0001764;
including GATA binding protein 2 (GATA2), paired like homeobox 2B
(PHOX2B) and tubulin β 2B class IIb (TUBB2B)] and ‘dopaminergic
synapse’ signaling pathways [KEGG pathway: hsa04728; including
mitogen-activated protein kinase 10 (MAPK10), dopa decarboxylase
(DDC) and G protein subunit γ 2 (GNG2)]. Although ‘nervous system
development’ was more significant, there were more hub genes in PPI
network enriched in ‘neuron migration’ and the P-values of these
two terms were very close. Therefore, ‘neuron migration’ was
selected for further discussion. Besides, we choose ‘dopaminergic
synapse’ pathway to discuss due to this pathway theoretically may
be more associated with the development of NB and can be explained
by several appropriate article than ‘alcoholism’ pathway and its
significant P-value was only next to ‘alcoholism’. The majority of
the downregulated DEGs were primarily involved in functions
associated with ‘focal adhesion’ [GO term: GO:0005925; including
integrin subunit α 2 (ITGA2), ITGA3, ITGA4 and ITGA5] and
‘proteoglycans in cancer’ (KEGG pathway: hsa05205; ITGA2, ITGB5,
CD44 molecule, ITGA5 and thrombospondin 1). Based on the results,
‘cell surface’ was more significant and its meaning was broader
than that of ‘focal adhesion’. What' more, the majority of nodes in
the following module network belonged to the integrin α and β chain
family, which were also enriched in this pathway.
| Table II.Top five enriched MF, CC and BP GO
terms, and KEGG pathways for upregulated DEGs and downregulated
DEGs. |
Table II.
Top five enriched MF, CC and BP GO
terms, and KEGG pathways for upregulated DEGs and downregulated
DEGs.
| A, Upregulated
DEGs |
|---|
|
|---|
| Category | Term | Count | P-value | Examples of
genes |
|---|
| KEGG |
hsa05034:Alcoholism | 11 |
2.84×10⁻⁴ | HIST1H3J, HIST1H3F,
HIST2H4A, GNG4 and HIST1H3I |
| KEGG |
hsa04728:Dopaminergic synapse | 9 |
6.07×10⁻⁴ | DDC, KIF5A, GNG2,
MAPK10 and GNG4 |
| KEGG | hsa00330:Arginine
and proline metabolism | 6 |
8.31×10⁻⁴ | CKMT1A, CKMT1B,
ARG2, MAOA and ALDH2 |
| KEGG |
hsa04725:Cholinergic synapse | 8 |
1.27×10⁻³ | GNAO1, CHRNB4,
SLC18A3, GNG2 and CHRNA7 |
| KEGG | hsa05032:Morphine
addiction | 7 |
2.27×10⁻³ | GNAO1, PDE3B,
PDE10A, GNG2 and GNG4 |
| MF |
GO:0015276:Ligand-gated ion channel
activity | 7 |
4.32×10⁻⁵ | CHRNB4, CHRNA7,
CHRNB2, CHRFAM7A and CHRNA3 |
| MF |
GO:0042166:Acetylcholine binding | 6 |
9.4×10⁻⁵ | CHRNB4, SLC18A3,
CHRNA7, CHRNB2 and CHRNA3 |
| MF |
GO:0004889:Acetylcholine-activated
cation-selective channel activity | 5 |
7.32×10⁻⁴ | CHRNB4, CHRNA7,
CHRNB2, CHRFAM7A and CHRNA3 |
| MF |
GO:0015464:Acetylcholine receptor
activity | 5 |
7.32×10⁻⁴ | CHRNB4, CHRNA7,
CHRNB2, CHRFAM7A and CHRNA3 |
| MF |
GO:0008017:Microtubule binding | 12 |
1.57×10⁻³ | KIF1A, KIF5B,
KIF5A, MAPT and KIF5C |
| CC |
GO:0030424:Axon | 23 |
1.18×10⁻¹⁰ | DDC, RET, SYT4,
STMN2 and ATL1 |
| CC | GO:0043005:Neuron
projection | 23 |
4.20×10⁻¹⁰ | CADM1, RAB39B,
STMN2, KIF5A and SLC6A2 |
| CC | GO:0030054:Cell
junction | 30 |
6.16×10⁻⁹ | SEPT3, SYT4,
GABRB3, GRIK2 and SYP |
| CC | GO:0030426:Growth
cone | 11 |
5.07×10⁻⁵ | TSHZ3, STMN2, MAPT,
LRRTM1 and STMN4 |
| CC | GO:0044295:Axonal
growth cone | 5 |
2.67×10⁻⁴ | FLRT3, KIF5B,
PTCH1, L1CAM and OLFM1 |
| BP | GO:0007399:Nervous
system development | 21 |
6.05×10⁻⁷ | SCN3B, FGF14,
DPYSL5, L1CAM and CNTFR |
| BP | GO:0001764:Neuron
migration | 13 |
7.00×10⁻⁷ | ASCL1, GATA2,
PHOX2B, TUBB2B and GATA3 |
| BP |
GO:0035095:behavioral response to
nicotine | 5 |
1.48×10⁻⁵ | CHRNB4, CHRNA7,
CHRNB2, CHRFAM7A and CHRNA3 |
| BP |
GO:0060384:Innervation | 6 |
1.65×10⁻⁵ | RET, SULF2, GABRB3,
RNF165 and ISL1 |
| BP |
GO:0048485:Sympathetic nervous system
development | 5 |
1.46×10⁻⁴ | PHOX2A, PHOX2B,
ASCL1, HAND2 and GATA3 |
|
| B, Downregulated
DEGs |
|
|
Category | Term | Count | P-value | Examples of
genes |
|
| KEGG |
hsa05205:Proteoglycans in cancer | 27 |
8.81×10⁻¹⁰ | ITGA2, ITGB5, CD44,
ITGA5 and THBS1 |
| KEGG |
hsa04512:ECM-receptor interaction | 17 |
1.25×10⁻⁸ | COL4A2, COL4A1,
ITGA11, ITGA2 and ITGB5 |
| KEGG | hsa04510:Focal
adhesion | 25 |
3.67×10⁻⁸ | ITGA11, ITGA2,
ITGB5, ITGA3 and ITGA4 |
| KEGG |
hsa05412:Arrhythmogenic right ventricular
cardiomyopathy (ARVC) | 14 |
3.21×10⁻⁷ | ITGA11, ITGA2,
GJA1, ITGB5 and ITGA3 |
| KEGG |
hsa05410:Hypertrophic cardiomyopathy
(HCM) | 14 |
9.98×10⁻⁷ | IL6, ITGB8, ITGA5,
ITGAV and ITGA7 |
| MF |
GO:0001968:Fibronectin binding | 11 |
6.48×10⁻¹⁰ | CTSK, CTGF, ITGAV,
CCDC80 and FSTL3 |
| MF | GO:0005518:Collagen
binding | 14 |
5.31×10⁻⁹ | ADGRG6, ITGA11,
ITGA2, SMAD3 and ITGA3 |
| MF | GO:0005509:Calcium
ion binding | 49 |
5.65×10⁻⁹ | LTBP1, LTBP2,
LTBP3, FSTL1 and EDIL3 |
| MF | GO:0005178:Integrin
binding | 17 |
2.01×10⁻⁸ | FBN1, ITGA2, ITGA3,
EDIL3 and CD151 |
| MF | GO:0008201:Heparin
binding | 19 |
3.16×10⁻⁷ | BMP4, CCL2, LTBP2,
LXN and FBN1 |
| CC | GO:0009986:Cell
surface | 59 |
1.21×10⁻¹⁹ | MICB, MICA, CSPG4,
TLR3 and TLR4 |
| CC | GO:0005925:Focal
adhesion | 50 |
1.40×10⁻¹⁹ | ITGA11, ITGA2,
ITGB5, ITGA3 and ITGA4 |
| CC |
GO:0031012:Extracellular matrix | 41 |
2.48×10⁻¹⁷ | LTBP1, LTBP2,
LTBP3, IGFBP7 and POSTNS |
| CC | GO:0005886:Plasma
membrane | 184 |
4.83×10⁻¹⁴ | F2RL2, SLC9A7,
MICB, MICA and VCL |
| CC |
GO:0070062:Extracellular exosome | 135 |
4.58×10⁻¹² | CHMP4C, LTBP2,
LTBP3, CSPG4 and FSTL1 |
| BP | GO:0007155:Cell
adhesion | 51 |
6.51×10⁻¹⁷ | IGFBP7, POSTN,
EDIL3, CD151 and VCL |
| BP |
GO:0030198:Extracellular matrix
organization | 31 |
2.15×10⁻¹⁴ | ITGA11, ITGB5,
POSTN, ABI3BP and CD44 |
| BP |
GO:0035987:Endodermal cell
differentiation | 13 |
2.05×10⁻¹² | HMGA2, COL8A1,
MMP14, MMP2 and FN1 |
| BP | GO:0010628:Positive
regulation of gene expression | 32 |
8.90×10⁻¹² | ACTA2, SMAD3,
ITGA3, INHBA and TFAP2A |
| BP | GO:0001666:Response
to hypoxia | 23 |
2.27×10⁻⁹ | MMP14, MMP2, TGFB1,
TGFB2 and THBS1 |
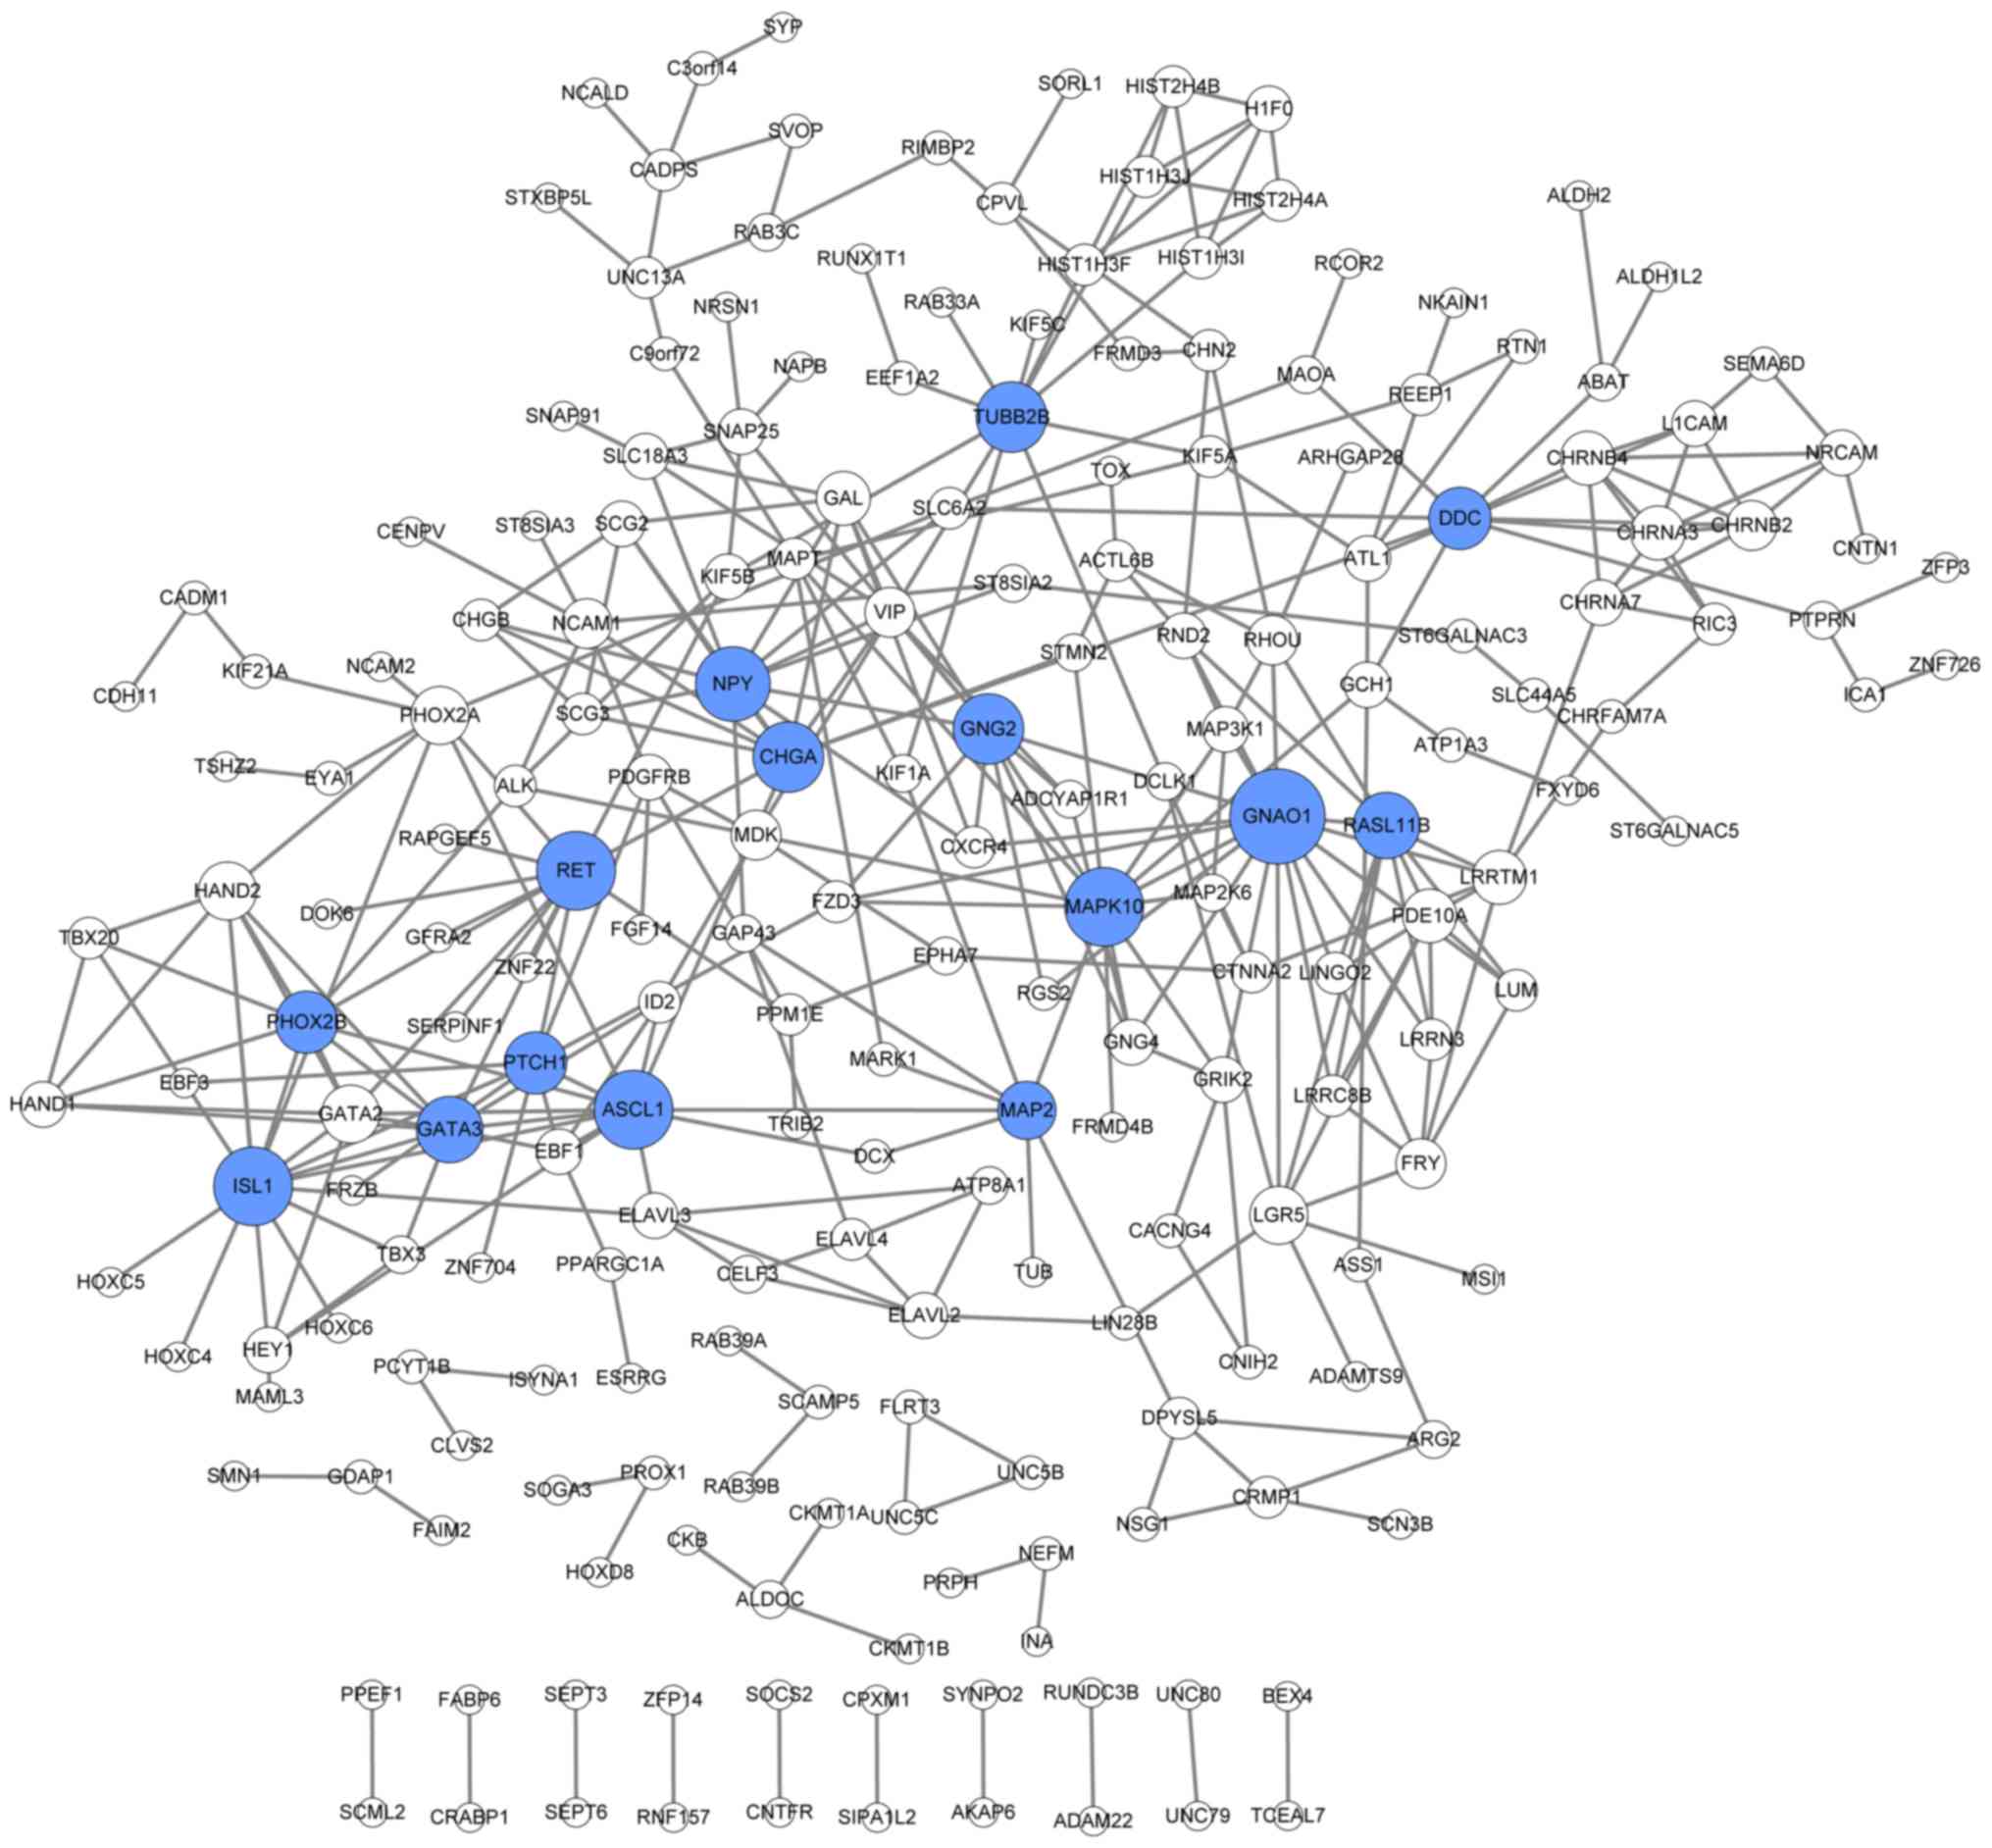
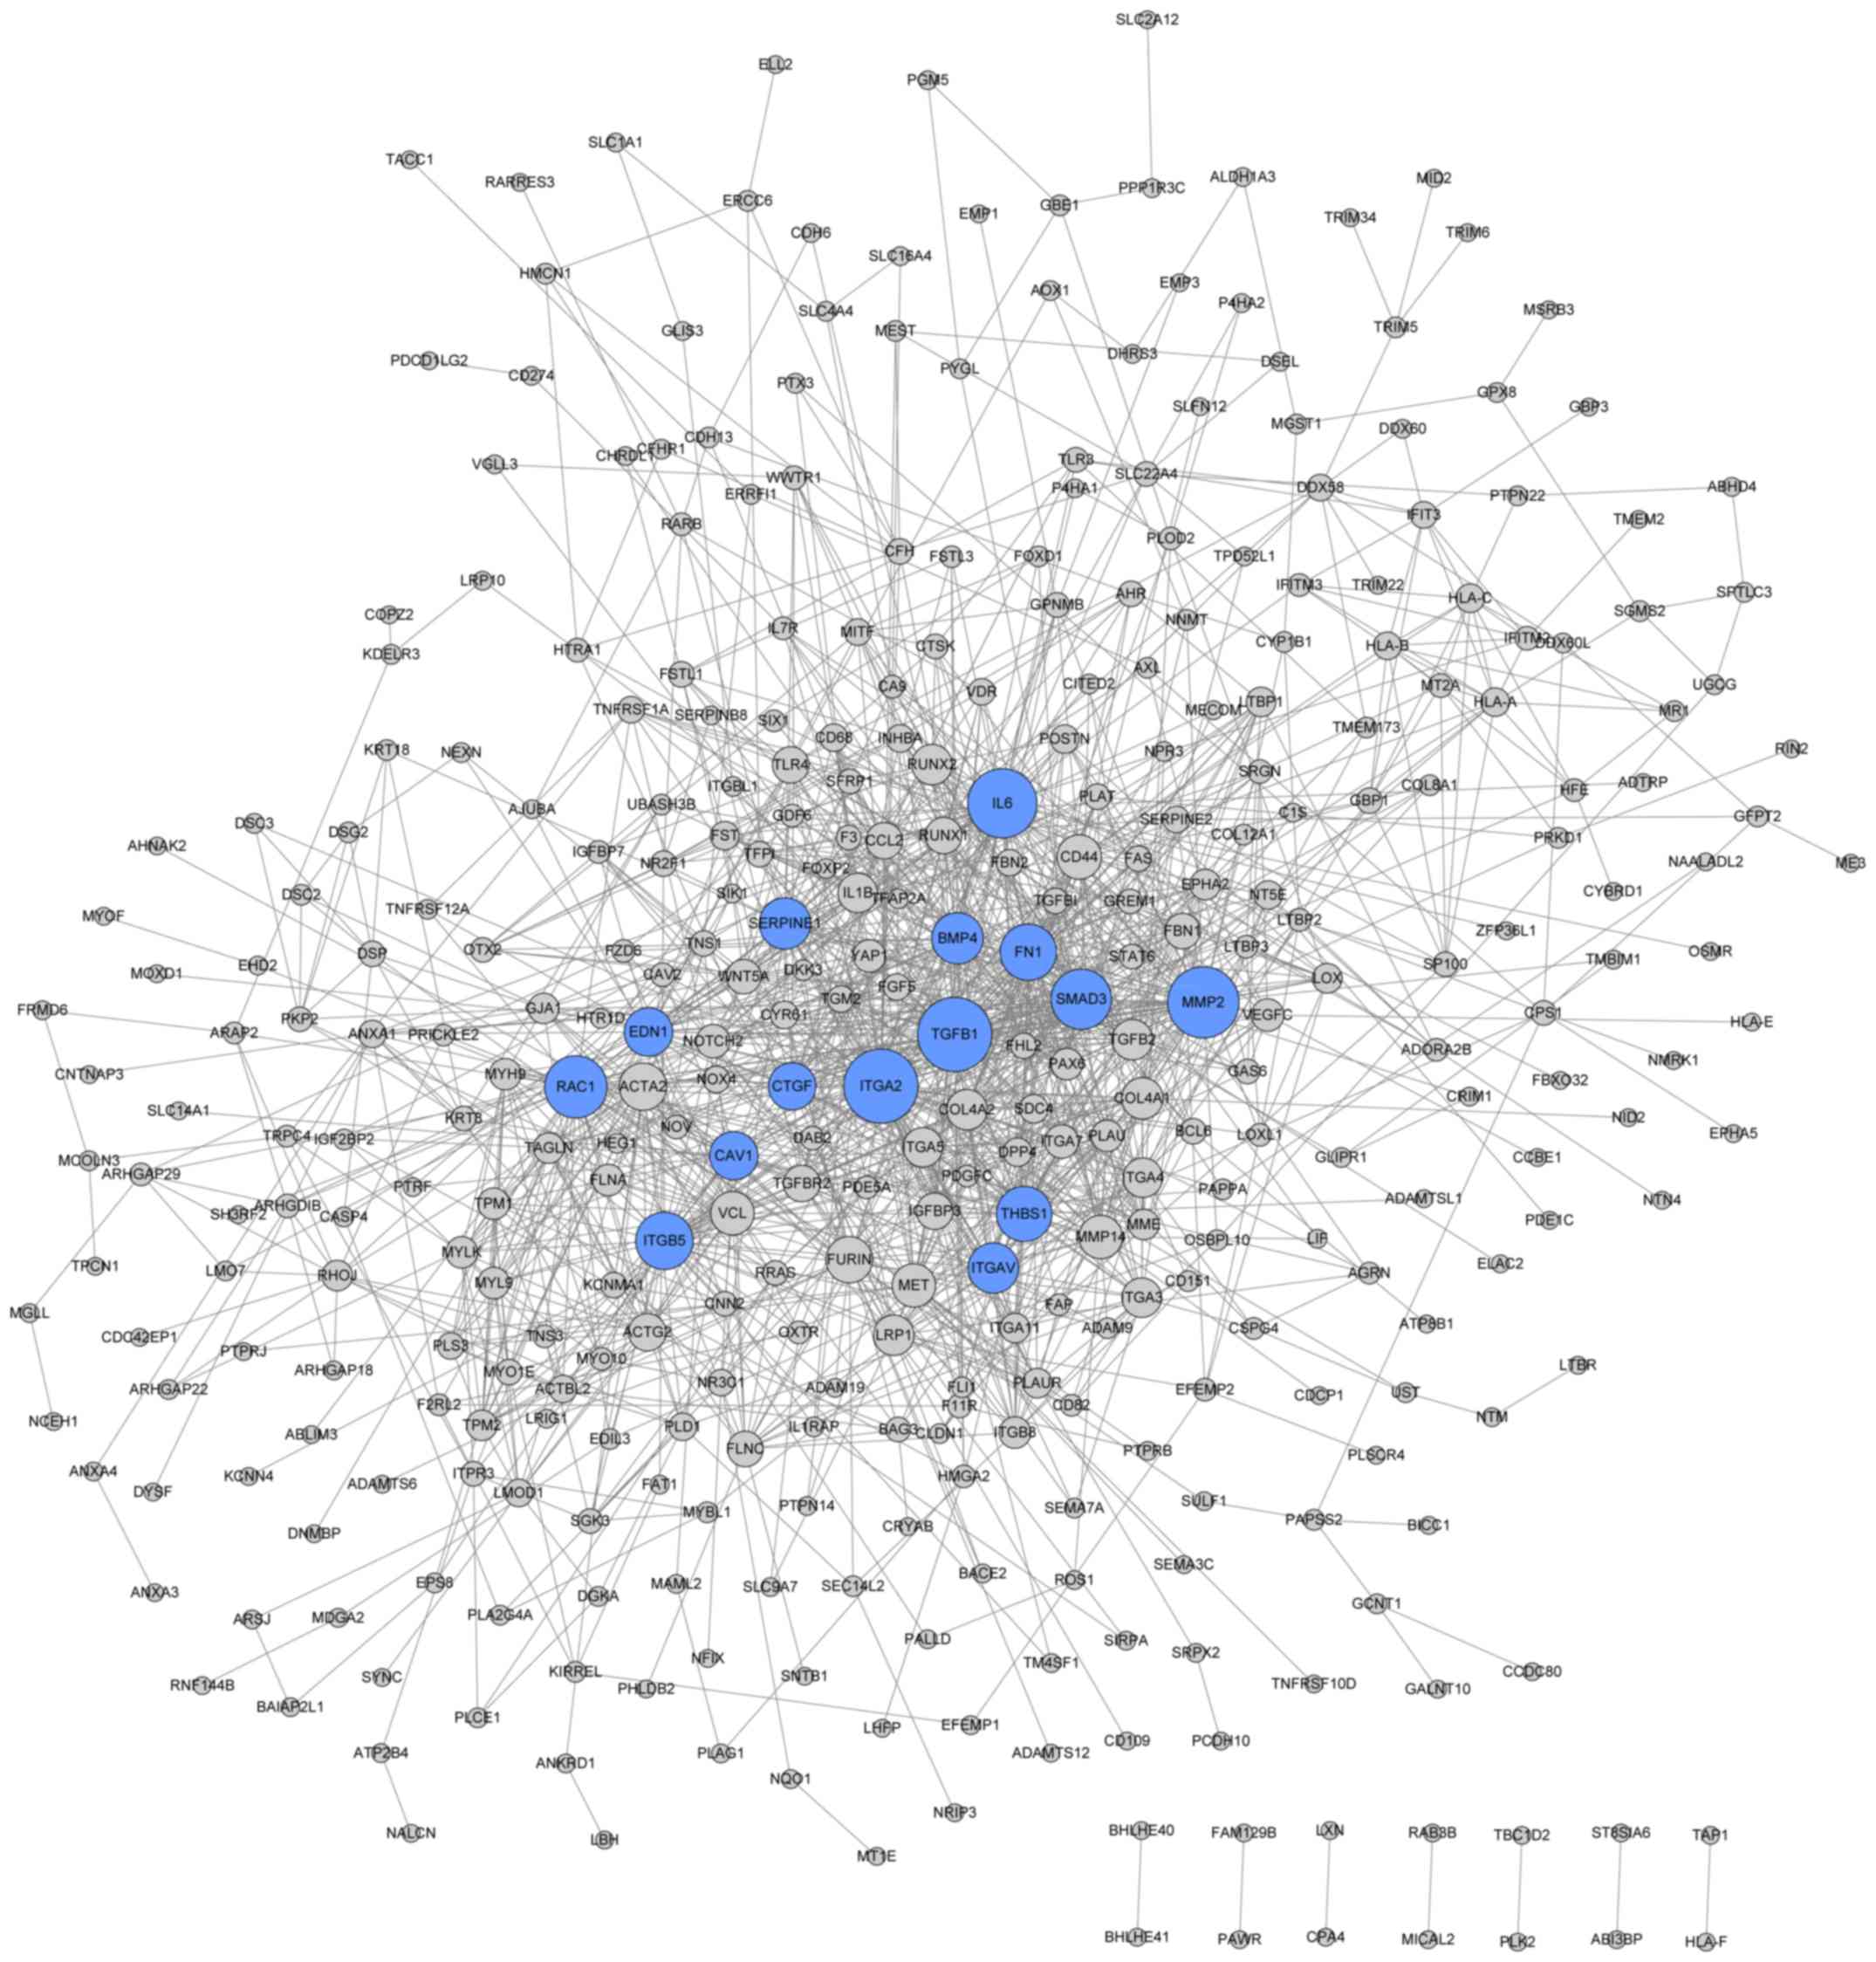
PPI network analysis
By analyzing the upregulated DEGs with the STRING
database, a PPI network of upregulated DEGs containing 210 nodes
and 346 edges was obtained (Fig.
3), whereas, 374 nodes and 1,389 edges were involved in the PPI
network of downregulated DEGs (Fig.
4). Based on the connectivity degree among the nodes, the top
20 nodes in the upregulated and downregulated PPI networks are
listed in Table III, including
MAPK10, TUBB2B, RAS like family 11 member B (RASL11B) and
ITGA2.
| Table III.Topological property scores for nodes
in the protein-protein interaction network, top 20 upregulated DEGs
and top 20 downregulated DEGs. |
Table III.
Topological property scores for nodes
in the protein-protein interaction network, top 20 upregulated DEGs
and top 20 downregulated DEGs.
| A, Upregulated
DEGs |
|---|
|
|---|
| Node | Degree |
|---|
| GNAO1 | 17 |
| ISL1 | 13 |
| MAPK10 | 13 |
| ASCL1 | 13 |
| RET | 13 |
| NPY | 12 |
| TUBB2B | 11 |
| GNG2 | 11 |
| CHGA | 11 |
| RASL11B | 10 |
| GATA3 | 10 |
| PTCH1 | 9 |
| PHOX2B | 9 |
| DDC | 9 |
| MAP2 | 8 |
| LGR5 | 8 |
| GATA2 | 8 |
| PHOX2A | 8 |
| HAND2 | 8 |
| PDE10A | 7 |
|
| B, Downregulated
DEGs |
|
| Node | Degree |
|
| ITGA2 | 58 |
| TGFB1 | 58 |
| MMP2 | 55 |
| IL6 | 53 |
| RAC1 | 46 |
| SMAD3 | 44 |
| ITGB5 | 41 |
| FN1 | 40 |
| THBS1 | 39 |
| BMP4 | 35 |
| SERPINE1 | 35 |
| ITGAV | 34 |
| EDN1 | 32 |
| CAV1 | 32 |
| CTGF | 31 |
| ACTA2 | 31 |
| FURIN | 30 |
| CD44 | 28 |
| MMP14 | 27 |
| MET | 27 |
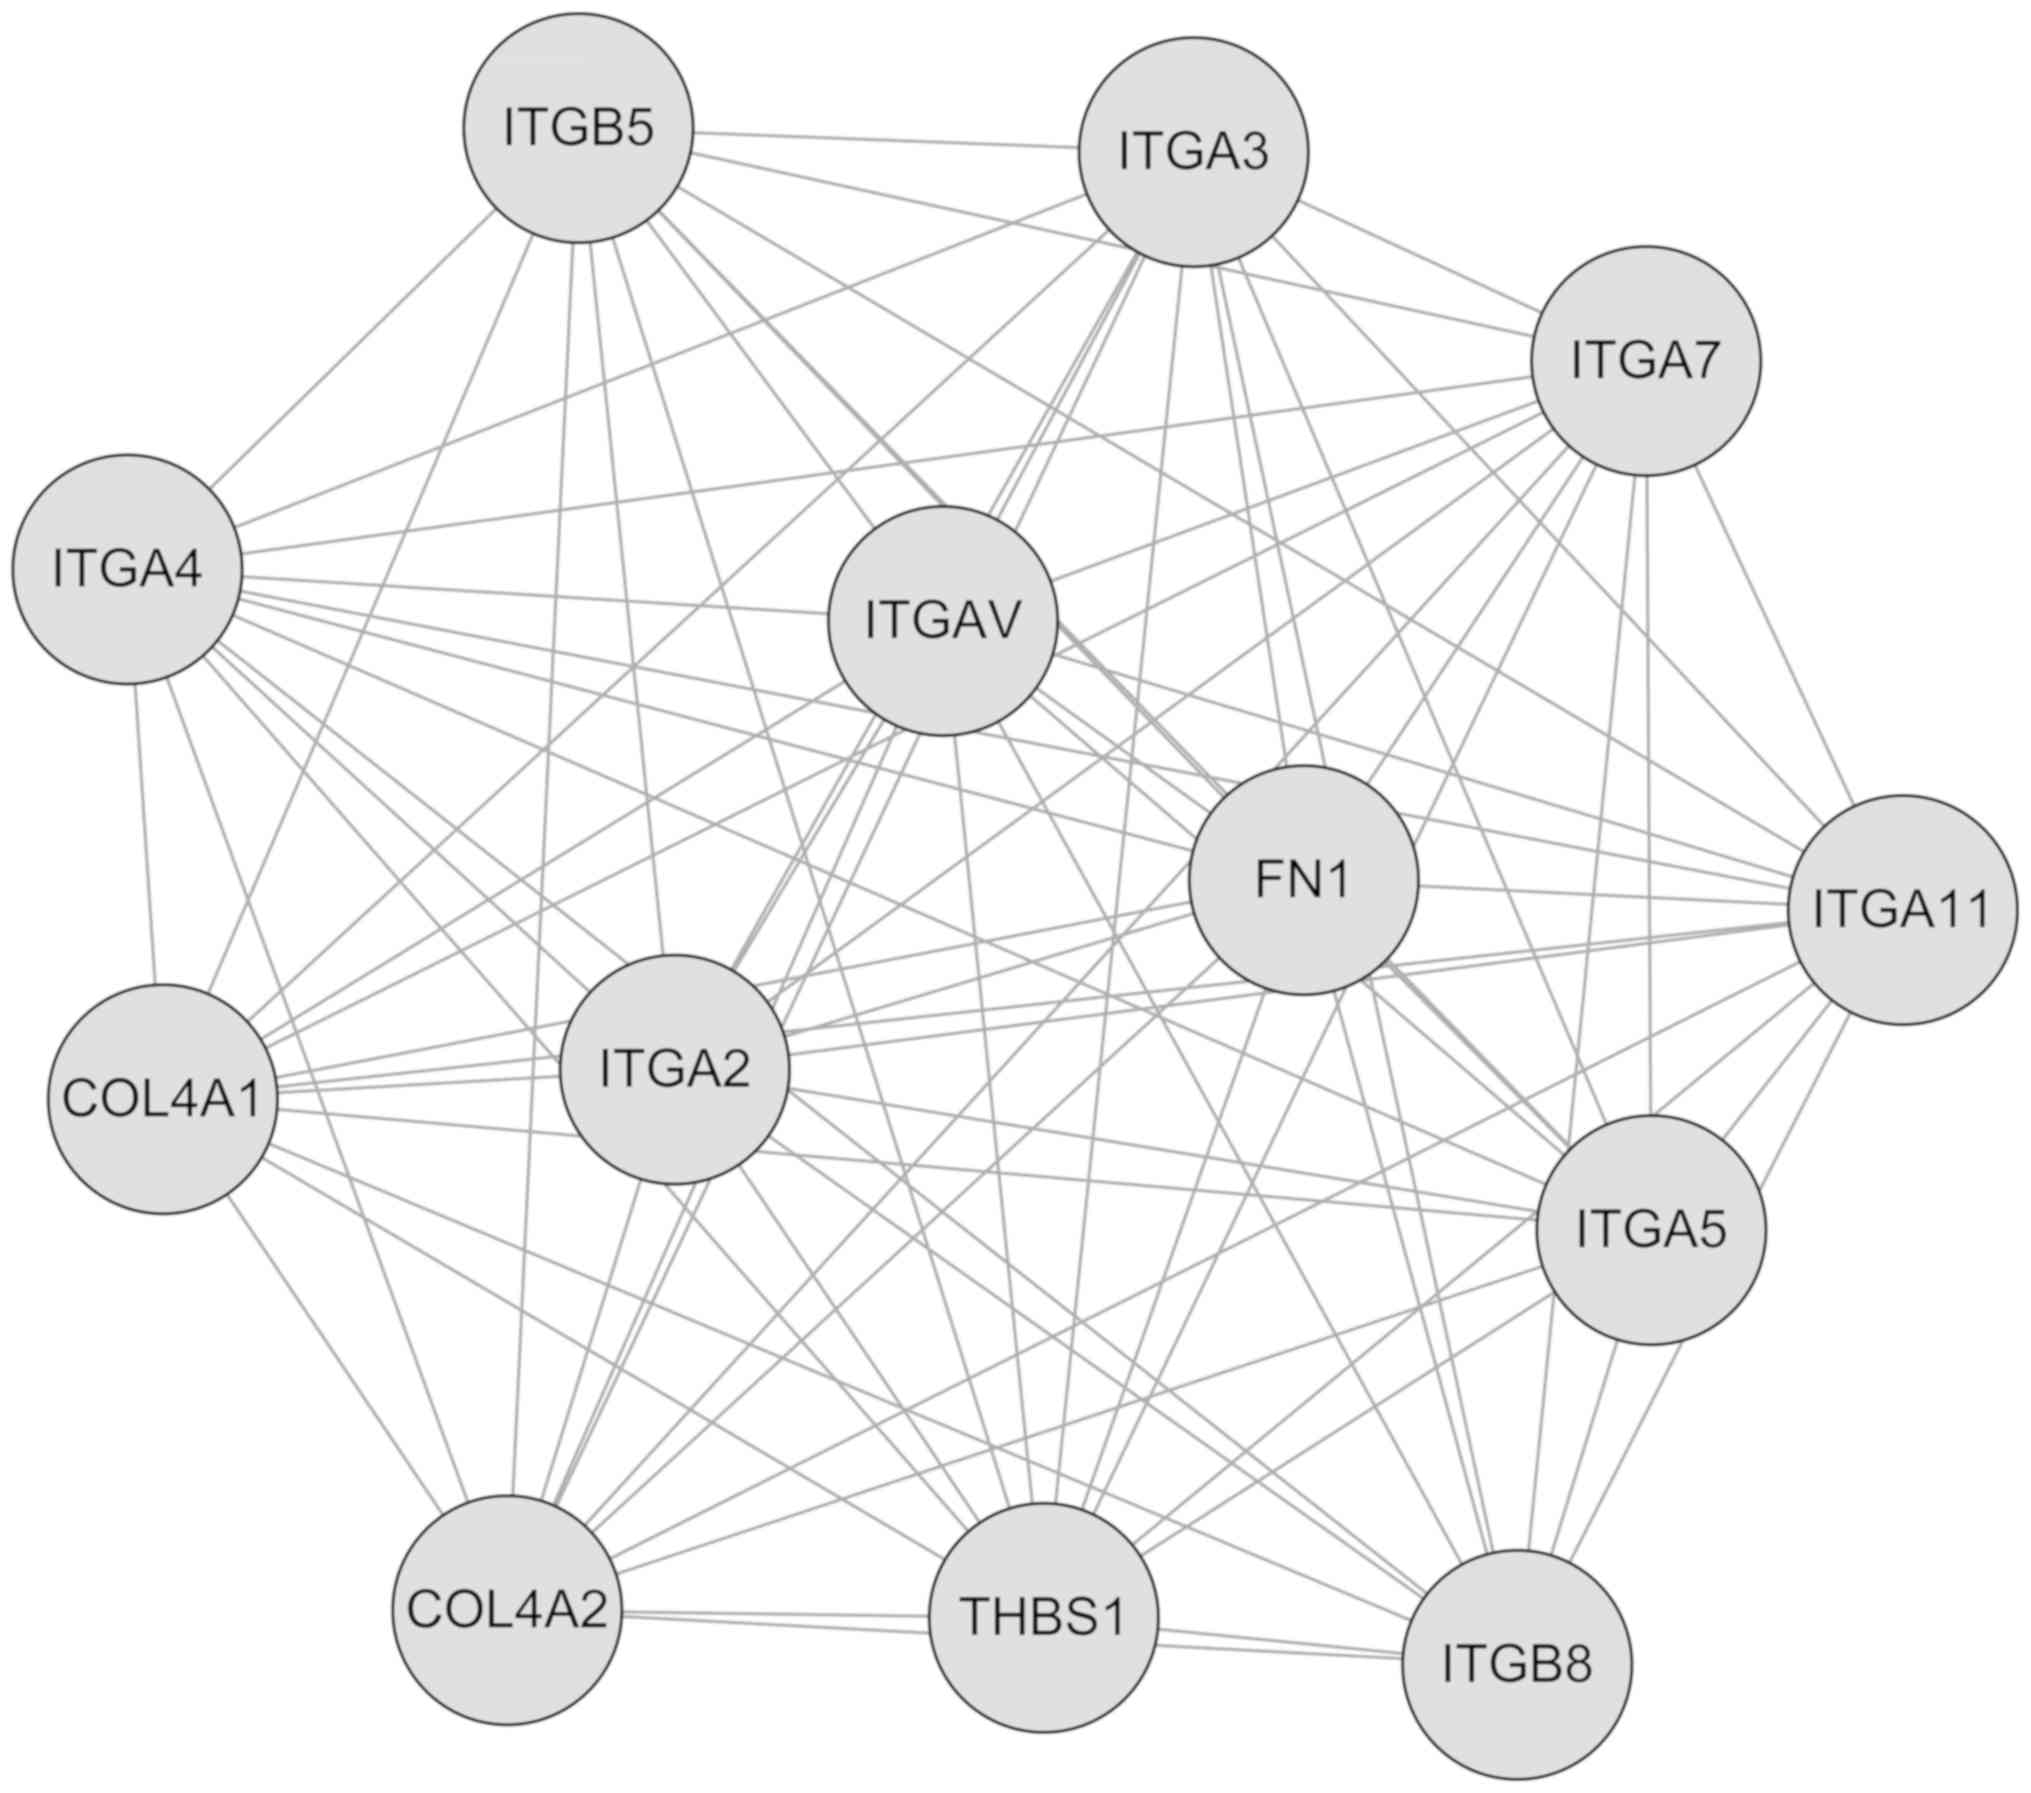
Module analysis
Using a cutoff of score >10, the module analysis
demonstrated that only one submodule (submodule 1) was obtained
from the downregulated PPI network, whereas no submodule from the
upregulated PPI network was obtained. The submodule 1 contained 13
nodes and 77 interactions (Fig.
5). Notably, the majority of nodes in this module belong to the
integrin α and β chain family.
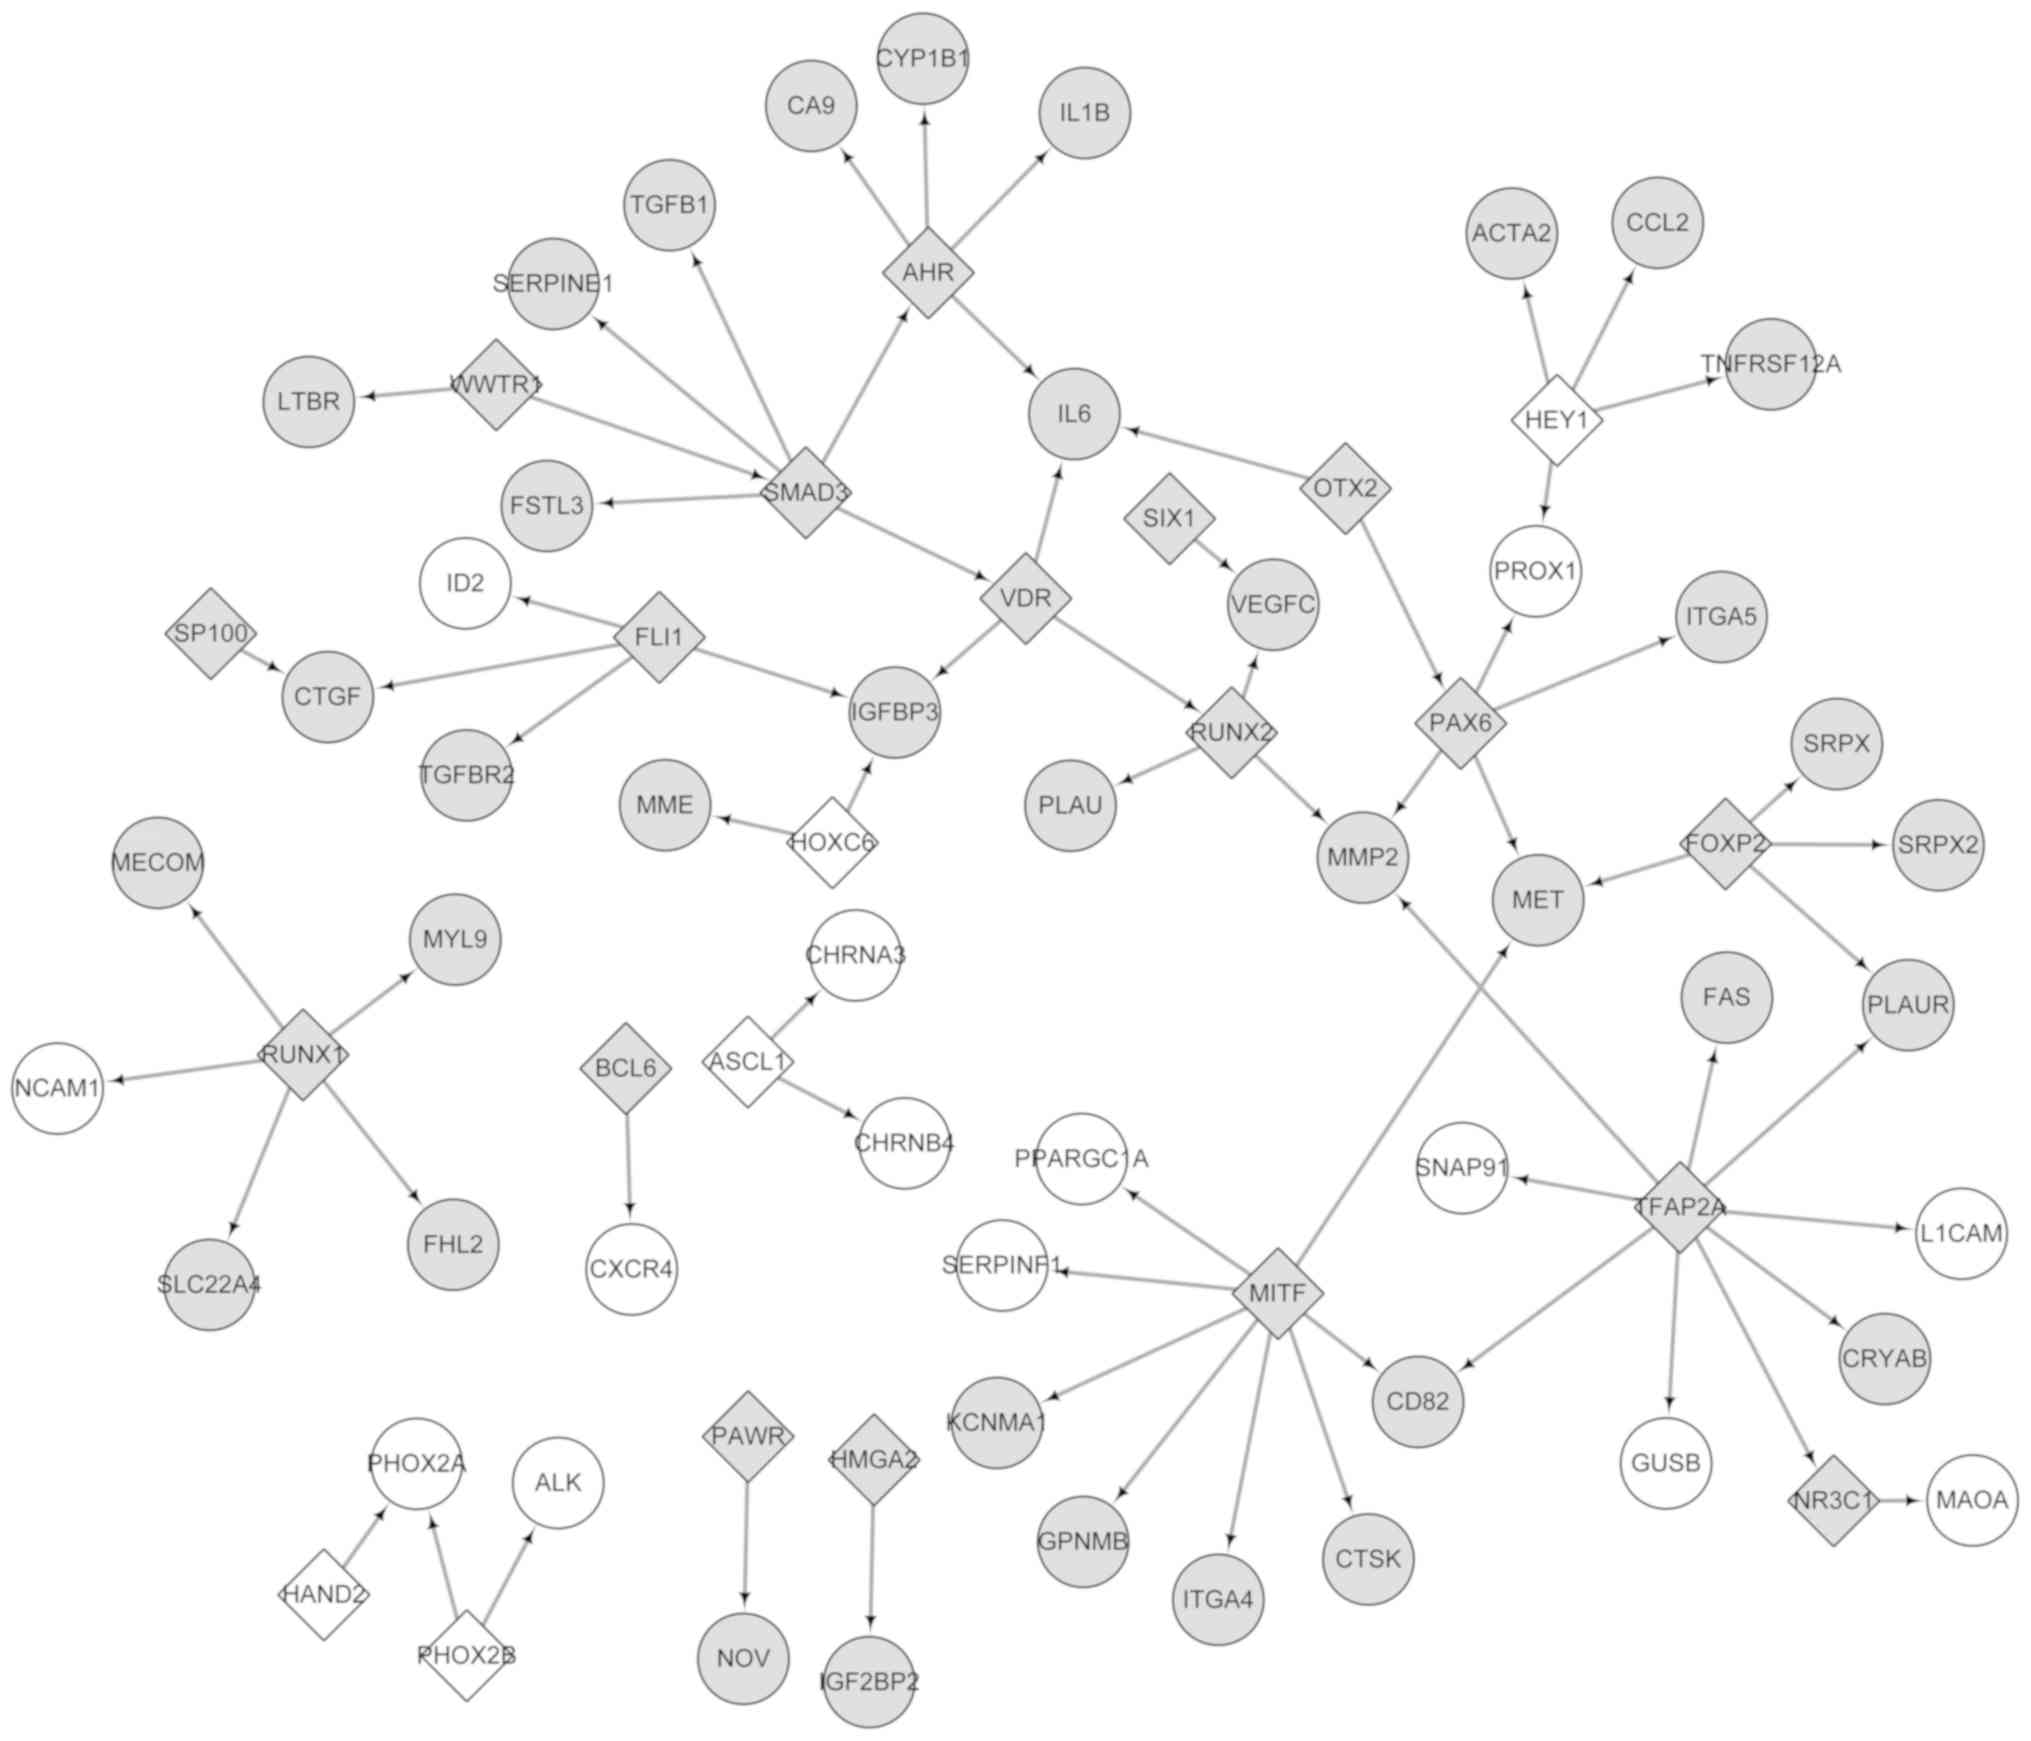
TF prediction and regulatory network
analysis
The DEGs were analyzed using the TRRUST database.
Subsequently, 23 DEGs were identified to be TFs. A TF-target
regulatory network consisting of 73 nodes (23 TFs and 50 DEGs) and
52 interaction associations, such as PHOX2B-ALK was constructed
(Fig. 6). The top 20 nodes with
high degrees are presented in Table
IV and include transcription factor AP-2 α, melanocyte inducing
transcription factor, SMAD family member 3 (SMAD3), runt related
transcription factor 1 and PHOX2B. Notably, SMAD3 and PHOX2B belong
to the top 20 DEGs in the PPI network. Additionally, the number of
downregulated TFs was higher compared with upregulated TFs.
| Table IV.Topological property scores for the
top 20 nodes in the TF-target regulatory network. |
Table IV.
Topological property scores for the
top 20 nodes in the TF-target regulatory network.
| A, Upregulated
DEGs |
|---|
|
|---|
| Node | Description | Degree |
|---|
| HEY1 | TF | 4 |
| PHOX2B | TF | 2 |
| HOXC6 | TF | 2 |
|
| B, Downregulated
DEGs |
|
| Node |
Description | Degree |
|
| TFAP2A | TF | 9 |
| MITF | TF | 8 |
| SMAD3 | TF | 6 |
| RUNX1 | TF | 5 |
| PAX6 | TF | 5 |
| AHR | TF | 5 |
| VDR | TF | 4 |
| RUNX2 | TF | 4 |
| FOXP2 | TF | 4 |
| FLI1 | TF | 4 |
| MMP2 | Target | 3 |
| MET | Target | 3 |
| IGFBP3 | Target | 3 |
| IL6 | Target | 3 |
| WWTR1 | TF | 2 |
| OTX2 | TF | 2 |
| NR3C1 | TF | 2 |
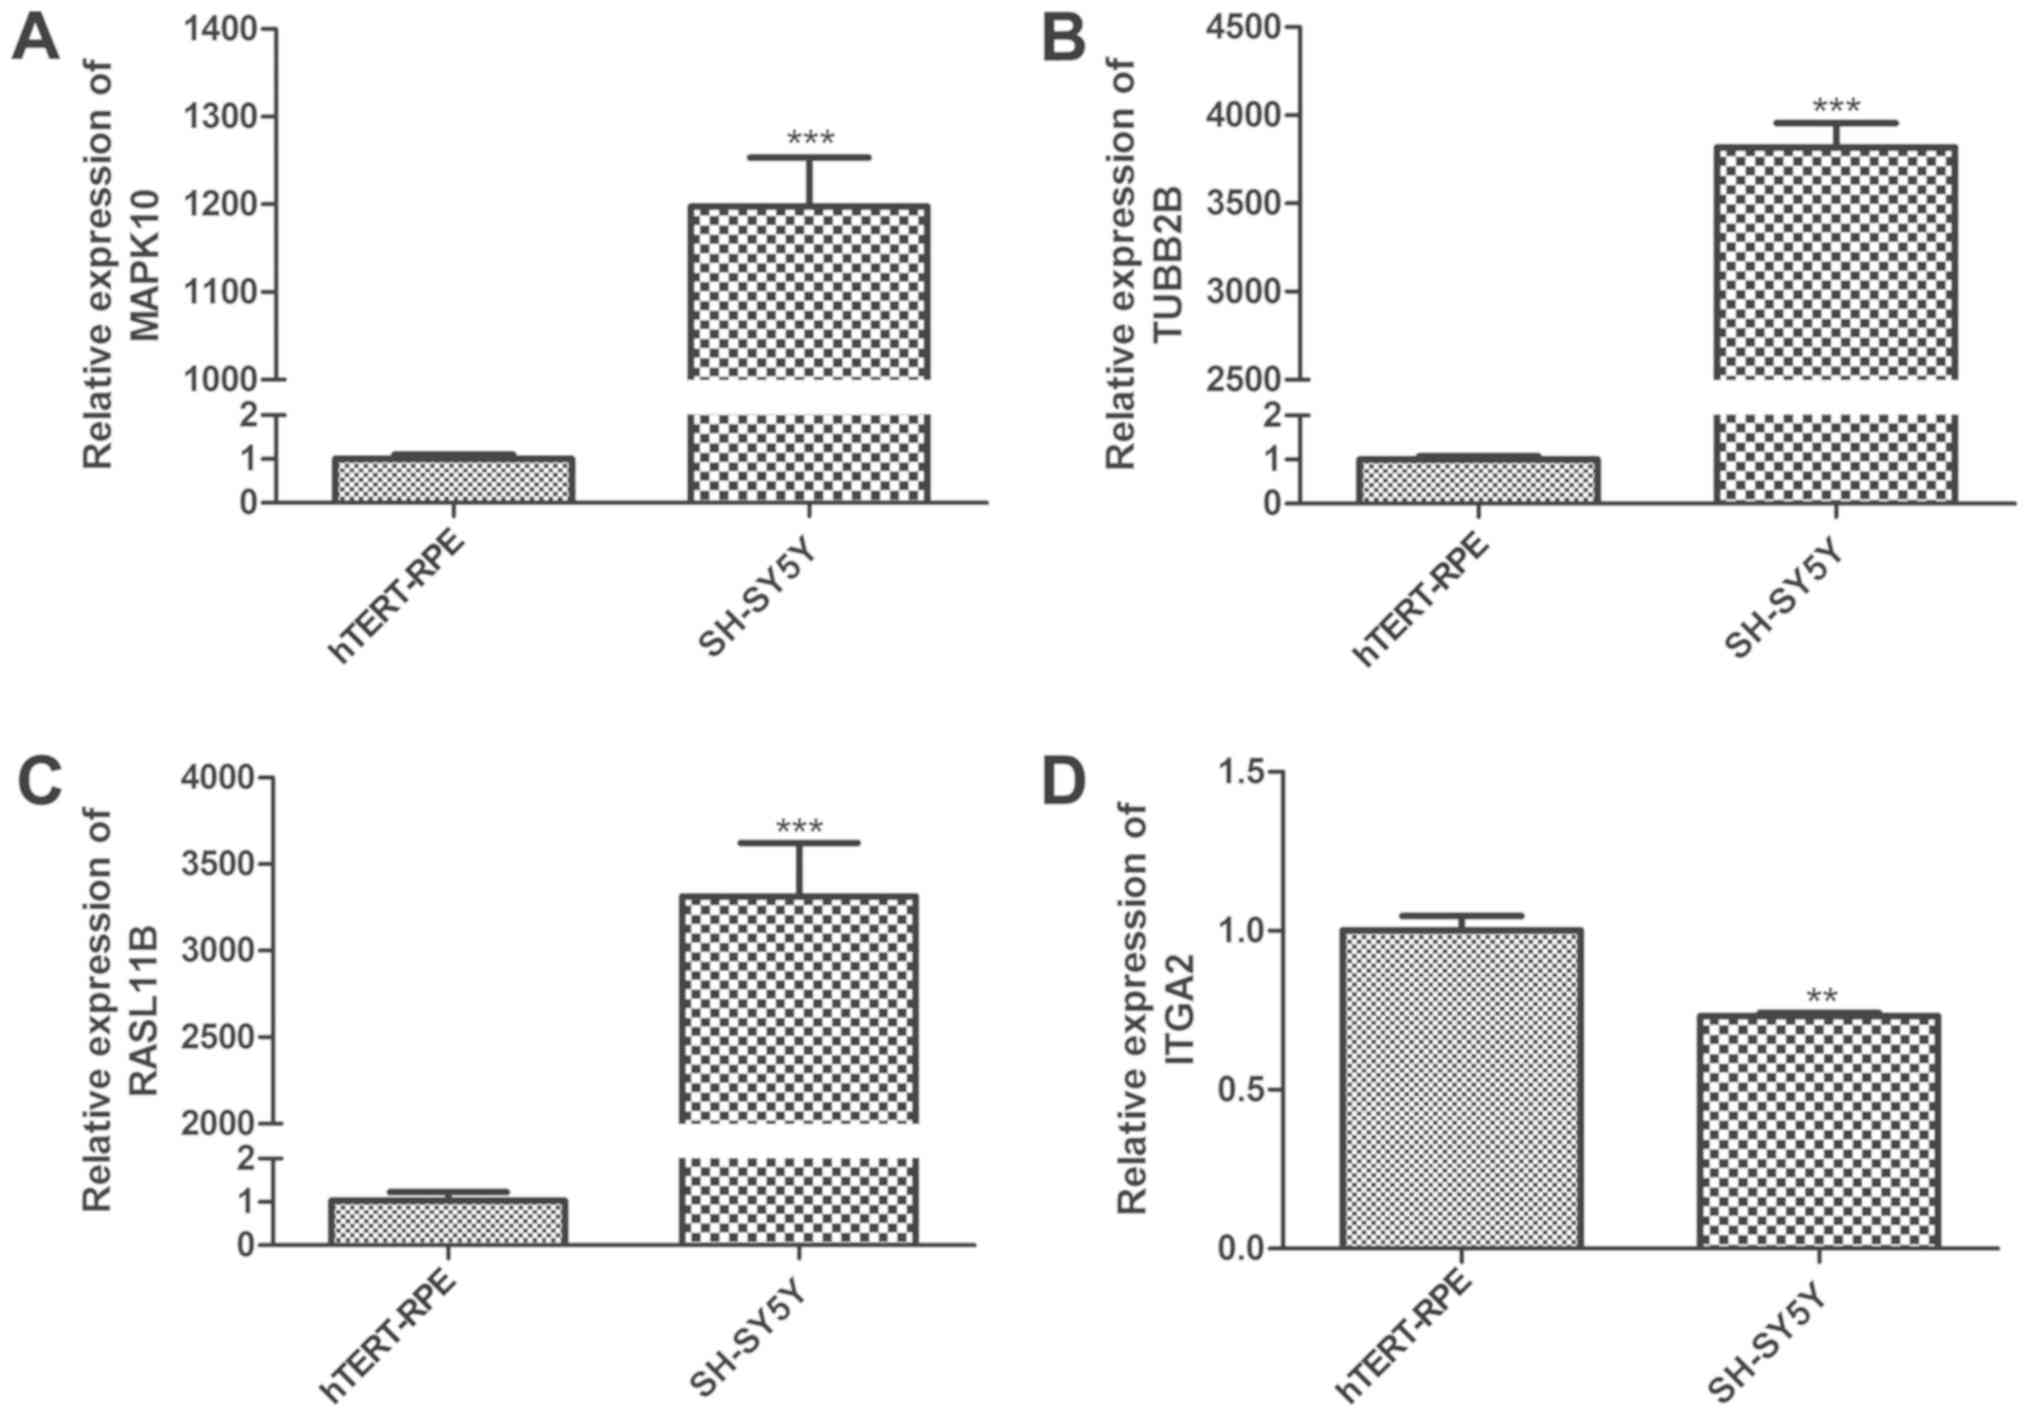
Validation of gene expression
RT-qPCR was conducted to test the expressions of
DEGs. A total of four DEGs were validated: ITGA2, MAPK10, TUBB2B
and RASL11B, which have not previously been associated with NB.
Compared with hTERT-RPE cells, MAPK10, TUBB2B and RASL11B exhibited
a significantly increased expression level in SH-SY5Y cells
(Fig. 7A-C). In contrast, the mRNA
expression level of ITGA2 was decreased in human SH-SY5Y cells
(Fig. 7D) compared with hTERT-RPE
cells. Notably, the RT-qPCR results confirmed the bioinformatics
analysis of DEGs in the GSE78061 dataset.
Discussion
In the present study, a set of 928 DEGs was
identified in NB cell lines compared with RPE cells lines, 386 DEGs
were upregulated and 542 DEGs were downregulated. Upregulated DEGs
were significantly associated with ‘neuron migration’ (including
PHOX2B and TUBB2B) and ‘dopaminergic synapse’ signaling pathways
(including MAPK10, DDC and GNG2). The majority of downregulated
DEGs were primarily involved in ‘focal adhesion’ (including ITGA2
and ITGA3). Additionally, the DEGs MAPK10, DDC, GNG2, PHOX2B,
TUBB2B, RASL11B, and ITGA2 were highlighted in the PPI networks.
Furthermore, based on regulatory associations reported in the
TRRUST database, PHOX2B was predicted to function as a TF upstream
of ALK in the regulatory network. The upregulation of MAPK10,
TUBB2B and RASL11B, and the downregulation of ITGA2 were detected
by RT-qPCR in NB SH-SY5Y cells, consistent with the present
bioinformatics analysis.
In the present study, a number of hub genes,
including MAPK10, DDC and GNG2, belonging to the upregulated PPI
networks, were predicted to be involved in the ‘dopaminergic
synapse’ signaling pathway. The majority of human NB cell lines,
including the SK-N-AS cell line, are dopaminergic NB cells and
exhibit characteristics of dopaminergic neurons (27). Additionally, ~80% of patients
diagnosed with NB exhibit increased expression levels of
catecholamine and its metabolites, including dopamine and
epinephrine, making these molecules promising tumor markers for
diagnosing NB (28). Therefore,
alterations in the dopamine expression levels mediated by its
associated signaling pathway may serve an important role in NB
development.
Similarly, DDC encodes for an enzyme
associated with dopamine synthesis and its expression was
demonstrated to be significantly increased in patients with NB
(29). Phospholipase Cη2 (PLCH2)
belongs to the PLC-η family, and is part of a crucial intracellular
signaling system associated with neurotransmitter signal
transduction, synapse formation and neuronal network formation;
however it is additionally involved in the development of NB and
other central nervous system-associated tumors (30). Notably, a previous study suggested
that PLCH2 was activated by GNG2 (31), and GNG2 was expressed in the fetal
tissues, adrenal gland and brain, regulating a series of
intracellular effectors, including ion channels and adenylyl
cyclase (32), which were
previously associated with NB (33,34).
Therefore, the present results, suggesting that DDC and GNG2 were
associated with NB, are consistent with the results of previous
studies.
Additionally, MAPK is a member of the
serine/threonine protein kinase family and serves crucial roles in
regulating neuronal processes at the cellular level, including
synaptic transmission, morphological differentiation and survival
(35). Furthermore, Morón et
al (36) suggested that MAPK
regulated dopamine transporters, modulating the concentration of
dopamine in the extracellular space. Furthermore, a previous study
demonstrated that MAPK10 was associated with the development of
cancer (37). Notably, MAPK10 and
MAPK9 serve important roles in the death of dopamine neurons of the
substantia nigra (38). Similarly,
a previous study demonstrated that activation of the MAPK/Jun
proto-oncogene (Jun) signaling pathway induced apoptosis in SK-N-SH
NB cells by regulating the targets of the adaptor related protein
complex 1 complex (39). MAPK10,
as a MAPK family member, is additionally involved in the MAPK/Jun
signaling pathway. Therefore, MAPK10 may be associated with the
progression of NB by serving a role in the dopaminergic synapse and
MAPK/Jun signaling pathways. As expected, the expression level of
MAPK10 was significantly higher in human NB SH-SY5Y cell lines
compared with hTERT-RPE cell lines.
In the present study, it was identified that TUBB2B
and RASL11B were significantly upregulated in human NB SH-SY5Y
cells. TUBB2B, a principal component of microtubules, is
synthesized in axons and is involved in neuronal migration
(40). TUBB2B served an essential
role in the neural development system and served as a primary
neuron marker (41). TUBB2B was
identified to be upregulated in the brain cortex tissues of a
microtubule associated protein τ (MAPT) transgenic mouse model of
Alzheimer's disease, suggesting an interaction between MAPT and
TUBB2B (42). Notably,
hyperphosphorylated MAPT during mitosis is associated with aberrant
cell-cycle-dependent kinase activity in the NB cell line SH-SY5Y
(43). Therefore, in the present
study it was hypothesized that the dysregulation of TUBB2B may be
responsible for aberrant neuronal migration and abnormal cell cycle
during the development of NB. RASL11B belongs to the small GTPase
family and Ras subfamily, and serves as a tumor suppressor gene
(44). Additionally, RASL11B was
demonstrated to be associated with inflammation and cancer through
involvement of transforming growth factor-β1-mediated processes
(45). Therefore, RASL11B may be
associated with the development of NB. However, further studies are
required to investigate its molecular mechanism in NB.
In the TF-target regulatory network, a regulatory
association between PHOX2B (upregulated DEG) and anaplastic
lymphoma receptor tyrosine kinase (ALK; upregulated DEG) was
predicted. Upregulation of PHOX2B is associated with MYCN
proto-oncogene, bHLH transcription factor (MYCN), and it was
demonstrated to contribute to NB cell proliferation (46). Additionally, upregulation of MYCN
is a primary cause of NB progression (46). Notably, Bachetti et al
(47) identified a correlation
between the expression levels of PHOX2B and ALK, by performing
small interfering RNA silencing and overexpression experiments. In
contrast, ITGA2, which exhibited the highest connectivity degree in
the downregulated PPI network, was predicted to be associated with
NB. ITGA2 is a member of the cell adhesion receptor family and is
crucial for the cell proliferation, metastasis and apoptosis of
solid tumors (48). It has been
suggested that decreased expression levels of ITAG2 and ITAG3 are
inversely correlated with MYCN expression in NB cell lines
(49). The present results
suggested that ITGA2 and ITGA3 which were present in the GO terms
of ‘extracellular matrix’ and ‘focal adhesion’ pathways, were
significantly downregulated in NB cell lines. Additionally, the
present experimental data demonstrated that ITGA2 expression was
significantly decreased in SH-SY5Y NB cells. Therefore, PHOX2B,
ALK, ITGA2 and ITGA3 may be useful therapeutic targets for NB.
In the present study, although numerous genes were
selected, only a limited number of genes (including MAPK10, DDC,
GNG2, PHOX2B, TUBB2B and RASL11B) were discussed due to the fact
that multiple genes identified in the present analysis [including
GATA3, Microtubule-associated protein 2 (MAP2), Chromogranin A
(CHGA) and NPY] have been previously observed to be associated with
the development of NB. GATA3 serves a crucial role in the
regulation of cell differentiation and proliferation of SK-N-SH NB
cells (50). MAP2 synthesis is
increased in NB2a cells, which exhibit dendritic properties in
terms of morphology and preferential distribution of MAP2 (51). A previous study demonstrated that
CHGA and NPY serve as NB tumor gene markers and are involved in the
metastasis of NB cells (52).
Notably, these previous findings supported the results of the
present study.
However, there were numerous limitations of the
present study. Due to the low incidence of NB and the limited
possibilities of hospitals in sharing tissues of patients, there
were not enough NB tissue samples to be collected in a short-term,
in order to perform gene expression validation. Furthermore, NB
originates from sympathetic ganglia near the spinal cord and within
the adrenal medulla (53).
However, hTERT-RPE cells are not part of this tissue, thus
hTERT-RPE cells are not the optimal control. This cell line was
selected as control cells in the GSE78061 dataset and no
appropriate alternative cells were considered. The hTERT-RPE cell
line was selected as the control for experiment validation, in
order to be consistent with the GSE78061 dataset. Furthermore, due
to insufficient funds, the experimental validation was not
conducted in additional cell lines. The present findings require
confirmation using additional cell lines and the analysis of a
sufficient number of NB and normal tissue or adjacent tissue
samples.
Collectively, a total of 386 upregulated and 542
downregulated DEGs were identified in NB cell lines. Additionally,
MAPK10, DDC, GNG2, PHOX2B, TUBB2B, RASL11B, ITGA2 and ITGA3, which
exhibit high connectivity degrees in the PPI networks, may
contribute to NB pathogenesis. Furthermore, a novel significant
association between the increased expression levels of MAPK10,
TUBB2B and RASL11B, and NB was identified.
Acknowledgements
Not applicable.
Funding
No funding was received.
Availability of data and materials
The datasets analyzed during the current study are
available in the GEO repository (www.ncbi.nlm.nih.gov/geo/query/acc.cgi?acc=GSE78061).
Authors' contributions
JTL contributed to the study design, data collection
and writing of the manuscript. YLL contributed to the data
interpretation and discussion. All authors read and approved the
final manuscript.
Ethics approval and consent to
participate
Not applicable.
Patient consent for publication
Not applicable.
Competing interests
The authors declare that they have no competing
interests.
References
|
1
|
Shohet J and Foster J: Neuroblastoma. BMJ.
357:j18632017. View Article : Google Scholar : PubMed/NCBI
|
|
2
|
Abo-Elenain A, Naiem Y, Hamedhosam-Eldin
Hotmail Com H, Emam M, Elkashef W and AbdelRafee A: Right adrenal
gland neuroblastoma infiltrating the liver and mimicking
mesenchymal hamartoma: A case report. Int J Surg Case Rep.
12:95–98. 2015. View Article : Google Scholar : PubMed/NCBI
|
|
3
|
Park JR, Eggert A and Caron H:
Neuroblastoma: Biology, prognosis, and treatment. Pediatr Clin
North Am. 5597–120. (x)2008. View Article : Google Scholar : PubMed/NCBI
|
|
4
|
Castleberry RP, Shuster JJ and Smith EI:
The Pediatric Oncology Group experience with the international
staging system criteria for neuroblastoma. Member Institutions of
the Pediatric Oncology Group. J Clin Oncol. 12:2378–2381. 1994.
View Article : Google Scholar : PubMed/NCBI
|
|
5
|
Tonini GP: Growth, progression and
chromosome instability of Neuroblastoma: A new scenario of
tumorigenesis? BMC Cancer. 17:202017. View Article : Google Scholar : PubMed/NCBI
|
|
6
|
Galli S, Naranjo A, Van Ryn C, Tilan JU,
Trinh E, Yang C, Tsuei J, Hong SH, Wang H, Izycka-Swieszewska E, et
al: Neuropeptide Y as a biomarker and therapeutic target for
neuroblastoma. Am J Pathol. 186:3040–3053. 2016. View Article : Google Scholar : PubMed/NCBI
|
|
7
|
Lee SG, Jeon HY, Su ZZ, Richards JE,
Vozhilla N, Sarkar D, Van Maerken T and Fisher PB: Astrocyte
elevated gene-1 contributes to the pathogenesis of neuroblastoma.
Oncogene. 28:2476–2484. 2009. View Article : Google Scholar : PubMed/NCBI
|
|
8
|
Brunen D, de Vries RC, Lieftink C,
Beijersbergen RL and Bernards R: PIM kinases are a potential
prognostic biomarker and therapeutic target in neuroblastoma. Mol
Cancer Ther. 17:849–857. 2018. View Article : Google Scholar : PubMed/NCBI
|
|
9
|
Galinski B, Luxemburg M, Ewart M,
Landesman Y and Weiser D: Abstract 1938: Exportin-1 (XPO1) is a
novel therapeutic biomarker for patients with neuroblastoma. Cancer
Res. 77:1938. 2017.
|
|
10
|
Cui X, Yang Y, Jia D, Jing Y, Zhang S,
Zheng S, Cui L, Dong R and Dong K: Downregulation of bone
morphogenetic protein receptor 2 promotes the development of
neuroblastoma. Biochem Biophys Res Commun. 483:609–616. 2017.
View Article : Google Scholar : PubMed/NCBI
|
|
11
|
Ishizuka Y, Koshinaga T, Hirano T,
Nagasaki-Maeoka E, Watanabe Y, Hoshi R, Yoshizawa S, Sugito K,
Kawashima H, Uekusa S, et al: NRP1 knockdown promotes the migration
and invasion of human neuroblastoma-derived SKNAS cells via the
activation of β1 integrin expression. Int J Oncol. 53:159–166.
2018.PubMed/NCBI
|
|
12
|
Mei Z, Yan P, Wang Y, Liu S and He F:
Knockdown of zinc transporter ZIP8 expression inhibits
neuroblastoma progression and metastasis in vitro. Mol Med Rep.
18:477–485. 2018.PubMed/NCBI
|
|
13
|
Irshad S, Pedley RB, Anderson J, Latchman
DS and Budhram-Mahadeo V: The Brn-3b transcription factor regulates
the growth, behavior and invasiveness of human neuroblastoma cells
in vitro and in vivo. J Biol Chem. 290:21617–21627. 2015.
View Article : Google Scholar
|
|
14
|
Souzaki R, Tajiri T, Souzaki M, Kinoshita
Y, Tanaka S, Kohashi K, Oda Y, Katano M and Taguchi T: Hedgehog
signaling pathway in neuroblastoma differentiation. J Pediatr Surg.
45:2299–2304. 2010. View Article : Google Scholar : PubMed/NCBI
|
|
15
|
Hart LS, Rader J, Raman P, Batra V,
Russell MR, Tsang M, Gagliardi M, Chen L, Martinez D, Li Y, et al:
Preclinical therapeutic synergy of MEK1/2 and CDK4/6 inhibition in
neuroblastoma. Clin Cancer Res. 23:1785–1796. 2017. View Article : Google Scholar : PubMed/NCBI
|
|
16
|
Carvalho BS and Irizarry RA: A framework
for oligonucleotide microarray preprocessing. Bioinformatics.
26:2363–2367. 2010. View Article : Google Scholar : PubMed/NCBI
|
|
17
|
Irizarry RA, Hobbs B, Collin F,
Beazer-Barclay YD, Antonellis KJ, Scherf U and Speed TP:
Exploration, normalization, and summaries of high density
oligonucleotide array probe level data. Biostatistics. 4:249–264.
2003. View Article : Google Scholar : PubMed/NCBI
|
|
18
|
Smyth GK, Ritchie M, Thorne N and
Wettenhall J: LIMMA: Linear models for microarray data. In:
Bioinformatics and Computational Biology Solutions Using R and
BioconductorSBH; 2005
|
|
19
|
Hulsegge I, Kommadath A and Smits MA:
Globaltest and GOEAST: Two different approaches for Gene Ontology
analysis. BMC Proc. 3 (Suppl 4):S102009. View Article : Google Scholar : PubMed/NCBI
|
|
20
|
Kanehisa M and Goto S: KEGG: Kyoto
encyclopedia of genes and genomes. Nucleic Acids Res. 28:27–30.
2000. View Article : Google Scholar : PubMed/NCBI
|
|
21
|
Dennis G Jr, Sherman BT, Hosack DA, Yang
J, Gao W, Lane HC and Lempicki RA: DAVID: Database for annotation,
visualization, and integrated discovery. Genome Biol. 4:P32003.
View Article : Google Scholar : PubMed/NCBI
|
|
22
|
Szklarczyk D, Franceschini A, Kuhn M,
Simonovic M, Roth A, Minguez P, Doerks T, Stark M, Muller J, Bork
P, et al: The STRING database in 2011: Functional interaction
networks of proteins, globally integrated and scored. Nucleic Acids
Res 39 (Database Issue). D561–D568. 2011. View Article : Google Scholar
|
|
23
|
Shannon P, Markiel A, Ozier O, Baliga NS,
Wang JT, Ramage D, Amin N, Schwikowski B and Ideker T: Cytoscape: A
software environment for integrated models of biomolecular
interaction networks. Genome Res. 13:2498–2504. 2003. View Article : Google Scholar : PubMed/NCBI
|
|
24
|
Bader GD and Hogue CW: An automated method
for finding molecular complexes in large protein interaction
networks. BMC Bioinformatics. 4:22003. View Article : Google Scholar : PubMed/NCBI
|
|
25
|
Han H, Shim H, Shin D, Shim JE, Ko Y, Shin
J, Kim H, Cho A, Kim E, Lee T, et al: TRRUST: A reference database
of human transcriptional regulatory interactions. Sci Rep.
5:114322015. View Article : Google Scholar : PubMed/NCBI
|
|
26
|
Livak KJ and Schmittgen TD: Analysis of
relative gene expression data using real-time quantitative PCR and
the 2(-Delta Delta C(T)) method. Methods. 25:402–408. 2001.
View Article : Google Scholar : PubMed/NCBI
|
|
27
|
Norabuena E: Characterization of a human
neuroblastoma cell line and its differentiation into dopamine
neurons (unpublished PhD thesis)Mount Holyoke College; 2012
|
|
28
|
Candito M, Thyss A, Albertini M, Deville
A, Politano S, Mariani R and Chambon P: Methylated catecholamine
metabolites for diagnosis of neuroblastoma. Med Pediatr Oncol.
20:215–220. 1992. View Article : Google Scholar : PubMed/NCBI
|
|
29
|
Bozzi F, Luksch R, Collini P, Gambirasio
F, Barzanò E, Polastri D, Podda M, Brando B and Fossati-Bellani F:
Molecular detection of dopamine decarboxylase expression by means
of reverse transcriptase and polymerase chain reaction in bone
marrow and peripheral blood: Utility as a tumor marker for
neuroblastoma. Diagn Mol Pathol. 13:135–143. 2004. View Article : Google Scholar : PubMed/NCBI
|
|
30
|
Lo Vasco VR: 1p36.32 rearrangements and
the role of PI-PLC η2 in nervous tumours. J Neurooncol.
103:409–416. 2011. View Article : Google Scholar : PubMed/NCBI
|
|
31
|
Zhou Y, Wing MR, Sondek J and Harden TK:
Molecular cloning and characterization of PLC-eta2. Biochem J.
391:667–676. 2005. View Article : Google Scholar : PubMed/NCBI
|
|
32
|
Modarressi MH, Taylor KE and Wolfe J:
Cloning, characterization, and mapping of the gene encoding the
human G protein gamma 2 subunit. Biochem Biophys Res Commun.
272:610–615. 2000. View Article : Google Scholar : PubMed/NCBI
|
|
33
|
Shuba YM, Teslenko VI, Savchenko AN and
Pogorelaya NH: The effect of permeant ions on single calcium
channel activation in mouse neuroblastoma cells: Ion-channel
interaction. J Physiol. 443:25–44. 1991. View Article : Google Scholar : PubMed/NCBI
|
|
34
|
Barton AC and Sibley DR: Agonist-induced
desensitization of D1-dopamine receptors linked to adenylyl cyclase
activity in cultured NS20Y neuroblastoma cells. Mol Pharmacol.
38:531–541. 1990.PubMed/NCBI
|
|
35
|
Fukunaga K and Miyamoto E: Role of MAP
kinase in neurons. Mol Neurobiol. 16:79–95. 1998. View Article : Google Scholar : PubMed/NCBI
|
|
36
|
Morón JA, Zakharova I, Ferrer JV, Merrill
GA, Hope B, Lafer EM, Lin ZC, Wang JB, Javitch JA, Galli A and
Shippenberg TS: Mitogen-activated protein kinase regulates dopamine
transporter surface expression and dopamine transport apacity. J
Neurosci. 23:8480–8488. 2003. View Article : Google Scholar : PubMed/NCBI
|
|
37
|
Wagner EF and Nebreda AR: Signal
integration by JNK and p38 MAPK pathways in cancer development. Nat
Rev Cancer. 9:537–549. 2009. View
Article : Google Scholar : PubMed/NCBI
|
|
38
|
Ries V, Silva RM, Oo TF, Cheng HC,
Rzhetskaya M, Kholodilov N, Flavell RA, Kuan CY, Rakic P and Burke
RE: JNK2 and JNK3 combined are essential for apoptosis in dopamine
neurons of the substantia nigra, but are not required for axon
degeneration. J Neurochem. 107:1578–1588. 2008. View Article : Google Scholar : PubMed/NCBI
|
|
39
|
Herdman ML, Marcelo A, Ying H, Niles RM,
Dhar S and Kiningham KK: Thimerosal Induces Apoptosis in a
Neuroblastoma Model via the cJun N-terminal kinase pathway. Toxicol
Sci. 92:246–253. 2006. View Article : Google Scholar : PubMed/NCBI
|
|
40
|
Uribe V: The beta-tubulin gene TUBB2B is
involved in a large spectrum of neuronal migration disorders. Clin
Genet. 77:34–35. 2010. View Article : Google Scholar : PubMed/NCBI
|
|
41
|
Xu Y, Xu C, Kato A, Tempel W, Abreu JG,
Bian C, Hu Y, Hu D, Zhao B, Cerovina T, et al: Tet3 CXXC domain and
dioxygenase activity cooperatively regulate key genes for xenopus
eye and neural development. Cell. 151:1200–1213. 2012. View Article : Google Scholar : PubMed/NCBI
|
|
42
|
Chang SH, Jung IS, Han GY, Kim NH, Kim HJ
and Kim CW: Proteomic profiling of brain cortex tissues in a Tau
transgenic mouse model of Alzheimer's disease. Biochem Biophys Res
Commun. 430:670–675. 2013. View Article : Google Scholar : PubMed/NCBI
|
|
43
|
Pope WB, Lambert MP, Leypold B, Seupaul R,
Sletten L, Krafft G and Klein WL: Microtubule-associated protein
tau is hyperphosphorylated during mitosis in the human
neuroblastoma cell line SH-SY5Y. Exp Neurol. 126:185–194. 1994.
View Article : Google Scholar : PubMed/NCBI
|
|
44
|
Lorkowski S: RASL11B (RAS-like, family 11,
member B). Atlas Genet Cytogenet Oncol Haematol. 14:747–750.
2010.
|
|
45
|
Stolle K, Schnoor M, Fuellen G, Spitzer M,
Cullen P and Lorkowski S: Cloning, genomic organization, and
tissue-specific expression of the RASL11B gene. Biochim Biophys
Acta. 1769:514–524. 2007. View Article : Google Scholar : PubMed/NCBI
|
|
46
|
Ke XX, Zhang D, Zhao H, Hu R, Dong Z, Yang
R, Zhu S, Xia Q, Ding HF and Cui H: Phox2B correlates with MYCN and
is a prognostic marker for neuroblastoma development. Oncol Lett.
9:2507–2514. 2015. View Article : Google Scholar : PubMed/NCBI
|
|
47
|
Bachetti T, Di Paolo D, Di Lascio S,
Mirisola V, Brignole C, Bellotti M, Caffa I, Ferraris C, Fiore M,
Fornasari D, et al: PHOX2B-mediated regulation of ALK expression:
In vitro identification of a functional relationship between two
genes involved in neuroblastoma. PLoS One. 5(pii): e131082010.
View Article : Google Scholar : PubMed/NCBI
|
|
48
|
Desgrosellier JS and Cheresh DA: Integrins
in cancer: Biological implications and therapeutic opportunities.
Nat Rev Cancer. 10:9–22. 2010. View Article : Google Scholar : PubMed/NCBI
|
|
49
|
Judware R and Culp LA: Concomitant
down-regulation of expression of integrin subunits by N-myc in
human neuroblastoma cells: Differential regulation of alpha2,
alpha3 and beta1. Oncogene. 14:1341–1350. 1997. View Article : Google Scholar : PubMed/NCBI
|
|
50
|
Peng H, Ke XX, Hu R, Yang L, Cui H and Wei
Y: Essential role of GATA3 in regulation of differentiation and
cell proliferation in SK-N-SH neuroblastoma cells. Mol Med Rep.
11:881–886. 2015. View Article : Google Scholar : PubMed/NCBI
|
|
51
|
Fischer I, Shea TB, Sapirstein VS and
Kosik KS: Expression and distribution of microtubule-associated
protein 2 (MAP2) in neuroblastoma and primary neuronal cells. Brain
Res. 25:99–109. 1986. View Article : Google Scholar
|
|
52
|
Braekeveldt N, Wigerup C, Gisselsson D,
Mohlin S, Merselius M, Beckman S, Jonson T, Börjesson A, Backman T,
Tadeo I, et al: Neuroblastoma patient-derived orthotopic xenografts
retain metastatic patterns and geno- and phenotypes of patient
tumours. Int J Cancer. 136:E252–E261. 2015. View Article : Google Scholar : PubMed/NCBI
|
|
53
|
Brodeur GM: Neuroblastoma: Biological
insights into a clinical enigma. Nat Rev Cancer. 3:203–216. 2003.
View Article : Google Scholar : PubMed/NCBI
|