Introduction
Spontaneous subarachnoid hemorrhage (SAH) is a
severe cerebrovascular disease with high morbidity and mortality
(1). Although improvements in
treatment strategies have reduced SAH mortality >50% over the
past 20 years, the incidence of SAH has not notably decreased
(2). It has been demonstrated that
85% of spontaneous SAH is caused by intracranial aneurysm (IA)
(3). For IAs, particularly
unruptured IAs, the current treatment methods are few, and since
the balance of risks and benefits varies greatly for each patient,
choices of treatment methods are also difficult to determine
(4).
The incidence of IAs worldwide is 3–5% (1), and its exact pathogenesis remains
unclear. There are numerous risk factors for IA, including genetic
factors, cardiovascular risk factors (including hypertension,
smoking and alcohol), hemodynamics and inflammation of local
vascular smooth muscle cells (VSMCs) and endothelial cells
(5). Genome wide association
studies have demonstrated that single nucleotide polymorphisms of
SRY-box 17 and cyclin dependent kinase inhibitor 2A can increase
the risk of IAs (6). Hypertension
and smoking also have a synergistic effect on the occurrence of IAs
(7). High and low blood vessel
shear force can promote the production of IAs, but the mechanisms
between these differ (8). Almost
all the influencing factors cause inflammation, thus inflammation
performs a decisive role in the occurrence of IAs. Inflammatory
factors eventually cause an imbalance in the repair and destruction
of the extracellular matrix, resulting in the formation of IAs
(9).
Gene expression microarrays can analyze tissue
samples to obtain high-throughput gene expression data, and find
significant differences in gene expression within the aneurysm
tissue as a whole. The gene expression microarray is an important
approach for the study of the pathogenesis of IA. The National
Center of Biotechnology Information Gene Expression Omnibus (GEO)
database provides a large number of gene expression data, which
facilitates the reanalysis of gene expression data by researchers
(10).
Wei et al (11) analyzed Japanese IA data and
identified that CD40, CD40 ligand, and microRNA-125b may be
potential therapeutic targets for IA. Bo et al (12) also analyzed sample data from three
IAs and three STAs, and identified that one cut homeobox 1,
hepatocyte nuclear factor 4α and E2F transcription factor 4 are
important genes in the formation of IAs. The present study analyzed
the dataset GSE75436, which has a large number of samples from
Chinese patients (13).
GSE75436, submitted on November 27th 2015 by Wang
et al (13), comprises gene
expression chip data that have been analyzed with microarray
technology using the Affymetrix Human Genome U133 plus 2.0 Array
GPL570 platforms (Thermo Fisher Scientific, Inc.), including 30
samples. The aneurysm samples were taken from 15 patients diagnosed
with saccular cerebral aneurysms who underwent microsurgical
clipping, and the control group samples (STAs) were from pterional
craniotomies and lateral frontal craniotomies. From a general
perspective, there was no significant difference in gender, age,
hypertension, smoking and alcohol consumption between the aneurysm
group and the control group. However, as Wang et al
(13) was a clinical trial, a
perfect match between the two groups was not easily achieved. In
addition, and despite the rigorousness of the study, gene GO
enrichment analysis, KEGG enrichment analysis and analysis of the
interactions among genes were not completed.
By analyzing the gene expression data of GSE75436,
differentially expressed genes were identified, GO enrichment
analysis conducted, and the Database for Annotation, Visualization,
and Integrated Discovery (DAVID) and gene set enrichment analysis
(GSEA) used for enrichment analysis of the KEGG pathways, prior to
the construction of protein-protein interaction (PPI) networks for
the genes in the common KEGG pathways enriched according to the two
approaches. Key genes in the pathogenesis of IA were identified by
the present study, which will provide a new insight into the
treatment of IA.
Materials and methods
Microarray data and data
preprocessing
The gene expression microarray raw data of GSE75436
was downloaded from the GEO (http://www.ncbi.nlm.nih.gov/geo/) database. Since the
present study used gene expression data downloaded from a public
database, no patient consent or ethics committee approval were
necessary. The raw data were preprocessed by utilizing R software
(version 3.4.4; http://www.R-project.org/). First, the relative
logarithm expression (RLE) box plot and the normalized unscaled
standard errors (NUSE) box plot methods were used to perform
quality control on the raw chip data, and chips with abnormal
expression values were rejected. The robust multichip average (RMA)
normalization method justrma was then used to transform the gene
expression values in all selected chips to a comparable level
through background correction, normalization and aggregation. The
justrma function in the affy package (http://bioconductor.org/packages/affy/) only
standardizes the data of the perfectly matched type probes. The
gene annotation file was downloaded from the official website
(https://www.thermofisher.com/cn/en/home/life-science/microarray-analysis/microarray-data-analysis/genechip-array-annotation-files.html).
Probes without gene annotation or with multiple gene symbols were
rejected. Next, the average expression values of multiple probe IDs
which matched one official gene symbol were calculated, and these
values taken to represent the expression intensity of the
corresponding gene symbol. The effect of the RMA standardization
method was compared by using RLE boxplots and signal intensity
profiles.
Differentially expressed gene (DEG)
screening
By using the ggplot2 package (http://ggplot2.org) in R, a volcano map was plotted to
assess overall gene differential expression. Then, the limma
package was used to select the DEGs. The empirical Bayes moderated
t-test method was used to calculate the P-values of genes. Then,
Benjamini and Hochberg's method (14) was used to calculate the adjusted
P-values [the false discovery rate (FDR)]. Only the genes with
|log2 fold change (FC)|>2 and FDR<0.01 were
considered to be DEGs. Finally, the DEGs were divided into
upregulated and downregulated DEGs.
Heatmap and hierarchical clustering
analysis
The package gplot 2 in R was used to plot the
heatmap and perform the hierarchical clustering analysis. The
heatmap facilitated the comparison of the overall expression of
DEGs in the IA and STA groups. Hierarchical clustering can be used
to group similar elements in a binary tree, and is extensively used
for microarray data analysis.
GO enrichment analysis of DEGs
Functional enrichment analysis of DEGs was performed
using DAVID online tools (version DAVID 6.8; http://david.ncifcrf.gov/). The GO terms were
classified into three categories: Biological process (BP); cellular
component (CC); and molecular function (MF). The upregulated DEGs
and downregulated DEGs were entered separately and P<0.01 was
considered to indicate a statistically significant difference.
KEGG pathway enrichment analysis
KEGG pathway enrichment analysis was separately
performed using DAVID online tools and the GSEA tools (java GSEA
Desktop Application version 3.0; http://software.broadinstitute.org/gsea/downloads.jsp).
Then, the common pathways from the two methods were selected for
the subsequent analysis.
For the DEGs, KEGG pathway enrichment was performed
using DAVID online tools. The upregulated DEGs and downregulated
DEGs were entered separately; P<0.01 and FDR <0.01 were
selected as the cutoff criteria to identify the enriched
pathways.
For the GSEA KEGG pathway enrichment analysis of
DEGs, the RMA normalized gene expression data were entered and the
Kolmogorov-Smirnov test mean of the DEGs was computed in each KEGG
pathway using a permutation test with 1,000 replications. The
significantly enriched pathways were defined by nominal P<0.01
and FDR<0.25.
As GSEA is a comprehensive analysis of all genes,
the amount of information obtained is more complete; and DAVID
allows for pathway analysis of DEGs with more significant
differential expression levels, so the results of the analysis are
more comprehensive. The intersection of the two may prove valuable
for further research. A Venn diagram in InteractiVenn (http://www.interactivenn.net/) was used to show the
common enriched KEGG pathways between the DAVID and GSEA
analyses.
Construction of PPI network
The PPI networks of DEGs in the present study were
constructed using the Search Tool for the Retrieval of Interacting
Genes (STRING; version 10.5; http://string-db.org/cgi/input.pl) database. STRING is
an online tool for predicting PPI information, and can provide a
system-wide view of cellular processes. The DEGs involved in the
common KEGG pathways of the DAVID and GSEA analysis methods were
imported. A confidence score >0.7 was used as the cut-off
criterion. Then, Cytoscape software (version 3.5.1; http://www.cytoscape.org/) was used to construct the
PPI network.
Results
Microarray data and data
preprocessing
The raw data of GSE75436 were downloaded from GEO,
which had 15 IA samples and 15 STA samples. The RLE and NUSE
boxplots indicated that the sample GSM1955170 in the STA group had
abnormal expression values, so it was removed. Following RMA
normalization, all chip data reached comparable levels.
Identification of DEGs
A total of 15 IA samples and 14 STA samples in the
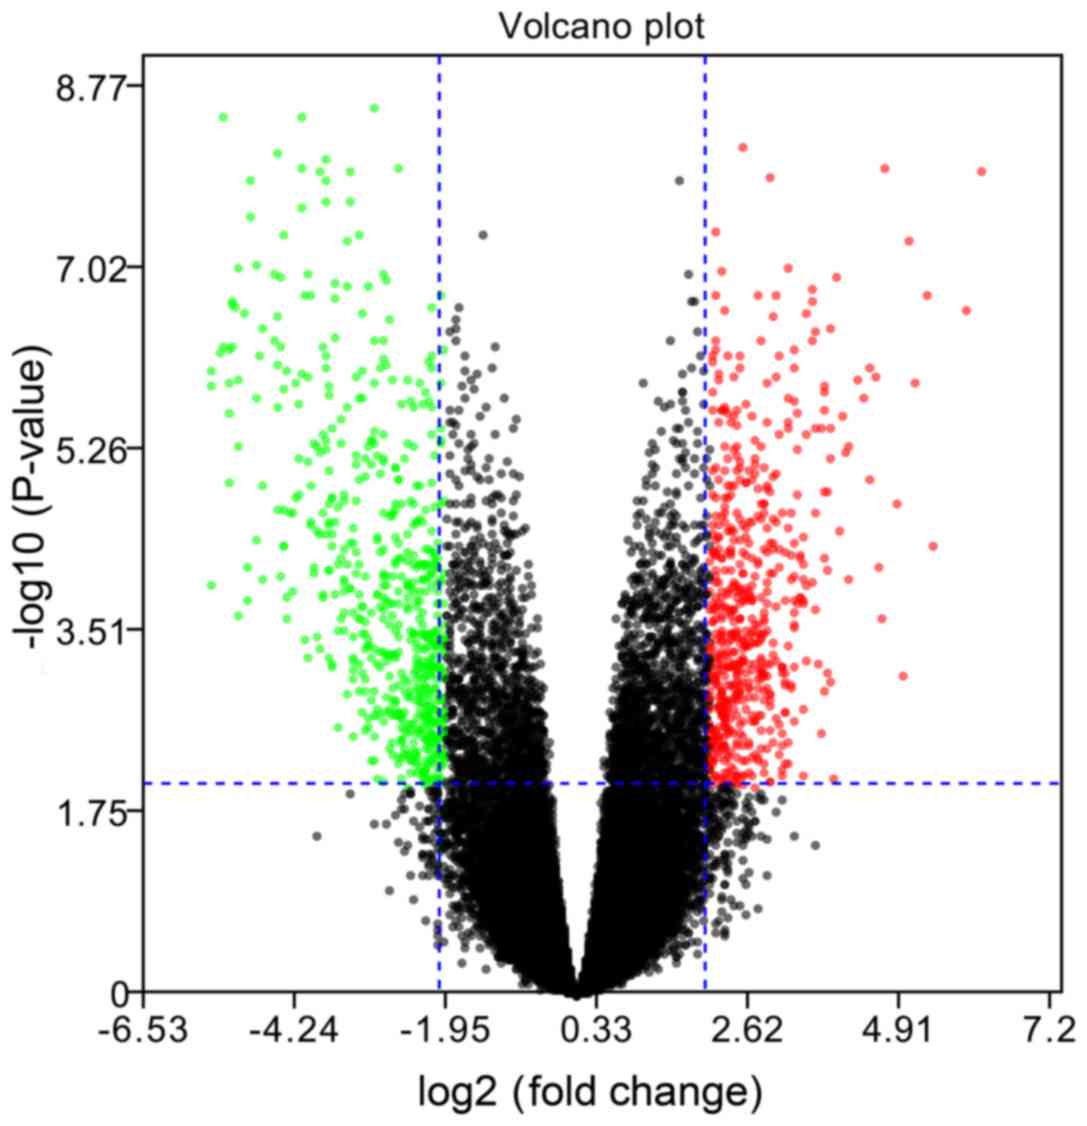
GSE75436 dataset were analyzed. The volcano plot in Fig. 1 demonstrates an overview of the
differential expression of all genes, where the threshold in the
volcano plot was -log10 adjusted P>2 (adjusted
P<0.01) and |log2 FC|>2; the red plots indicate
the upregulated genes and the green plots indicate the
downregulated genes. Then, based on the cut-off criteria (adjusted
P<0.01 and |log2 FC|>2), a total of 782
differentially expressed genes (DEGs) were identified, including
392 upregulated and 390 downregulated DEGs.
There are currently two approaches to the analysis
of DEGs. The first is a combination analysis of all the DEGs; the
advantage of combining them is an analysis from a larger scale
perspective. The second is to analyze the DEGs separately; the
separate analysis emphasizes whether the pathway is activated or
suppressed. It is suggested that DEGs divided into upregulated and
downregulated groups are more suitable for the interpretation of
the latter pathway analysis. Therefore, the separate analysis
method was used. In addition, when PPI analysis was conducted, the
upregulated genes and downregulated genes were analyzed as a whole,
which can also reflect some of the overall interactions between
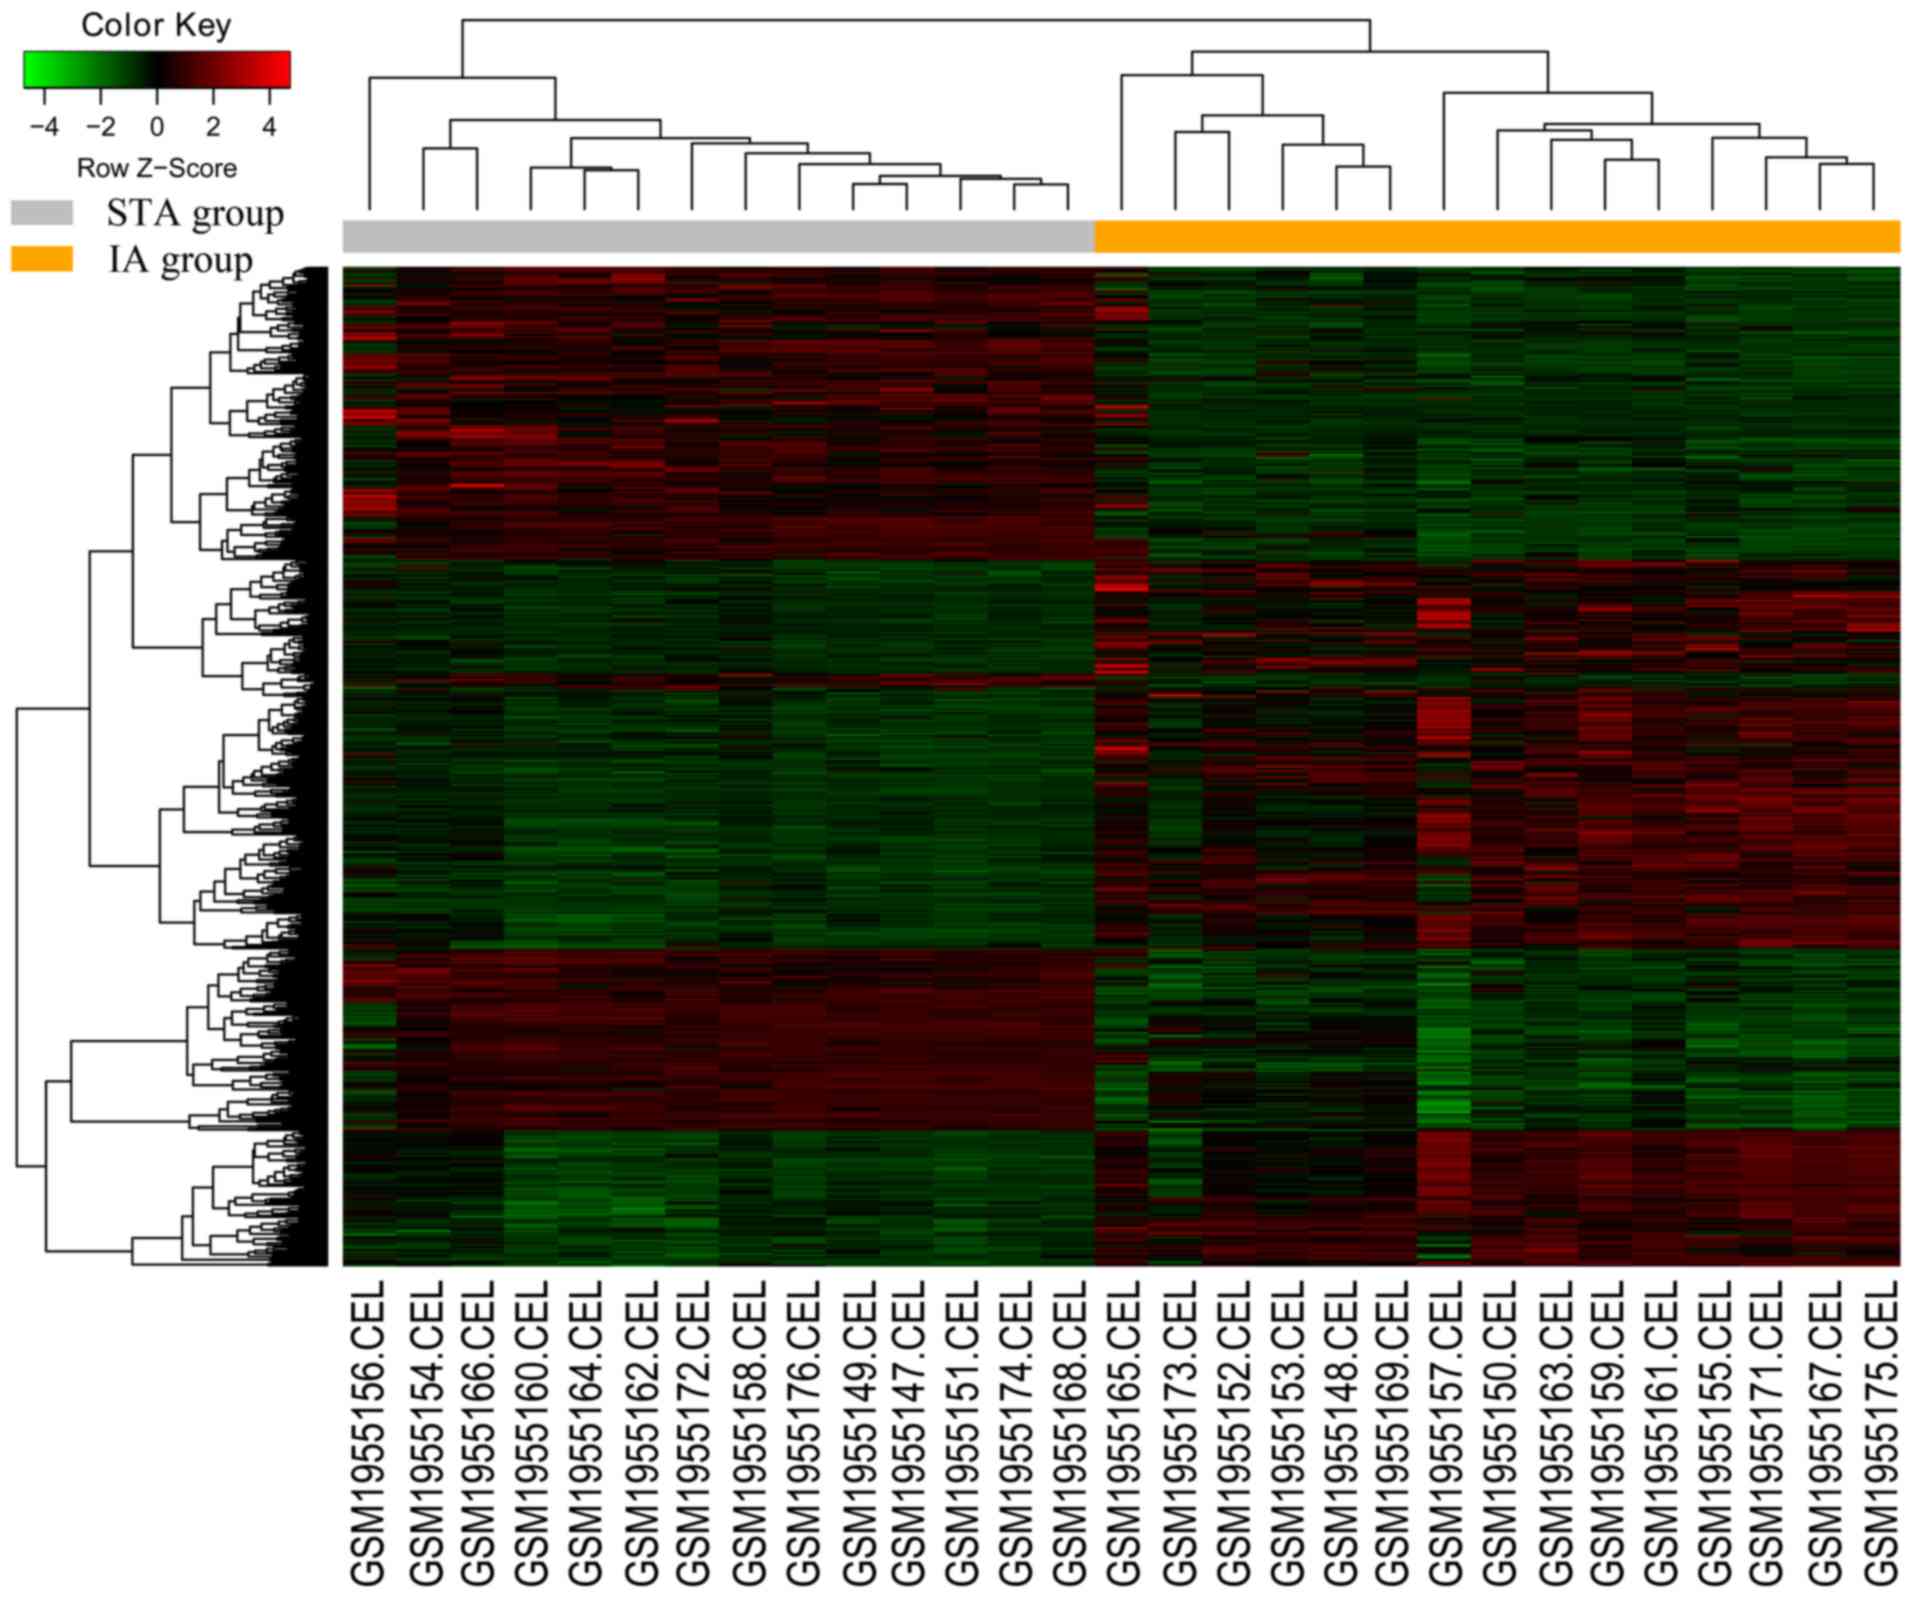
genes. The DEG expression heatmap is presented in Fig. 2, and the hierarchical cluster
analysis of the data demonstrated that the DEGs could be used to
precisely distinguish IA samples from STA samples.
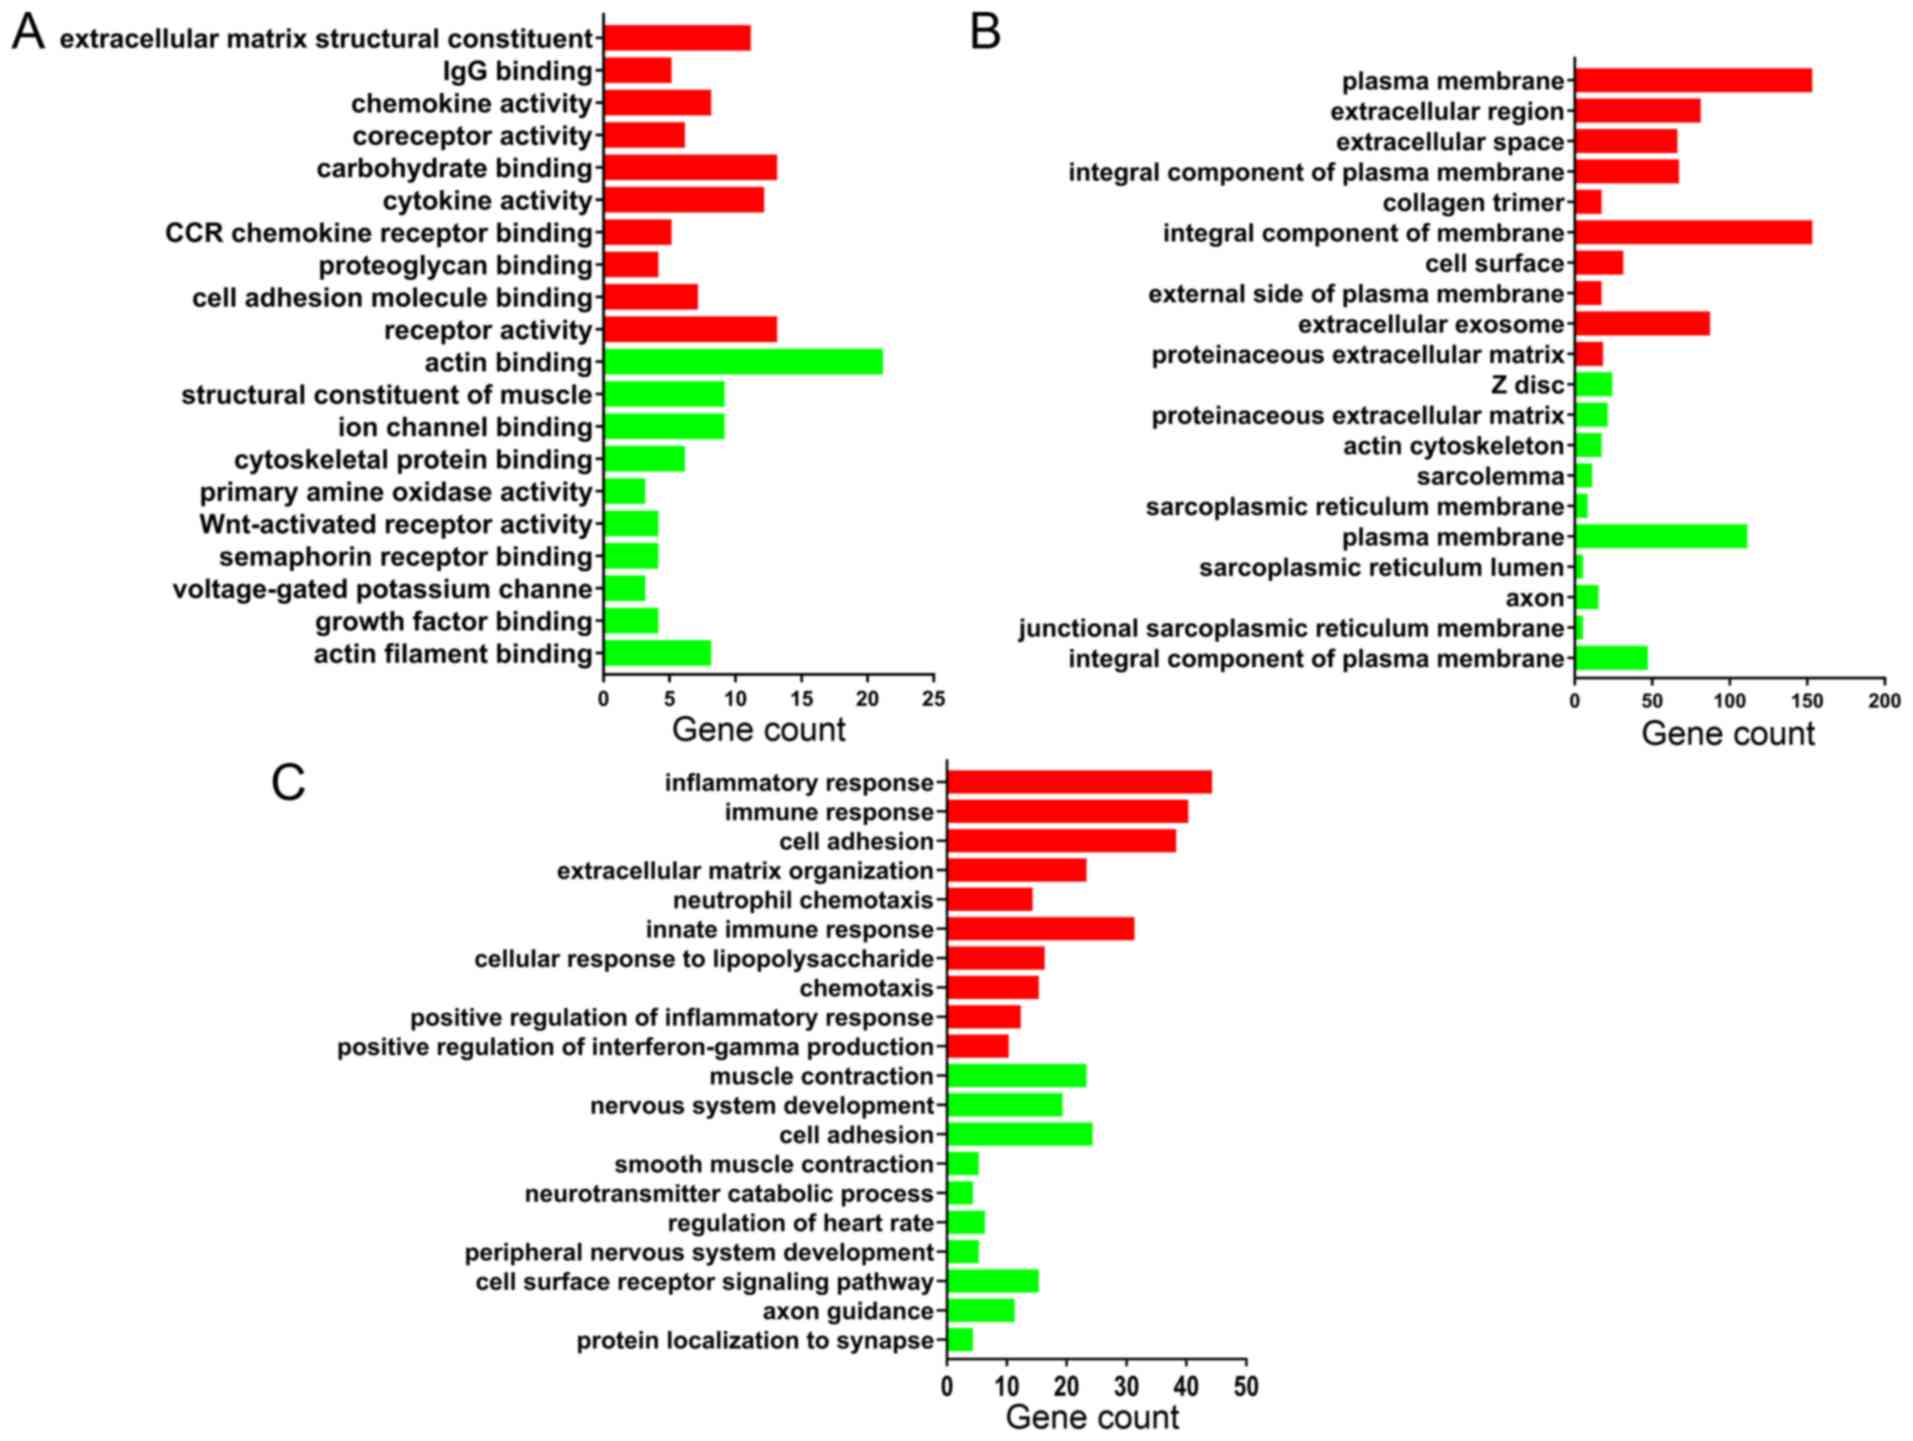
GO enrichment analysis
Functional enrichment analysis of DEGs was performed
using DAVID. The DEGs were categorized into three functional
groups: MF, CC and BP. The GO analysis results in Fig. 3 are the top 10 GO terms of
upregulated and downregulated DEGs sorted by P-value.
According to the MF analysis, the upregulated DEGs
were mainly associated with the construction of extracellular
matrix components and the activation of inflammatory cytokines;
downregulated DEGs were mainly associated with the synthesis of
muscle contraction-related proteins and cytoskeletal proteins. The
detailed results are shown in Fig.
3A.
For the CC analysis, the upregulated DEGs were
mainly located in the plasma membrane and extracellular space;
downregulated DEGs were mainly enriched in the muscle cells
structures, as z disc, actin cytoskeleton, sarcolemma and
sarcoplasmic reticulum membrane. The detailed results are shown in
Fig. 3B.
In the BP, upregulated DEGs were mainly associated
with infection processes, inflammatory responses and extracellular
matrix organization, and downregulated DEGs were mainly associated
with vascular smooth muscle contraction. The detailed results are
shown in Fig. 3C.
In general, the results demonstrated that the
upregulated genes were mainly involved in infection, inflammatory
responses and the management of the extracellular matrix, and the
downregulated genes were mainly involved in the process of muscle
contraction.
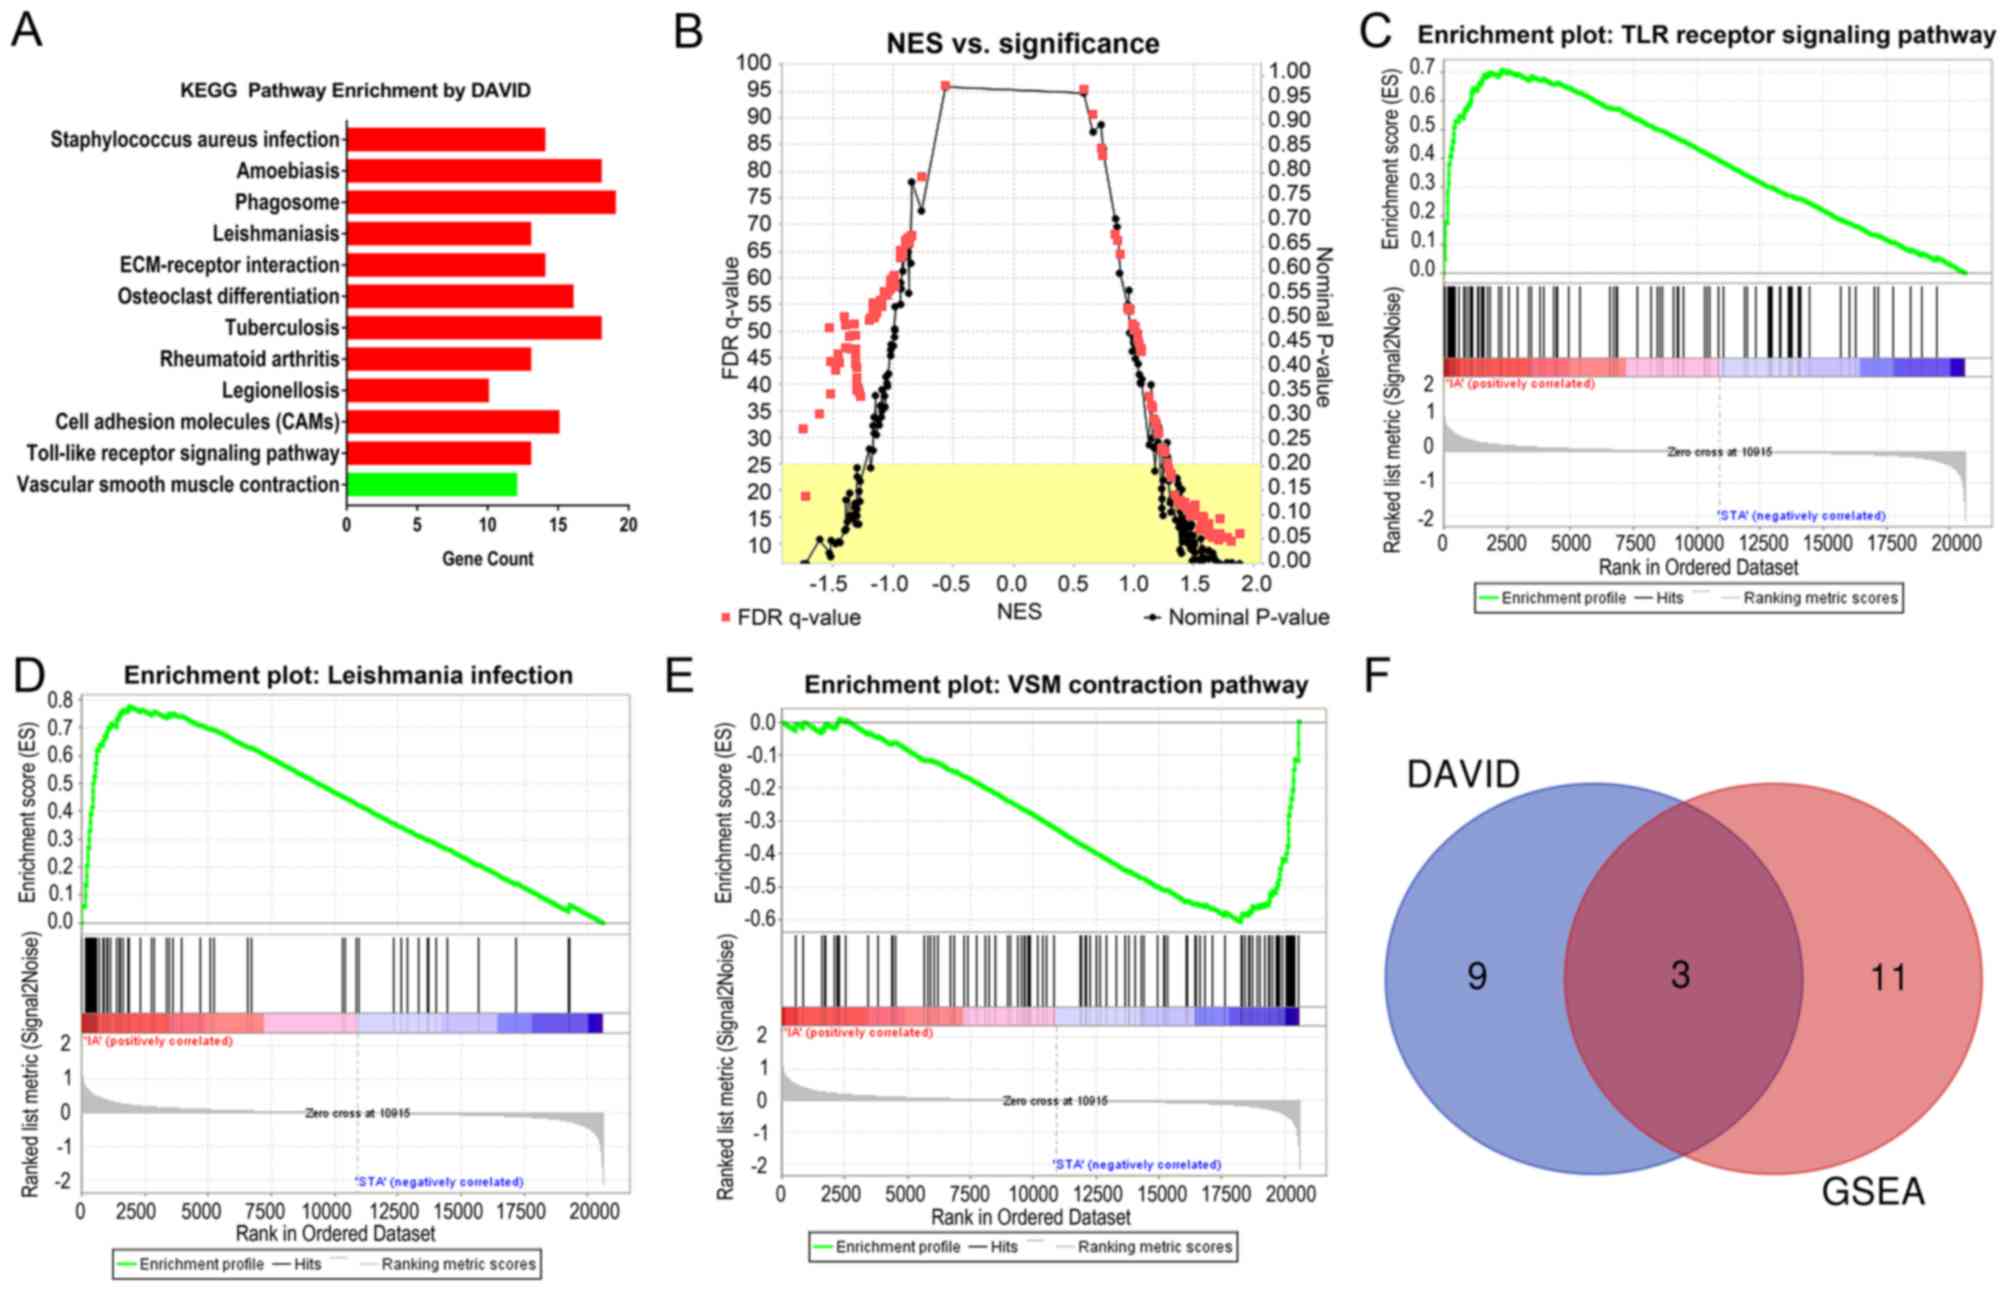
Pathway enrichment analysis
The results of the KEGG pathway analysis using the
DAVID online tools are demonstrated in Fig. 4A. For the upregulated DEGs, 11 KEGG
pathways were enriched according to P<0.01 and FDR<0.01. For
the downregulated DEGs, only one KEGG pathways were enriched
according to the criteria of P<0.01 and FDR<0.01.
The upregulation pathway was mainly associated with
pathways related to various microbial infections, inflammatory
reactions and autoimmune diseases. The downregulated pathway was
‘vascular smooth muscle contraction’.
The KEGG pathway GSEA results are demonstrated in
Table I and Fig. 4B-E. According to the criteria of
nominal P<0.01 and FDR<0.25, there were 13 upregulated
pathways and only one downregulated pathway. Table I demonstrates the detailed results
of the 14 KEGG pathways.
 | Table I.KEGG enrichment analysis results by
GSEA. |
Table I.
KEGG enrichment analysis results by
GSEA.
| Pathway name | Gene number of
pathway | ES | NES | NOM P-value | FDR q-value |
|---|
| Vascular smooth
muscle contraction | 110 | −0.608 | −1.726 | 0 | 0.188 |
| Vibrio cholerae
infection | 50 | 0.566 | 1.879 | 0 | 0.119 |
| Toll like receptor
signaling | 98 | 0.709 | 1.713 | 0 | 0.147 |
| Glycosphingolipid
biosynthesis lacto and neolacto series | 26 | 0.603 | 1.712 | 0 | 0.119 |
| Cytosolic DNA
sensing | 51 | 0.625 | 1.703 | 0 | 0.107 |
| N-glycan
biosynthesis | 42 | 0.660 | 1.813 | 0.002 | 0.105 |
| Amino sugar and
nucleotide sugar metabolism | 44 | 0.629 | 1.775 | 0.002 | 0.111 |
| Leishmania
infection | 62 | 0.779 | 1.554 | 0.004 | 0.127 |
| Intestinal immune
network for IgA production | 45 | 0.757 | 1.572 | 0.006 | 0.145 |
| Colorectal
cancer | 61 | 0.438 | 1.486 | 0.006 | 0.151 |
| Rig I like receptor
signaling | 65 | 0.536 | 1.675 | 0.008 | 0.119 |
| P53 signaling | 64 | 0.547 | 1.573 | 0.008 | 0.153 |
| Chronic myeloid
leukemia | 72 | 0.392 | 1.504 | 0.008 | 0.167 |
| Natural killer cell
mediated cytotoxicity | 129 | 0.635 | 1.621 | 0.010 | 0.127 |
Upregulated pathways were mainly associated with
inflammatory infections, and the downregulated pathway was
primarily responsible for the contraction of vascular smooth
muscles.
The two KEGG pathway analyses identified 11
significantly upregulated and one significantly downregulated
pathway from DAVID, and 13 significantly upregulated and one
significantly downregulated pathway from GSEA. All the KEGG
pathways were compared using both techniques, and this identified
two common upregulated pathways and one common downregulated
pathway, as demonstrated in the Venn plot in Fig. 4F. The upregulated pathways were
‘Toll-like receptor signaling pathway’ and the ‘leishmaniasis’; the
downregulated pathway was ‘vascular smooth muscle contraction’.
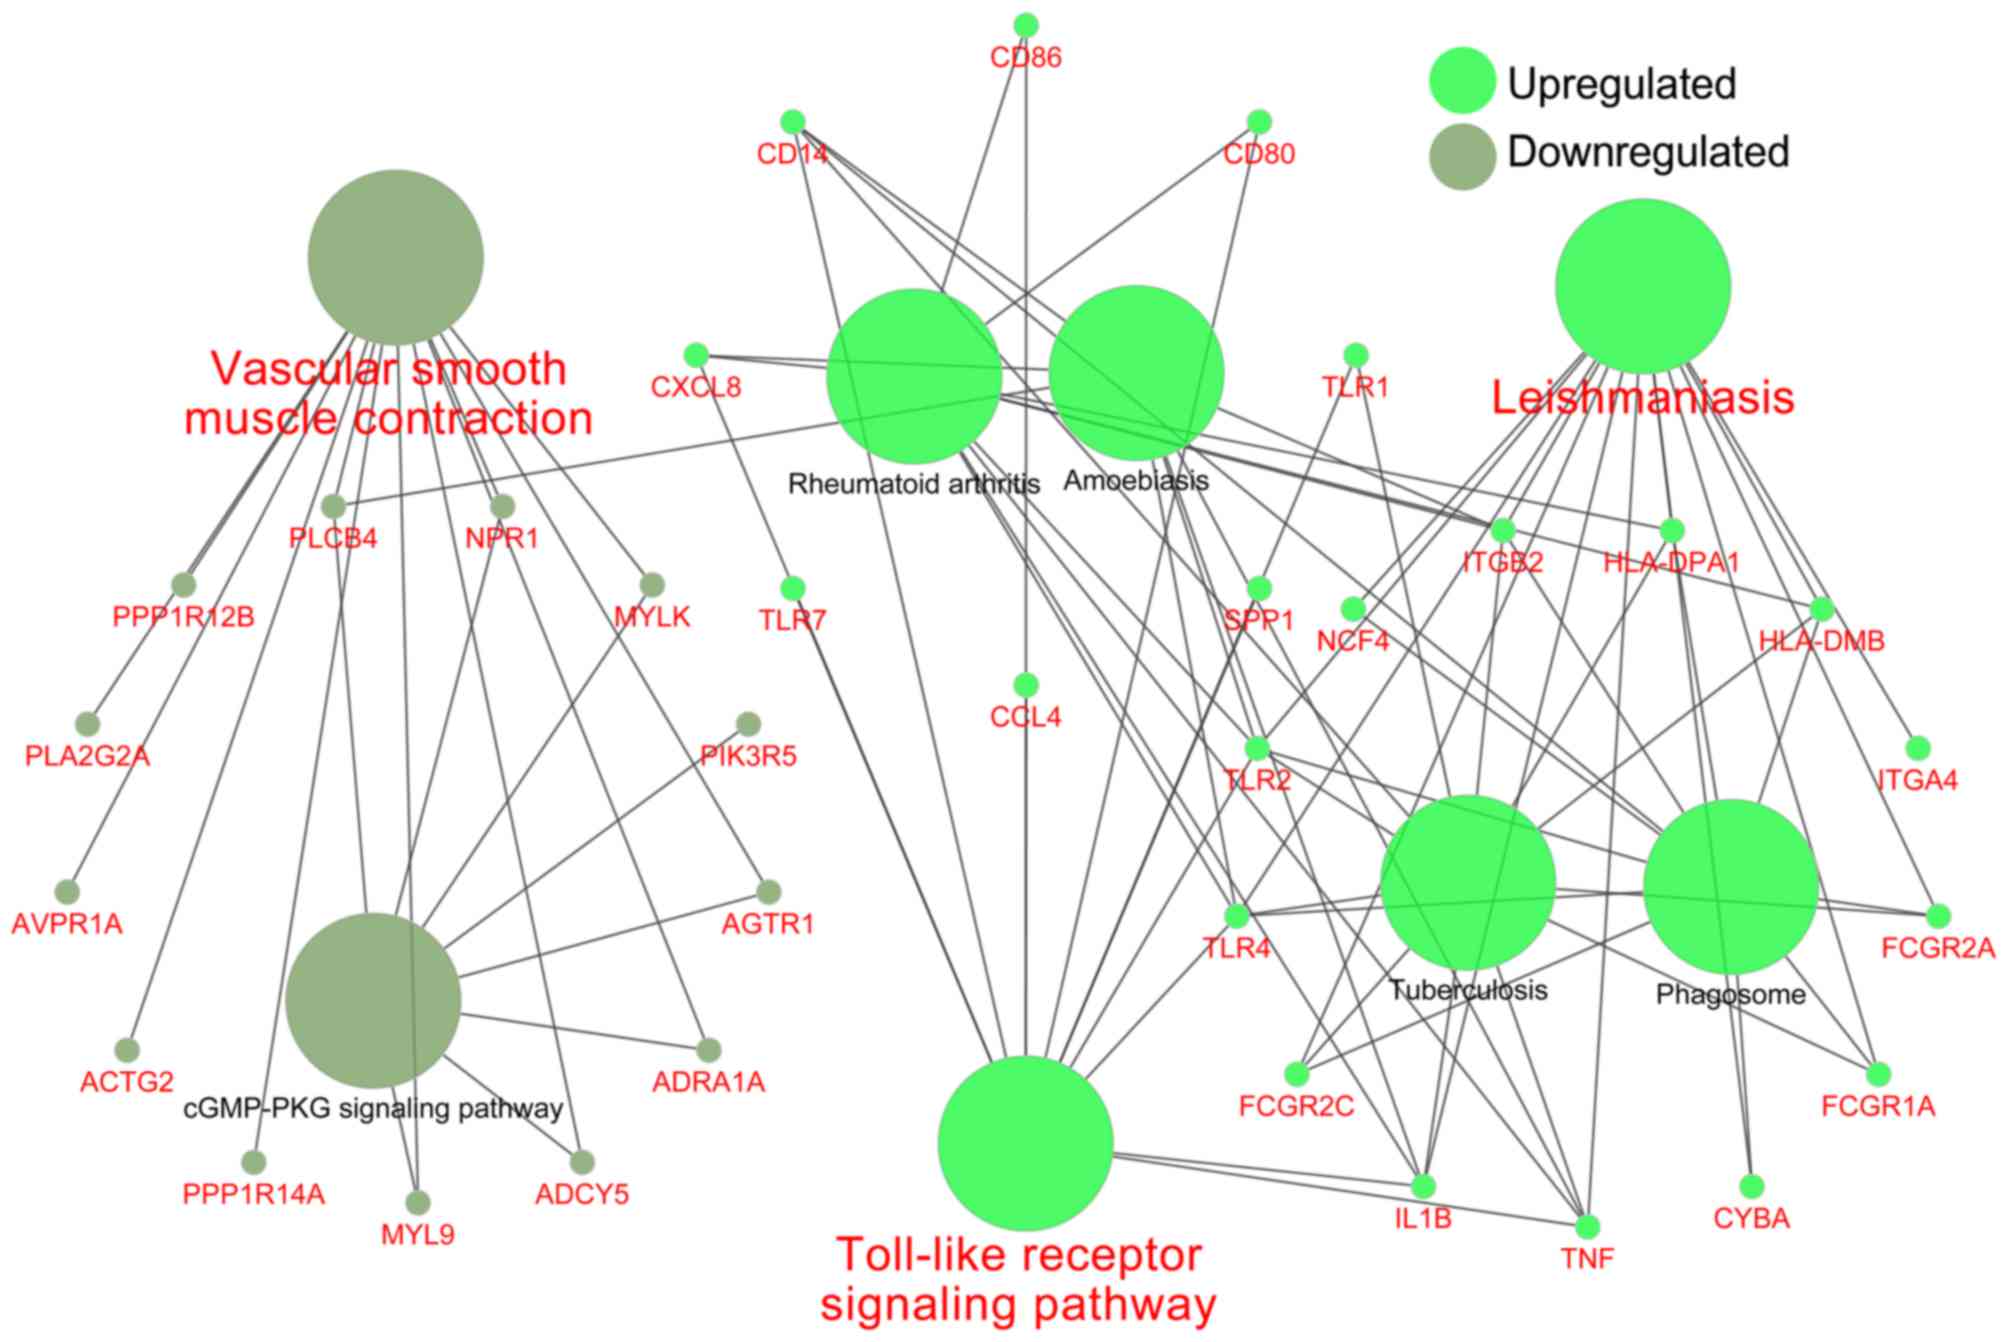
Fig. 5 shows the relationship
between these three important pathways and related pathways and
genes, and it illustrates that the TNF, IL1B, TLR2 and TLR4 genes
were involved in the Leishmania infection pathways and TLR
signaling pathways.
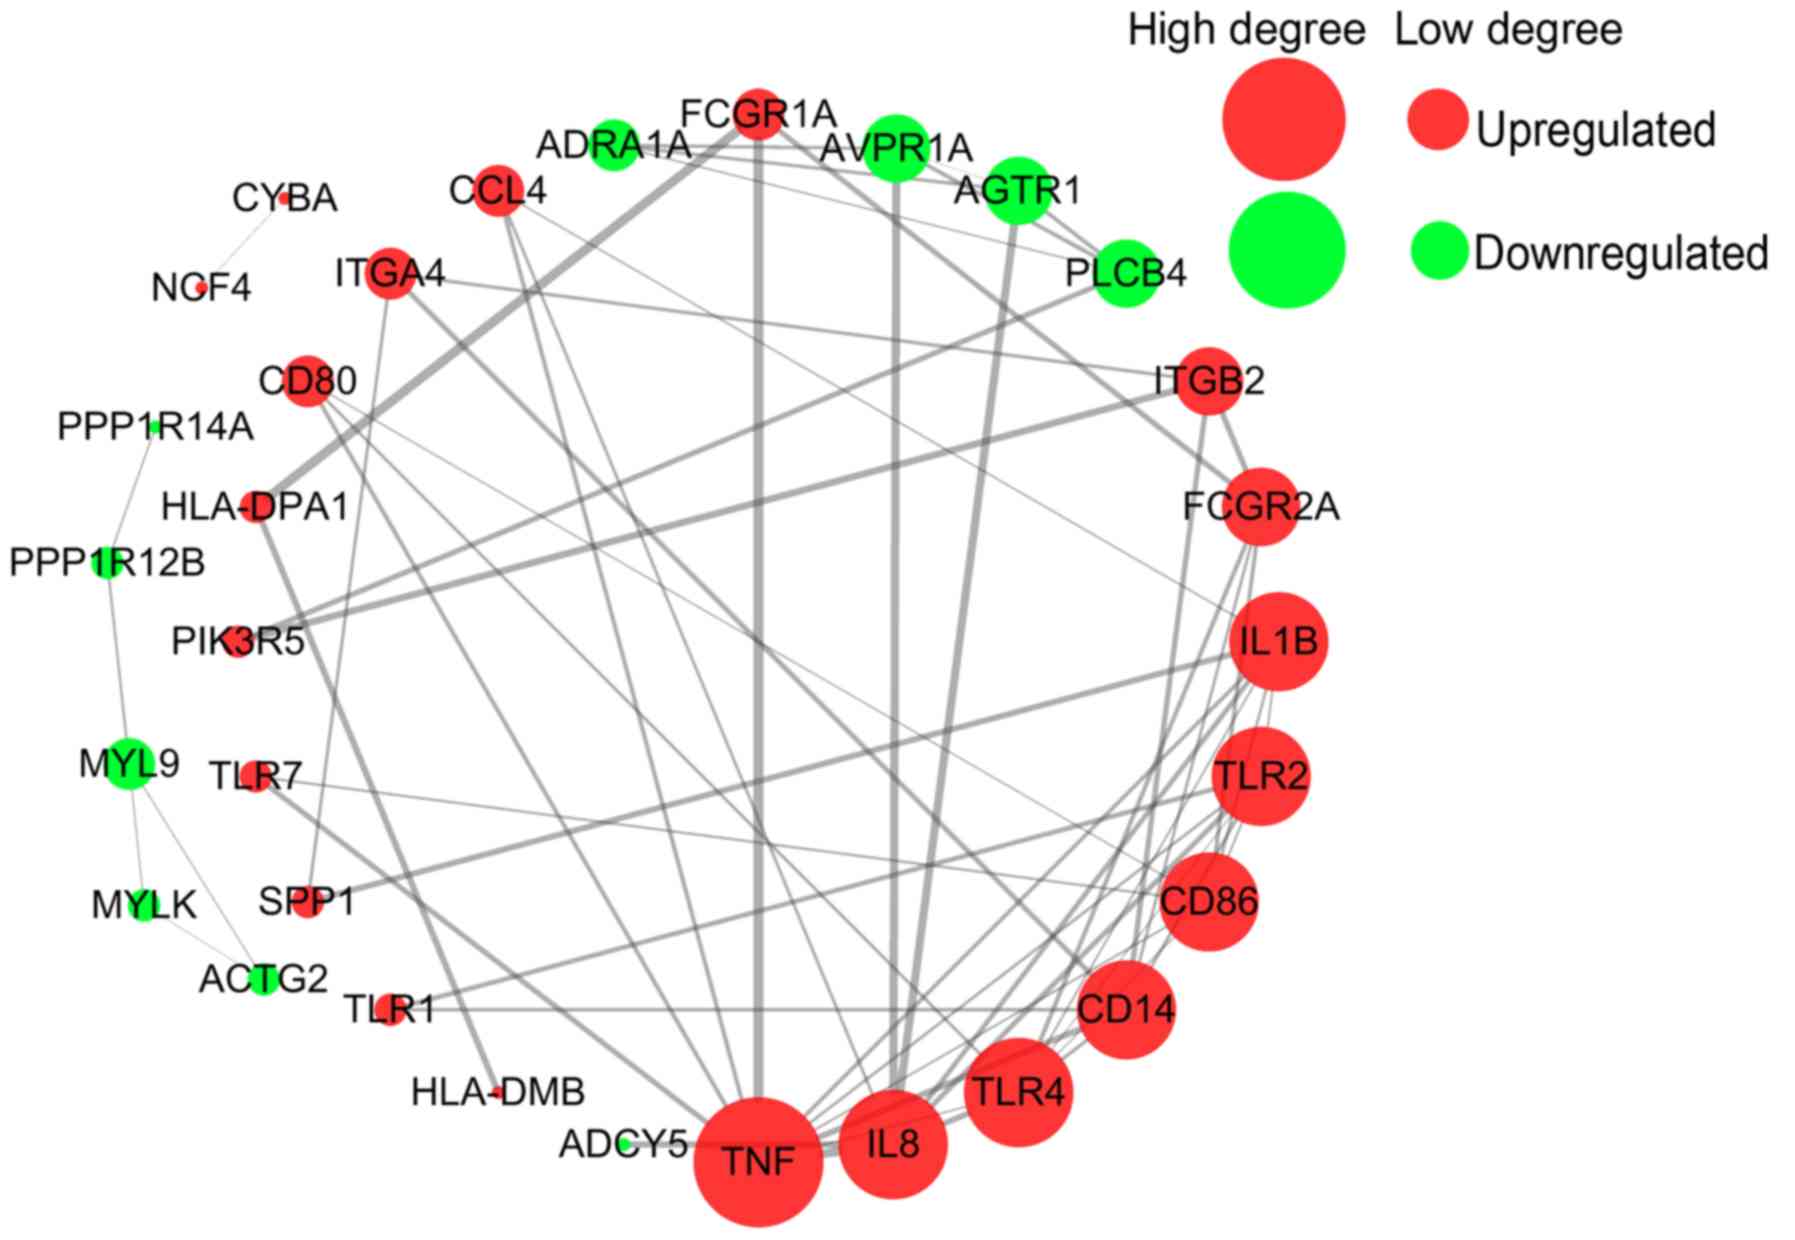
PPI network analysis
All 34 DEGs in the three common pathways were
collected to perform the PPI analysis using STRING. The 34 DEGs
were submitted to the STRING database to predict the protein
interactions. When the interaction score was >0.7, the PPI
network can be formed of 33 nodes and 57 edges. The gene Fc
fragment of IgG receptor IIc could not be identified in the STRING
database. The PPI network is presented in Fig. 6 As can be observed, the majority of
DEGs were upregulated genes. The key points of the network include
the upregulated genes, such as tumor necrosis factor (TNF;
degree=10), interleukin (IL) 8 (degree=8), Toll-like receptor (TLR)
4 (degree=8), and the downregulated genes, such as PLCB4
(degree=4), AGTR1 (degree=4) and AVPR1A (degree=4).
Discussion
In the present study, a total of 782 DEGs were
identified, including 392 upregulated and 390 downregulated DEGs.
GO enrichment analysis demonstrated that the upregulated genes were
mainly located in the plasma membrane and extracellular space,
being involved in receptor activation and the composition of the
extracellular matrix, as well as infection, inflammatory responses
and extracellular matrix organization bioprocesses. Inflammatory
cell infiltration and inflammatory mediators in the wall of IAs
critically weaken the wall and eventually cause its rupture
(15). Extracellular matrix
organization in the vessel walls can degrade elastic and collagen
fibers, causing the occurrence and progression of aneurysms, and
finally leading to vessel rupture (16). The downregulated genes were mainly
located in the vascular muscle cells, and have a pivotal role in
muscle contraction, including as structural constituents of muscle
and in actin binding; the downregulated genes perform an important
role in muscle contraction bioprocesses. Alterations in VSMCs
contribute to the pathogenesis of IAs and activated VSMCs undergo
dedifferentiation characterized by a reduction in contractile and
cytoskeletal gene expression and increased expression of genes
involved in proliferation, migration and matrix remodeling
(17). VSMC phenotypic switching
and inflammation also promotes atherosclerosis, which explains why
numerous atherosclerosis risk factors are also risk factors for IA
(18,19).
The KEGG pathway enrichment analysis in the present
study demonstrated that infection, inflammation and vascular smooth
muscle contraction were the major pathways in IA.
TLRs are a major family of pattern recognition
receptors that perform a key role in innate host defenses, and in
the initiation of adaptive immune responses. TLRs can recognize
conserved molecular structures and products of various
microorganisms. Following ligand recognition, TLRs recruit signal
transducers to initiate pro-inflammatory signaling cascades and
eventually activate several transcription factor families (20). This explains why there were a
number of infection-related pathways in the results of the KEGG
pathway enrichment analysis, since TLR signaling is involved in
these pathways. The role of the TLR pathway is also important in
autoimmune diseases, neuropsychiatric disorders, tumors, myocardial
ischemia-reperfusion injury, atherosclerosis and hypertension
(21–26). In the central nervous system, TLR
signaling in immune cells, glia cells, and neurons may perform a
function in the pathogenesis of stroke, Alzheimer's disease and
multiple sclerosis. TLR also affects the development of the central
nervous system in adults, including neurogenesis, axonal growth and
structural plasticity. TLRs are involved in the regulation of
behaviors including learning and memory as well as anxiety
(27). TLR also performs an
important role in vascular-related diseases. The activation of TLR
signaling pathways can affect vascular function and vascular
remodeling, and the proteins in these TLR signaling pathways can
also activate antigen-specific adaptive immune responses (28). In the present study, TLR4 was
significantly upregulated. It is known that the activation of
TLR4-mediated signaling pathways can determine the activation and
dysregulation of the angiotensin converting enzyme, nitric oxide,
matrix metalloproteinase (MMP) and transforming growth factor
pathways in endothelial cells and VSMCs (29–31).
These pathways are closely associated with endothelial dysfunction,
extracellular matrix remodeling and chronic inflammation, and these
pathological changes can lead to the occurrence of sporadic
thoracic aortic aneurysms (32).
TLR4 may have the same effect in the pathogenesis of IAs. Kurki
et al (33) compared the
whole-genome expression profile of 11 ruptured saccular IA wall
samples with eight unruptured saccular IA wall samples and the
results demonstrated that the TLR pathway was significantly
upregulated, indicating that TLRs play an important role in the
rupture of IAs. Combined with the above findings, the present study
suggested that TLRs may also play an important role in the
formation of IAs. This conclusion requires confirmation by further
experiments.
The association between Leishmania infection
and IAs had not yet been reported, to the best of our knowledge,
but it was identified in the present study that Leishmania
was closely associated with the TLR pathway. The expression of TLR2
and TLR4 in the spleen tissue of Leishmania-infected
patients is increased significantly (34). Leishmania is a genus of
protozoan parasites that live in macrophages. Leishmania
express lipopolysaccharide (LPS), proteoglycans, flagellin and
profilin, so they may be recognized by TLRs expressed in host cells
(35). TLRs recognized
pathogen-associated molecular patterns (PAMPs) and activated innate
immune cells to induce cytokines and co-stimulatory molecules, such
as CD40, and enhance antigen presentation to T cells, which may
eliminate or support pathogens upon activation (36). The recognition of PAMPs by TLRs
leads to different immune responses, attenuating or exacerbating
the Leishmania infection. TLR4 expressed by T cells promotes
the suppressive function of T-reg cells, while TLR6 eliminates its
inhibitory function (37).
Therefore, TLR4 and TLR6 antagonize each other in the regulation of
T-reg cell function. However, LPS, another TLR2 ligand, induces an
anti-inflammatory response. TLR1/TLR2 heterodimers induce a
pro-inflammatory response, whereas TLR2/TLR6 heterodimers induce an
anti-inflammatory response (38,39).
The ‘leaky gut’ hypothesis has been put forward in the study of
neuropsychiatric diseases: Stress leads to increase intestinal
permeability and intestinal bacterial translocation, and
gram-negative bacterial LPS can therefore cause TLR4 activation,
which in turn causes stress and stress-related neuropsychiatric
disorders (40). In the central
nervous system infectious diseases, there is the
‘pathogen-necrosis-autoantigen triplet’ hypothesis: TLRs cause
damage to normal tissues by promoting an immune response to
pathogens, and recognize newly released self-antigens, which become
a direct trigger for TLR-mediated cellular responses to a prolonged
inflammatory response (41). The
above two hypotheses may be summarized as follows: The invasion of
exogenous microorganisms leads to the activation of TLR4, which
further promotes the inflammatory response. Due to the destructive
effect of inflammatory reactions, exposure to autoantigens occurs,
leading to the long-term existence of autoimmune chronic
inflammation. These conclusions are only based on previous research
data. Whether Leishmania infection is associated with IA
requires further research.
Phenotypic changes in VSMCs are an important part of
the pathological process of IA. VSMCs can alter their phenotype
from one primarily associated with contraction to a
pro-inflammatory and matrix remodeling phenotype. This phenotypic
alteration in VSMCs also causes peripheral vascular disease and
atherosclerosis (17). In the
present study, the downregulation of ‘vascular smooth muscle
contraction’ indicated that VSMCs undergo phenotypic changes. The
upregulated gene TNF may induce the phenotypic modulation of
cerebral vascular VSMCs, resulting in the downregulation of
contractile genes, namely myocardin, smooth muscle-α-actin, smooth
muscle myosin heavy chain and smooth muscle 22α, and the
upregulation of pro-inflammatory genes, namely Kruppel like factor
(KLF)4, MMP3, MMP-9, monocyte chemotactic protein 1, vascular cell
adhesion molecule-1 and IL-1β (42). IL-1β was significantly upregulated
in the present study and it can be induced in the early stages of
aneurysm formation in mice, leading to inhibition of collagen
production and promotion of VSMC apoptosis and aneurysm progression
(43). In the early stages
following vascular VSMC phenotypic changes, the synthesis of
collagen and the degradation of the extracellular matrix caused by
MMPs coexist. However, sustained stimulation of inflammatory
factors such as TNF finally results in the loss of all phenotypes
of VSMCs. Eventually, VSMCs progress to apoptotic and necrotic
states (44,45). The loss of VSMCs ultimately leads
to aneurysm rupture (46).
From the PPI network diagram, it can be observed
that TNF was the key node of the PPI network, with the highest
degree value. TNF is an important cytokine, involved in a variety
of diseases. In IA, TNF performs a critical role in the formation
and rupture of aneurysms (47).
The single nucleotide polymorphism of TNF at gene locus −308 G<A
has a significant association with IA and aneurysmal SAH (48). TNF can induce cerebral VSMC
phenotypic modulations through myocardin and KLF4-regulated
pathways, promoting a pro-inflammatory and matrix-remodeling
phenotype of VSMCs, and then promoting the IA formation process
(42). Therapeutic administration
of a TNF-α inhibitor significantly reduces the formation of
aneurysms in rats (49). The
anti-TNF antibody infliximab significantly suppresses TNF-α
activity and reverses phenotypic modulation of VSMCs following
aneurysm induction (50). TNF
could be used as a target for the future treatment of IAs.
In conclusion, the present study suggested that the
TNF gene, TLR signaling pathway and vascular smooth muscle
contraction pathway may be associated with IA, although their
specific role in IA remains to be confirmed by further experiments.
The limitation of the present study was that all the conclusions
were drawn from bioinformatics and analysis of previous
experimental results. These conclusions have yet to be verified by
further studies. In addition, analytical methods such as ingenuity
pathway analysis and WebGestalt were not been applied in the
present study, and the comprehensive use of these analytical
methods may lead to more reliable conclusions. These analytical
methods will be used in future research. GSEA has numerous gene
sets available for analysis, and the main purpose of the present
study was to use GSEA for KEGG pathway analysis. The analysis of
numerous related disease gene sets is extensive and cannot be
completed in a short time. It is hoped this can be performed in
future studies.
Acknowledgements
Not applicable.
Funding
The present study was supported by the Key
Scientific and Technological Project of Hainan Province (grant no.
ZDXM20130066).
Availability of data and materials
The datasets used and/or analyzed during the current
study are available from the corresponding author on reasonable
request.
Authors' contributions
DY conceived and supervised the study. TG performed
the bioinformatics analysis and was a major contributor in writing
the manuscript. DH prepared the figures and edited the manuscript.
All authors read and approved the final manuscript.
Ethics approval and consent to
participate
Not applicable.
Patient consent for publication
Not applicable.
Competing interests
The authors declare that they have no competing
interests.
Glossary
Abbreviations
Abbreviations:
|
BP
|
biological process
|
|
CC
|
cellular component
|
|
DAVID
|
Database for Annotation Visualization
and Integrated Discovery
|
|
DEGs
|
differentially expressed genes
|
|
FDR
|
false discovery rate
|
|
GEO
|
Gene Expression Omnibus
|
|
GO
|
gene ontology
|
|
GSEA
|
gene set enrichment analysis
|
|
IA
|
intracranial aneurysm
|
|
IL
|
interleukin
|
|
KEGG
|
Kyoto Encyclopedia of Genes and
Genomes
|
|
MF
|
molecular function
|
|
MMP
|
matrix metalloproteinase
|
|
NUSE
|
normalized unscaled standard
errors
|
|
PPI
|
protein-protein interaction
|
|
RLE
|
relative logarithm expression
|
|
RMA
|
robust multichip average
|
|
SAH
|
sub arachnoid hemorrhage
|
|
STA
|
superficial temporal artery
|
|
STRING
|
Search Tool for the Retrieval of
Interacting Genes
|
|
TNF
|
tumor necrosis factor
|
|
VSMC
|
vascular smooth muscle cell
|
References
|
1
|
Johnston SC, Selvin S and Gress DR: The
burden, trends, and demographics of mortality from subarachnoid
hemorrhage. Neurology. 50:1413–1418. 1998. View Article : Google Scholar : PubMed/NCBI
|
|
2
|
Lovelock CE, Rinkel GJ and Rothwell PM:
Time trends in outcome of subarachnoid hemorrhage: Population-based
study and systematic review. Neurology. 74:1494–1501. 2010.
View Article : Google Scholar : PubMed/NCBI
|
|
3
|
Macdonald RL and Schweizer TA: Spontaneous
subarachnoid haemorrhage. Lancet. 389:655–666. 2017. View Article : Google Scholar : PubMed/NCBI
|
|
4
|
Etminan N and Rinkel GJ: Cerebral
aneurysms: Cerebral aneurysm guidelines-more guidance needed. Nat
Rev Neurol. 11:490–491. 2015. View Article : Google Scholar : PubMed/NCBI
|
|
5
|
Etminan N and Rinkel GJ: Unruptured
intracranial aneurysms: Development, rupture and preventive
management. Nat Rev Neurol. 12:699–713. 2016. View Article : Google Scholar : PubMed/NCBI
|
|
6
|
Bilguvar K, Yasuno K, Niemela M, Ruigrok
YM, von Und Zu Fraunberg M, van Duijn CM, van den Berg LH, Mane S,
Mason CE, Choi M, et al: Susceptibility loci for intracranial
aneurysm in European and Japanese populations. Nat Genet.
40:1472–1477. 2008. View
Article : Google Scholar : PubMed/NCBI
|
|
7
|
Vlak MH, Rinkel GJ, Greebe P and Algra A:
Independent risk factors for intracranial aneurysms and their joint
effect: A case-control study. Stroke. 44:984–987. 2013. View Article : Google Scholar : PubMed/NCBI
|
|
8
|
Meng H, Tutino VM, Xiang J and Siddiqui A:
High WSS or low WSS? Complex interactions of hemodynamics with
intracranial aneurysm initiation, growth, and rupture: Toward a
unifying hypothesis. AJNR Am J Neuroradiol. 35:1254–1262. 2014.
View Article : Google Scholar : PubMed/NCBI
|
|
9
|
Chalouhi N, Hoh BL and Hasan D: Review of
cerebral aneurysm formation, growth, and rupture. Stroke.
44:3613–3622. 2013. View Article : Google Scholar : PubMed/NCBI
|
|
10
|
Edgar R and Barrett T: NCBI GEO standards
and services for microarray data. Nat Biotechnol. 24:1471–1472.
2006. View Article : Google Scholar : PubMed/NCBI
|
|
11
|
Wei L, Wang Q, Zhang Y, Yang C, Guan H,
Chen Y and Sun Z: Identification of key genes, transcription
factors and microRNAs involved in intracranial aneurysm. Mol Med
Rep. 17:891–897. 2018.PubMed/NCBI
|
|
12
|
Bo L, Wei B, Wang Z, Li C, Gao Z and Miao
Z: Bioinformatic analysis of gene expression profiling of
intracranial aneurysm. Mol Med Rep. 17:3473–3480. 2018.PubMed/NCBI
|
|
13
|
Wang W, Li H, Yu L, Zhao Z, Wang H, Zhang
D, Zhang Y, Lan Q, Wang J and Zhao J: Aberrant expression of
lncRNAs and mRNAs in patients with intracranial aneurysm.
Oncotarget. 8:2477–2484. 2017.PubMed/NCBI
|
|
14
|
Benjamini Y and Yekutieli D: The control
of the false discovery rate in multiple testing under dependency.
Ann Statistics. 29:1165–1188. 2001.
|
|
15
|
Tulamo R, Frosen J, Hernesniemi J and
Niemela M: Inflammatory changes in the aneurysm wall: A review. J
Neurointerv Surg. 2:120–130. 2010. View Article : Google Scholar : PubMed/NCBI
|
|
16
|
van Kuijk JP, Flu WJ, Chonchol M, Bax JJ,
Verhagen HJ and Poldermans D: Metabolic syndrome is an independent
predictor of cardiovascular events in high-risk patients with
occlusive and aneurysmatic peripheral arterial disease.
Atherosclerosis. 210:596–601. 2010. View Article : Google Scholar : PubMed/NCBI
|
|
17
|
Starke RM, Chalouhi N, Ding D, Raper DM,
Mckisic MS, Owens GK, Hasan DM, Medel R and Dumont AS: Vascular
smooth muscle cells in cerebral aneurysm pathogenesis. Transl
Stroke Res. 5:338–346. 2014. View Article : Google Scholar : PubMed/NCBI
|
|
18
|
Bennett MR, Sinha S and Owens GK: Vascular
smooth muscle cells in atherosclerosis. Circ Res. 118:692–702.
2016. View Article : Google Scholar : PubMed/NCBI
|
|
19
|
Lim S and Park S: Role of vascular smooth
muscle cell in the inflammation of atherosclerosis. BMB Rep.
47:1–7. 2014. View Article : Google Scholar : PubMed/NCBI
|
|
20
|
Troutman TD, Bazan JF and Pasare C:
Toll-like receptors, signaling adapters and regulation of the
pro-inflammatory response by PI3K. Cell Cycle. 11:3559–3567. 2012.
View Article : Google Scholar : PubMed/NCBI
|
|
21
|
Cole JE, Kassiteridi C and Monaco C:
Toll-like receptors in atherosclerosis: A ‘Pandora's box’ of
advances and controversies. Trends Pharmacol Sci. 34:629–636. 2013.
View Article : Google Scholar : PubMed/NCBI
|
|
22
|
Garcia Bueno B, Caso JR, Madrigal JL and
Leza JC: Innate immune receptor Toll-like receptor 4 signalling in
neuropsychiatric diseases. Neurosci Biobehav Rev. 64:134–147. 2016.
View Article : Google Scholar : PubMed/NCBI
|
|
23
|
Ha T, Liu L, Kelley J, Kao R, Williams D
and Li C: Toll-like receptors: New players in myocardial
ischemia/reperfusion injury. Antioxid Redox Signal. 15:1875–1893.
2011. View Article : Google Scholar : PubMed/NCBI
|
|
24
|
McCarthy CG, Goulopoulou S, Wenceslau CF,
Spitler K, Matsumoto T and Webb RC: Toll-like receptors and
damage-associated molecular patterns: Novel links between
inflammation and hypertension. Am J Physiol Heart Circ Physiol.
306:H184–H196. 2014. View Article : Google Scholar : PubMed/NCBI
|
|
25
|
Rakoff-Nahoum S and Medzhitov R: Toll-like
receptors and cancer. Nat Rev Cancer. 9:57–63. 2009. View Article : Google Scholar : PubMed/NCBI
|
|
26
|
Subramanian S, Tus K, Li QZ, Wang A, Tian
XH, Zhou J, Liang C, Bartov G, McDaniel LD, Zhou XJ, et al: A Tlr7
translocation accelerates systemic autoimmunity in murine lupus.
Proc Natl Acad Sci USA. 103:9970–9975. 2006. View Article : Google Scholar : PubMed/NCBI
|
|
27
|
Okun E, Griffioen KJ and Mattson MP:
Toll-like receptor signaling in neural plasticity and disease.
Trends Neurosci. 34:269–281. 2011. View Article : Google Scholar : PubMed/NCBI
|
|
28
|
Goulopoulou S, McCarthy CG and Webb RC:
Toll-like receptors in the vascular system: Sensing the dangers
within. Pharmacol Rev. 68:142–167. 2016. View Article : Google Scholar : PubMed/NCBI
|
|
29
|
Gonzalez-Ramos M, Calleros L, Lopez-Ongil
S, Raoch V, Griera M, Rodríguez-Puyol M, de Frutos S and
Rodríguez-Puyol D: HSP70 increases extracellular matrix production
by human vascular smooth muscle through TGF-β1 up-regulation. Int J
Biochem Cell Biol. 45:232–242. 2013. View Article : Google Scholar : PubMed/NCBI
|
|
30
|
Li H, Xu H and Sun B: Lipopolysaccharide
regulates MMP-9 expression through TLR4/NF-κB signaling in human
arterial smooth muscle cells. Mol Med Rep. 6:774–778. 2012.
View Article : Google Scholar : PubMed/NCBI
|
|
31
|
Ruvolo G, Pisano C, Candore G, Lio D,
Palmeri C, Maresi E and Balistreri CR: Can the TLR-4-mediated
signaling pathway be ‘a key inflammatory promoter for sporadic
TAA’? Mediators Inflamm. 2014:3494762014. View Article : Google Scholar : PubMed/NCBI
|
|
32
|
Balistreri CR, Ruvolo G, Lio D and Madonna
R: Toll-like receptor-4 signaling pathway in aorta aging and
diseases: ‘Its double nature’. J Mol Cell Cardiol. 110:38–53. 2017.
View Article : Google Scholar : PubMed/NCBI
|
|
33
|
Kurki MI, Hakkinen SK, Frosen J, Tulamo R,
von und zu Fraunberg M, Wong G, Tromp G, Niemelä M, Hernesniemi J,
Jääskeläinen JE and Ylä-Herttuala S: Upregulated signaling pathways
in ruptured human saccular intracranial aneurysm wall: An emerging
regulative role of Toll-like receptor signaling and nuclear
factor-κB, hypoxia-inducible factor-1A, and ETS transcription
factors. Neurosurgery. 68:1666–1675. 2011. View Article : Google Scholar
|
|
34
|
Kumar R, Singh OP, Gautam S, Nylen S and
Sundar S: Enhanced expression of Toll-like receptors 2 and 4, but
not 9, in spleen tissue from patients with visceral leishmaniasis.
Parasite Immunol. 36:721–725. 2014. View Article : Google Scholar : PubMed/NCBI
|
|
35
|
Chandel HS, Pandey SP, Roy S, Doyen N and
Saha B: TLR-CD40 cross-talk in anti-leishmanial immune response.
Front Immunol. 5:2202014. View Article : Google Scholar : PubMed/NCBI
|
|
36
|
Masopust D and Picker LJ: Hidden memories:
Frontline memory T cells and early pathogen interception. J
Immunol. 188:5811–5817. 2012. View Article : Google Scholar : PubMed/NCBI
|
|
37
|
Jin B, Sun T, Yu XH, Yang YX and Yeo AE:
The effects of TLR activation on T-cell development and
differentiation. Clin Dev Immunol. 2012:8364852012. View Article : Google Scholar : PubMed/NCBI
|
|
38
|
Li J, Lee DS and Madrenas J: Evolving
bacterial envelopes and plasticity of TLR2-dependent responses:
Basic research and translational opportunities. Front Immunol.
4:3472013. View Article : Google Scholar : PubMed/NCBI
|
|
39
|
Netea MG, Sutmuller R, Hermann C, Van der
Graaf CA, Van der Meer JW, van Krieken JH, Hartung T, Adema G and
Kullberg BJ: Toll-like receptor 2 suppresses immunity against
Candida albicans through induction of IL-10 and regulatory T cells.
J Immunol. 172:3712–3718. 2004. View Article : Google Scholar : PubMed/NCBI
|
|
40
|
Garate I, Garcia-Bueno B, Madrigal JL,
Caso JR, Alou L, Gomez-Lus ML, Micó JA and Leza JC: Stress-induced
neuroinflammation: Role of the Toll-like receptor-4 pathway. Biol
Psychiatry. 73:32–43. 2013. View Article : Google Scholar : PubMed/NCBI
|
|
41
|
Esen N and Kielian T: Toll-like receptors
in brain abscess. Curr Top Microbiol Immunol. 336:41–61.
2009.PubMed/NCBI
|
|
42
|
Ali MS, Starke RM, Jabbour PM, Tjoumakaris
SI, Gonzalez LF, Rosenwasser RH, Owens GK, Koch WJ, Greig NH and
Dumont AS: TNF-α induces phenotypic modulation in cerebral vascular
smooth muscle cells: Implications for cerebral aneurysm pathology.
J Cereb Blood Flow Metab. 33:1564–1573. 2013. View Article : Google Scholar : PubMed/NCBI
|
|
43
|
Moriwaki T, Takagi Y, Sadamasa N, Aoki T,
Nozaki K and Hashimoto N: Impaired progression of cerebral
aneurysms in interleukin-1beta-deficient mice. Stroke. 37:900–905.
2006. View Article : Google Scholar : PubMed/NCBI
|
|
44
|
Frosen J, Tulamo R, Paetau A, Laaksamo E,
Korja M, Laakso A, Niemelä M and Hernesniemi J: Saccular
intracranial aneurysm: Pathology and mechanisms. Acta Neuropathol.
123:773–786. 2012. View Article : Google Scholar : PubMed/NCBI
|
|
45
|
Sakaki T, Kohmura E, Kishiguchi T, Yuguchi
T, Yamashita T and Hayakawa T: Loss and apoptosis of smooth muscle
cells in intracranial aneurysms. Studies with in situ DNA end
labeling and antibody against single-stranded DNA. Acta Neurochir
(Wien). 139:469–475. 1997. View Article : Google Scholar : PubMed/NCBI
|
|
46
|
Chalouhi N, Ali MS, Jabbour PM,
Tjoumakaris SI, Gonzalez LF, Rosenwasser RH, Koch WJ and Dumont AS:
Biology of intracranial aneurysms: Role of inflammation. J Cereb
Blood Flow Metab. 32:1659–1676. 2012. View Article : Google Scholar : PubMed/NCBI
|
|
47
|
Starke RM, Chalouhi N, Jabbour PM,
Tjoumakaris SI, Gonzalez LF, Rosenwasser RH, Wada K, Shimada K,
Hasan DM, Greig NH, et al: Critical role of TNF-α in cerebral
aneurysm formation and progression to rupture. J Neuroinflammation.
11:772014. View Article : Google Scholar : PubMed/NCBI
|
|
48
|
Fontanella M, Rainero I, Gallone S, Rubino
E, Fenoglio P, Valfrè W, Garbossa D, Carlino C, Ducati A and
Pinessi L: Tumor necrosis factor-alpha gene and cerebral aneurysms.
Neurosurgery. 60:663–672. 2007. View Article : Google Scholar
|
|
49
|
Yokoi T, Isono T, Saitoh M, Yoshimura Y
and Nozaki K: Suppression of cerebral aneurysm formation in rats by
a tumor necrosis factor-α inhibitor. J Neurosurg. 120:1193–1200.
2014. View Article : Google Scholar : PubMed/NCBI
|
|
50
|
Ali MS, Starke RM, Jabbour P, Tjoumakaris
SI, Gonzalez LF, Rosenwasser RH and Dumont AS: MD184 Infliximab
suppresses TNF-α induced inflammatory phenotype in cerebral
vascular smooth muscle cells: Implications for cerebral aneurysm
formation. Neurosurgery. 60:1812013. View Article : Google Scholar
|